 Cai Jia
 Xudong Wang1
- 1School of Geography and Tourism, Anhui Normal University, Wuhu, China
- 2Anhui Size Technology Co., Ltd., Wuhu, China
- 3SIPSG Information Technology Co., Ltd., Suzhou, China
- 4Academy of Regional and Global Governance, Beijing Foreign Studies University, Beijing, China
This study utilized public transport data from 28 major Chinese cities from 2018 to 2022 and employed methods such as carbon emission measurement, standard deviation ellipse analysis, the Tapio decoupling model, and the LMDI decomposition method to ana-lyse the temporal and spatial evolution, decoupling states, and driving factors of public transport carbon emissions comprehensively. The results show that (1) total carbon emissions fluctuated markedly, and emissions dropped sharply in 2020 due to the COVID-19 pandemic, rebounded in 2021, and declined again in 2022 due to technological upgrades and policies. (2) The spatial distribution of carbon emissions follows a northeastern–southwestern pattern. The center of gravity shifted slowly southwards and slightly west-wards and was influenced by economic development and transportation policies. (3) The 28 cities were classified into four groups: Type I had high emissions but low intensity; Type II exhibited a positive decoupling trend; and Types III and IV showed weak decoupling. (4) Economic activities and line density were the main drivers of emission growth, whereas carbon emission intensity and transportation intensity increasingly inhibited emissions in recent years. On the basis of these findings, we propose differentiated low-carbon transportation policies, regional collaborative governance, and technology optimization to support urban transportation low-carbon transformation under the “dual-carbon” goal.
1 Introduction
With China’s carbon peak and carbon neutrality goals (Li L. et al., 2022) how to effectively control carbon emissions in the context of rapid urbanization and economic growth has become a key issue to be solved in various fields in China (Yan et al., 2023). Transportation is a significant source of carbon emissions, contributing more than 10% of China’s total emissions, with road transport comprising approximately 80% of that share (Li et al., 2023; Zeng and He, 2023). Despite efforts to implement green and low-carbon transportation strategies in major cities (Shang and Lv, 2023), the challenge of balancing increasing transportation demand with carbon emission reduction goals is intensifying. This has led to rising carbon emissions from urban public transport, particularly in densely populated and economically developed cities (Jing et al., 2022). Therefore, in-depth analysis of urban public transportation carbon emissions and their relationship with economic growth can reveal reduction potentials in the transport sector and support the achievement of the “dual-carbon” goal.
Urban public transportation (including rail transit, buses, and cabs) is considered a vital means to alleviate traffic congestion and reduce carbon emissions because of its high energy efficiency and low emissions (Fan et al., 2017). However, cities differ markedly in economic development, population density, and public transportation infrastructure, leading to varied carbon emission profiles and reduction potentials (Bai et al., 2023). For example, first-tier cities (Beijing and Shanghai) present lower per-unit emission intensities despite higher overall emissions driven by strong transportation demand. In contrast, small and medium-sized cities often struggle to balance carbon emissions with economic growth. Therefore, systematically analyzing the spatial-temporal distribution of public transport carbon emissions and their driving factors in major Chinese cities is of significant theoretical and practical value, informing the development of differentiated low-carbon transport policies and the optimization of urban transport structures.
Given the background presented above, this study addresses two core questions:
1) What are the spatial-temporal evolution characteristics of public transportation carbon emissions in major Chinese cities, and how do the emission structures and trends differ among various city types?
2) What is the decoupling status between urban public transportation carbon emissions and economic growth, and what are the primary driving factors behind changes in carbon emissions?
To address these issues, this study uses public transportation data from 28 major Chinese cities (2018–2022) and employs both “top-down” and “bottom-up” carbon emission measurement methods to accurately quantify each city’s emissions. Simultaneously, standard deviation ellipse analysis characterizes the spatial distribution of carbon emissions, the Tapio decoupling model assesses the coordination between emissions and eco-nomic growth, and the LMDI decomposition model identifies the key drivers of emission changes. This multimethod analytical framework comprehensively depicts the spatial-temporal dynamics and driving mechanisms of public transportation carbon emissions, offering data support and a theoretical basis for developing differentiated low-carbon transportation policies.
The innovation of this study is reflected in three aspects. First, the heterogeneity of public transport carbon emissions in major Chinese cities is revealed through a spatio-temporal analysis system, thereby addressing the shortcomings of existing studies in terms of detailed analysis. Second, the study employs a combination of the decoupling model and LMDI decomposition method to analyze the dynamic relationship between carbon emissions and economic growth, as well as its driving factors. This provides a novel perspective on understanding the path of the low-carbon transformation of urban transportation. Finally, as a departure from the focus of previous studies at the national or provincial level, this study focuses on public transportation in major cities. This study fills a gap in the research on spatiotemporal characteristics and driving mechanisms in this field in China. This study provides data support and a theoretical basis for formulating scientific and reasonable low-carbon transportation policies.
2 Literature review
Amid the acceleration of urbanization and the pursuit of the “dual-carbon” goal in China, urban public transportation is increasingly recognized as a key strategy for alleviating traffic congestion and reducing carbon emissions, prompting extensive research on its emission characteristics and influencing factors. In recent years, numerous studies have examined the measurement (Li X. et al., 2022), spatial-temporal distribution (Long et al., 2023), decoupling analysis (Engo, 2019), and driving factor decomposition (Chen et al., 2021) of public transportation, thereby providing a solid theoretical foundation and methodological reference for this study. This paper systematically reviews the relevant literature, summarizes the progress and limitations of existing studies, and elucidates the innovations and theoretical contributions of our work.
The measurement of carbon emissions from public transportation is a crucial re-search foundation, and two main methods—“top-down” and “bottom-up”—are currently employed (Nisbet and Weiss, 2010). The “top-down” approach estimates emissions using macro-level energy consumption data, making it suitable for large-scale analyses (Li et al., 2018; Javanmard et al., 2023), whereas the “bot-tom-up” approach relies on detailed energy consumption and operational data for specific transportation modes, making it ideal for city-level studies (Yu et al., 2020). Recently, hybrid methods have been increasingly adopted to address the diverse nature of urban public transportation. For example, China’s rail transit emissions have been assessed by combining energy consumption and traffic flow data (Pu et al., 2024), whereas urban bus emissions have been quantified using smart card data and vehicle operation records (Zheng et al., 2023). However, most existing studies focus on a single city or a specific transportation mode and lack systematic measurements and comparative analysis of public transportation carbon emissions across major Chinese cities (Sun et al., 2022).
Elucidating the spatial-temporal distribution characteristics of carbon emissions is essential for understanding their evolutionary patterns. The standard deviation ellipse (SDE) method is widely used to analyze the spatial heterogeneity and evolutionary trends of carbon emissions (Duman et al., 2023; Song and Yuan, 2023; Liu and Lv, 2024). Existing studies have employed the SDE method to examine the spatial distribution of provincial carbon emissions in China—revealing an eastward shift in the center of gravity (Wang et al., 2020)—and to characterize the spatial concentration of emissions in urban agglomerations (Luo et al., 2024). However, limited attention has been paid to the spatial-temporal distribution of carbon emissions from urban public transportation, with a notable lack of systematic analysis at the level of major Chinese cities (Zhao et al., 2024).
Decoupling analysis assesses the relationship between environmental pressures and economic growth, and the Tapio decoupling model is widely adopted because of its simplicity and applicability (Wang and Wang, 2021; Liu et al., 2022; Zhang and Sharifi, 2024). In transportation studies, the model is frequently used to analyze the coordination between carbon emissions and economic growth. For example, the Tapio decoupling index has been used to examine the relationship between transportation development and carbon emissions at the provincial level (Hou et al., 2024). Additionally, the index is used to evaluate the decoupling of global economic growth by considering carbon intensity, per capita carbon emissions, and total carbon emissions (Shuai et al., 2019). Thus, exploring the decoupling between carbon emissions and economic growth is highly important. However, most existing studies focus on the transportation industry as a whole, with few ad-dressing the urban public transportation subsector or providing detailed city-level analyses (Song et al., 2019).
LMDI decomposition modelling is a widely used methodology for identifying the key drivers of carbon emission changes (Ang, 2015). In transportation carbon emission studies, LMDI is extensively employed to decompose the effects of technical, economic, and social fac-tors (Fan and Lei, 2016; Liu et al., 2021). For example, the extended LMDI approach has been used to study the factors influencing rail transportation carbon emissions (Wang et al., 2023). Similarly, combining LMDI additive decomposition with Tapio decoupling modelling has been used to explore the driving mechanisms behind carbon emission changes in the European Union (Bianco et al., 2024). Nonetheless, research on the driving mechanisms of urban public transportation carbon emissions re-mains limited, particularly with respect to systematic analyses of major Chinese cities (Luo et al., 2017).
Despite valuable insights from previous studies on urban public transport emissions, three critical gaps remain. First, most research focuses on individual cities or specific modes (e.g., bus or rail), lacking a comprehensive, multi-city perspective to assess regional disparities and aggregated trends across China’s urban network. Second, while the Tapio decoupling model and LMDI decomposition are well established in transport emissions analysis, their combined application to the public transport subsector remains rare. As a result, key emission-reduction drivers—such as changes in ridership, improvements in fleet efficiency, and shifts in the energy mix—are insufficiently quantified. Third, few studies address spatiotemporal heterogeneity at the city level, often overlooking dynamic patterns and local factors that influence emissions over time. Furthermore, existing theoretical frameworks typically treat decoupling and driver analyses in isolation, failing to integrate sustainable mobility perspectives that link operational changes to system resilience and Sustainable Development Goals.
This study addresses these gaps by analyzing 28 major Chinese cities, integrating data from multiple authoritative sources, and developing a comprehensive framework that combines carbon emission metrics, standard deviation ellipse spatial analysis, the Tapio decoupling model, and LMDI decomposition. This approach not only identifies whether and when emissions decouple from economic and ridership growth, but also quantifies the contributions of five drivers: carbon emission intensity, line density, transportation intensity, economic activity, and population scale. The study makes three key contributions: (1) it provides the first systematic cross-city comparison of public transport carbon emissions in China, revealing distinct patterns across city tiers and regions; (2) it establishses a multi-method framework to capture the spatiotemporal dynamics of emissions and their coupling with economic development; (3) it bridges theory and practice by offering empirical evidence to support tailored, region-specific low-carbon transport policies based on identified drivers. Overall, this work advances the theoretical framework for urban transport decarbonization and offers actionable recommendations for policymakers to accelerate China’s transition toward sustainable, low-carbon public mobility.
3 Materials and methods
3.1 Study area
The absence of monitoring data for urban public transport in its early development, combined with the initial operational phase of some cities, results in missing data. Consequently, this study examines 28 major Chinese cities from 2018–2022. All the selected cities had established and were operating urban rail transport systems before 2018, contributing to relatively comprehensive public transport networks. These cities are located in the eastern, central, western, and northeastern regions, making the sample highly representative. Significant differences exist among these cities in terms of economic development, public transport development, energy consumption structures, and carbon emission characteristics. To analyze these differences more precisely, the public transport systems are classified into four types on the basis of transport capacity, following the Standard for the Classification of Urban Public Transportation (Ministry of Construction of the People's Republic of China, 2007) and the evaluation system for city public transportation development performance (General Administration of Quality Supervision, 2017), as detailed in Figure 1.
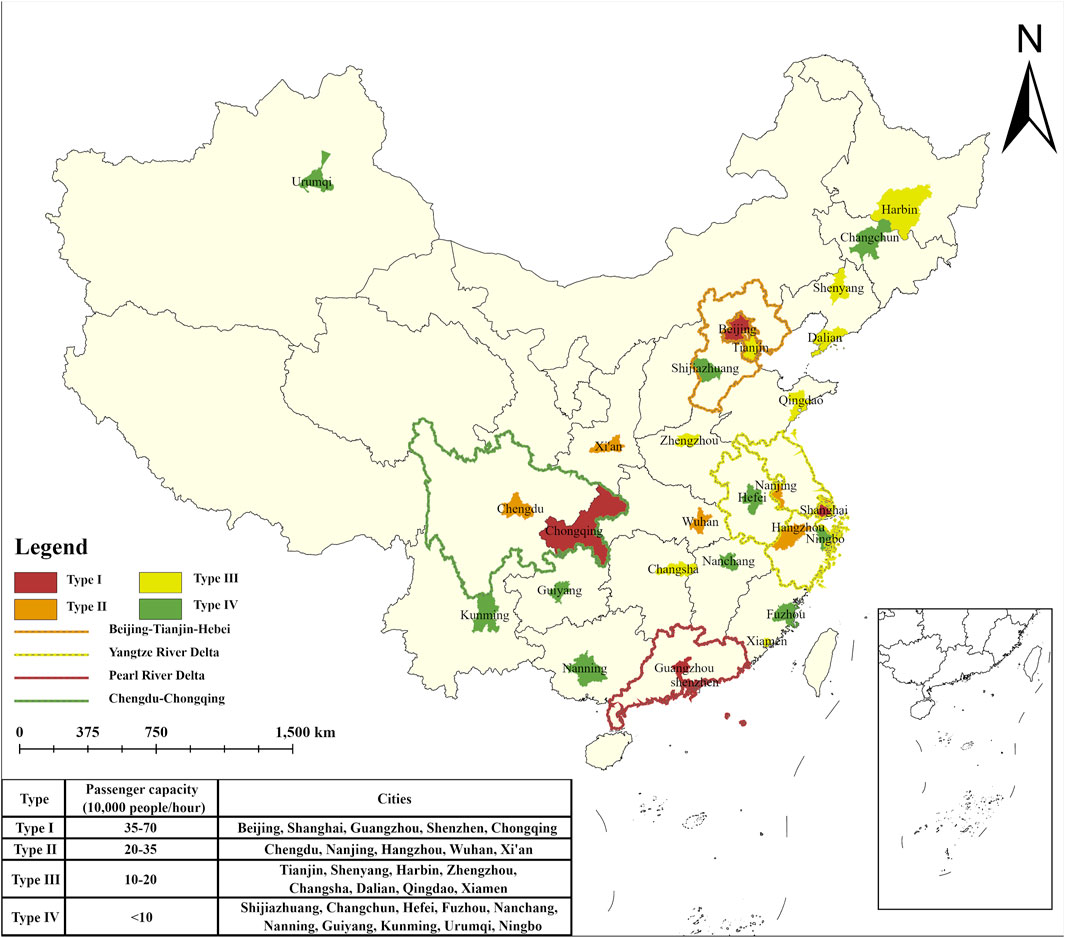
Figure 1. Study area (city classification).
3.2 Study data
This study utilizes data from public transport, socio-economic, and spatial sources. Annual electricity consumption and passenger turnover data for urban rail transit were obtained from the China Urban Rail Transit Association (China Association of Metros, 2023). Annual carbon emission fac-tor data for regional power grids were sourced from the Ministry of Ecology and Environment of the People’s Republic of China (MEE, 2023). Public transport passenger volume data were acquired from the Ministry of Transport of the People’s Republic of China (MOT, 2023). Data on the total length of public transport operating lines were extracted from the China Transportation Yearbook China Communications and Transportation of Association (2024). The per capita per kilometer carbon emission factors for public buses and taxis were derived from a previous study (Jia et al., 2025). GDP and population data were sourced from the National Bureau of Statistics of the People’s Republic of China (NGCC, 2023). Vector map data from the National Center for Basic Geographic Information (STATS, 2003).
3.3 Methods
This section details the methodologies applied in this study: an integrated top-down and bottom-up carbon emission estimation method, spatiotemporal analysis of emissions via standard deviation ellipses, decoupling assessment using the Tapio model, and driver decomposition with the LMDI method. By combining Tapio decoupling with LMDI decomposition, we not only detect whether emissions have decoupled from economic and ridership growth, but also explain why—attributing changes to emission intensity, network density, transportation intensity, economic activity, and population scale. This integration also isolates the temporary COVID-19 shock within the LMDI framework to avoid distorting long-term trends (He et al., 2025). Figure 2 presents the study’s workflow.
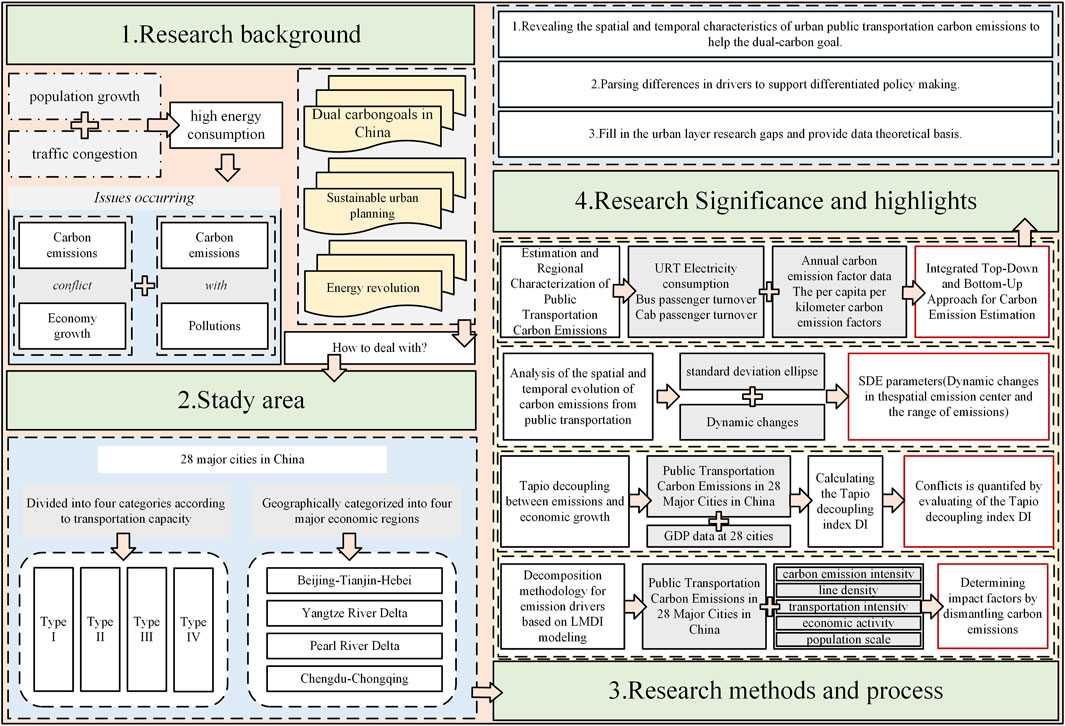
Figure 2. Research Flow Chart.
3.3.1 Integrated top-down and bottom-up approach for carbon emission estimation
In order to comprehensively and accurately assess the carbon emissions of urban public transportation, while taking into account the availability of data, this paper adopts a comprehensive measurement strategy that combines the “top-down” and “bottom-up” approaches.
For urban rail transport, a top-down model is utilized to calculate carbon emissions following the national GHG inventory guidelines (Change, 2007). This model incorporates total electricity consumption and the electricity emission factor, as shown in Equation 1:
Where:
For buses and taxis, a bottom-up approach is employed. This approach is based on passenger kilometers and carbon emissions per passenger per kilometer for each transport mode. The Equation 2 is presented below:
Where:
3.3.2 Spatiotemporal evolution analysis of carbon emissions via standard deviation ellipse
The standard deviation ellipse (SDE) is a statistical method that effectively reveals the spatial distribution characteristics of geographic elements. It quantitatively describes the overall spatial pattern of the research object using parameters such as the center, major axis, minor axis, and azimuth angle. In this study, we calculate SDE parameters for city-level energy-related carbon emissions and interpret their spatial dynamics by comparing results across multiple years (Liu and Lv, 2024). The formulas for calculating these main parameters are presented below:
The coordinates of the mean center are given by Equations 3, 4:
The azimuth is given by Equation 5:
The standard deviation of the x-axis is given by Equation 6:
The standard deviation of the y-axis is given by Equation 7:
Where
3.3.3 Decoupling state assessment of carbon emissions using the tapio model
To investigate the relationship between carbon emissions and economic growth, this study employs the Tapio decoupling model.
Compared with the OECD decoupling index model, the Tapio model is less sensitive to the choice of base period, yields more stable results, and is unaffected by changes in the statistical scale. These advantages enable a more accurate assessment of the decoupling of carbon emissions from economic growth (Yang et al., 2021). The decoupling index (DI), as defined by Tapio, is given by Equation 8:
Where: DI denotes the decoupling index,
On the basis of Tapio’s decoupling index study, eight decoupling types were defined, as shown in Table 1.
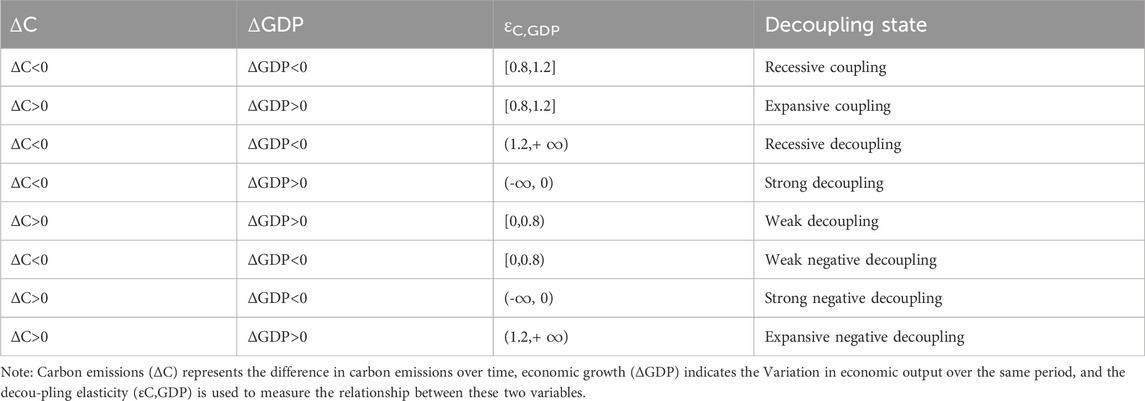
Table 1. Classification of decoupling states based on economic growth and carbon emissions.
Table 1 illustrates the classification of decoupling states between carbon emissions and economic growth, which is divided into three categories: Decoupling, Coupling, and Negative Decoupling. The Decoupling category includes Strong Decoupling, Weak Decoupling, and Recessive Decoupling, indicating that carbon emissions have improved relative to economic growth; the Coupling category comprises Expansive Coupling and Recessive Coupling, indicating that carbon emissions and economic growth change simultaneously at comparable rates; and the Negative Decoupling category consists of Strong Negative Decoupling, Weak Negative Decoupling, and Expansive Negative Decoupling, indicating that carbon emissions have worsened relative to economic growth.
3.3.4 Factor decomposition of carbon emission drivers with LMDI methodology
In this study (Lu et al., 2017; Raza and Lin, 2020), we construct an extended Kaya identity for carbon emissions from urban public transportation, expressed as:
Where C represents the carbon emissions of urban public transportation, L is the total length of public transportation lines, T represents the passenger turnover of urban public transportation, GDP represents the gross domestic product of the city, and P represents the population of the city.
Let

Table 2. Description of the decomposition factors of the LDMI model.
Table 2 lists five decomposition factors used in the LMDI model: carbon emission intensity (CEI = C/L), line density (LDI = L/T), transportation intensity (TRI = T/GDP), economic activity (ECA = GDP/P), and population scale (POP = P). CEI captures CO2 emissions per kilometer of transit line, reflecting vehicle efficiency and the energy mix. LDI measures route length per unit of passenger turnover, isolating the effects of network expansion. TRI indicates passenger–kilometers per unit of GDP, showing how travel demand scales with economic output. ECA represents per capita GDP, linking economic affluence to emissions. POP accounts for population-driven changes in emissions. Together, these factors provide a comprehensive attribution of annual variations in public transport-related CO2 emissions.
The extended Kaya identity can be further decomposed using the LMDI as:
where
4 Results
4.1 Carbon emission trends and distribution of public transportation in major cities in China
According to Section 3.3.1, the assessment of carbon emissions from public transportation in major Chinese cities between 2018 and 2022 reveals a clearly fluctuating trend in total emissions. Specifically, total carbon emissions were 39.848 million tons in 2018 and increased slightly to 41.212 million tons in 2019, a rise of approximately 3.4%. However, emissions fell to 29.243 million tons in 2020—a decrease of 29.1%—due to the COVID-19 pandemic, which severely impacted travel demand. In 2021, emissions rebounded to 33.238 million tons, an increase of 13.6%, as economic activity gradually recovered. Nevertheless, emissions drop sharply again to 21.959 million tons in 2022, a decrease of 33.9%. Figure 3 illustrates the changes in carbon emissions from public transportation and specific bus services in each city.
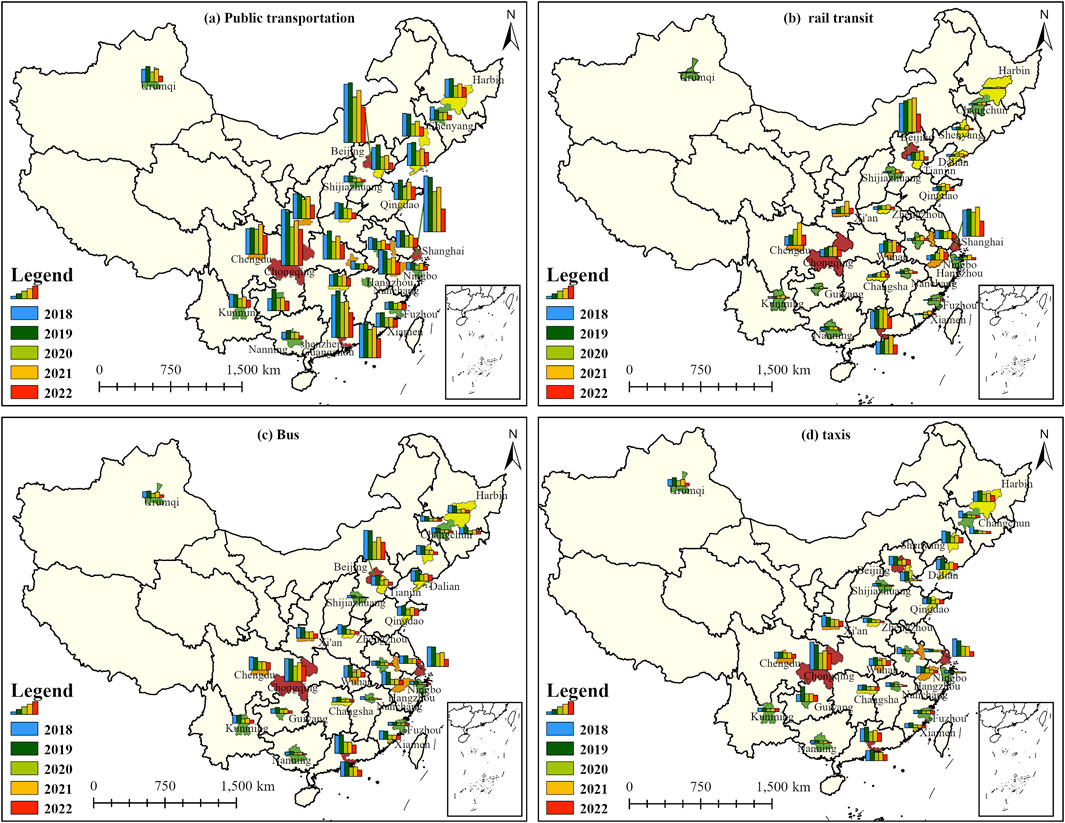
Figure 3. Carbon Emissions from Public Transportation in Major Chinese Cities. (a) Public Transport; (b) Rail Transit; (c) Bus; (d) Taxi.
Among various segments, carbon emissions from urban rail transit increased from 7.470 million tons in 2018 to 11.388 million tons in 2021, with an average annual growth rate of approximately 15.2%. This rise reflects the expanded scale of construction and operation of urban rail transit and its greater share in the public transportation system. However, in 2022, emissions from this segment decreased sharply to 5.857 million tons, a reduction of 48.5% from the previous year. This notable decline may be attributed to fac-tors such as reduced passenger flow due to epidemics, adjusted operating frequency, or increased energy efficiency.
Carbon emissions from buses exhibit significant fluctuations. In 2018, emissions were 17.996 million tons, decreasing slightly to 17.803 million tons in 2019. Owing to the epidemic, emissions dropped sharply to 10.648 million tons in 2020, and then rebounded to 11.839 million tons in 2021, before decreasing again to 8.594 million tons in 2022. These fluctuations are likely influenced by both the epidemic and technological advancements, such as the increasing adoption of electric buses.
Carbon emissions from cabs increased from 14.383 million tons in 2018 to 14.692 million tons in 2019, then decreased to 9.333 million tons in 2020, rebounded to 10.012 million tons in 2021, and subsequently declined to 7.573 million tons in 2022. This trend, mirroring that of buses, underscores the substantial impact of the epidemic on short-distance travel and subsequent operational adjustments.
Analysis results based on the standard deviation ellipse (SDE) method (as shown in Figure 4) show that 2018–2022. The spatial pattern of public transportation carbon emissions in China’s major cities consistently exhibited a clear northeast-southwest orientation during the period 2018–2022. This directional trend reflects the central role of the eastern coastal and central economic hubs, as well as the structural backbone of the national transportation network. It highlights the lasting influence of historical urban layouts and urbanization patterns on the spatial distribution of emissions. While the orientation of the primary and secondary axes of the ellipse has remained relatively stable, its spatial coverage has expanded year by year. The area of the ellipse increased steadily, reaching its maximum in 2022 from a minimum in 2018. This trend aligns closely with the continued expansion of public transportation networks and the broader process of urbanization. It also provides a quantitative basis for assessing the impact of transportation infrastructure development on the spatial diffusion of carbon emissions across regions.
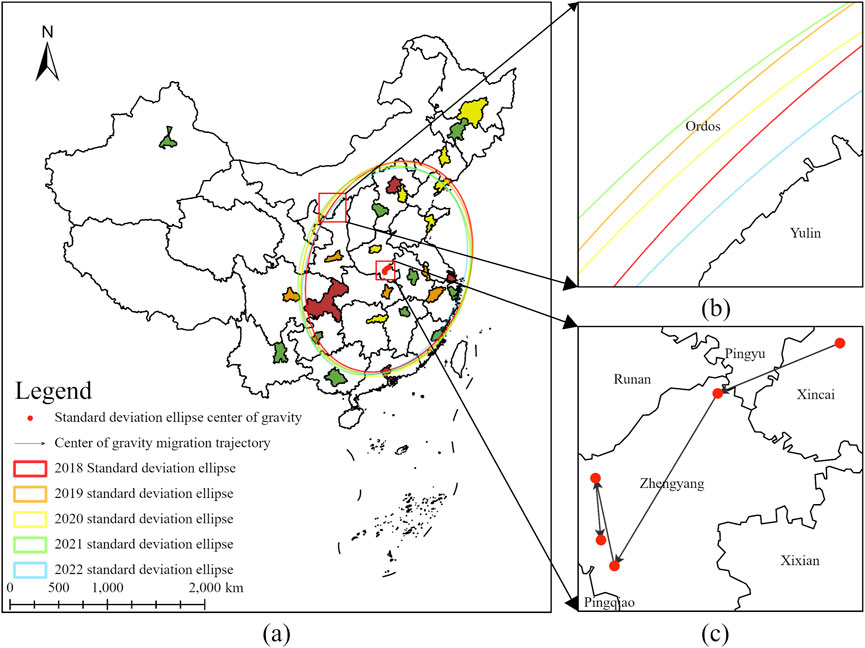
Figure 4. Carbon Emission Standard Deviation Ellipse Parameters for Public Transportation in Major Chinese Cities: (a) Overall Schematic; (b) Local Ellipse Variation; (c) Trajectory Variation of the Ellipse Center of Gravity.
At the annual level, the major axis of the ellipse lengthened significantly and the center of mass shifted southward between 2018 and 2019, indicating that the rapid increase in carbon emissions from southern urban agglomerations may have resulted from higher public transportation ridership and commissioning of new rail transit lines. Between 2020 and 2021, the minor axis of the ellipse extended, rotated slightly, and the center of mass shifted westward, reflecting the expansion of transportation infrastructure and rising emissions in western regions, likely driven by regional development policies aimed at spatial equity. From 2021 to 2022, the growth rate of the ellipse area slowed down markedly, and the center of mass became more stable, suggesting that the national public transportation network is approaching maturity. This trend may also reflect the initial impact of environmental protection policies, such as the promotion of new energy vehicles. However, the center of mass continued to exhibit a slight southwestward shift, implying that the emission increases in western and southern regions have not yet been fully mitigated. These findings suggest that future emission-reduction strategies should be tailored to regional conditions, considering network saturation, energy structure, and the pace of policy implementation.
4.2 Carbon emissions from public transportation in different categories of cities and regions
This study systematically explores the spatiotemporal heterogeneity and regional distribution patterns of carbon emissions from public transportation across different cities. Using panel data from 2018 to 2022, we analyze carbon emission dynamics across four city tiers (Types I-IV) and four economic zones: Beijing-Tianjin-Hebei, Yangtze River Delta, Pearl River Delta, Chengdu-Chongqing, and others (Figure 5). Through multi-scale analysis of total emissions, structural shares, and spatial distribution, we assess how urban development stages and governance effectiveness influence emission reduction strategies.
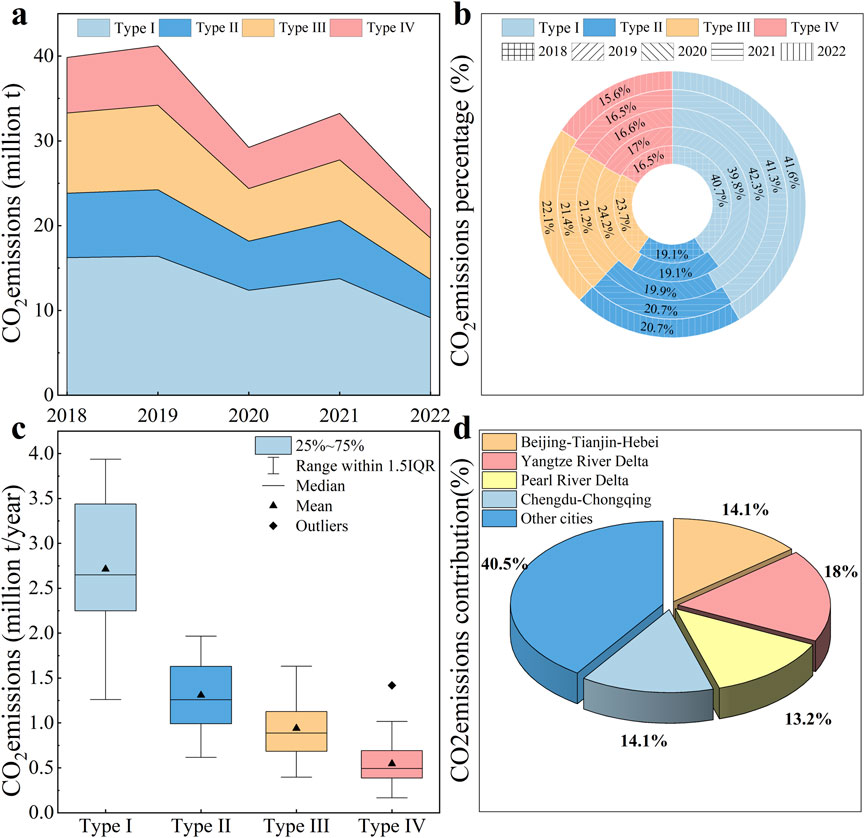
Figure 5. Carbon emissions characteristics of public transportation across city tiers and economic zones. (a) Total emissions by city tier; (b) Emission shares by city tier; (c) Spatial distribution of emissions by city tier; (d) Emission shares by economic zone.
4.2.1 City-level carbon emission structure
Type I cities dominate carbon emissions, contributing an average of 41.1% annually (Figures 5a,b). Megacities such as Shanghai and Beijing, with peak emissions of 16.388 and 16.218 million tons in 2019, respectively, exhibit a high carbon lock-in effect due to expanding rail networks and rigid growth in surface transportation demand. Type II cities maintain a stable carbon emission share of 19%–21%, yet achieve emission levels comparable to or higher than those of Type III and IV cities despite fewer urban centers. Type III and IV cities collectively account for approximately 40% of total emissions, indicating consistent relative contributions despite national fluctuations.
4.2.2 Spatial distribution and regional synergy
Boxplots of carbon emissions from 2018 to 2022 (Figure 3c) reveal significant tier-based differences and dynamic trends across city classes. Type I cities show the highest emissions with an anomalous dip, which is likely due to the epidemic. Type II cities follow with more uniform data distribution, whereas Type III and IV cities exhibit progressively lower emissions. An anomalous low in Type III suggests localized emission reduction efforts or data variability. Regionally (Figure 3d), the Yangtze River Delta leads in emissions due to its advanced public transportation network. The Beijing-Tianjin-Hebei region contributes 14%, but its high electricity emission factor highlights reliance on coal-fired power. The Chengdu-Chongqing Economic Circle’s share rose from 13% to 17%, driven by increased cross-city commuting, which exposed gaps in regional transportation coordination.
4.3 Current status of decoupling carbon emissions from urban public transportation systems
The decoupling index quantifies the relationship between public transportation carbon emissions and economic growth. An analysis of the decoupling indices and statuses from 2018 to 2022 across 28 cities reveals a complex decoupling pattern, as illustrated in Figure 6.
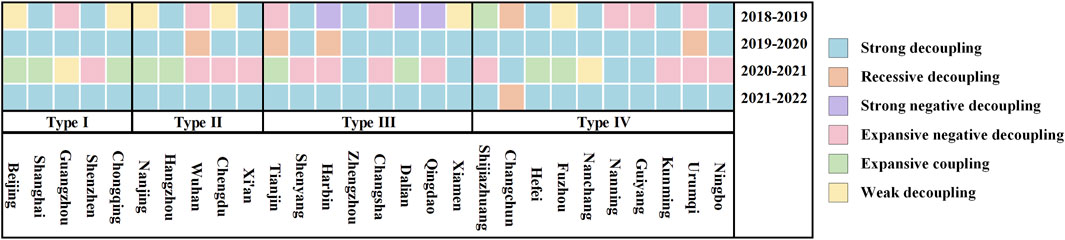
Figure 6. Decoupling Analysis of Public Transportation Carbon Emissions in Major Chinese Cities (2018–2022).
From 2018 to 2019, the decoupling patterns of Type I cities show diversified characteristics: Shanghai and Chongqing achieve SD, indicating a reduction in environmental pressures along with economic growth; Beijing and Shenzhen show WD, where emissions increase but at a slower rate than economic growth; however, Guangzhou shows END, indicating that emissions accompany economic growth significantly rising. During 2019–2020, Type I cities generally shifted to RD due to the decline in passenger traffic caused by the epidemic, although economic activities remained stable. Subsequently, during 2020–2021, these cities exhibited END, EC, WD, suggesting that—with the exception of Shenzhen—other cities did not experience increased environmental loads amid economic growth. By 2021–2022, all Type I cities return to SD, showing synchronized economic and environmental progress.
The decoupling trend is more stable for Type II cities. During 2018–2019, they mainly show SD, WD and END. In 2019–2020, most cities shift to SD, with Wuhan experiencing a double decline in economic activity and emissions due to the epidemic, but the environmental improvement is smaller than that of the recession. Between 2020–2021, Type II cities show END and EC, reflecting the increased environmental pressures that come with economic growth. By 2021–2022, all Type II cities achieve SD.
Type III cities show a complex pattern of decoupling during 2018–2019, with some showing SND, where environmental pressures rise instead of declining, highlighting the mismatch between economic performance and environmental improvement; others show mixed changes in environmental loads in response to economic growth. In 2019–2020, they mainly exhibit SD and RD, with significant differences between cities. During 2020–2021, SD, END and EC are presented. By 2021–2022, all Type III cities return to SD.
The overall level of decoupling is lower for Type IV cities. During 2018–2019, they exhibit a variety of states including SD, RD, EC and END. In 2019–2020, SD and RD dominate. During 2020–2021, the decoupling status is as complex as in 2018–2019. By 2021–2022, they revert to SD and WD.
4.4 Decomposition analysis of carbon emission factors for urban public transportation
To better understand changes in carbon emissions from public transportation and their driving factors in major Chinese cities, this study employs the LMDI method to decompose these changes into the effects of various factors from 2018 to 2022. The analysis quantifies the contributions of these factors to the emission changes and examines their relative importance. The detailed results are presented in Figures 7, 8.
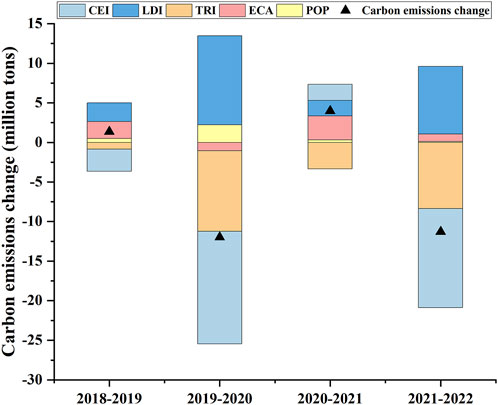
Figure 7. Decomposition of overall urban carbon emission factors (million tons).
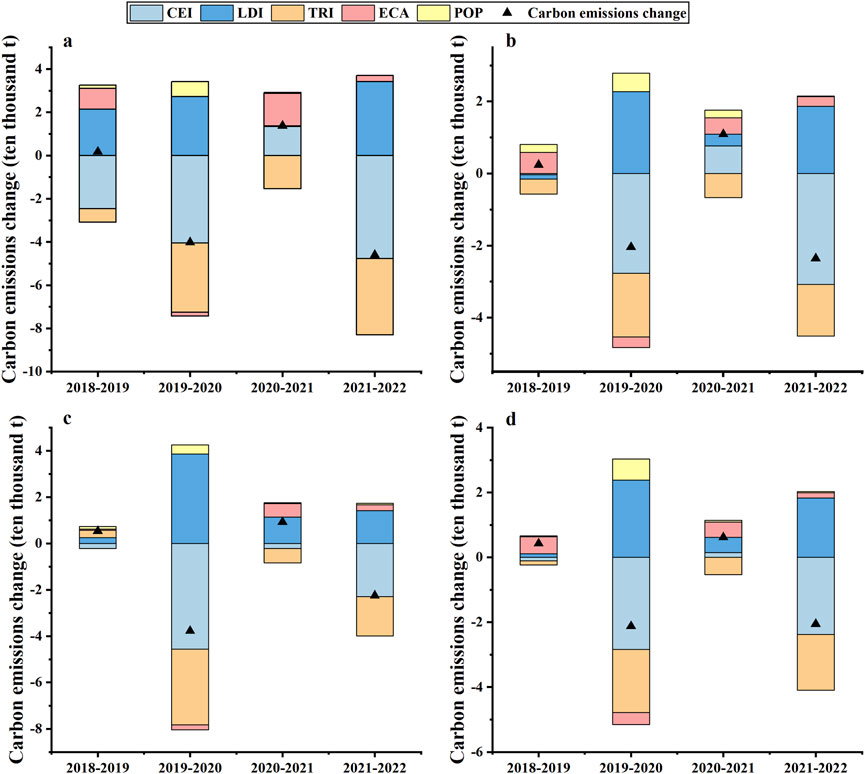
Figure 8. Decomposition of carbon emission factors for public transportation across city types: (a) Type I, (b) Type II, (c) Type III, and (d) Type IV.
4.4.1 Overall decomposition profile of carbon emission factors for public transportation
Between 2018 and 2022, public transportation carbon emissions fluctuated overall, and the mechanisms underlying each influencing factor varied significantly. Overall, the influence of ECA fluctuated: during 2019–2020, ECA inhibited carbon emission growth due to the epidemic, whereas in other years, it promoted increases in carbon emissions. Meanwhile, LDI and POP consistently contributed positively to carbon emissions across all phases, whereas TRI consistently exerted a dampening effect. Notably, during 2020–2021, CEI contributed positively to carbon emission growth. In the other periods, CEI exerted a dampening effect on carbon emissions.
Specifically, during 2018–2019, CEI and TRI significantly inhibited carbon emissions, whereas increases in LDI, ECA, and POP drove emissions upward, resulting in overall positive growth. In 2019–2020, ECA contributed negatively—due to the impact of the COVID-19 pandemic—thereby suppressing carbon emission growth. Meanwhile, increases in LDI and POP continued to drive up carbon emissions, albeit to a lesser extent, resulting in an overall reduction of 11,968,800 tons. In 2020–2021, as the pandemic was gradually brought under control, the positive contribution of ECA strengthened considerably and emerged as the primary driver of carbon emission growth. Meanwhile, although the negative impact of TRI persisted, the contribution of CEI reversed to a positive influence, culminating in an increase of 3,995,300 tons in carbon emissions. In 2021–2022, although LDI, ECA, and POP continued to drive carbon emission growth, the negative effects of CEI and TRI intensified. In particular, the marked negative contribution of CEI resulted in a significant overall decline in carbon emissions, amounting to a reduction of 11.2790 million tons.
4.4.2 Decomposition of carbon emission factors for different categories of urban public transportation
Below is a paragraph-style decomposition analysis of carbon emission factors across different city types (Type I, II, III, and IV) for urban public transportation from 2018 to 2022, based on the provided data. The analysis is segmented by time period for clarity.
During the 2018–2019 period, carbon emissions across all city types—Type I, II, III, and IV—were predominantly driven by CEI and ECA. In Type I cities, CEI and TRI acted as significant inhibitors of carbon emissions; however, the stronger positive influences of ECA and LDI outweighed these effects, leading to an overall increase in emissions. For Type II cities, ECA emerged as the primary driver, with emissions rising rapidly as economic levels improved, though TRI exerted a notable inhibitory effect. In Type III cities, only CEI demonstrated an inhibitory impact, with other factors playing a less pronounced role. Meanwhile, Type IV cities saw TRI and CEI suppressing carbon emissions, but the substantial upward push from ECA resulted in a net increase in emissions.
The 2019–2020 period marked a significant shift due to the COVID-19 pandemic, which caused a notable decline in carbon emissions across all city types. This reduction was primarily attributed to the negative effect of ECA, as economic slowdowns triggered sharp decreases in production and travel demand. While LDI increased in some cities, this uptick was insufficient to offset the broader economic downturn’s impact on emissions. Additionally, reduced usage of public transportation and lower passenger flows weakened TRI’s inhibitory role, positioning CEI as the key factor influencing emission changes during this period.
From 2020 to 2021, emission trends diverged across city types. In Type I and Type II cities, both CEI and ECA contributed to rising carbon emissions, though TRI maintained an overall inhibitory effect; notably, Type II cities also experienced significant POP. In Type III cities, CEI took on a negative value—reflecting improvements in energy efficiency or technological upgrades—while a substantial rise in LDI signaled continued expansion of public transportation networks. For Type IV cities, CEI, LDI, and ECA all positively contributed to emissions, whereas TRI continued to exert a negative, or inhibitory, influence.
Between 2021 and 2022, all four city types exhibited consistent patterns in certain factors. Negative values for CEI and TRI across Types I, II, III, and IV indicated that technological optimization and enhanced energy efficiency were effectively suppressing emissions. Conversely, positive LDI values highlighted how ongoing public transportation infrastructure expansion continued to drive emissions upward. ECA remained a positive contributor to emissions in all city types, reflecting its persistent role in emission growth. On the population front, Type I cities saw a slight decline in POP, while Types II, III, and IV maintained positive population growth, influencing their respective emission profiles.
5 Discussion
5.1 Fluctuation characteristics and spatiotemporal patterns of public transportation carbon emissions
The total carbon emissions from public transportation fluctuated significantly between 2018 and 2022, while their spatial distribution exhibited certain regular patterns. These fluctuations can be attributed to external shocks and regional disparities in development. The following section provides a more detailed analysis of the underlying causes of these fluctuations and the observed spatial distribution patterns.
Significant fluctuations in carbon emissions from public transportation between 2018 and 2022 are closely associated with external events, infrastructure expansion, and policy or technological interventions. The most notable disruption occurred in 2020, when the COVID-19 epidemic triggered an abrupt decline in public transportation usage, which, in turn, engendered a marked decrease in carbon emissions (Liu et al., 2020). This phenomenon can be attributed to various containment measures, including the imposition of blockades and travel restrictions. This trend aligns with global trends, as evidenced by the analogous decline in emissions observed during the epidemic in transit-intensive cities such as New York and London (Restrepo, 2021). In 2021, there was a “V”-shaped recovery in carbon emissions, as demand for transportation rapidly rebounded in tandem with the implementation of vaccination programs and the resumption of economic activities. This pattern of fluctuation indicates that public transportation emissions are highly sensitive to external shocks (Lyu et al., 2025). Therefore, policymakers must take into account the potential impact of unexpected events when designing future emissions reduction strategies.
At the same time, long-term structural changes have contributed to more persistent trends in emissions. Rapid urbanization and rural-urban migration over recent decades have fueled rising travel demand and driven the rapid expansion of China’s public transportation network (Zhang et al., 2022). As a result, public transport-related carbon emissions have also grown substantially. For instance, a case study of urban rail transit shows that the total length of operational lines increased from 5,761.4 km in 2015 to 10,287.45 km in 2022—a remarkable 78.56% increase. By the end of 2022, 55 cities across China had 308 lines in operation, with an additional 6,675.57 km of lines under construction. The rollout of such an extensive network inevitably contributes to short-term emissions growth due to the energy requirements of new route operations and rising passenger volumes. Furthermore, it suggests that as infrastructure continues to improve, total carbon emissions from public transportation systems are likely to increase in the future. Therefore, integrating low-carbon technologies and optimizing operational strategies during both the construction and planning phases is essential to achieving long-term emission reduction goals.
Encouragingly, however, the decline in emissions observed in 2022 likely reflects the growing influence of targeted policy initiatives and technological progress. In particular, the Chinese government has actively promoted the adoption of new energy vehicles (NEVs), with the number of NEVs in operation surpassing 500,000 by the end of 2022. This transition has significantly reduced the carbon footprint of public transportation (Tian et al., 2024). Moreover, the implementation of intelligent transportation systems (ITS) has improved traffic efficiency and reduced unnecessary emissions by optimizing route planning and traffic flow (Sarwatt et al., 2024). Behavioral changes, such as the continued prevalence of telecommuting following the COVID-19 pandemic, have further contributed to reduced travel demand. Together, these developments underscore the synergistic impact of policy, technology, and societal behavior in driving low-carbon transitions within the public transport sector.
The spatial distribution of carbon emissions exhibits a clear northeast-southwest orientation, with the emissions centroid gradually shifting toward the south and west. This spatial evolution is closely linked to regional economic development patterns and national policy orientations.
A key driver of this trend is the disparity in regional economic development. Economic development is the main factor affecting the growth of carbon emissions from urban public transportation. Differences in geographic conditions, economic environment and development strategies across China have led to different regional economic growth patterns (Minarta and Ko, 2024). Carbon emissions from public transportation are mainly concentrated in China’s highly economically developed regions, which are economically developed, densely populated, and have high transportation demand, leading to a significant increase in public transportation traffic-related carbon emissions. Southern and eastern China have seen accelerated urbanization and rapid economic growth in recent years, with a concomitant increase in demand for public transport, leading to a rise in carbon emissions. For example, GDP growth rates in economic zones such as the Yangtze River Delta and Pearl River Delta are significantly higher than the national average, and the expansion of public transportation networks (the increase in subway and bus lines) has directly pushed up emissions. This phenomenon is in line with the Environmental Kuznets Curve (EKC) theory (Wang Q. et al., 2024), which states that in the early stages of economic development, environmental pressures increase with economic growth, but after reaching a certain level, environmental quality is expected to improve with technological advances and policy interventions (He et al., 2023).
Policy interventions have also significantly influenced the spatial distribution of carbon emissions from public transportation. For example, the Western Development and the Belt and Road Initiative have promoted the construction of transportation infrastructure in the central and western regions, and between 2020 and 2022, China has built several new high-speed railways and urban rail lines in the central and western regions, expanding the coverage and utilization of public transportation (Xia et al., 2025). However, this has also brought about a short-term increase in carbon emissions. In the future, policy design will need to seek a balance between economic development and emission reduction targets, for example, by promoting low-carbon transportation technologies to ease the pressure on emissions.
5.2 Decoupling effects between economic growth and public transpotation carbon emissions
From 2018 to 2022, different city classes exhibited distinct decoupling patterns between public transportation carbon emissions and economic growth, reflecting variations in developmental stages, governance capacity, and external influences such as policy orientation, technological advances, and epidemics. Tier-1cities and megacities (Class I) followed a complex trajectory. In the early years, the rapid expansion of transit networks led to increases in ridership, service mileage, and associated emissions. However, the implementation of “Carbon Peak” and “Green Mobility” policies (Zhan et al., 2024), along with targeted investments in new energy vehicles, direct current (DC) traction systems, and intelligent dispatch technologies, gradually restructured travel patterns. Prioritization of bus systems and the extension of urban rail contributed to a shift toward more sustainable mobility modes, resulting in a strong decoupling effect by 2021–2022. In contrast, economically vibrant provincial capitals and regional centers (Class II) experienced a more consistent and smooth decoupling process. Under the guidance of green transport objectives outlined in the 14th Five-Year Plan, these cities expanded charging infrastructure, accelerated fleet electrification, and improved multimodal interchanges. Consequently, carbon intensity declined steadily, and strong decoupling was achieved by 2022.
Emerging city clusters and resource-based cities (Class III) experiences significant fluctuations during the decoupling process. Before the epidemic, these cities were rapidly expanding their public transportation networks. The increase in route mileage and vehicle deployment initially led to negative decoupling (SND), as carbon emissions grew despite economic progress. During the epidemic, emissions briefly dropped due to a sharp decline in passenger traffic. However, once the economy and travel demand recovered, operational inefficiencies and reliance on a single energy source resurfaced. By 2021–2022, the introduction of smart dispatch systems and new energy demonstration operations helped these cities shift toward strong decoupling. However, to maintain this progress, cities must consolidate their operational resilience and accelerate technological advancements. Cities in the smallest and slowest-developing Category IV were hindered by a low passenger base, an underdeveloped public transportation network, and both financial and demand constraints. This led to repeated cycles of decoupling and back-coupling. Nevertheless, by 2022, these cities achieved a more stable state, primarily at the strong decoupling level. Moving forward, cities must tailor their policy implementation and technology adoption to their specific circumstances in order to fully decouple the public transportation sector in the future.
Over the past 4 years, decoupling of China’s public transportation sector has improved significantly. This progress has been made possible by a series of government policy initiatives to curb greenhouse gas emissions, particularly the 2030 “peak carbon” and 2060 “carbon neutral” targets. As a major source of carbon emissions, the low-carbon transformation of transportation has been raised to an unprecedented level. Currently, China is in a critical period of green transportation planning, with the “Outline for the Construction of a Strong Transportation State,” “Green Travel Action Plan,” and “Public Transportation Priority Development Plan” all coming out one after another, emphasizing the significant reduction of carbon emissions from public transportation through the promotion of electrification of buses, optimization of the rail network, and the electrification of cabs and online cab rides. At the international level, Tokyo’s Zero Emission Tokyo Strategy (Goto, 2024), Los Angeles’ Mobility Plan 2035 (Planning, 2015), Singapore’s Green Plan 2030 (Plan, 2023), and the UK’s Road to Zero Strategy have demonstrated diverse paths for low-carbon transportation policies. Domestically, institutional design has also been continuously strengthened. The Regulations on the Construction and Management of Public Transportation put forward stricter entry conditions for the planning and construction of bus, rail and cab networks, including indicators such as public budget revenue, gross regional product, urban resident population and passenger flow size.
5.3 Variations in factors influencing the LMDI decomposition of public transportation carbon emissions
Under the extended Kaya framework, decomposition results based on the LMDI methodology show that the level of carbon emission intensity (CEI), line density (LDI), transportation intensity (TRI), economic activity (ECA) and population scale (POP) collectively drive public transportation carbon emissions, but their roles vary significantly across years and city types. Overall, ECA, LDI, and POP have exerted a sustained upward pressure on emissions over the 2018–2022 period-reflecting accelerating GDP growth, network expansion, and urbanization. Meanwhile, TRI has consistently had a dampening effect on emissions, suggesting that increasing per-unit efficiency has counteracted some of the emissions growth. The impact of CEI has fluctuated over time: in most years, it has been dampened by technological advances in energy efficiency. However, during 2020–2021, its negative contribution turned positive when passenger traffic rebounded faster than efficiency gains during the recovery phase.
These dynamics highlight key considerations for policy design. First, to strengthen the disincentive effect of TRI, multi-modal transportation integration and demand management reforms, such as the promotion of smart ticketing systems and peak diversion incentives, should be further developed to improve overall passenger capacity without increasing carbon emissions (Yan et al., 2025). Second, while continued network expansion is critical for meeting travel demand, planners must strike a balance route expansion and the adoption of low-carbon traction technologies and renewable energy to avoid the “carbon lock-in” effect of infrastructure development (Wang W. et al., 2024). Third, to sustain a negative CEI contribution, fleet electrification should be actively pursued, with aggressive pilots of hydrogen fuel and battery electric vehicle technologies, along with simultaneous improvements in grid cleanliness—especially critical during periods of rapid passenger growth (Darmoyono, 2024).
Comparisons across city types further demonstrate the need for differentiated strategies. In Class I and II cities, where ECAs and POPs account for the largest share of total carbon emissions, a combination of economic incentives and higher efficiency standards can help deliver a “high quality, low carbon” dividend. In contrast, in smaller or emerging Class III and IV cities—where rapid expansion of transport networks and vehicle fleets is the primary driver of emissions—priority should be given to deploying high-efficiency vehicles and adapting service models flexibly to help these cities leapfrog the traditional “high-carbon growth” phase. Overall, the LMDI analysis suggests that long-term emissions control in the public transport sector will require optimizing network density and operational efficiency while leveraging economic growth to finance low-carbon investments, and continuing to improve energy intensity in all types of cities to achieve synergistic and robust transitions to low-carbon development in the region.
6 Conclusion and policy implications
6.1 Conclusion
6.1.1 Spatio-temporal pattern and fluctuation characteristics of public transportation carbon emissions
From 2018 to 2022, total carbon emissions from public transportation in major Chinese cities exhibited significant fluctuations. Total emissions were 39.848 million tons in 2018, increased to 41.212 million tons in 2019, decreased to 29.242 million tons in 2020 due to the COVID-19 pandemic, rebounded to 33.238 million tons in 2021, and further decreased to 21.959 million tons in 2022. Spatially, emissions followed a northeast-southwest distribution. Standard deviation ellipse analysis revealed an expanding spatial pattern annually, with the center of gravity gradually shifting southwards and slightly westwards. These trends reflect the impact of regional economic development disparities and transportation policies on public transportation carbon emissions.
6.1.2 Carbon emission characteristics of different categories of cities
During the study period, Type I cities (economically developed cities) presented the highest carbon emissions from public transportation, accounting for 41.1% of the total. Type II cities maintained a stable share of 19%–21%, whereas Type III and Type IV cities collectively contributed approximately 40%. Notably, Type I cities presented lower carbon emission intensities, indicating greater energy efficiency. In contrast, Type II cities presented faster emission growth, whereas emissions from Type III and Type IV cities remained relatively stable. Among regional economic zones, the Yangtze River Delta region contributed the most to carbon emissions. The Beijing-Tianjin-Hebei region experienced elevated emissions due to a high electricity emission factor. Meanwhile, the Chengdu-Chongqing Economic Circle recorded an increase in carbon emissions, driven by rising demand for cross-city commuting.
6.1.3 Trends in decoupling carbon emissions from economic growth
From 2018 to 2022, the decoupling relationship between carbon emissions from public transportation and economic growth in Chinese cities varied across city types. The Type I and Type II cities gradually achieved strong decoupling, especially during 2021–2022. Conversely, Type III and Type IV cities presented weaker decoupling effects, with some exhibiting strong negative decoupling, indicating insufficient coordination between economic growth and carbon emissions. Overall, the decoupling relationship improved across China from 2021–2022, likely due to effective policy interventions and technological advancements.
6.1.4 Impact of drivers on carbon emissions
ECA and LDI are the primary drivers of carbon emission growth from public transportation, particularly in Type I and Type II cities. The impacts of CEI and TRI vary across time and city type. From 2021–2022, CEI significantly reduced emissions in Type I cities, while TRI mitigated emissions in Type I cities but drove emissions growth in Type III and Type IV cities. These findings underscore the complex relationship between transportation demand and carbon emissions across diverse urban settings.
6.2 Policy implication
Based on the key findings of this study, policymakers should formulate integrated policy responses that promote the low-carbon transformation of urban public transport while addressing the differentiated characteristics and developmental trajectories of cities. These responses can be broadly framed around three interrelated priorities: the development of tailored low-carbon transport strategies, the enhancement of technological and energy efficiency in public transportation, and the promotion of collaborative regional governance to support low-carbon mobility transitions.
To begin with, differentiated policy design is crucial for effectively managing the carbon emissions of public transportation across China’s 28 major cities, which vary widely in terms of economic structure, population dynamics, and infrastructure development. For Type I cities, which are economically developed and have high total carbon emissions but low intensity, it is recommended to optimize the existing transportation network, build smart charging networks to support the popularization of electric vehicles, integrate renewable energy into the public transportation system, and improve the efficiency of rail transportation through smart dispatching and energy-efficient traction systems. For Type II cities, where carbon emissions are growing rapidly but stabilizing at between 19% and 21%, there is a need to build low-carbon transportation networks, such as light rail or Bus Rapid Transit (BRT) systems, to meet the growth in demand for transportation, and to ensure that these networks incorporate energy-efficient and low-carbon technologies. For Type III and Type IV cities, where emissions are stable but decoupling effects are weak and infrastructure gaps are evident, policies should prioritize investment in basic public transport systems, expansion of bus networks, introduction of electric or hybrid vehicles, and upgrading of service quality to enhance attractiveness.
Enhancing the energy efficiency of public transportation systems presents another essential avenue for sustained emissions reduction. In the short term, all cities should promote energy-efficient technologies, such as retrofitting bus fleets with fuel-efficient engines or hybrid systems, and implementing real-time energy monitoring systems to optimize fuel and electricity use. In the medium to long term, Type I and Type II cities, with their greater economic capacity, should take the lead in adopting cutting-edge technologies such as hydrogen fuel cell vehicles and next-generation battery systems, while promoting a transition to a clean energy grid to reduce the carbon intensity of rail transportation. Type III and Type IV cities, on the other hand, should phase out older, high-emission vehicles and replace them with electric or low-emission alternatives, with subsidies and incentives to accelerate the transition of fleet operators.
Finally, shifting travel behavior toward low-carbon modes of transport is fundamental to the long-term sustainability of urban mobility. This requires a combination of short-term behavioral incentives and long-term planning frameworks. In the short term, all cities should introduce peak travel incentives, such as out-of-peak concessionary fares to reduce congestion and emissions, along with public awareness campaigns to promote public transportation, cycling, and walking. In the medium to long term, Type I cities should develop integrated mobility platforms that combine public transportation with shared mobility services (e.g., bike-sharing and internet ridesharing) to provide seamless, low-carbon mobility options and implement congestion pricing or low-emission zone (LEZ) policies to reduce private vehicle use. For Type II, Type III and Type IV cities, policies should focus on improving the reliability and accessibility of public transportation as a strong competitor to the private car, while supporting pedestrian-friendly urban design and bicycle infrastructure to further promote low-carbon travel.
6.3 Limitations analysis
This study has several limitations that offer promising directions for future research. First, by focusing exclusively on the operational phase of public transportation, the analysis captures only direct emissions from tailpipes and electricity consumption. A more comprehensive life cycle assessment (LCA) that includes vehicle manufacturing, infrastructure construction, maintenance, and end-of-life disposal would provide a fuller understanding of the sector’s true carbon footprint. Secondly, the study’s geographic scope is limited to major Chinese cities, which may constrain the generalizability of its findings. Although expanding data collection to a broader set of global cities—such as those in Europe, Latin America, or Africa—poses logistical challenges in the short term, such comparative research would yield valuable insights into the divergent decoupling patterns and emission drivers shaped by varying levels of economic development and policy regimes. In line with World Bank assessments, there is evidence that low-carbon transit investments generate similar co-benefits—including reductions in air pollution and improved mobility equity—across diverse urban contexts, as observed in cities like Buenos Aires and Barcelona. Future studies should apply the integrated Tapio–LMDI approach to international cases, examining the policy successes and implementation challenges in cities like Tokyo’s early rail electrification program or Los Angeles’s Bus Rapid Transit rollout, thereby enhancing the global relevance and transferability of the framework. In conclusion, as this analysis is grounded in historical data, it does not project future emission trajectories. Incorporating scenario-based forecasting—modeling the impact of varying fleet electrification rates, land-use changes, or demand-management policies—would allow policymakers to assess long-term decarbonization pathways and prioritize interventions with the greatest mitigation potential. These proposed extensions would not only address current limitations but contribute to the development of a robust and globally applicable framework for advancing low-carbon and resilient public transportation systems.
Data availability statement
The original contributions presented in the study are included in the article/Supplementary Material, further inquiries can be directed to the corresponding author.
Author contributions
CJ: Conceptualization, Investigation, Methodology, Project administration, Supervision, Writing – review and editing, Writing – original draft. XW: Data curation, Formal Analysis, Methodology, Writing – original draft, Writing – review and editing. CY: Software, Writing – original draft. CQ: Software, Writing – original draft. ZC: Visualization, Writing – original draft. LZ: Validation, Writing – original draft. LL: Funding acquisition, Project administration, Resources, Supervision, Writing – original draft, Writing – review and editing.
Funding
The author(s) declare that financial support was received for the research and/or publication of this article. This research was funded by the National Natural Science Foundation of China (grant No. 42271060), the Natural Science Foundation of Anhui province (No. 2208085MD91), and the MOE (Ministry of Education in China) Youth Foundation Project of Humanities and Social Sciences (No. 21YJCZH243).
Conflict of interest
Author CY was employed by Anhui Size Technology Co., Ltd. Author CQ was employed by SIPSG Information Technology Co., Ltd.
The remaining authors declare that the research was conducted in the absence of any commercial or financial relationships that could be construed as a potential conflict of interest.
Generative AI statement
The authors declare that no Generative AI was used in the creation of this manuscript.
Publisher’s note
All claims expressed in this article are solely those of the authors and do not necessarily represent those of their affiliated organizations, or those of the publisher, the editors and the reviewers. Any product that may be evaluated in this article, or claim that may be made by its manufacturer, is not guaranteed or endorsed by the publisher.
Supplementary material
The Supplementary Material for this article can be found online at: https://www.frontiersin.org/articles/10.3389/fenvs.2025.1611380/full#supplementary-material
References
Ang, B. W. (2015). LMDI decomposition approach: a guide for implementation. Energy Policy 86, 233–238. doi:10.1016/j.enpol.2015.07.007
Bai, C., Chen, Z., and Wang, D. (2023). Transportation carbon emission reduction potential and mitigation strategy in China. Sci. Total Environ. 873, 162074. doi:10.1016/j.scitotenv.2023.162074
Bianco, V., Cascetta, F., and Nardini, S. (2024). Analysis of the carbon emissions trend in European Union. A decomposition and decoupling approach. Sci. Total Environ. 909, 168528. doi:10.1016/j.scitotenv.2023.168528
CAMET (2023). China association of metros. Available online at: https://www.camet.org.cn/.
Change, I. P. O. C. (2007). Climate change 2007: the physical science basis. Agenda 6 (07), 333. doi:10.1080/03736245.2010.480842
Chen, H.-H., Hof, A. F., Daioglou, V., de Boer, H. S., Edelenbosch, O. Y., van den Berg, M., et al. (2021). Using decomposition analysis to determine the main contributing factors to carbon neutrality across sectors. Energies 15 (1), 132. doi:10.3390/en15010132
China Association of Metros (2023). Available online at: https://www.camet.org.cn/.
China Communications and Transportation of Association (2024). Yearbook of China integrated transport. Available online at: https://www.zgjtnjs.com/.
Darmoyono, I. (2024). Study on challenges and opportunities for electric vehicle development for land-based public transport sector in cities of Indonesia.
Duman, Z., Mao, X., Cai, B., Zhang, Q., Chen, Y., Gao, Y., et al. (2023). Exploring the spatiotemporal pattern evolution of carbon emissions and air pollution in Chinese cities. J. Environ. Manag. 345, 118870. doi:10.1016/j.jenvman.2023.118870
Engo, J. (2019). Decoupling analysis of CO2 emissions from transport sector in Cameroon. Sustain. Cities Soc. 51, 101732. doi:10.1016/j.scs.2019.101732
Fan, F., and Lei, Y. (2016). Decomposition analysis of energy-related carbon emissions from the transportation sector in Beijing. Transp. Res. Part D Transp. Environ. 42, 135–145. doi:10.1016/j.trd.2015.11.001
Fan, J.-L., Wang, J.-X., Li, F., Yu, H., and Zhang, X. (2017). Energy demand and greenhouse gas emissions of urban passenger transport in the Internet era: a case study of Beijing. J. Clean. Prod. 165, 177–189. doi:10.1016/j.jclepro.2017.07.106
General Administration of Quality Supervision (2017). Evaluation index system for city public transportation development performance: GB/T 35654-2017.
Goto, E. (2024). Dominant narratives and manufactured consensus: a critical analysis of Japan's climate transition policy process and governance. Sci. Po Paris.
He, H., Jiang, W., Gao, Z., and Liu, T. (2025). Influencing factors of carbon emissions from final consumption based on LMDI decomposition and Tapio index: the EU 28 as an example. Energy Rep. 13, 4884–4899. doi:10.1016/j.egyr.2025.04.030
He, K., Mi, Z., Zhang, J., Li, J., and Coffman, D. M. (2023). The polarizing trend of regional CO2 emissions in China and its implications. Environ. Sci. and Technol. 57 (11), 4406–4414. doi:10.1021/acs.est.2c08052
Hou, L., Wang, Y., Hu, L., Wang, Y., Li, Y., and Zheng, Y. (2024). Economic growth and carbon emissions analysis based on tapio-ekc coupled integration and scenario simulation: a case study of China's transportation industry. Environ. Dev. Sustain. 26 (7), 18855–18881. doi:10.1007/s10668-023-03418-3
Javanmard, M. E., Tang, Y., Wang, Z., and Tontiwachwuthikul, P. (2023). Forecast energy demand, CO2 emissions and energy resource impacts for the transportation sector. Appl. Energy 338, 120830. doi:10.1016/j.apenergy.2023.120830
Jia, C., Wang, X., Qian, C., Cao, Z., Zhao, L., and Lin, L. (2025). Quantitative study on the environmental impact of Beijing’s urban rail transit based on carbon emission reduction. Sci. Rep. 15 (1), 2380. doi:10.1038/s41598-025-86714-4
Jing, Q.-L., Liu, H.-Z., Yu, W.-Q., and He, X. (2022). The impact of public transportation on carbon emissions—from the perspective of energy consumption. Sustainability 14 (10), 6248. doi:10.3390/su14106248
Li, F., Ye, S., Chevallier, J., Zhang, J., and Kou, G. (2023). Provincial energy and environmental efficiency analysis of Chinese transportation industry with the fixed-sum carbon emission constraint. Comput. and Industrial Eng. 182, 109393. doi:10.1016/j.cie.2023.109393
Li, L., Zhang, Y., Zhou, T., Wang, K., Wang, C., Wang, T., et al. (2022). Mitigation of China’s carbon neutrality to global warming. Nat. Commun. 13 (1), 5315. doi:10.1038/s41467-022-33047-9
Li, X., Lv, T., Zhan, J., Wang, S., and Pan, F. (2022). Carbon emission measurement of urban green passenger transport: a case study of Qingdao. Sustainability 14 (15), 9588. doi:10.3390/su14159588
Li, Y., Wei, Y., Shan, S., and Tao, Y. (2018). Pathways to a low-carbon economy: estimations on macroeconomic costs and potential of carbon emission abatement in Beijing. J. Clean. Prod. 199, 603–615. doi:10.1016/j.jclepro.2018.07.093
Liu, B., and Lv, J. (2024). Spatiotemporal evolution and tapio decoupling analysis of energy-related carbon emissions using nighttime light data: a quantitative case study at the city scale in northeast China. Energies 17 (19), 4795. doi:10.3390/en17194795
Liu, M., Zhang, X., Zhang, M., Feng, Y., Liu, Y., Wen, J., et al. (2021). Influencing factors of carbon emissions in transportation industry based on CD function and LMDI decomposition model: China as an example. Environ. Impact Assess. Rev. 90, 106623. doi:10.1016/j.eiar.2021.106623
Liu, X., Zhong, S., and Yang, M. (2022). Study on the decoupling relationship of energy-related CO2 emissions and economic growth in China: using the new two-dimensional decoupling model. Ecol. Indic. 143, 109405. doi:10.1016/j.ecolind.2022.109405
Liu, Z., Ciais, P., Deng, Z., Lei, R., Davis, S. J., Feng, S., et al. (2020). Near-real-time monitoring of global CO(2) emissions reveals the effects of the COVID-19 pandemic. Nat. Commun. 11 (1), 5172. doi:10.1038/s41467-020-18922-7
Long, Y., Zhu, C., Zhang, C., and Pan, R. (2023). Research on temporal and spatial distribution of carbon emissions from urban buses based on big data analysis. Atmosphere 14 (2), 411. doi:10.3390/atmos14020411
Lu, S., Jiang, H., Liu, Y., and Huang, S. (2017). Regional disparities and influencing factors of average CO2 emissions from transportation industry in Yangtze River Economic Belt. Transp. Res. Part D Transp. Environ. 57, 112–123. doi:10.1016/j.trd.2017.09.005
Luo, X., Dong, L., Dou, Y., Li, Y., Liu, K., Ren, J., et al. (2017). Factor decomposition analysis and causal mechanism investigation on urban transport CO2 emissions: comparative study on Shanghai and Tokyo. Energy Policy 107, 658–668. doi:10.1016/j.enpol.2017.02.049
Luo, X., Yuan, Y., Dou, Y., Bian, W., and Wei, X. (2024). Factor decomposition analysis of urban transport CO2 emissions in Chinese mega cities: case study of Beijing, Shanghai, Guangzhou and Shenzhen. Environ. Dev. Sustain., 1–24. doi:10.1007/s10668-024-05239-4
Lyu, S., Huang, Y., and Sun, T. (2025). Urban sprawl, public transportation efficiency and carbon emissions. J. Clean. Prod. 489, 144652. doi:10.1016/j.jclepro.2025.144652
MEE (2023). Ministry of Ecology and environment of the People's Republic of China. Available online at: https://www.mee.gov.cn/.
Minarta, R. R., and Ko, J. (2024). What are the stimulants on transportation carbon dioxide emissions?: a nation-level analysis. Energy 296, 131179. doi:10.1016/j.energy.2024.131179
Ministry of Construction of the People’s Republic of China. (2007). Standard for classification of urban public transportation: CJJ/T 114 2007.
MOT (2023). Ministry of transport of the People's Republic of China. Available online at: https://www.mot.gov.cn/.
NGCC (2023). National Bureau of Statistics. Available online at: https://www.ngcc.cn/.
Nisbet, E., and Weiss, R. (2010). Top-down versus bottom-up. Science 328 (5983), 1241–1243. doi:10.1126/science.1189936
Plan, S. G. (2023). The Singapore Green plan 2030. Available online at: https://www.greenplan.gov.sg/.
Planning, L. A. D. O. C. (2015). Mobility plan 2035–an element of the general plan. Los Angeles Department of City Planning Los Angeles, CA.
Pu, J., Cai, C., Guo, R., Su, J., Lin, R., Liu, J., et al. (2024). Carbon emissions of urban rail transit in Chinese cities: a comprehensive analysis. Sci. Total Environ. 921, 171092. doi:10.1016/j.scitotenv.2024.171092
Raza, M. Y., and Lin, B. (2020). Decoupling and mitigation potential analysis of CO2 emissions from Pakistan's transport sector. Sci. Total Environ. 730, 139000. doi:10.1016/j.scitotenv.2020.139000
Restrepo, C. E. (2021). Nitrogen dioxide, greenhouse gas emissions and transportation in urban areas: lessons from the covid-19 pandemic. Front. Environ. Sci. 9. doi:10.3389/fenvs.2021.689985
Sarwatt, D. S., Lin, Y., Ding, J., Sun, Y., and Ning, H. (2024). Metaverse for intelligent transportation systems (its): a comprehensive review of technologies, applications, implications, challenges and future directions. IEEE Trans. Intelligent Transp. Syst. 25 (7), 6290–6308. doi:10.1109/TITS.2023.3347280
Shang, W.-L., and Lv, Z. (2023). Low carbon technology for carbon neutrality in sustainable cities: a survey. Sustain. Cities Soc. 92, 104489. doi:10.1016/j.scs.2023.104489
Shuai, C., Chen, X., Wu, Y., Zhang, Y., and Tan, Y. (2019). A three-step strategy for decoupling economic growth from carbon emission: empirical evidences from 133 countries. Sci. total Environ. 646, 524–543. doi:10.1016/j.scitotenv.2018.07.045
Song, N., and Yuan, Y.-M. (2023). Interactive response between tourism carbon emission ReductionPotential and tourism carbon emission efficiency in the Yangtze RiverEconomic beltlts. Econ. Geogr. 43 (07), 225–233. doi:10.15957/j.cnki.jjdl.2023.07.022
Song, Y., Zhang, M., and Shan, C. (2019). Research on the decoupling trend and mitigation potential of CO2 emissions from China's transport sector. Energy 183, 837–843. doi:10.1016/j.energy.2019.07.011
STATS (2003). National geomatics center of China. Available online at: https://www.stats.gov.cn/.
Sun, Y., Liu, S., and Li, L. (2022). Grey correlation analysis of transportation carbon emissions under the background of carbon peak and carbon neutrality. Energies 15 (9), 3064. doi:10.3390/en15093064
Tian, J., Wang, P., and Zhu, D. (2024). Overview of Chinese new energy vehicle industry and policy development. Green Energy Resour. 2 (2), 100075. doi:10.1016/j.gerr.2024.100075
Wang, J.-F., and Wang, F. (2021). Study on the relationship between the carbon emission of China's transportation industry and the gross economic product of the industry——based on decoupling model and Co-integration theory. Spec. Zone Econ. (09), 75–78.
Wang, L., Fan, J., Wang, J., Zhao, Y., Li, Z., and Guo, R. (2020). Spatio-temporal characteristics of the relationship between carbon emissions and economic growth in China’s transportation industry. Environ. Sci. Pollut. Res. 27, 32962–32979. doi:10.1007/s11356-020-08841-x
Wang, M., Zhu, C., Cheng, Y., Du, W., and Dong, S. (2023). The influencing factors of carbon emissions in the railway transportation industry based on extended LMDI decomposition method: evidence from the BRIC countries. Environ. Sci. Pollut. Res. 30 (6), 15490–15504. doi:10.1007/s11356-022-23167-6
Wang, Q., Wang, X., Li, R., and Jiang, X. (2024). Reinvestigating the environmental Kuznets curve (EKC) of carbon emissions and ecological footprint in 147 countries: a matter of trade protectionism. Humanit. Soc. Sci. Commun. 11 (1), 160. doi:10.1057/s41599-024-02639-9
Wang, W., Cheng, X., Li, J., Zheng, H., and Li, M. (2024). Role of renewable energy and storage in low-carbon power systems. Front. Energy Res. 12. doi:10.3389/fenrg.2024.1442144
Xia, T., Li, S., Ma, Y., and Choi, Y. (2025). Is China’s urban development planning sustainable? Evidence from the transportation sector in cities along the Belt and road initiative route. Land 14 (2), 363. doi:10.3390/land14020363
Yan, D., Liu, C., and Li, P. (2023). Effect of carbon emissions and the driving mechanism of economic growth target setting: an empirical study of provincial data in China. J. Clean. Prod. 415, 137721. doi:10.1016/j.jclepro.2023.137721
Yan, H., Ma, X., Liu, B., Tan, E., Li, Y., Ni, Z., et al. (2025). Enhancing public transit adoption through personalized incentives: a large-scale analysis leveraging adaptive stacking extreme gradient boosting in China. Transp. Res. Part C Emerg. Technol. 171, 104992. doi:10.1016/j.trc.2024.104992
Yang, H., Lu, X.-H., Kuang, B., and Hou, J. (2021). Spatial-temporal interaction and driving factors of urban compactness and carbon emission intensity: a case study in changsha-zhuzhou-xiangtan urban agglomeration. Resour. Environ. Yangtze Basin 30 (11), 2618–2629.
Yu, W., Wang, T., Xiao, Y., Chen, J., and Yan, X. (2020). A carbon emission measurement method for individual travel based on transportation big data: the case of Nanjing metro. Int. J. Environ. Res. Public Health 17 (16), 5957. doi:10.3390/ijerph17165957
Zeng, Q.-H., and He, L.-Y. (2023). Study on the synergistic effect of air pollution prevention and carbon emission reduction in the context of dual carbon: evidence from China's transport sector. Energy Policy 173, 113370. doi:10.1016/j.enpol.2022.113370
Zhan, J., Wang, C., Wang, H., Zhang, F., and Li, Z. (2024). Pathways to achieve carbon emission peak and carbon neutrality by 2060: a case study in the Beijing-Tianjin-Hebei region, China. Renew. Sustain. Energy Rev. 189, 113955. doi:10.1016/j.rser.2023.113955
Zhang, X., Brandt, M., Tong, X., Ciais, P., Yue, Y., Xiao, X., et al. (2022). A large but transient carbon sink from urbanization and rural depopulation in China. Nat. Sustain. 5 (4), 321–328. doi:10.1038/s41893-021-00843-y
Zhang, Z., and Sharifi, A. (2024). Analysis of decoupling between CO2 emissions and economic growth in China's provincial capital cities: a Tapio model approach. Urban Clim. 55, 101885. doi:10.1016/j.uclim.2024.101885
Zhao, P., Tian, B. S., Yang, Q., and Zhang, S. (2024). Influencing factors and their spatial–temporal heterogeneity of urban transport carbon emissions in China. Energies 17 (3), 756. doi:10.3390/en17030756
Keywords: public transportation, carbon emissions, spatiotemporal evolution, Tapio decoupling model, LMDI decomposition
Citation: Jia C, Wang X, Yang C, Qian C, Cao Z, Zhao L and Lin L (2025) Carbon emissions from public transportation in major Chinese cities: spatiotemporal analysis, decoupling trends, and key drivers. Front. Environ. Sci. 13:1611380. doi: 10.3389/fenvs.2025.1611380
Received: 15 April 2025; Accepted: 27 May 2025;
Published: 13 June 2025.
Edited by:
Ismail Suardi Wekke, Institut Agama Islam Negeri Sorong, IndonesiaReviewed by:
Hamed Fazlollahtabar, Damghan University, IranIrina Georgescu, Bucharest Academy of Economic Studies, Romania
Copyright © 2025 Jia, Wang, Yang, Qian, Cao, Zhao and Lin. This is an open-access article distributed under the terms of the Creative Commons Attribution License (CC BY). The use, distribution or reproduction in other forums is permitted, provided the original author(s) and the copyright owner(s) are credited and that the original publication in this journal is cited, in accordance with accepted academic practice. No use, distribution or reproduction is permitted which does not comply with these terms.
*Correspondence: Luzhou Lin, bGlubHV6aG91QGJmc3UuZWR1LmNu