- 1Jiangxi Provincial Key Laboratory of Environmental Pollution Control, Jiangxi Academy of Eco-Environmental Sciences and Planning, Jiangxi, China
- 2State Key Laboratory of Regional Environment and Sustainability, State Environmental Key Lab for Ozone Pollution Control, College of Environmental Sciences and Engineering, Peking University, Beijing, China
PM2.5 poses significant public health risks, with its sources and composition exhibiting pronounced spatial heterogeneity. While extensive research has focused on heavily polluted regions in northern China, the pollution structure of Jiangxi Province remains understudied. This study investigates the chemical composition and source apportionment of PM2.5 during a severe regional haze episode (25 December 2023–20 January 2024) across six cities in Jiangxi Province: Nanchang, Jiujiang, Pingxiang, Ji’an, Xinyu. Observed PM2.5 concentrations ranged from 44.1 to 76.6 μg/m3, dominated by water-soluble ions, organic matter (OM), and carbonaceous aerosols. Spatial analysis revealed a pollution hotspot centered on Nanchang and Jiujiang, characterized by distinct gradients in SNA (SO42−, NO3−, NH4+) and OM. Based on local emission patterns and topographic features and the component concentration differences of PM2.5, we speculate that there are three regional patterns: (1) Northern cities, characterized by high loadings of NO3− (industrial), OM (VOCs-derived), and SO42− (promoted by lake air masses with high humidity); (2) Central cities, dominated by local agricultural NH4+ and conversion from industrial gaseous sources precursors enhanced by local photochemistry; (3) Southern Jiangxi, where vehicular NOx-to-NO3− conversion predominated, exacerbated by topographic stagnation from the Nanling Mountains. Positive Matrix Factorization (PMF) resolved city-specific sources: secondary formation and combustion in Nanchang; industrial and vehicular emissions in Jiujiang; agricultural NH4+ and traffic in Pingxiang; mixed industrial-traffic sources in Ji’an; and vehicle-derived NO3− with dust in Ganzhou. These findings underscore spatiotemporal heterogeneity in energy structures and regional transport pathways, providing a scientific basis for region-specific PM2.5 control strategies in Jiangxi Province, China.
1 Introduction
The environmental and public health impacts of fine particulate matter (PM2.5) are unequivocally established (Leibensperger et al., 2012). As a critical component of atmospheric aerosols, PM2.5 disrupts radiative balance through scattering and absorbing solar radiation (e.g., black carbon absorption and sulfate (SO42−) scattering) and alters regional precipitation patterns by acting as cloud condensation nuclei (Baker and Peter, 2008; Myhre et al., 2013; Kanakidou et al., 2005). The health hazards of PM2.5 merit heightened attention, as its ultrafine particulate matter (aerodynamic diameter ≤2.5 μm) can translocate across the alveolar-capillary barrier into systemic circulation. This process triggers pathological cascades characterized by oxidative stress and chronic inflammation, which are recognized as primary contributors to cardiovascular and respiratory mortality (Pope et al., 2006; Wang et al., 2024). Epidemiological studies confirm a significant dose-response relationship between long-term exposure and cardiopulmonary mortality (Hao et al., 2017; Lu et al., 2015; Ali et al., 2023). China’s severe PM2.5 pollution exemplifies this crisis. In 2013, annual concentrations in the Beijing-Tianjin-Hebei and Yangtze River Delta regions reached 47–106 μg/m3 in 2013 (Ministry of Ecology and Environment of China, 2014) (Zheng et al., 2018; Ma et al., 2019), exceeding the WHO guideline (10 μg/m3) by 4–10 time. Understanding its spatiotemporal variability is thus critical for optimizing mitigation strategies.
The complex chemical composition of PM2.5 complicates environmental impact assessments, as it includes water-soluble inorganic ions (such as SO42−, NO3−, and ammonium (NH4+)), carbonaceous fractions (organic and elemental carbon), and trace metals. These components originate from both direct emissions (e.g., industrial combustion, dust, biomass burning) and secondary formation processes (such as the gas-to-particle conversion of SO2, NOx, NH3, and others) (Wang et al., 2015; Jeon et al., 2024). Water-soluble inorganic ions typically account for over 50% of PM2.5 mass, with formation processes (e.g., SO42− aqueous-phase oxidation and Nitrate (NO3−) gas-particle partitioning) closely linked to regional pollution patterns and meteorological conditions (Wang et al., 2006).
Jiangxi Province is a transitional zone between China’s Yangtze River Delta and Pearl River Delta economic hubs, whose air quality combined with geographical barrier effect and regional transmission vulnerability. It presents a basin pattern: surrounded by three mountains and open in north. Jiulian and Wuyi mountains in the south combined with Luoxiao mountains in the west form the natural barrier, the Poyang Lake Plain whereas become the open channel for trans-regional pollution transporting. The special terrain characteristic caused double-effects: during northerly wind prevails in winter, for one part, pollutants from the urban agglomeration in the middle reaches of the Yangtze River are discharged along the Poyang Lake Plain to Jiangxi Province; for another part, the interior of the basin is prone to form atmospheric stagnation zones, superimposed with local valley wind circulation (such as the diurnal wind direction reversal in the Jitai Basin), which significantly inhibits the efficiency of pollution diffusion. Meanwhile, the mixed emission landscape in Jiangxi Province further exacerbates the complexity of pollution: the northern riverside area is home to heavy industrial clusters such as Jiujiang Petrochemical (sources of secondary aerosol precursor emissions), the Pingxiang-Yichun coal mining area in the west contributes primary PM2.5 particulate matter related to coal burning, while agricultural ammonia emissions in the Poyang Lake Basin promote the formation of nitrate aerosols (Huang et al., 2025).
Since 25 December 2023, large-scale haze events have swept across regions including Northeast, North, Central, and East China, forming a nearly nationwide pollution structure (Yin et al., 2025; Peng et al., 2025). As a critical hub for north-south pollution transport, Jiangxi Province not only receives long-range inputs of pollutants from the Beijing-Tianjin-Hebei region and the Yangtze River Delta but also exports locally generated industrial-agricultural composite pollutants via the Poyang Lake Plain. By establishing a multi-parameter monitoring network across six representative cities in the province, this study analyzed the spatial distribution characteristics of PM2.5 water-soluble ions and carbonaceous components. Using PMF source apportionment coupled with backward trajectory analysis, the research further compared source variations and underlying mechanisms between polluted and non-polluted periods. The findings revealed a “superposition of external inputs and localized intensification” dual-effect mechanism, providing a data-driven foundation for designing coordinated “regional joint prevention and dynamic regulation” strategies for urban clusters in the middle reaches of the Yangtze River.
2 Materials and methods
2.1 Ambient samples
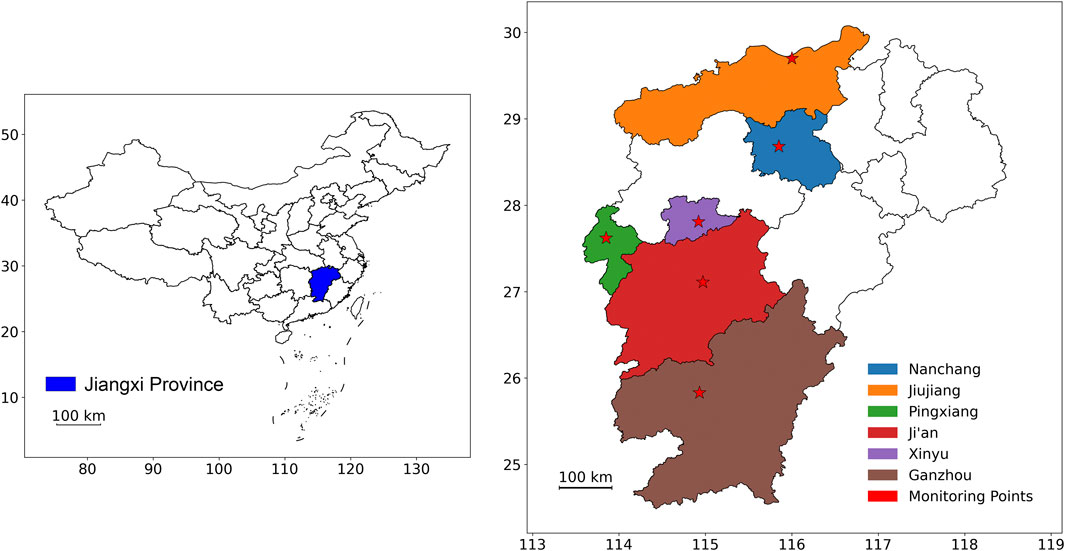
In this study, ambient PM2.5 samples were continuously collected at national air quality monitoring stations across six cities in Jiangxi Province (Nanchang, Jiujiang, Pingxiang, Xinyu, Ji’an, and Ganzhou) (Figure 1). The geographic coordinates and surrounding site characteristics are detailed in Table 1. Automatic aerosol sampling and analysis systems (model specifications listed in Table 2) were deployed synchronously at all sites from 25 December 2023, to 20 January 2024, operating on 24-h integrated cycles with programmable flow control. Each system was operated under identical quality-control protocols to ensure data stability and comparability. Quartz fiber filters were employed in parallel with polytetrafluoroethylene (PTFE) membrane filters: the former for subsequent thermal analysis to determine carbonaceous (OC/EC) content, and the latter for gravimetric and ion-chromatographic analysis of inorganic species. This dual-filter strategy enabled accurate quantification of both carbonaceous and water-soluble inorganic components in PM2.5.
2.2 Chemical analysis
Water-soluble inorganic ions in PM2.5 (NO3−, SO42−, Cl−, F−, etc.) were quantified by ion chromatography (Thermo Fisher URG9000D, etc.), while elemental concentrations (Zr, Al, Sr, Mg, Ti, Ca, Fe, Ba and Si) were determined using an inductively coupled plasma optical emission spectrometer (EHM-X200; Jiangsu Tianrui, China).
The quality control measures during the sampling process include: 1) Before sampling, the flow rate of the sampling device must be calibrated to ensure that the device operates in a stable and normal condition throughout the sampling process, with regular flow checks; 2) During sampling, it is essential to ensure that the filter membrane is intact, without damage, impurities, or contamination, to avoid external factors affecting the representativeness of the sample; 3) Each filter membrane is weighed three times before and after sampling to ensure that the weighing error is within 50 µg.
2.3 Positive matrix factorization (PMF) analysis
To determine the sources of ambient PM2.5 of the six cities of Jiangxi province during the sampling period, we employed the PMF (Paatero et al., 2014) 5.0 method to conduct a quantitative analysis to analyze the chemical components contained in ambient PM2.5, and obtained the contribution values and contribution rates of primary and secondary source categories to the receptor’s air pollutants. To determine the optimal number of factors, we conducted a sensitivity analysis and compared the QRobust and QTrue values of the model under different numbers of factors. The results show that as the number of factors increases, both indicators decrease, indicating improved model fitting accuracy. For example, when extracting five, six, and seven factors, QRobust values are approximately 114, 58, and 7.3, respectively, and QTrue values are approximately 168, 111, and 7.3, respectively. Although extracting seven factors minimized the Q value, we selected six factors based on the following: (1) the known structure of pollution sources in Jiangxi Province, (2) the physical interpretability of each factor, and (3) support from previous studies (Huang et al., 2023). We selected six factors for the PMF analysis to balance model performance and interpretability. The model employs a bilinear non-negative matrix factorization (NMF) method, decomposing the observed data matrix X (dimensions: n × m, containing chemical component concentrations such as SO42−, NO3−, and OC, in μg/m3) through iterative optimization of the objective function, Equation 1.
Where,
Where,
2.4 Backward trajectory analysis
Backward trajectory analysis traces the paths of air parcels backward in time from a specific location, providing information about the origins of air masses, which serves as a valuable tool for refining air pollution source analysis. Combined with the cluster analysis conducted in this study, it enables the grouping of similar air mass types based on their origins. For this analysis, the Hybrid Single-Particle Lagrangian Integrated Trajectory (HYSPLIT) model developed by the National Oceanic and Atmospheric Administration (NOAA) Air Resources Laboratory (ARL) was utilized. This study is based on GDAS meteorological data (with a resolution of 1°), generating a 72-h backward trajectory dataset hour by hour at a height of 30 m above the ground (AGL). The primary rationale for choosing 30 m above ground level (AGL) is the alignment between the sampling height and the priority of local pollution analysis. The sampling inlet of the monitoring instrument is positioned at approximately 30 m AGL, and the trajectory’s starting height is physically consistent with the sampling point. This alignment maximizes the representation of near-surface air mass movement directly influencing the monitoring data. By comparing trajectory simulations at 100 and 500 m, we found that trajectories at these higher altitudes are more influenced by long-distance transport (Supplementary Figures S1, S2), though their contribution to local pollution is relatively minor. In contrast, while the 30-m trajectory exhibits stability limitations due to surface friction, it effectively captures local pollution events, such as vehicle emissions during rush hours and short-distance diffusion in industrial parks. These results indicate that low-altitude trajectories are more suitable for analyzing pollution transport mechanisms at the local scale. The meteorological data required to run the HYSPLIT model during the 2023.12–2024.01 period was obtained from NOAA’s official website (https://www.ready.noaa.gov/archives.php) (Anwar et al., 2024).
3 Results
3.1 Chemical composition and characteristics of PM2.5
3.1.1 Ambient PM2.5 concentration in six cities
As illustrated in Figure 2, significant regional disparities in PM2.5 concentrations were observed between urban and background monitoring stations across six cities in Jiangxi Province during the sampling period (25 December 2023–20 January 2024). Urban stations revealed a clear pollution gradient: Nanchang exhibited the highest average PM2.5 concentration (93.0 ± 59.7 μg/m3), followed by Jiujiang (76.6 ± 49.1 μg/m3) and Pingxiang (70.3 ± 35.1 μg/m3), while Xinyu (61.2 ± 30.9 μg/m3), Ji’an (57.6 ± 27.8 μg/m3), and Ganzhou (44.1 ± 19.0 μg/m3) showed progressively lower levels. This spatial pattern correlated with exceedance frequency—Nanchang, Jiujiang, and Pingxiang surpassed the 75 μg/m3 threshold for over 10 days, compared to 6–7 days in Ji’an and Xinyu, and merely 1 day in Ganzhou (Guo and Shen, 2019; Wang et al., 2021). Notably, three synchronized pollution episodes (EP1: 25 Dec 2023–2 Jan 2024; EP2: January 6–10; EP3: January 14–18) affected all cities, yet with stark intensity contrasts. During EP1, Nanchang recorded an extreme daily concentration of 262.4 μg/m3 (December 30), whereas Ganzhou’s urban station peaked at only 89.3 μg/m3 in EP3 (January 16). Intriguingly, background stations (Supplementary Figure S3) generally reported lower PM2.5 than urban sites, except in Ganzhou where background levels exceeded 75 μg/m3 from 29 Dec 2023 to 1 Jan 2024—a period when its urban station remained below the threshold. This anomaly suggests localized pollution sources may impact rural areas more severely than the city itself.
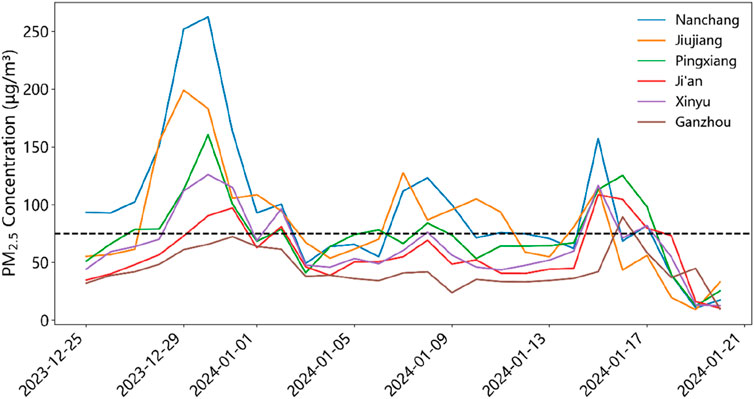
Figure 2. The variation of daily PM2.5 mass concentrations in different cities during the sampling period.
The combined evidence highlights a dual disparity: cities like Nanchang faced persistent urban pollution, while ostensibly cleaner regions like Ganzhou experienced acute rural contamination during specific episodes. Such contrasts underscore the need for geographically differentiated control strategies targeting both urban emissions and transboundary rural pollution sources.
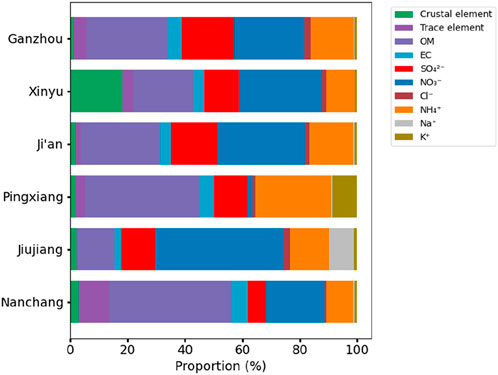
The analysis revealed significant spatial heterogeneity in the mass concentrations of PM2.5 chemical components across the studied cities (Figure 3). Organic matter (OM) exhibited the largest variability in mass contribution (12.7–42.4 μg/m3), with Nanchang (42.4 μg/m3) showing 3.34-fold higher OM levels than Jiujiang (12.7 μg/m3). Elemental carbon (EC) contributions remained relatively stable (3–6 μg/m3), yet Nanchang recorded the highest EC proportion (5.8 μg/m3). SO42− concentrations ranged from 6.36 μg/m3 (Nanchang) to 18.4 μg/m3 (Ganzhou). NO3− showed extreme variations, with Jiujiang reaching the highest concentration (44.7 μg/m3). Ionic species in PM2.5 such as NO3−, SO42−, and NH4+, are formed through the atmospheric transformation of precursors (nitric acid, SO2, and NH3) (Jeon et al., 2024). Since these ionic species account for the majority of the total PM2.5 mass across the studied cities, it can be inferred that secondary formation processes are the primary cause of elevated PM2.5 levels (Jeong et al., 2024). However, further validation is required by integrating local energy structures and industrial emission profiles.
3.1.2 Water-soluble ionic species
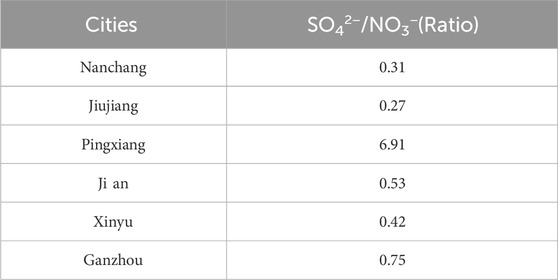
Among the chemical constituents of PM2.5 collected from six cities in Jiangxi Province, SO42−, NH4+ and NO3− are the dominant water-soluble ions (Supplementary Figure S4). In Ji’an City, the mass concentration percentages of SO42− and NO3− relative to the total water-soluble ions were 32.1% and 59.5%, respectively, significantly higher than in other cities. These secondary ions are primarily formed from gaseous precursors (SO2, nitrogen oxides (NOx), NH3) through photochemical oxidation, aqueous-phase reactions, and heterogeneous processes (Tu et al., 2022). NH3 emissions are closely linked to agricultural activities and industrial sources. Other water-soluble ions, such as chloride (Cl−) and potassium (K+), accounted for minor proportions of PM2.5, reflecting limited contributions, though their spatial distribution might indicate localized influences from biomass burning or dust resuspension (Deng et al., 2016). Moreover, the ratio of SO42−/NO3− indicated the contribution source of ambient PM2.5. Additionally, the results showed that Pingxiang exhibited a high SO42−/NO3− ratio of 6.91 (Table 3), indicating a dominant contribution from stationary sources (e.g., coal combustion or heavy industry) (Huang et al., 2012). The other five cities showed lower ratios (e.g., 0.31 in Nanchang City), which may suggest a predominance of mobile sources (e.g., vehicle emissions).
Supplementary Figure S5 illustrates the secondary transformation processes of gaseous pollutants in five Jiangxi Province cities (Nanchang, Jiujiang, Ji’an, Xinyu, and Ganzhou) using sulfur oxidation ratio (SOR = n-SO42−/(n-SO42− + n-SO2)) and nitrogen oxidation ratio (NOR = n-NO3-/(n-NO3− + n-NO2)) (Truex et al., 1980; Pierson et al., 1979). All cities exhibited SOR (0.14–0.31) and NOR (0.13–0.29) values exceeding the classical threshold of 0.1 (Huang et al., 2016; Wang et al., 2005), indicating significant secondary conversion of SO2 and NO2 into ionic species. Notably, Jiujiang and Ganzhou demonstrated the most prominent oxidation activity, with SOR values both reaching 0.31 and NOR values peaking at 0.29 (Jiujiang) and 0.22 (Ganzhou), suggesting intensified atmospheric oxidation capacity in these regions. In contrast, Nanchang showed moderate sulfur oxidation (SOR = 0.14) and the lowest NOR (0.13), approaching the lower threshold limit. These spatial disparities highlight province-wide secondary conversion of gaseous precursors, while the elevated SOR/NOR in Jiujiang and Ganzhou likely reflects stronger photochemical reactions driven by localized factors such as industrial emissions and meteorological conditions, which may dominate fine particulate matter formation in these areas.
Supplementary Figure S6 demonstrates pronounced spatial heterogeneity in PM2.5 water-soluble ion compositions across cities in Jiangxi Province, reflecting regional differences in pollution mechanisms. All cities exhibit strong correlations between NH4+ and NO3− (R > 0.9), suggesting their coexistence as ammonium nitrate (NH4NO3). This observation likely aligns with the thermodynamic formation conditions of NH4NO3, where mobile-source NOx and multi-source NH3 emissions (industrial, biomass burning, or agricultural volatilization) coexist, enabling sufficient atmospheric NH3 to neutralize HNO3 and form NH4NO3 (Deng et al., 2016; Wei et al., 2023). For Xinyu and Ganzhou, the robust NH4+- SO42− correlations (R > 0.85) highlight the tendency of these ions to combine as ammonium sulfate ((NH4)2SO4) (Huang et al., 2012; Zhang et al., 2011). Such secondary inorganic aerosols typically form under NH3-rich ambient (from industrial or agricultural emissions), where NH3 neutralizes sulfuric acid derived from SO2 oxidation-a process closely linked to coal combustion and industrial sulfur emissions (Li et al., 2013; Zhao et al., 2011). In Pingxiang, the high correlation between Na+ and Ca2+ (R = 0.88) indicates synchronized variations of crustal elements, consistent with dust sources (e.g., construction dust or soil resuspension) (Tu et al., 2022). Meanwhile, Ji’an’s strong Na+-Mg2+ correlation (R = 0.98) likely reflects similar contributions from soil and dust (Tu et al., 2022).
3.1.3 Carbonaceous aerosols
Carbonaceous aerosols in PM2.5, including elemental carbon (EC, from incomplete combustion) and organic carbon (OC, from oxidized organic compounds) (Huang et al., 2012; Zhang et al., 2011), were analyzed across six cities in Jiangxi Province (Supplementary Tables S1–S6). OC concentrations (μg/m3) ranked as Nanchang (10.78) > Ji’an (9.41) > Pingxiang (9.35) > Xinyu (7.05) > Ganzhou (7.02) > Jiujiang (5.34), while EC levels were highest in Nanchang (2.38) and lowest in Jiujiang (1.46). OC accounted for 9%–19% of PM2.5 (peaking in Ji’an), whereas EC contributed ≤5%, indicating OC’s dominance. Elevated OC/PM2.5 ratios in Nanchang and Ji’an suggest stronger biomass burning or secondary organic aerosol impacts, contrasting with lower ratios in Jiujiang and Xinyu, likely linked to non-combustion sources or atmospheric dispersion (Huang et al., 2012; Zhang et al., 2011).
3.2 PMF source analysis
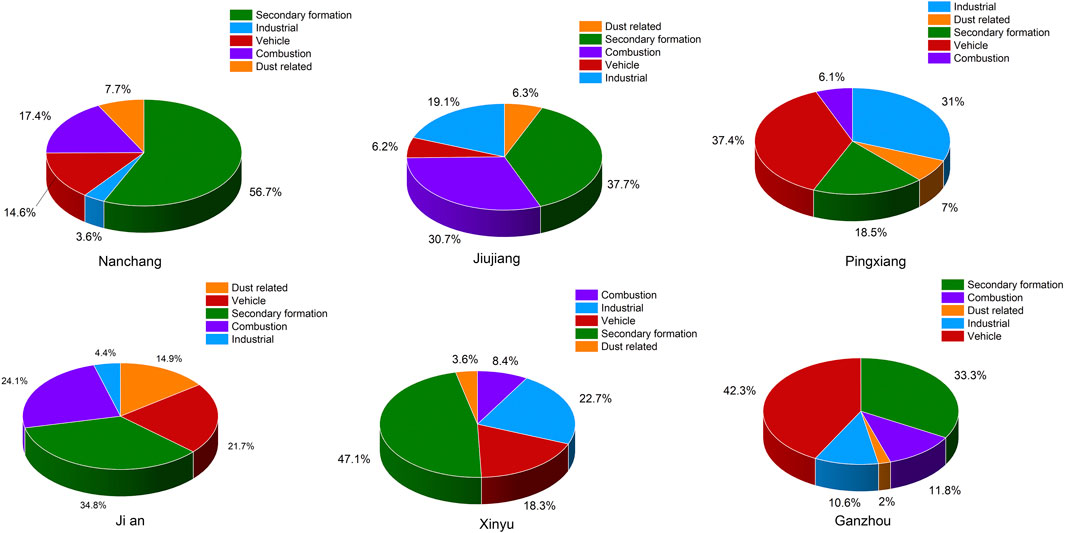
A source apportionment study of PM2.5 in six cities of Jiangxi Province using the PMF model revealed significant spatial heterogeneity in pollution source contributions (Figure 4; Supplementary Figure S7), particularly in secondary formation sources, coal/biomass combustion, industrial and vehicle emissions. Nanchang exhibited the highest contribution from secondary formation sources (56.7%), far exceeding other cities (Jiujiang: 37.7%, Pingxiang: 18.5%, Xinyu: 47.1%), driven by intensive industrial emissions of SO2/NOx and agricultural NH3 (Park et al., 2022). Combustion showed a north-south divergence: northern cities like Nanchang (17.4%) and Jiujiang (30.7%) had higher coal-related contributions, while central cities (Pingxiang, Xinyu) displayed mixed combustion sources (biomass and coal combustion). Pingxiang’s combustion profile, characterized by elevated arsenic (As) concentrations (Ji et al., 2019; Zhu et al., 2016; Ryoo et al., 2024), indicated coal and industrial co-pollution (Hsu et al., 2016; Duan et al., 2012).
Industrial sources varied regionally: Pingxiang (31%) and Xinyu (22.7%) showed the highest contributions, with Pingxiang linked to Cu/Cd/Ba and Xinyu to Fe/Ti/Ba. In contrast, Nanchang had the lower industrial contribution (3.6%), reflecting industrial restructuring. OC/EC loadings combined with Zn/Mn elements highlighted diesel vehicle exhaust and road dust resuspension (Cui et al., 2016; Martin et al., 2022). Vehicle emissions followed a “South-high, North-low” pattern, as key contributors of Ganzhou (42.3%), Pingxiang (37.4%), and Ji’an (21.7%). Ji’an dust contribution (14.9%) was linked to local hilly terrain and soil resuspension, both distinct from Gannan’s geographical drivers (Huang et al., 2014; Song et al., 2007; Chen et al., 2016; Liu et al., 2018).
In summary, the PM2.5 pollution in six cities of Jiangxi Province is influenced by secondary formation, yet exhibits significant regional heterogeneity: Northern cities are dominated by secondary pollution (driven by secondary formation and combustion emissions), central regions show secondary production and vehicle stacked emissions, while southern areas feature prominent contributions from vehicle emissions and secondary formation. These spatial disparities stem from variations in industrial structure, energy consumption patterns, and geographical conditions, necessitating region-specific joint prevention and control strategies.
4 Discussion
4.1 Comparative analysis the differences of components between polluted and non-polluted time
Figure 5 demonstrated the differences in PM2.5 concentrations and regional distribution characteristics between polluted periods (EP1, EP2, EP3) and non-polluted periods (No-EP) for six major cities in Jiangxi Province. Overall, PM2.5 concentrations during polluted period are significantly higher than those in non-polluted periods across all cities. Notably, Nanchang and Jiujiang exhibit the most prominent pollution peaks: the median PM2.5 concentration during EP1 exceeds 100 μg/m3, with extreme values in Nanchang even surpassing the 250 μg/m3 threshold—equivalent to 3.3 times the national daily air quality standard. Ji’an and Ganzhou show slightly lower median concentrations during EP1 (slightly lower than 100 μg/m3), revealed potential risks of short-term extreme pollution. In Pingxiang and Xinyu, the median concentration during EP3 marginally exceeds 75 μg/m3. During No-EP periods, baseline PM2.5 levels in all cities generally remain within the 0–75 μg/m3 range.
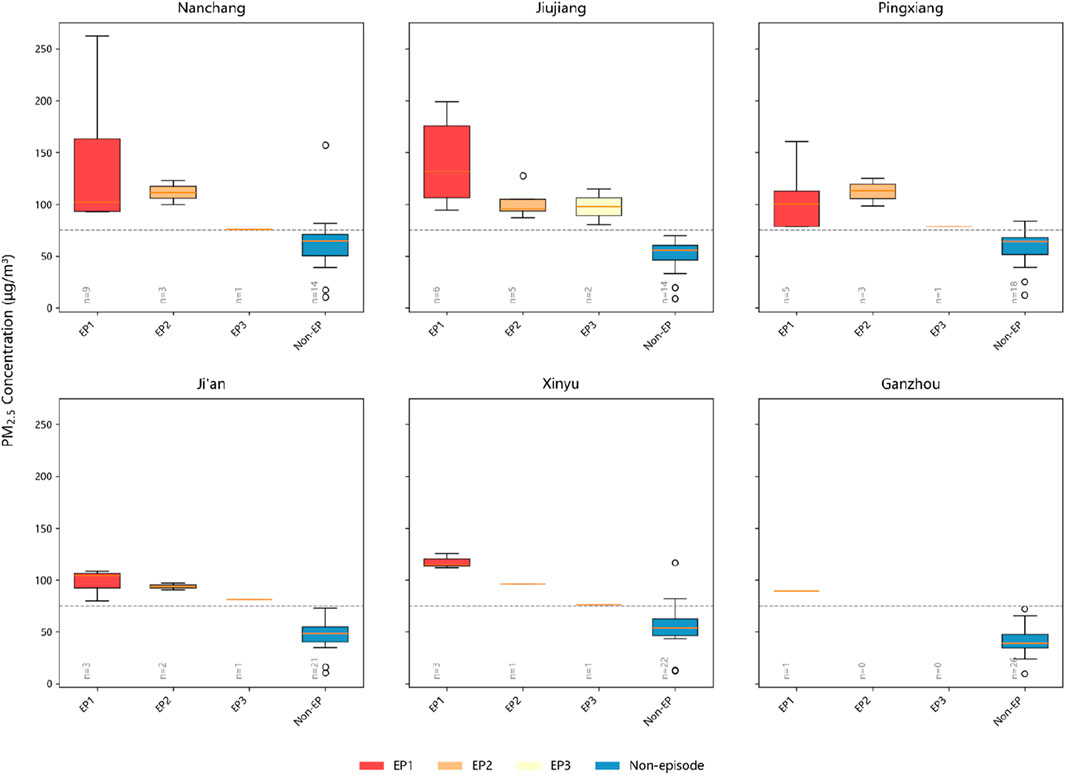
Figure 5. Comparison of PM2.5 concentrations in different cities at different episodes. The dashed line indicates air quality standard of 75 μg/m3.
Inter-city comparisons highlight spatial heterogeneity: Nanchang, as the provincial capital, displays EP1 concentration box plots densely distributed in the high-range interval of 90–260 μg/m3, forming a pollution core zone alongside Jiujiang. This spatial pattern underscores the regional disparities in air quality dynamics under varying pollution scenarios.
From the overall data, the chemical composition of PM2.5 during EP1, EP2, and EP3 pollution episodes in six cities of Jiangxi Province shows significant variations (Figure 6). NO3− and SO42− contributions generally increase during pollution episodes. Jiujiang exhibits particularly prominent NO3− pollution, with EP1 episode reaching 59.6% (the highest proportion in Jiangxi province), and No-EP periods maintaining 44.6%, indicating persistent regional background pollution. Nanchang’s pollution is characterized by NO3− (28.2% in EP2) and organic matter (OM, 35.3% in EP2), while OM surges to 50.04% in EP3, becoming the dominant component. Pingxiang stands out with the highest NH4+ contributions during pollution episodes (EP2:24.9%, EP3:44%).
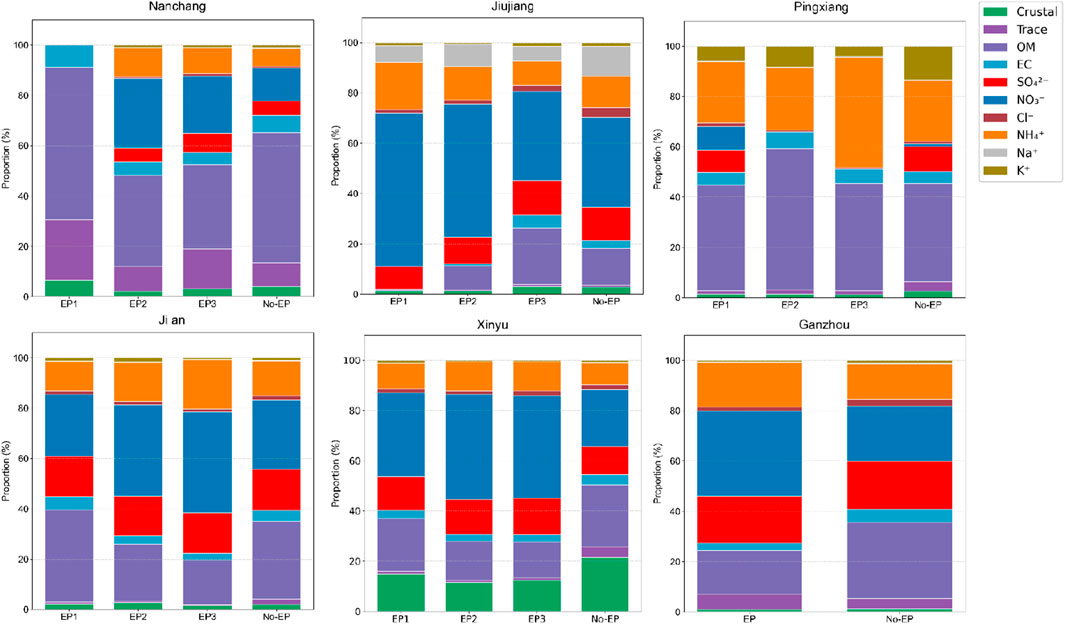
Figure 6. Comparison of polluted and non-polluted PM2.5 fractions in six cities. EP1, EP2, EP3, and No-EP denote polluted episode 1, polluted episode 2, polluted episode 3, and non-polluted period, respectively.
Crustal element contributions vary markedly among cities. Xinyu’s crustal element levels far exceed others, ranging from 11.5% to 13.6% during pollution episodes and comparing with 18.2% in No-EP, highlighting severe local dust issues. Ganzhou’s trace element contribution during pollution episodes (6.1%) exceeds non-polluted period levels (4.5%), suggesting potential industrial emissions. Ji’an maintains stable SO42− contributions (15%–16%) and NO3− levels near 38% in EP2 and EP3, reflecting mixed coal combustion (Zou et al., 2024) and traffic impacts (Zhu et al., 2024). Jiujiang and Xinyu’s high NO3− contributions during pollution episodes (EP1: 60% and EP3:41.9%, respectively) point to industrial and vehicular NOx dominance (Zhu et al., 2024; An et al., 2024).
Inter-city comparisons revealed that secondary inorganic salts (NO3−, SO42−, NH4+) and OM are common features during pollution episodes, but dominant components differ: Nanchang, Jiujiang and Xinyu are NO3− - driven, Pingxiang are OM and NH4+ - driven, while Ganzhou and Ji’an show balanced NO3− and SO42− contributions. The disparities in crustal and trace elements between Xinyu and Ganzhou further underscore how industrial activity types shape regional pollution profiles.
4.2 Regional disparities in PM2.5 sources appointments
The spatial heterogeneity of air pollution in Jiangxi Province is profoundly coupled with the interactive effects of industrial emission structures, geographical environmental characteristics, and secondary chemical transformation pathways. As illustrated in Figure 7, distinct pollution mechanisms exist across cities. In the northern industrial belt, Nanchang exhibits concentrations of NO3− (20.3%) and SO42− (6.4%) primarily driven by coal combustion and vehicle exhaust during non-polluted periods (Debiagi et al., 2021; Zhang et al., 2022), with combustion sources (30.6%) and secondary formation (29.8%) acting synergistically. Influenced by Poyang Lake and the Ganjiang River (Zhang et al., 2024), the elevated humidity during the EP3 phase may have promoted gas-phase reactions, and it is likely that part of the NOx shifted into the aqueous phase to form NO3− (16.3%), possibly catalyzed by dust-associated carriers (e.g., Fe3+) (Zhao et al., 2023; Yu and Jang, 2018). Meanwhile, the sustained release of industrial solvent-related VOCs may have contributed to a consistently high fraction of OM (50.0%) (Nie et al., 2014; Wang et al., 2009).
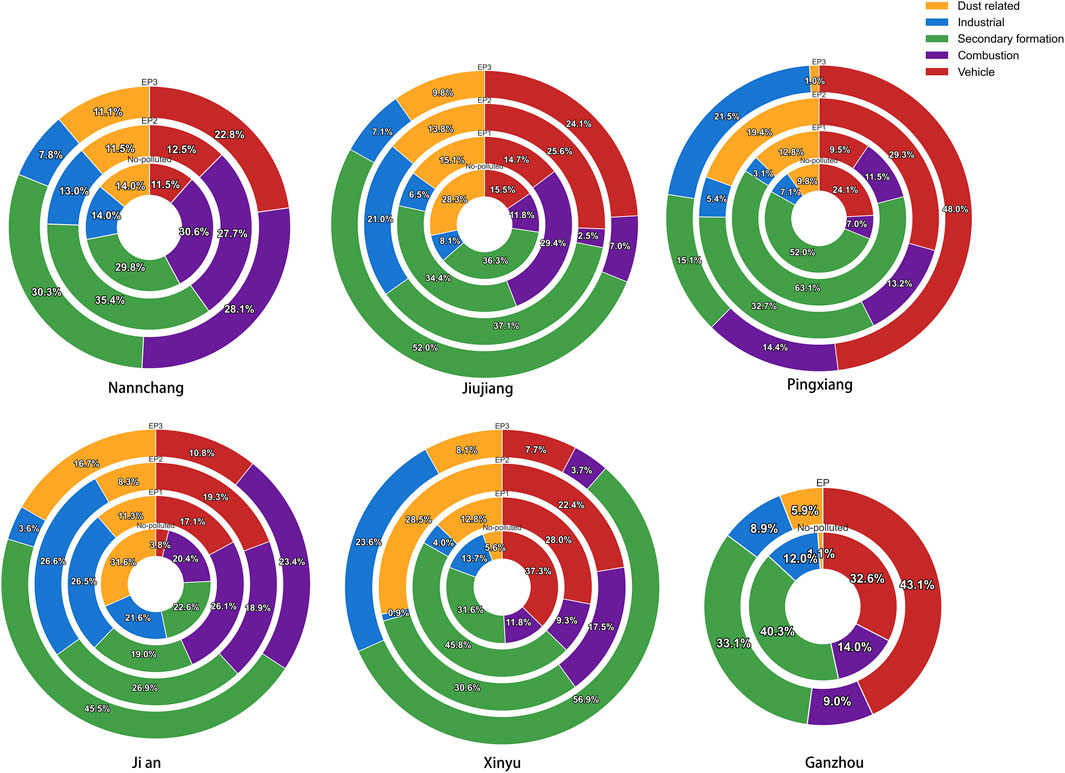
Figure 7. Comparison of PM2.5 sources between polluted and non-polluted episodes in each city. From the inner circle to the outer circle, indicate no-polluted and different polluted time periods, respectively.
In contrast, Jiujiang, a riverside heavy-industrial city, shows combustion source contributions (29.4% in EP1), likely linked to unorganized NOx emissions, reflecting short-term high-intensity industrial point-source patterns (Xu et al., 2023; Wang et al., 2025). During EP3, the SO42− contribution rose from 12.0% to 14.4%, likely due to increased coal-fired industrial SO2 emissions (primarily from steel production), which enhanced secondary formation processes (EP3: 52%) (Zhu et al., 2022; Li et al., 2019; Yang et al., 2024). Xinyu, an inland industrial city, demonstrates unique industrial structure influences: EP3 industrial sources contribute 23.6%, with NO3− dominating (41.9%) from steel industry NOx production (Wang et al., 2019), with dust sources (8.1%) may link to local mineral processing (e.g., ore crushing).
Central agricultural-industrial hybrid cities exhibit further divergence, the share of ammonium (NH4+) soared to 44% in the EP3 phase of Pingxiang, which may be driven by the neutralization of local agricultural ammonia emissions with acidic precursors (HNO3) (Wei et al., 2023). Primary emission bursts from motor vehicles (48%) and industrial sources (21.5%) in the EP3 phase, coupled with suppression of secondary aerosol generation (15.1%), may be attributed to gas-particle partitioning processes where emitted NOx undergoes acid-base neutralization with ambient NH3, forming ammonium salts (NH4+) rather than participating in secondary nucleation pathways (Deng et al., 2016). Whereas Ji’an’s EP3 NO3− dominance (40.1%) seems to combine winter transboundary precursors from the Anhui-Nanchang industrial belt with local vehicle NOx (EP1:17.1%, EP2:19.3%, EP3:10.8%) (Li T. et al., 2024), forming an “external-local” superposition effect. Southern Ganzhou displays region-specific mechanisms: dust sources spike from 1.1% to 5.9% during pollution episodes, and the share of motor vehicle sources increased from 32.6% to 43.1%, which appears to be caused by enhanced northwesterly winds led to long-distance input of peripheral dust, superimposed on the concentrated NOx emissions from local vehicles, and accelerated photochemical reactions to generate NO3−, driven by the strong solar radiation in the Gannan region (Li Y. et al., 2024).
In conclusion, atmospheric pollution in Jiangxi Province may exhibit significant regional differences: the northern industrial zone along the river is centered on the composite pollution of cross-provincial transmission and local industry, Nanchang is likely influenced by secondary formation, and Jiujiang relies on industrial and secondary formation-induced SO42− generation; in the central agro-industrial composite zone, Pingxiang accumulates NH4+ driven by agricultural ammonia, and Ji’an is subjected to the superimposition of exogenous industrial transmission and local vehicle emissions; and in the southern part, Ganzhou is combined by dust and NOx emissions from the local industry to form NO3− pollution.
4.3 Causes of spatiotemporal differentiation of PM2.5 pollution
Jiangxi Province exhibits a distinct spatial differentiation pattern in atmospheric pollution, with gradient differences in pollution component sources and transport mechanisms across its northern, central, and southern regions (Figures 6–8; Supplementary Figure S8). The northern urban cluster is potentially driven by cross-provincial transport. Nanchang, as a representative case, may reveal the superimposed effects of multiple external inputs. During non-pollution periods and the EP1 phase, volatile organic compounds (VOCs) released from biomass burning in northern China could undergo long-distance transport (cluster 3:19%)and secondary transformation (He et al., 2023), combined with mineral surface catalysis from Mongolian dust (cluster 2:6%), significantly increasing the proportion of organic matter (OM) (Nie et al., 2014). In the EP2 phase, its pollution may be primarily influenced by short-range transport of from industrial zones in northern Anhui (cluster 3:65%). The elevated NO3− concentrations are likely linked to regional industrial emissions and local photochemical conversion processes (Yan et al., 2022). This is further supported by PMF results, which indicate a 5.6% increase in the contribution from secondary formation sources during this phase. Nearby cities like Jiujiang and Xinyu also exhibit cross-regional characteristics. During EP3, Jiujiang may experience a surge in SO42− concentrations under the influence of humid air masses from the Poyang Lake (intra-provincial transmission:38%), suggesting enhanced liquid-phase oxidation of sulfur dioxide (SO2) (Liu et al., 2024), as supported by the PMF analysis indicating an increase in the contribution of secondary formation sources from 36.9% to 52%. Xinyu, as an industrial hub, could face dual pressure during EP2 from North China’s steel industry (33% Hebei pathway) and the Yangtze River Delta industrial belt (38% Anhui pathway), leading to a NO3− spike due to combined nitrogen oxide transport. This is consistent with the PMF analysis, which shows a 5.7% increase in the contribution from industrial sources during this phase, further supporting the influence of regional industrial emissions.
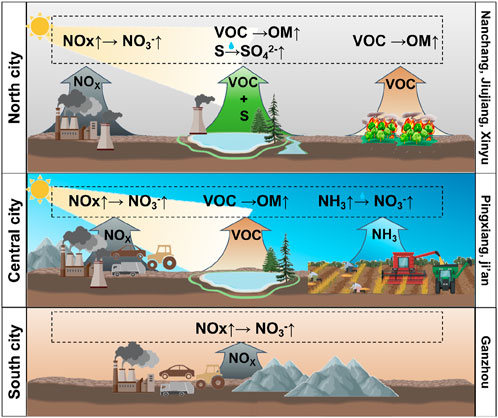
Figure 8. Schematic illustration of PM2.5 source contributions, transformation pathways, and regional transport dynamics during the 2023–2024 winter haze episode in Jiangxi Province.
Central urban cluster exhibits a composite pollution pattern potentially combining agricultural and industrial sources. Pingxiang’s pollution components may be closely influenced by agricultural structure and industrial emissions of Changsha-Zhuzhou-Xiangtan City Group (CZT City Group). During EP3, sustained high NH4+ levels seem to be primarily driven by localized air mass transport (cluster 1:28%), which concentrated NH3 emissions from persistent local livestock, agricultural sources (e.g., fertilization) (Butterbach-Bahl and Dannenmann, 2011) and industrial sources. This transport mechanism facilitated the accumulation and subsequent conversion of NH3 to NH4+ through photochemical and liquid phase chemical reactions, creating a unique phenomenon of prolonged NH4+ enrichment (Cao et al., 2024). In EP2, VOCs from the Yangtze River Delta industrial belt may undergo long-distance transport (cluster 2:28%) and secondary transformation, driving a significant rise in OM (Nie et al., 2014). Ji’an might be constrained by both topography and industrial transport. The topographic blocking effect of the Jitai Basin may trap locally emitted NOx from vehicles during EP2 (intra-provincial transmission: 54%), enhancing photochemical conversion efficiency and triggering a sharp NO3− increase (Duncan et al., 2016; Huang et al., 2017; Lao et al., 2024), which aligns with the PMF analysis indicating a 15.5% increase in motor vehicle source contributions (NOx emissions) and a 4.3% rise in secondary formation sources. By EP3, pollution might shift to NO3− precursors transported along the Ganjiang River from the northern Anhui-Nanchang industrial corridor (cluster 1:44%), reflecting cross-provincial diffusion under winter transport pathways influenced by prevailing winds and valley topography.
Southern region is characterized by interactions between local emissions and topographic regulation. Ganzhou’s pollution evolution may be significantly influenced by the Nanling Mountains’ topographic barrier. Intra-provincial transport dominates during non-polluted periods (Cluster 2, 58%). During polluted episodes, while intra-provincial contributions remain at 50%, NO3− concentrations continue to rise, likely due to stronger solar radiation accelerating the photochemical and liquid-phase transformation of NOx (He et al., 2023), which is consistent with PMF results indicating that motor vehicle sources increased by 10.5%. This forms a unique “southern model,” distinct from the northern cross-provincial transport and central agricultural-industrial hybrid system, creating a three-tier differentiation framework.
The observed spatial heterogeneity in atmospheric pollution across Jiangxi Province appears to be influenced by the chemical composition of pollutants, which is likely governed by the combined effects of local emission sources and regional topographical features. The north is characterized by cross-provincial nitrogen oxides (NOx), OM from VOCs, and SO42− influenced by industrial and biomass emissions, forming a dynamic “NO3−-OM-SO42−” superposition mode dominated by external inputs. The central region exhibits composite pollution from agricultural ammonia (NH4+) and industrially transported NO3− and OM, where pollution from the local agriculture and animal husbandry and industrial NOx/VOCs from the Yangtze River Delta, northern Anhui synergize and CZT City Group under local photochemical and topographic blocking effects, creating an “NH4+- NO3−-OM” tripartite coupling. The south focuses on efficient local conversion of vehicular NOx (to NO3−) regulated by the Nanling Mountains’ topography and solar radiation, with intra-provincial emissions continuously amplifying secondary components through photochemical and liquid-phase reactions, forming a “locally dominant NO3−, weakened external sources” structure. Winter meteorological shifts in transport pathways, combined with dynamic interactions between local emissions and chemical processes, collectively shape Jiangxi’s three-dimensional pollution pattern: cross-provincial dominance in the north, agricultural-industrial hybrid in center, and local-regional interplay in the south.
5 Conclusion
(1) The average PM2.5 concentration across the six cities during the sampling period ranged from 44.1 to 76.9 μg/m3, exceeding the World Health Organization standard (15 μg/m3) by 2.9–5.1 times, highlighting significant regional pollution pressure.
(2) Secondary inorganic aerosols (SNA) and organic matter (OM) dominated the PM2.5 composition, but water-soluble ion contributions varied substantially (21%–67%). Pingxiang exhibited a notably higher SO42−/NO3− ratio (6.91) compared to other cities (0.31–0.75), indicating dominant contributions from stationary sources (coal combustion/industrial activities). In contrast, lower ratios in Nanchang and Jiujiang reflect the increasing contribution of mobile sources in non-industrial cities.
(3) Source apportionment using the PMF model revealed similar PM2.5 source profiles across the six cities. Contributions were ranked as follows: secondary formation (18.5%–56.7%), dust sources (2.0%–14.9%), industrial emissions (3.6%–31%), combustion sources (6.1%–30.7%), and motor vehicle emissions (6.2%–42.3%).
(4) PM2.5 pollution of Jiangxi exhibited a spatial pollution pattern centered on Nanchang and Jiujiang, with significant differences in inorganic ions (SO42−, NO3−, NH4+) and OM during the No-polluted and polluted periods.
(5) Based on the combined analysis of PMF results and PM2.5 component concentrations, we speculate that ambient pollution exhibited distinct regional characteristics across Jiangxi Province during polluted and non-polluted periods. Specifically, Northern riverside industrial area mainly domain by cross-provincial transport and local industrial pollution, such as Nanchang and Jiujiang (secondary formation). The central agricultural and industrial complex area likely influenced by NH4+ accumulation of agricultural ammonia driving, external industrial transmission and local vehicle emissions. In the southern part, the main source of PM2.5 pollution was NOx emissions from local vehicles, which contributed to the formation of NO3−.
(6) Utilizing backward trajectory analysis, we infer that the spatial variation of air pollution in Jiangxi Province is closely linked to the composition of pollution components. The northern city cluster was likely dominated by cross-provincial transmission (NOx), OM derived from VOCs and SO42− influenced via Poyang Lake or marine air mass. Central area showed a combination of agricultural- ammonia and industrially transported NO3−-OM pollution model. Southern region influenced by terrain of Nanling mountain, mainly conversion of vehicle NOx to NO3− in the local area.
Data availability statement
The raw data supporting the conclusion of this article will be made available by the authors, without undue reservation.
Author contributions
QW: Writing – original draft, Visualization, Methodology, Data curation, Investigation, Conceptualization, Validation. WD: Supervision, Conceptualization, Resources, Funding acquisition, Writing – review and editing. XT: Data curation, Writing – review and editing, Funding acquisition. JW: Funding acquisition, Writing – review and editing, Data curation. DH: Writing – review and editing, Resources, Methodology. YG: Writing – review and editing, Supervision, Validation. ZT: Supervision, Conceptualization, Formal Analysis, Writing – review and editing, Resources, Funding acquisition, Project administration. KL: Resources, Funding acquisition, Writing – review and editing.
Funding
The author(s) declare that financial support was received for the research and/or publication of this article. This study was supported by the National Natural Science Foundation of China (42475110), Key R&D Program of Jiangxi Province, China (20243BBH81036) and the special fund of State Key Joint Laboratory of Environmental Simulation and Pollution Control (24Y02ESPCP).
Conflict of interest
The authors declare that the research was conducted in the absence of any commercial or financial relationships that could be construed as a potential conflict of interest.
Generative AI statement
The author(s) declare that no Generative AI was used in the creation of this manuscript.
Publisher’s note
All claims expressed in this article are solely those of the authors and do not necessarily represent those of their affiliated organizations, or those of the publisher, the editors and the reviewers. Any product that may be evaluated in this article, or claim that may be made by its manufacturer, is not guaranteed or endorsed by the publisher.
Supplementary material
The Supplementary Material for this article can be found online at: https://www.frontiersin.org/articles/10.3389/fenvs.2025.1622013/full#supplementary-material
References
Ali, M. A., Huang, Z., Bilal, M., Assiri, M. E., Mhawish, A., Nichol, J. E., et al. (2023). Long-term PM2.5 pollution over China: identification of PM2.5 pollution hotspots and source contributions. Sci. Total Environ. 893, 164871. doi:10.1016/j.scitotenv.2023.164871
An, T. C., Li, J. J., Lin, Q. H., and Li, G. Y. (2024). Ozone formation potential related to the release of volatile organic compounds (VOCs) and nitrogen oxide (NOX) from a typical industrial park in the Pearl River Delta. Environ. Sci Atmos 4, 1229–1238. doi:10.1039/d4ea00091a
Anwar, S., Shameer, M., Alawadhi, H., and Hamdan, N. M. (2024). Source apportionment of PM2.5 and PM10 pollutants near an urban roadside site using positive matrix factorization. Environ. Adv. 17, 100573. doi:10.1016/j.envadv.2024.100573
Baker, M. B., and Peter, T. (2008). Small-scale cloud processes and climate. Nature 451, 299–300. doi:10.1038/nature06594
Butterbach-Bahl, K., and Dannenmann, M. (2011). Denitrification and associated soil N2O emissions due to agricultural activities in a changing climate. Curr. Opin. Env. Sust. 3, 389–395. doi:10.1016/j.cosust.2011.08.004
Cao, Y. B., Wang, X., Zhang, L., Bai, Z., Smith, P., Misselbrook, T., et al. (2024). Ammonium enrichment in livestock manure driven by ammonia-abatement practices can reduce nitrous oxide emissions. One Earth 7, 687–696. doi:10.1016/j.oneear.2024.02.007
Chen, Y., Schleicher, N., Cen, K., Liu, X., Yu, Y., Zibat, V., et al. (2016). Evaluation of impact factors on PM 2.5 based on long-term chemical components analyses in the megacity Beijing, China. Chemosphere 155, 234–242. doi:10.1016/j.chemosphere.2016.04.052
Cui, M., Chen, Y., Tian, C., Zhang, F., Yan, C., and Zheng, M. (2016). Chemical composition of PM 2.5 from two tunnels with different vehicular fleet characteristics. Sci. Total Environ. 550, 123–132. doi:10.1016/j.scitotenv.2016.01.077
Debiagi, P., Yildiz, C., Richter, M., Ströhle, J., Epple, B., Faravelli, T., et al. (2021). Experimental and modeling assessment of sulfur release from coal under low and high heating rates. P Combust. Inst. 38, 4053–4061. doi:10.1016/j.proci.2020.06.121
Deng, X. L., Shi, C. e., Wu, B. w., Yang, Y. j., Jin, Q., Wang, H. l., et al. (2016). Characteristics of the water-soluble components of aerosol particles in Hefei, China. J. Environ. Sci. 42, 32–40. doi:10.1016/j.jes.2015.07.010
Duan, J. C., Tan, J. H., Wang, S. L., Hao, J. M., and Chail, F. H. (2012). Size distributions and sources of elements in particulate matter at curbside, urban and rural sites in Beijing. J. Environ. Sci. 24, 87–94. doi:10.1016/s1001-0742(11)60731-6
Duncan, B. N., Lamsal, L. N., Thompson, A. M., Yoshida, Y., Lu, Z., Streets, D. G., et al. (2016). A space-based, high-resolution view of notable changes in urban NOx pollution around the world (2005–2014). J. Geophys. Res. Atmos 121, 976–996. doi:10.1002/2015jd024121
Guo, E., and Shen, H. G. (2019). Environmental pollution in Shanghai hospital departments in terms of PM. Iran. J. Public Health 48, 764–766.
Hao, Y. H., Zhang, G., Han, B., Xu, X., Feng, N., Li, Y., et al. (2017). Prospective evaluation of respiratory health benefits from reduced exposure to airborne particulate matter. Int. J. Environ. Heal R. 27, 126–135. doi:10.1080/09603123.2017.1292497
He, K., Fu, T., Zhang, B., Xu, H., Sun, J., Zou, H., et al. (2023). Examination of long-time aging process on volatile organic compounds emitted from solid fuel combustion in a rural area of China. Chemosphere 333, 138957. doi:10.1016/j.chemosphere.2023.138957
Hsu, C. Y., Chiang, H. C., Lin, S. L., Chen, M. J., Lin, T. Y., and Chen, Y. C. (2016). Elemental characterization and source apportionment of PM 10 and PM 2.5 in the western coastal area of central Taiwan. Sci. Total Environ. 541, 1139–1150. doi:10.1016/j.scitotenv.2015.09.122
Huang, H., Xu, X., Zou, C., Wu, Y., Wang, C., Li, J., et al. (2025). Contribution of PAHs and NACs to brown carbon light absorption in PM2.5 in Nanchang, Southern China. Atmos. Environ. 343, 121010. doi:10.1016/j.atmosenv.2024.121010
Huang, H., Yin, X., Tang, Y., Zou, C., Li, J., Yu, C., et al. (2023). Seasonal distribution and source apportionment of chemical compositions in PM2.5 in Nanchang, inland area of East China. Atmosphere Basel 14, 1172. doi:10.3390/atmos14071172
Huang, H., Zou, C., Cao, J., Tsang, P., Zhu, F., Yu, C., et al. (2012). Water-soluble ions in PM2.5 on the Qianhu Campus of Nanchang University, Nanchang city: indoor-outdoor distribution and source implications. Aerosol. Air Qual. Res. 12, 435–443. doi:10.4209/aaqr.2011.11.0219
Huang, R. J., Zhang, Y., Bozzetti, C., Ho, K. F., Cao, J. J., Han, Y., et al. (2014). High secondary aerosol contribution to particulate pollution during haze events in China. Nature 514, 218–222. doi:10.1038/nature13774
Huang, T. B., Zhu, X., Zhong, Q., Yun, X., Meng, W., Li, B., et al. (2017). Spatial and temporal trends in global emissions of nitrogen oxides from 1960 to 2014. Environ. Sci. Technol. 51, 7992–8000. doi:10.1021/acs.est.7b02235
Huang, X. J., Liu, Z., Zhang, J., Wen, T., Ji, D., and Wang, Y. (2016). Seasonal variation and secondary formation of size-segregated aerosol water-soluble inorganic ions during pollution episodes in Beijing. Atmos. Res. 168, 70–79. doi:10.1016/j.atmosres.2015.08.021
Jeon, J.-W., Park, S. W., Han, Y. J., Lee, T., Lee, S. H., Park, J. M., et al. (2024). Nitrate formation mechanisms causing high concentration of PM2.5 in a residential city with low anthropogenic emissions during cold season. Environ. Pollut. 352, 124141. doi:10.1016/j.envpol.2024.124141
Jeong, M. J., Hwang, S. O., Yoo, H. J., Oh, S. M., Jang, J., Lee, Y., et al. (2024). Chemical composition and source apportionment of PM2.5 in Seoul during 2018-2020. Atmos. Pollut. Res. 15, 102077. doi:10.1016/j.apr.2024.102077
Ji, P., Song, G. C., Xu, W. T., and Song, Q. (2019). Transformation characteristics of arsenic and lead during coal combustion. Energ Fuel 33, 9280–9288. doi:10.1021/acs.energyfuels.9b02189
Kanakidou, M., Seinfeld, J. H., Pandis, S. N., Barnes, I., Dentener, F. J., Facchini, M. C., et al. (2005). Organic aerosol and global climate modelling: a review. Atmos. Chem. Phys. 5, 1053–1123. doi:10.5194/acp-5-1053-2005
Lao, Q. B., Li, H., Yan, J., Jin, G., He, G., Chen, C., et al. (2024). Hemispherical scale mechanisms of nitrate formation in global marine aerosols. Npj Clim. Atmos. Sci. 7, 139. doi:10.1038/s41612-024-00694-2
Leibensperger, E. M., Mickley, L. J., Jacob, D. J., Chen, W. T., Seinfeld, J. H., Nenes, A., et al. (2012). Climatic effects of 1950-2050 changes in US anthropogenic aerosols - Part 1: aerosol trends and radiative forcing. Atmos. Chem. Phys. 12, 3333–3348. doi:10.5194/acp-12-3333-2012
Li, K. J., Kong, L., Zhanzakova, A., Tong, S., Shen, J., Wang, T., et al. (2019). Heterogeneous conversion of SO2on nano α-Fe2O3: the effects of morphology, light illumination and relative humidity. Environ. Sci. Nano 6, 1838–1851. doi:10.1039/c9en00097f
Li, T., Lou, X., Yang, Z., Fan, C., Gong, B., Xie, G., et al. (2024). Clarifying the impact of engine operating parameters of heavy-duty diesel vehicles on NOx and CO2 emissions using multimodal fusion methods. Sci. Total Environ. 954, 176598. doi:10.1016/j.scitotenv.2024.176598
Li, X. R., Wang, L., Ji, D., Wen, T., Pan, Y., Sun, Y., et al. (2013). Characterization of the size-segregated water-soluble inorganic ions in the Jing-Jin-Ji urban agglomeration: spatial/temporal variability, size distribution and sources. Atmos. Environ. 77, 250–259. doi:10.1016/j.atmosenv.2013.03.042
Li, Y., Ye, C., Ma, X., Tan, Z., Yang, X., Zhai, T., et al. (2024). Radical chemistry and VOCs-NOx-O3-nitrate sensitivity in the polluted atmosphere of a suburban site in the North China Plain. Sci. Total Environ. 947, 174405. doi:10.1016/j.scitotenv.2024.174405
Liu, J. W., Chen, Y., Chao, S., Cao, H., Zhang, A., and Yang, Y. (2018). Emission control priority of PM2.5-bound heavy metals in different seasons: a comprehensive analysis from health risk perspective. Sci. Total Environ. 644, 20–30. doi:10.1016/j.scitotenv.2018.06.226
Liu, Y. Y., Ge, Q., Wang, T., Zhang, R., Li, K., Gong, K., et al. (2024). Strong electric field force at the air/water interface drives fast sulfate production in the atmosphere. Chem. Us 10, 330–351. doi:10.1016/j.chempr.2023.09.019
Lu, F., Xu, D., Cheng, Y., Dong, S., Guo, C., Jiang, X., et al. (2015). Systematic review and meta-analysis of the adverse health effects of ambient PM2.5 and PM10 pollution in the Chinese population. Environ. Res. 136, 196–204. doi:10.1016/j.envres.2014.06.029
Ma, Z. W., Liu, R. Y., Liu, Y., and Bi, J. (2019). Effects of air pollution control policies on PM2.5 pollution improvement in China from 2005 to 2017: a satellite-based perspective. Atmos. Chem. Phys. 19, 6861–6877. doi:10.5194/acp-19-6861-2019
Martin, J. W., Salamanca, M., and Kraft, M. (2022). Soot inception: carbonaceous nanoparticle formation in flames. Prog. Energ.Combust. 88, 100956. doi:10.1016/j.pecs.2021.100956
Myhre, G., Samset, B. H., Schulz, M., Balkanski, Y., Bauer, S., Berntsen, T. K., et al. (2013). Radiative forcing of the direct aerosol effect from AeroCom Phase II simulations. Atmos. Chem. Phys. 13, 1853–1877. doi:10.5194/acp-13-1853-2013
Nie, W., Ding, A., Wang, T., Kerminen, V. M., George, C., Xue, L., et al. (2014). Polluted dust promotes new particle formation and growth. Sci. Rep. 5, 6634. doi:10.1038/srep06634
Paatero, P., Eberly, S., Brown, S. G., and Norris, G. A. (2014). Methods for estimating uncertainty in factor analytic solutions. Atmos Meas. Tech. 7, 781–797. doi:10.5194/amt-7-781-2014
Park, J., Kim, H., Kim, Y., Heo, J., Kim, S. W., Jeon, K., et al. (2022). Source apportionment of PM2.5 in Seoul, South Korea and Beijing, China using dispersion normalized PMF. Sci. Total Environ. 833, 155056. doi:10.1016/j.scitotenv.2022.155056
Peng, Z., Wang, H., Zhang, M., Zhang, Y., Li, L., Li, Y., et al. (2025). Analysis of aerosol chemical components and source apportionment during a long-lasting haze event in the Yangtze River Delta, China. J. Environ. Sci. 156, 14–29. doi:10.1016/j.jes.2024.06.023
Pierson, W. R., Brachaczek, W. W., and Mckee, D. E. (1979). Sulfate emissions from catalyst-equipped automobiles on the highway. Japca J. Air Waste Ma 29, 255–257. doi:10.1080/00022470.1979.10470790
Pope, C. A., Muhlestein, J. B., May, H. T., Renlund, D. G., Anderson, J. L., and Horne, B. D. (2006). Ischemic heart disease events triggered by short-term exposure to fine particulate air pollution. Circulation 114, 2443–2448. doi:10.1161/circulationaha.106.636977
Ryoo, I., Ren, L., Li, G., Zhou, T., Wang, M., Yang, X., et al. (2024). Effects of seasonal management programs on PM2.5 in Seoul and Beijing using DN-PMF: collaborative efforts from the Korea-China joint research. Environ. Int. 191, 108970. doi:10.1016/j.envint.2024.108970
Song, Y., Tang, X., Xie, S., Zhang, Y., Wei, Y., Zhang, M., et al. (2007). Source apportionment of PM2.5 in Beijing in 2004. J. Hazard Mater 146, 124–130. doi:10.1016/j.jhazmat.2006.11.058
Truex, T. J., Pierson, W. R., and Mckee, D. E. (1980). Sulfate in diesel exhaust. Environ. Sci. Technol. 14, 1118–1121. doi:10.1021/es60169a013
Tu, X., Fang, X., Fang, H., Ye, C., Liu, Z., Jia, X., et al. (2022). Chemical composition characteristics and source apportionment of PM2.5 in ceramic industrial base during winter. Aerosol Air Qual. Res. 22, 210390. doi:10.4209/aaqr.210390
Wang, H. L., Zhu, B., Shen, L., Xu, H., An, J., Xue, G., et al. (2015). Water-soluble ions in atmospheric aerosols measured in five sites in the Yangtze River Delta, China: size-fractionated, seasonal variations and sources. Atmos. Environ. 123, 370–379. doi:10.1016/j.atmosenv.2015.05.070
Wang, Q. N., Song, H., Dong, H., Guo, S., Yao, M., Wan, Y., et al. (2024). Multiphase radical chemical processes induced by air pollutants and the associated health effects. Environ. Health-Wash 3, 1–13. doi:10.1021/envhealth.4c00157
Wang, X. F., Zhang, Y., Chen, H., Yang, X., Chen, J., and Geng, F. (2009). Particulate nitrate formation in a highly polluted urban area: a case study by single-particle mass spectrometry in Shanghai. Environ. Sci. Technol. 43, 3061–3066. doi:10.1021/es8020155
Wang, X. Y., Lei, Y., Yan, L., Liu, T., Zhang, Q., and He, K. (2019). A unit-based emission inventory of SO2, NOx and PM for the Chinese iron and steel industry from 2010 to 2015. Sci. Total Environ. 676, 18–30. doi:10.1016/j.scitotenv.2019.04.241
Wang, Y., Zhuang, G., Tang, A., Yuan, H., Sun, Y., Chen, S., et al. (2005). The ion chemistry and the source of PM2.5 aerosol in Beijing. Atmos. Environ. 39, 3771–3784. doi:10.1016/j.atmosenv.2005.03.013
Wang, Y., Zhuang, G., Zhang, X., Huang, K., Xu, C., Tang, A., et al. (2006). The ion chemistry, seasonal cycle, and sources of PM2.5 and TSP aerosol in Shanghai. Atmos. Environ. 40, 2935–2952. doi:10.1016/j.atmosenv.2005.12.051
Wang, Y. T., Zhang, Y., Li, X., and Cao, J. J. (2021). Refined source apportionment of atmospheric PM2.5 in a typical city in northwest China. Aerosol Air Qual. Res. 21, 200146. doi:10.4209/aaqr.2020.04.0146
Wang, Y. X., Xu, W., Liu, Z., Shan, Y., Chen, W., Zhang, X., et al. (2025). Unveiling the mechanism of CO-SCR reaction over Ir/SiO2 catalyst in the presence of multiple components (CO, O2, SO2). Appl. Catal. B-Environ 366, 125066. doi:10.1016/j.apcatb.2025.125066
Wei, Y. T., Tian, X., Huang, J., Wang, Z., Huang, B., Liu, J., et al. (2023). New insights into the formation of ammonium nitrate from a physical and chemical level perspective. Front. Env. Sci. Eng. 17, 137. doi:10.1007/s11783-023-1737-6
Xu, Y., Zhang, W. S., Huo, T. F., Streets, D. G., and Wang, C. (2023). Investigating the spatio-temporal influences of urbanization and other socioeconomic factors on city-level industrial NOx emissions: a case study in China. Environ. Impact Asses 99, 106998. doi:10.1016/j.eiar.2022.106998
Yan, Y. L., Duan, X., Xie, K., Peng, L., Xu, Y., Niu, Y., et al. (2022). Effectiveness of synergistic abatement for emissions of NOX and NH3 to mitigate nitrate-dominated aerosols in a typical city, northern China. Atmos. Environ. 289, 119325. doi:10.1016/j.atmosenv.2022.119325
Yang, H., Yang, W., Nan, X., Tang, N., and Han, C. (2024). Significantly surfactant-enhanced photochemical conversion of SO2 to sulfates on photosensitive substances. J. Environ. Sci. 156, 539–548. doi:10.1016/j.jes.2024.10.014
Yin, X., Rao, Y., Tang, L., and Zhang, Y. (2025). Aerosol chemical composition and sources during unexpected wintertime haze episodes in 2023 in urban Xuzhou of eastern China. Atmos. Pollut. Res. 16, 102451. doi:10.1016/j.apr.2025.102451
Yu, Z. C., and Jang, M. (2018). Simulation of heterogeneous photooxidation of SO2 and NOx in the presence of Gobi Desert dust particles under ambient sunlight. Atmos. Chem. Phys. 18, 14609–14622. doi:10.5194/acp-18-14609-2018
Zhang, T., Cao, J., Tie, X., Shen, Z., Liu, S., Ding, H., et al. (2011). Water-soluble ions in atmospheric aerosols measured in Xi’an, China: seasonal variations and sources. Atmos. Res. 102, 110–119. doi:10.1016/j.atmosres.2011.06.014
Zhang, W. H., Bi, X. H., Zhang, Y. F., Wu, J. H., and Feng, Y. C. (2022). Diesel vehicle emission accounts for the dominate NO source to atmospheric particulate nitrate in a coastal city: insights from nitrate dual isotopes of PM. Atmos. Res. 278, 106328. doi:10.1016/j.atmosres.2022.106328
Zhang, X., Zhang, S., Fang, L., Zhang, C., and Li, X. (2024). The impacts of socioeconomic development and climate change on long-term nutrient dynamics: a case study in Poyang Lake. Sci. Total Environ. 957, 177843. doi:10.1016/j.scitotenv.2024.177843
Zhao, J. P., Zhang, F. W., Xu, Y., and Chen, J. S. (2011). Characterization of water-soluble inorganic ions in size-segregated aerosols in coastal city, Xiamen. Atmos. Res. 99, 546–562. doi:10.1016/j.atmosres.2010.12.017
Zhao, L. Y., Li, T., Przybysz, A., Liu, H., Zhang, B., An, W., et al. (2023). Effects of urban lakes and neighbouring green spaces on air temperature and humidity and seasonal variabilities. Sustain Cities Soc. 91, 104438. doi:10.1016/j.scs.2023.104438
Zheng, B., Tong, D., Li, M., Liu, F., Hong, C., Geng, G., et al. (2018). Trends in China’s anthropogenic emissions since 2010 as the consequence of clean air actions. Atmos. Chem. Phys. 18, 14095–14111. doi:10.5194/acp-18-14095-2018
Zhu, C. Y., Tian, H., Cheng, K., Liu, K., Wang, K., Hua, S., et al. (2016). Potentials of whole process control of heavy metals emissions from coal-fired power plants in China. J. Clean. Prod. 114, 343–351. doi:10.1016/j.jclepro.2015.05.008
Zhu, H. W., Li, C., McCaffery, C., Cao, S., Johnson, K. C., Karavalakis, G., et al. (2024). Emissions from heavy-duty diesel, natural gas, and diesel-hybrid electric vehicles - Part 1. NOx, N2O and NH3 emissions. Fuel 371, 132175. doi:10.1016/j.fuel.2024.132175
Zhu, S. L., Gao, C., Song, K., Gao, W., Guo, Y., and Gao, C. (2022). The changes in spatial layout of steel industry in China and associated pollutant emissions: a case of SO. J. Environ. Manage 302, 114034. doi:10.1016/j.jenvman.2021.114034
Keywords: PM2.5, chemical composition characterization, source appointement, backward trajectory, Jiangxi
Citation: Wang Q, Deng W, Tu X, Wang J, He D, Gong Y, Tan Z and Lu K (2025) Spatial variations in PM2.5 composition and source apportionment across six cities of Jiangxi, China: insights from the 2023–2024 new year haze episode. Front. Environ. Sci. 13:1622013. doi: 10.3389/fenvs.2025.1622013
Received: 02 May 2025; Accepted: 11 June 2025;
Published: 24 June 2025.
Edited by:
Yucong Miao, Chinese Academy of Meteorological Sciences, ChinaCopyright © 2025 Wang, Deng, Tu, Wang, He, Gong, Tan and Lu. This is an open-access article distributed under the terms of the Creative Commons Attribution License (CC BY). The use, distribution or reproduction in other forums is permitted, provided the original author(s) and the copyright owner(s) are credited and that the original publication in this journal is cited, in accordance with accepted academic practice. No use, distribution or reproduction is permitted which does not comply with these terms.
*Correspondence: Wei Deng, d2Vsa3kyMDA5QDE2My5jb20=; Zhaofeng Tan, ei50YW5AcGt1LmVkdS5jbg==
 Qineng Wang1,2
 Zhaofeng Tan
 Keding Lu