 Xiao Wang
 Ailin He3
 Donghui Zhang
 Senhao Liu
- 1Key Laboratory of Ecological Security Monitoring and Governance at Sichuan Minzu College of Sichuan Province, Kangding, China
- 2College of Geographical Science, Qinghai Normal University, Xining, China
- 3College of History and Culture, Sichuan Minzu college, Kangding, China
- 4Institute of Remote Sensing Satellite, China Academy of Space Technology, Beijing, China
- 5School of Microelectronics and Communication Engineering, Chongqing University, Chongqing, China
- 6School of Geography, Development and Environment, The University of Arizona, Tucson, AZ, United States
- 7University of Birmingham, Birmingham, United Kingdom
Introduction: Compound dry-heat exposure is an intensifying climate risk in arid and high-altitude cities, yet its spatiotemporal evolution and drivers are not fully resolved. The Lanzhou–Xining urban agglomeration is a representative hotspot where population exposure and environmental constraints intersect.
Methods: A three-dimensional temperature cube with 305 monthly dry-bulb layers (2000–2025) encodes each pixel as a high-dimensional temporal vector. From this cube, three compound dry-heat indices (CDH1–CDH3) are derived to represent surface thermal intensity, radiative saturation, and hydrothermal imbalance. Six exposure metrics (EXP1–EXP6) quantify demographic, ecological, and infrastructural vulnerability dimensions. Annual XGBoost models with SHAP interpretation are used to attribute exposure dynamics to evolving CDH drivers and to map spatial heterogeneity.
Results: Four coupling regimes are identified: an early temperature-dominated phase (2000–2004), a radiative intensification period (2005–2011), a compound maturation stage (2012–2018), and a post-2019 fragmentation era marked by sharp attribution volatility and strong spatial heterogeneity. CDH3 acts as a latent but volatile disruptor, with pronounced influence on soil-moisture-related exposure (EXP6), whereas CDH2 shows a dominant, structurally embedded role in vegetation-constrained zones. The exposure response exhibits asymmetry and threshold sensitivity across the urban-rural gradient.
Discussion: The findings indicate that dry-heat exposure in Lanzhou–Xining is co-controlled by radiative saturation and hydrothermal imbalance rather than temperature alone. Adaptation should prioritize radiative redistribution, evaporative buffering, and localized risk governance, with policies targeted to regime-specific drivers and spatial heterogeneity.
1 Introduction
As global warming accelerates, the frequency, intensity, and duration of dry–heat events in urban environments are intensifying—posing complex, cumulative risks to public health, energy infrastructure, and urban habitability (Greenway et al., 2023; Coronato et al., 2024; Diykh et al., 2025). Unlike humid heat, which often causes acute thermal discomfort, dry-bulb temperature (T2M) drives latent and structural exposure through persistent sensible heat accumulation, radiative saturation, and evaporative breakdown. These processes often unfold over long temporal scales and embed deeply within land–atmosphere exchanges, vegetation depletion, and built-environment dynamics (Jia J. et al., 2023; Greenway et al., 2025).
While substantial research has focused on wet-bulb temperature (Tw) as a proxy for human thermal limits, relatively few studies have systematically addressed how dry–heat forcing governs population exposure trajectories, particularly in ecologically constrained and topographically enclosed urban systems. This omission is increasingly consequential in semi-arid and alpine regions, where moisture scarcity and surface energy imbalance amplify T2M’s long-term control over heat vulnerability. Moreover, existing assessments often rely on generalized exposure indices or single-threshold exceedance counts, which obscure the multi-dimensional, evolving nature of dry–heat risk formation (Kinoshita et al., 2024; Racine et al., 2024).
The Lanzhou–Xining (LanXi) urban agglomeration, straddling the climatic ecotone between the Loess Plateau and the northeastern edge of the Tibetan Plateau, epitomizes this challenge. With elevation gradients spanning 1,500–4,500 m, sharp aridity transitions, and spatially uneven infrastructure development, LanXi exhibits a precarious balance between rapid urbanization and climatic fragility. In recent decades, intensifying dry–heat forcing has coincided with ecological ventilation decline, vegetative degradation, and urban form densification—leading to a compound vulnerability landscape where thermal stress no longer resides solely in temperature peaks, but in their spatial persistence and systemic entrenchment (Adil et al., 2024; Coffel, 2025). The densely inhabited Hehuang Valley, home to over 80% of the region’s population within a narrow corridor, frequently experiences prolonged periods of anomalous T2M elevation—far exceeding ecological or infrastructural buffering thresholds (Condon et al., 1993; Daryanto et al., 2017).
To address these gaps, we propose that T2M operates not merely as a background climatic parameter, but as a dynamic driver of urban exposure regimes, governing both the spatial reach and functional depth of thermal risk. Unlike discomfort-based metrics, exposure-centric modeling requires a temporalized, mechanism-aware diagnostic system—one that can reveal how multiple forcing pathways converge to modulate vulnerability over time.
Accordingly, this study introduces a multi-stage analytical framework designed to dissect the coupling between dry–heat forcing and structural exposure across the LanXi corridor from 2000 to 2025:
1. T2M data cube construction: We compile a high-resolution, physically consistent archive of monthly T2M fields, forming a 305-layer spatiotemporal tensor (Ruhan et al., 2022a; Ruhan et al., 2022b). This data cube preserves both seasonal continuity and long-term variability, enabling high-dimensional, pixel-level characterization of dry–heat intensity and persistence (Lin et al., 2020; Shreevastava et al., 2023).
2. Spatiotemporal anomaly detection: Building on this cube, we identify geographically anchored deviations and temporally irregular episodes—capturing both persistent spatial stress zones and anomalous heat years that disrupt typical climatic baselines. These compound signals provide an empirical basis for differentiating chronic exposure regions from episodic thermal shocks (Aditya et al., 2019; Bahrami et al., 2021).
3. SHAP-based attribution of exposure mechanisms: We develop a series of annual XGBoost models to quantify the marginal influence of three compound dry–heat indicators (CDH1-3)—representing surface warming, net radiation excess, and hydrothermal disequilibrium—on six normalized exposure indicators (EXP1-6) encompassing urban form, anthropogenic intensity, ecological scarcity, ventilation weakness, and land–water energy imbalance (Cirillo et al., 2017; Liao et al., 2025). SHAP values derived from these models allow temporal stratification of dominant drivers and mechanistic attribution at the pixel scale (Alonso and Renard, 2020).
By integrating dry–heat diagnostics with interpretable machine learning and exposure modeling, this study contributes to three key frontiers:
1. A unified framework for detecting and attributing spatiotemporal exposure under aridification trends,
2. Empirical insights into how specific forcing mechanisms dominate in different years and places, and
3. A scalable template for embedding time-aware learning into climate risk assessments.
Ultimately, our findings offer a mechanism-resolved, temporally explicit diagnosis of dry–heat exposure in one of China’s most climate-sensitive urban corridors—providing both conceptual tools and policy-relevant evidence for adaptive planning in vulnerable, elevation-stratified regions under intensifying thermal regimes.
2 Materials and methods
2.1 The study area
The Lanzhou–Xining Urban Agglomeration (LXUA), officially recognized by China’s National Development and Reform Commission, spans nine prefecture-level cities across Gansu and Qinghai Provinces, covering approximately 97,500 km2 and hosting a population of 11.93 million as of 2016. As depicted in Figure 1, the agglomeration exhibits a spatial configuration comprising a principal development corridor linking Lanzhou, Xining, Haidong, and Dingxi, two urban clusters centered on Lanzhou–Baiyin and Xining–Haidong, and several peripheral ecological–urban nodes, such as Linxia, Gonghe, and Tongren, distributed along the Yellow River basin and the northeastern margins of the Qinghai–Tibet Plateau (Gong et al., 2024; He et al., 2024; Bai et al., 2025).

Figure 1. Geographical and Administrative Scope of the Lanzhou-Xining Urban Agglomeration. Geographic extent and administrative layout of the Lanzhou–Xining Urban Agglomeration, showing major urban nodes, topographic features, and ecological zones relevant to compound dry–heat assessment.
Situated at the transitional zone between the Loess Plateau and the eastern Tibetan Plateau, the LXUA is characterized by steep elevation gradients (1,500–4,500 m) and strong climatic heterogeneity (Huali et al., 2020; Jia Z. et al., 2023; Li et al., 2024). This geographic context gives rise to complex thermal environments, shaped by both continental aridity and high-altitude cooling influences. The Hehuang Valley, which concentrates over 80% of the regional population within less than one-third of the land area, is particularly prone to intensified summer heat. Here, elevated land surface temperatures, strong solar forcing, and reduced evaporative buffering frequently coincide, forming the basis for dry–hot conditions with limited atmospheric relief (Tong and Shi, 2020; Ren et al., 2024).
Meanwhile, upland basins such as Gonghe and Haiyan are marked by cold-season aridity and weakened energy exchange, adding to the seasonal asymmetry of thermal exposure. Vegetation sparsity, limited soil moisture, and surface degradation in parts of central Gansu and eastern Qinghai further exacerbate sensible heat accumulation. These interacting factors—combining persistent thermal loading, suppressed latent heat flux, and reduced ecological buffering—underscore the relevance of examining compound dry–heat (CDH) conditions across both spatial and temporal dimensions. Against this backdrop, a refined understanding of CDH patterns is critical for evaluating thermal risks, identifying vulnerable zones, and supporting climate-adaptive urban and ecological planning in this complex alpine–continental interface (Zhang et al., 2023; Zhao et al., 2023).
2.2 Data sources and processing
To support the quantitative analysis of compound dry–heat patterns and population exposure across the Lanzhou–Xining Urban Agglomeration (LXUA), we integrated a suite of multi-source environmental and socio-demographic datasets spanning the period 2000–2024 (Table 1). The dataset selection and processing adhered to the following guiding principles: (1) physical relevance to dry–heat generation or human exposure; (2) high temporal continuity to support trend analysis; and (3) harmonized spatial resolution to enable pixel-wise annual evaluation.
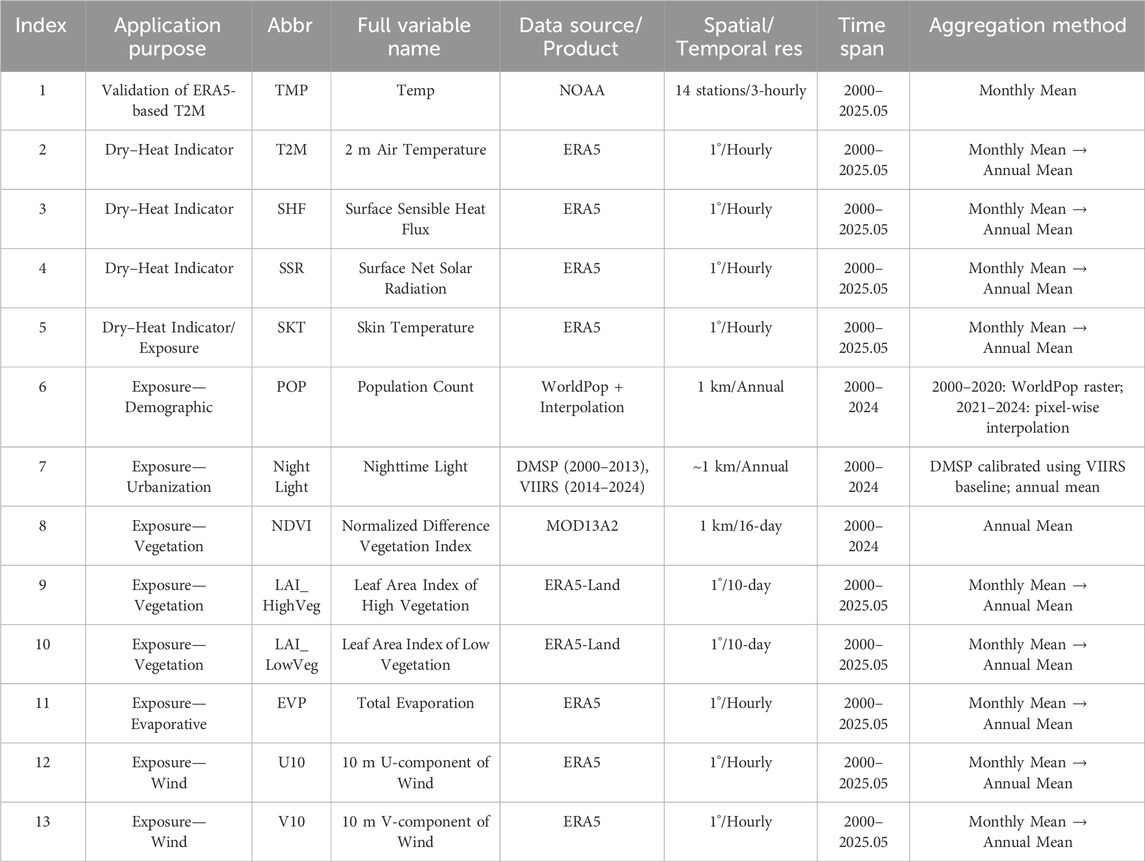
Table 1. Dataset Summary for Composite Dry–Heat and Exposure Indicators in the Lanzhou–Xining Urban Agglomeration. Summary of multi-source environmental and socio-demographic datasets harmonized at 1 km resolution and annual scale (2000–2024) to support composite dry–heat and exposure analysis across the LXUA.
2.2.1 Core dry–heat variable and multi-scale analysis
As the fundamental indicator of atmospheric sensible heat, 2-m air temperature (T2M) from ERA5 reanalysis was selected as the cornerstone variable for dry–heat characterization (Chen et al., 2020; Cvijanovic et al., 2023). Its physical interpretability, extensive temporal coverage (2000–2025.05), and hourly availability enable robust spatiotemporal assessments. T2M was first processed into monthly means for intra-annual dynamics analysis and baseline validation. Subsequently, annual means were derived to construct composite dry–heat indicators that integrate T2M with related surface variables, including skin temperature (SKT), net solar radiation (SSR), surface sensible heat flux (SHF), and total evaporation (EVP). These combinations allow differentiated interpretations of surface thermal accumulation, energy retention, and atmospheric dryness, each normalized or anchored on T2M to ensure comparability (Im et al., 2018).
To evaluate the fidelity of ERA5-derived T2M, we incorporated station-observed temperature (TMP) from the National Oceanic and Atmospheric Administration (NOAA), covering 14 meteorological stations with 3-hourly resolution. After temporal alignment and monthly averaging, this dataset served as an independent benchmark for assessing spatial and temporal consistency in ERA5-based temperature estimates.
2.2.2 Population exposure dimensions and indicator logic
Exposure indicators were designed to reflect multiple facets of population-level vulnerability under compound dry–heat conditions. Specifically, six dimensions were delineated: (1) demographic load (population count, POP) (Barrio-Anta et al., 2020; Chen et al., 2022), (2) urbanization intensity (nighttime light, NTL) (Liu et al., 2019; Zhang et al., 2022), (3) vegetative buffering (NDVI, LAI_HighVeg, LAI_LowVeg) (Anees et al., 2024), (4) evaporative potential (EVP) (Azad et al., 2025), and (5) ventilation capacity (U10, V10) (Bahiraei et al., 2023). These categories are grounded in established exposure theory, capturing both direct stressors (e.g., population density, land surface heat) and modulators (e.g., ecological cover, wind-driven cooling) (Al-Shammari et al., 2024).
Demographic and urbanization data were derived from the WorldPop gridded population dataset and annual DMSP/VIIRS nighttime lights, respectively. WorldPop provides high-resolution population estimates for 2000–2020. For 2021–2024, we performed pixel-wise linear interpolation based on decadal growth trends to generate temporally continuous surfaces. Nighttime light data were sourced from two platforms: DMSP-OLS (2000–2013) and VIIRS-DNB (2014–2024). To ensure inter-sensor consistency, we adopted a cross-sensor radiometric calibration approach, wherein overlapping 2014 observations were used to construct a regression model for adjusting DMSP values to the VIIRS baseline. This harmonization enabled the creation of a consistent 25-year nightlight intensity series, facilitating accurate exposure trend detection.
Vegetation-related indicators were based on MODIS NDVI (MOD13A2) and ERA5-Land LAI, each composited annually from 16-day and 10-day temporal resolutions, respectively. ERA5 wind components (U10, V10) and surface moisture flux (EVP) were also aggregated annually following monthly mean derivation, consistent with the dry–heat variables (Cui et al., 2019).
2.2.3 Data harmonization and temporal structuring
All ERA5-based raster variables (T2M, SKT, SHF, SSR, EVP, U10, V10) were acquired as hourly datasets and processed to monthly means, then to annual means for the period 2000–2024, except for T2M, which was retained in both monthly and annual forms to serve dual roles in temporal diagnostics and index construction. MODIS variables were directly aggregated to annual resolution based on standard quality-screened composites. For gridded products (WorldPop, MODIS, ERA5-Land, VIIRS), all rasters were spatially harmonized to a 1 km resolution using nearest-neighbor or bilinear resampling depending on data type, with a common spatial extent clipped to the LXUA boundary (Yin et al., 2021).
This harmonized and multi-tiered data architecture enables both standalone analysis of dry–heat trends (e.g., monthly evolution of T2M) and integrated modeling of compound stressors and population exposure. The final dataset provides an internally consistent, spatiotemporally continuous basis for assessing coupled climate–human interactions in the arid–alpine context of northwestern China.
To maintain cross-variable consistency in temporal granularity, we restricted the composite analysis to complete calendar years, thereby setting 2024 as the uniform endpoint for all annual indicators.
Period consistency. Annual indicators and all XGBoost–SHAP analyses cover 2000–2024 only. The T2M tensor spans January 2000–May 2025 (T = 305); the 2025.01–05 slice is used only for visualization/diagnostics.
2.3 Algorithm
2.3.1 Construction of a high-dimensional dry-bulb temperature tensor and validation framework
2.3.1.1 High-dimensional modeling and validation of dry-bulb temperature fields
To capture the evolving spatial structure of thermal conditions across the Lanzhou–Xining urban agglomeration, we constructed a monthly dry-bulb temperature (T2M) tensor covering January 2000 to May 2025. This formulation enables a unified representation of seasonal variability, long-term warming, and compound heat signals within a single analytical framework (Aghili et al., 2024; Abdelrahman et al., 2025).
We stacked 305 monthly T2M rasters into a three-dimensional tensor (see Equation 1):
where M and N denote the spatial dimensions and T = 305 is the number of months. Each element
For each grid cell, its temporal evolution is represented as a high-dimensional feature vector (see Equation 2):
This formulation transforms each spatial unit into a temporal profile, capturing local climate dynamics and facilitating downstream tasks such as heat zone segmentation and interannual pattern recognition (Aneece et al., 2024).
To support matrix-based modeling, the tensor was unfolded along the temporal axis (see Equation 3):
This operation retains full temporal information while aligning all spatial pixels into columns, enabling efficient computation of heat signatures, dimensionality reduction, and anomaly detection (Canero et al., 2025).
Altogether, this tensor construction offers a scalable, physically grounded structure for representing dry-bulb temperature. It serves as the analytical basis for compound dry–heat assessment and sets the stage for decomposition-based anomaly identification in the next section.
2.3.1.2 Accuracy assessment and validation of ERA5-Based dry-bulb temperature (T2M)
To ensure the credibility of the ERA5-derived dry-bulb temperature (T2M) cube, we performed an independent validation using in-situ station observations from the NOAA Integrated Surface Database (ISD). The rationale for this choice is twofold. First, NOAA stations provide independent and high-frequency meteorological observations (3-h intervals), making them suitable for benchmarking reanalysis-derived data. Second, the long-term temporal coverage (2000–2025.05) allows for consistent spatial-temporal matching across the full analysis period.
To maintain temporal comparability with the ERA5 monthly composites, the NOAA T (TMP) data were first averaged from 3-hourly to monthly means at each station. These station-based monthly means were then compared to ERA5 T2M values extracted at co-located grid points. Given the relatively coarse resolution of ERA5 (1°), only those NOAA stations falling entirely within urban extents of the study region were retained to ensure land-surface representativeness.
Quantitative validation was conducted using three commonly adopted statistical metrics (see Equations 4–6):
Here,
Together, these metrics assess both systematic bias (MB), random error (RMSE), and the proportion of variance explained (R2), offering a robust evaluation of the reliability of ERA5 T2M data as the core input for composite dry–heat index construction.
Potential biases and representativeness. Despite the strong agreement, residual systematic errors may arise from (i) sparse station coverage and valley/urban siting relative to 1° ERA5 grid cells, (ii) complex alpine–basin topography that induces station–grid representativeness mismatch, and (iii) monthly aggregation that can dampen extremes. These caveats should be considered when interpreting localized anomalies and year-specific spikes.
2.3.2 Spatiotemporal decomposition of monthly T2M patterns
To elucidate hidden structural signals in dry-bulb temperature variability, we adopted a spatiotemporal dissection strategy grounded in anomaly-aware matrix and time-series decomposition. This approach aims to identify both geographically anchored deviations—where grid-level thermal behavior persistently diverges from regional norms—and temporally irregular episodes that disrupt seasonal expectations. Such layered disaggregation enhances our understanding of dry–heat evolution beyond conventional averages, laying a robust empirical foundation for subsequent exposure modeling (Dayan et al., 2016; Xu et al., 2023; Yin et al., 2023).
2.3.2.1 Spatial decomposition of T2M evolution via low-rank-sparse-noise modeling
To elucidate the spatial heterogeneity of dry-bulb temperature (T2M) across the Lanzhou–Xining urban agglomeration, we developed a structural decomposition framework tailored to long-term monthly thermal profiles. Rather than relying on fixed thresholds or conventional anomaly scoring, this approach explicitly models three distinct spatial thermal components—background trend, localized deviation, and residual noise—thus enabling a refined interpretation of urban dry-heat divergence.
We begin with the high-dimensional data cube (Barz et al., 2019), where each slice represents a monthly composite of 2 m air temperature (T2M) from ERA5 between 2000 and mid-2025 (t = 305). The cube was unfolded into a two-dimensional matrix
To isolate distinct sources of thermal variability, we decompose the matrix into three additive components (see Equation 7) (Gilcher et al., 2019; Gavade and Rajpurohit, 2022):
L: a low-rank component capturing the dominant and smooth spatiotemporal patterns shared across the region (e.g., large-scale warming, seasonal harmonics);
S: a sparse component highlighting localized thermal anomalies—pixels that deviate structurally from the regional norm due to surface modification, urban buildup, or terrain blocking;
E: a residual noise matrix, absorbing stochastic disturbances and data uncertainties such as retrieval errors or short-lived meteorological spikes.
This decomposition is formalized via the Robust Principal Component Pursuit with Noise (RPCP-N) optimization (see Equation 8):
Here,
To retain topographic and climatic locality, the decomposition was performed in overlapping spatial blocks (e.g., 64 × 64 km). This localized strategy ensures that deviations are measured relative to their regional thermal context, thereby distinguishing true dry-heat divergences from broader elevation- or latitude-driven trends (Gutflaish et al., 2019).
We further summarize the structural deviation intensity at each pixel using a Thermal Deviation Index (TDI), defined as (see Equation 9):
A high TDI indicates that a pixel consistently diverges from dominant thermal structures, pointing to persistent thermal elevation, dry heat retention, or delayed cooling. These conditions frequently emerge in urban-vegetation transition zones, densely built cores, and valleys with inhibited airflow.
By isolating the spatially coherent, structurally atypical, and randomly fluctuating components of T2M, this decomposition not only maps urban thermal pressure but also lays the analytical foundation for subsequent exposure analysis. In the context of compound dry–heat stress, the sparse component
2.3.2.2 Temporal dynamics and episodic fluctuation detection in pixelwise T2M series
While the low-rank–sparse–noise decomposition highlights spatially persistent patterns in dry-bulb temperature (T2M), localized short-term fluctuations—such as abrupt heat surges or delayed cooling—often drive the most acute impacts on human thermal exposure. These episodic deviations, which may occur independently of long-term trends, reflect dynamic processes like anomalous radiation bursts, dry föhn winds, or suppressed ventilation that are particularly consequential in semi-arid alpine basins (Aguilar et al., 2018; Acharki et al., 2023).
To isolate such events, we extracted each pixel's monthly T2M sequence and applied Seasonal–Trend decomposition using Loess (STL). Formally, the signal is decomposed into three additive components (see Equation 10):
where:
We define temporal anomalies as significant outliers in the residual component using a local adaptive threshold (see Equation 11):
Here,
To ensure analytical focus, this temporal analysis is restricted to pixels previously flagged for structural divergence in spatial decomposition, thereby targeting areas with compounded thermal irregularities. By integrating long-term spatial anomalies with short-term temporal irregularities, the framework provides a nuanced, multi-timescale depiction of T2M-based dry–heat complexity—crucial for modeling discomfort regimes and anticipating exposure hotspots under future climate scenarios (Chen and Cao, 2022; Chen et al., 2024).
The overall analytical procedure is summarized in Figure 2, which illustrates the sequential decomposition of spatially structured deviations and temporally emergent anomalies from the monthly T2M cube (Chakhar et al., 2022).
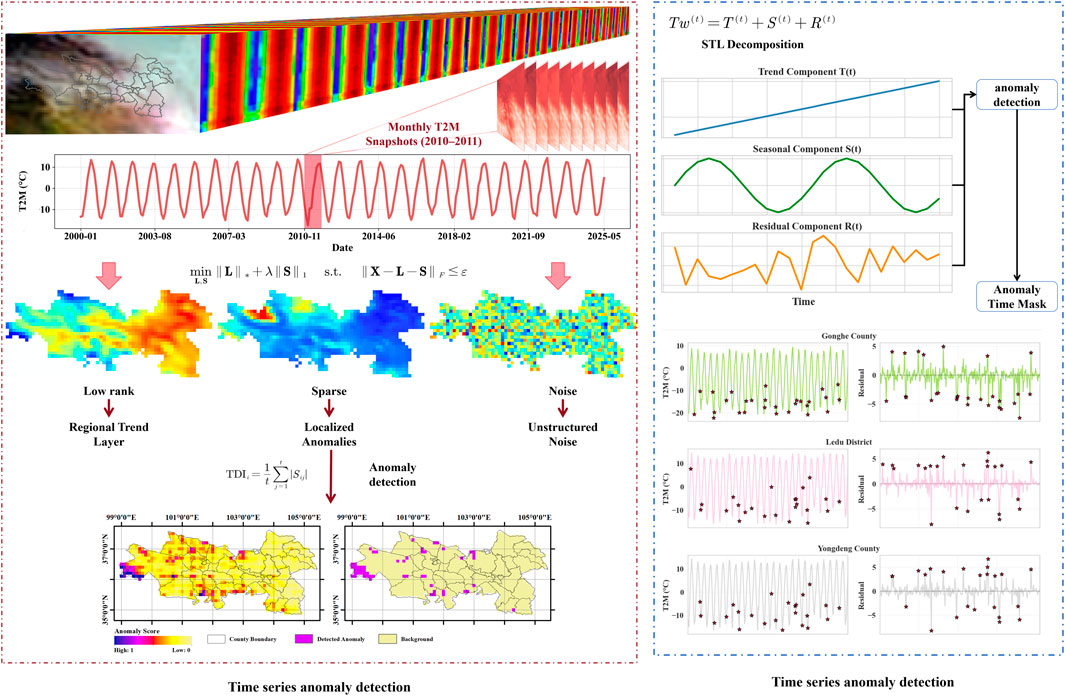
Figure 2. Spatiotemporal Decomposition Framework for Urban Dry-Heat Divergence. Spatiotemporal framework illustrating the sequential decomposition of long-term structural divergence and short-term episodic anomalies in monthly T2M series across the LXUA, supporting multi-timescale dry–heat diagnostics.
2.3.3 Modeling the drivers of compound dry–heat exposure
To disentangle the underlying mechanisms of compound dry–heat exposure across the Lanzhou–Xining urban agglomeration, we developed a multi-stage modeling framework linking dry–heat stress intensity with population-based vulnerability. Unlike wet-bulb temperature, which reflects the synergistic effects of temperature and humidity, dry–heat stress is primarily driven by radiative forcing, surface–air thermal disequilibrium, and suppressed evaporative cooling. As such, understanding its spatial distribution and evolution requires targeted modeling of both environmental forcing and exposure dynamics.
The objective of this framework is to reveal how environmental and anthropogenic conditions jointly shape dry–heat exposure risk. Specifically, we focus on how structural features—such as radiative load, vegetation cover, wind ventilation, and urban activity—modulate compound dry–heat indicators (CDH), and how these in turn interact with demographic exposure proxies (EXP). This enables dynamic vulnerability profiling across space and time.
2.3.3.1 Annual regression modeling of compound dry–heat intensity
For each year from 2000 to 2024, we trained a pixel-level regression model to predict annual composite dry–heat intensity; the predictive function is denoted as (see Equation 12):
where
The predictor is learned using the XGBoost algorithm, optimized under a regularized objective (see Equation 13):
Here,
2.3.3.2 Attribution analysis via SHAP interpretation
To interpret the regression outputs, we employed SHapley Additive exPlanations (SHAP) to decompose each pixel's predicted value into feature-wise contributions (see Equation 14):
where
2.3.3.3 Construction and role of functional indicators
To enhance model interpretability and reflect compound environmental mechanisms, we developed a suite of functionally derived indicators bridging raw variables and dry–heat exposure outcomes. These indicators integrate multi-source environmental data into physically grounded composites, capturing key aspects such as thermal disequilibrium, radiative forcing, and ecological or ventilation-related mitigation capacity (see Table 2).
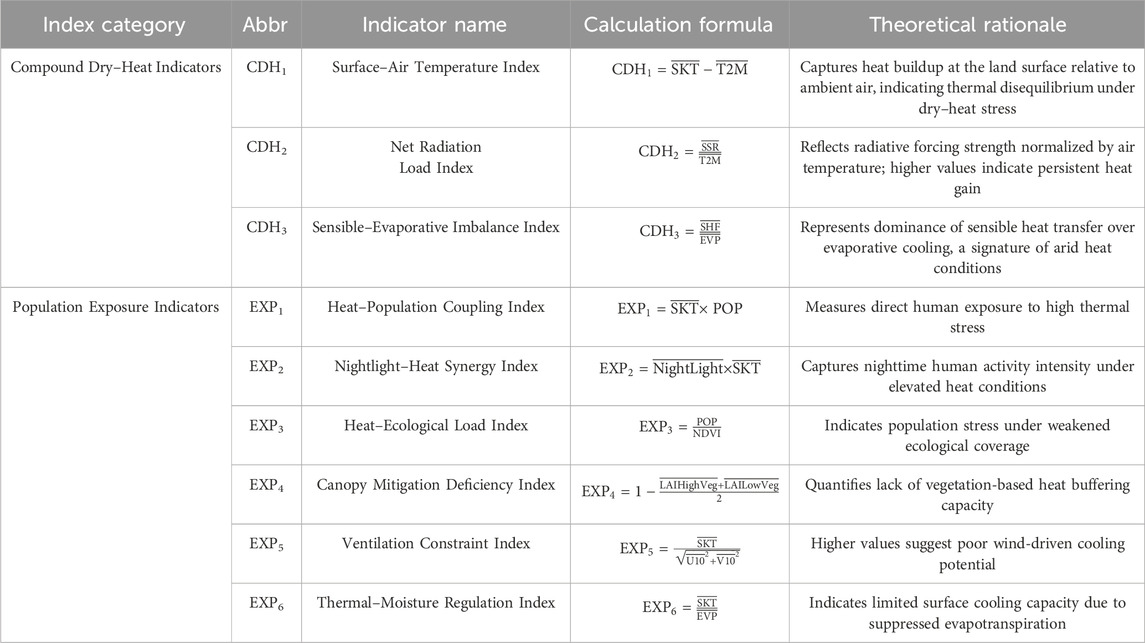
Table 2. Formulation of Compound Dry–Heat and Population Exposure Indicators Based on Multi-Source Environmental Variables. Summary of composite functional indicators integrating multi-source environmental variables to model compound dry–heat intensity and population exposure, enhancing interpretability and supporting SHAP-based attribution across spatial and temporal scales.
Rather than relying on isolated predictors, this approach characterizes compound risk profiles shaped by both environmental forcing and exposure vulnerability. For example, two areas with similar dry–heat intensity may differ significantly in their dominant stressors—be it dense population, weakened vegetation, or impaired ventilation. Incorporating these indicators into the regression model enabled finer attribution of risk dynamics and revealed shifting exposure patterns through SHAP-based interpretation.
This indicator-driven framework supports both diagnostic insight and policy relevance, allowing targeted differentiation between structurally distinct dry–heat vulnerability regimes across the urban agglomeration.
XGBoost hyper-parameters and cross-validation. For each year (2000–2024), we trained a pixel-level XGBoost regressor with the following key settings: tree depth (max_depth) ∈ {3, 4, 5, 6}, learning rate (learning_rate) ∈ {0.05, 0.10}, and number of boosting iterations (n_estimators) ∈ {300, 500, 800} with early stopping (50 rounds). Additional regularization and sampling controls were subsample ∈ {0.7, 0.8}, colsample_bytree ∈ {0.7, 0.8}, and L2 penalty (reg_lambda) ∈ {1.0, 2.0}. Hyper-parameter selection used 5-fold spatial block cross-validation within each year to mitigate spatial leakage while avoiding temporal leakage; a fixed random seed (2025) ensured reproducibility. The final per-year configuration was chosen by the lowest average validation RMSE (see Table 3).
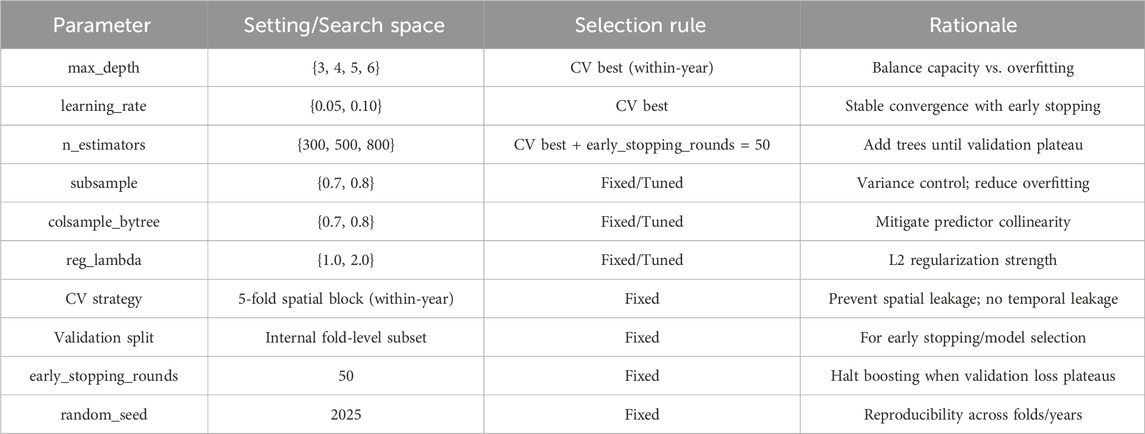
Table 3. XGBoost hyper-parameter configuration and cross-validation strategy. Ranges denote the search space; “CV best” indicates the per-year selection minimizing mean validation RMSE under 5-fold within-year spatial-block CV; fixed values were held constant across folds/years.
3 Results
3.1 Spatiotemporal structure and evolution of regional dry–heat conditions based on T2M tensor analysis
To establish a foundational understanding of long-term dry–heat patterns in the Lanzhou–Xining urban agglomeration, we constructed a three-dimensional T2M tensor by stacking 305 monthly dry-bulb temperature (T2M) raster layers from January 2000 to May 2025. (The January–May 2025 slice is for visualization only; annual modeling and attribution end in 2024.) This spatiotemporal data cube enables pixel-level tracking of temperature evolution across both seasonal and interannual timescales. From this tensor, we extract 24 representative scenes—six benchmark years (2000, 2005, 2010, 2015, 2020, 2024) each sampled at four climatologically salient months (January, April, July, October)—to visualize the structural dynamics of regional thermal conditions (Figure 3).
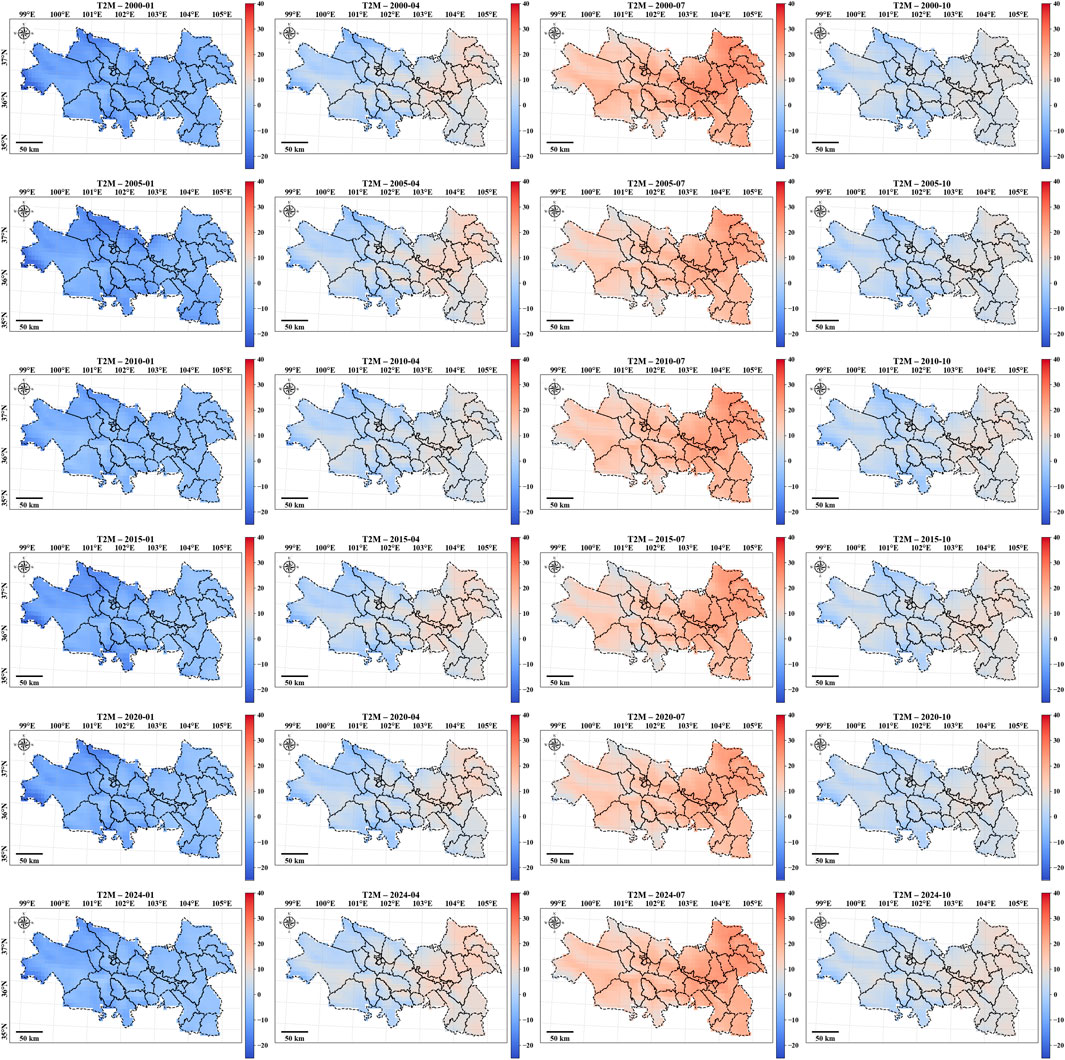
Figure 3. Long-Term Evolution of Monthly Dry-Bulb Temperature (T2M) and Its Statistical Distribution (2000–2025). Spatiotemporal evolution of monthly dry-bulb temperature (T2M) across the LXUA from 2000 to 2025, revealing persistent east–west thermal gradients and intensifying summer heat in lowland basins under ongoing warming trends.
The snapshots reveal pronounced spatial heterogeneity, largely governed by the region’s sharp topographic gradients and land-use mosaics. High-altitude counties in western Qinghai (e.g., Tongde, Guinan) consistently exhibit low T2M values, often falling below freezing in winter, while the eastern Hehuang Valley—encompassing Xining, Haidong, and surrounding basins—presents persistent thermal hotspots, especially during July, with summer T2M exceeding 20 °C. This east–west contrast remains stable across years and seasons, highlighting the entrenched climatic divide shaped by elevation, aridity, and urban heat retention.
Temporally, the tensor-based snapshots uncover a clear warming trajectory, particularly in spring and summer months. From 2000 to 2024, July T2M in low-elevation areas shows a steady increase, with post-2015 warming especially pronounced. These signals suggest a lengthening and intensification of the dry–heat season, consistent with broader climate change and regional land-use intensification.
Moreover, the seasonal amplitude of T2M—defined by the range between winter troughs and summer peaks—is expanding in the valley basins. Notably, summer warming has outpaced winter moderation, indicating asymmetric thermal evolution. Over time, the spatial footprint of high-T2M zones broadens eastward, while winter cold centers in the west remain largely stationary. This divergence underscores an emerging spatial mismatch between exposure intensity and topographic buffering capacity.
In sum, the visualized slices from the T2M tensor highlight both the structural persistence of thermal regimes and their temporal evolution under compounding climatic and anthropogenic forces. These patterns set the stage for subsequent analyses of compound dry–heat exposure and its spatial coupling with population vulnerability across the Lanzhou–Xining corridor.
Departing from the spatial configurations illustrated in Figures 3, 4 presents a temporally integrated lens on dry-bulb temperature (T2M) evolution across the Lanzhou–Xining urban agglomeration. Over 26 consecutive years, the dataset reveals not just seasonal regularity, but a progressive restructuring of thermal patterns that increasingly condition population exposure to dry–heat stress.
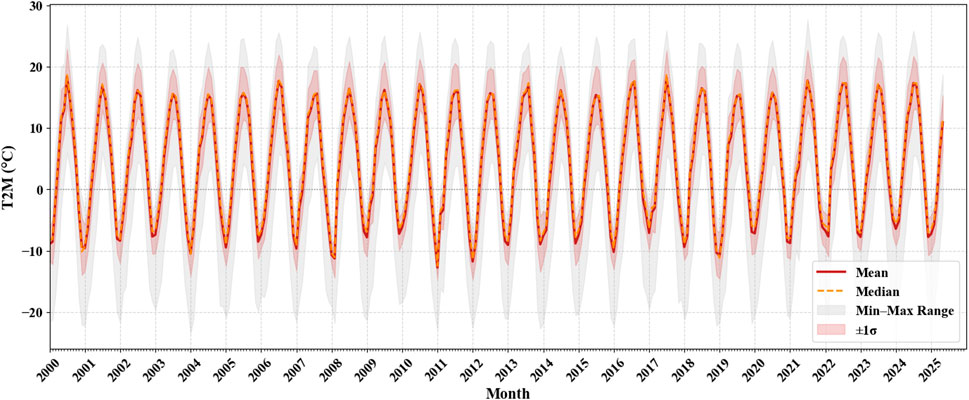
Figure 4. Long-Term Evolution of Regional Dry-Bulb Temperature Statistics in the Lanzhou–Xining Urban Agglomeration (2000–2025). Long-term statistical trends in T2M across the LXUA show expanding thermal variability, asymmetric seasonal warming, and increasing intra-annual extremes—highlighting a shift toward structurally unstable and spatially uneven dry–heat exposure regimes.
First, a steady expansion of the regional thermal envelope becomes evident, particularly after 2010. The widening gap between monthly maxima and minima—most prominent during spring and autumn—reflects growing spatial divergence in surface heating. Lowland basins warm rapidly under intensified radiative forcing, while elevated zones exhibit thermal inertia, producing a stretched distribution of thermal load. Such divergence implies an increasingly uneven geography of thermal exposure, where climatic fragmentation may outpace infrastructural or ecological buffering capacity.
Second, although the mean and median temperature curves remain closely aligned—indicating internal distributional stability—episodic bursts of standard deviation and max–min amplitude emerge. Years such as 2015, 2021, and 2023 register heightened volatility, not simply through average warming, but through coexisting extremes. These dual-mode signals—simultaneous amplification and stagnation—suggest that thermal stress is becoming more structurally unstable, producing compound exposure conditions that defy uniform mitigation strategies.
Third, the seasonal amplitude of T2M has undergone asymmetric intensification. While summer means have advanced steadily upward, winter troughs have warmed marginally if at all, resulting in an elongated and steeper annual thermal curve. This shift compresses the habitable thermal bandwidth, amplifying cumulative exposure during the warm season and redefining the temporal window in which heat-related discomfort and health risks are concentrated.
Collectively, these statistical transformations point not only to warming, but to the emergence of structurally unbalanced and temporally compressed exposure regimes. As dry-bulb temperature becomes increasingly variable, asymmetric, and polarized across both space and time, it reshapes the thermal environment to which populations are exposed—not just in intensity, but in volatility and predictability. These evolving patterns provide critical context for interpreting spatial anomalies and short-term surges, which may no longer represent departures from a stable norm, but rather expressions of a shifting baseline in compound dry–heat risk.
To assess the accuracy and representativeness of ERA5-derived dry-bulb temperature (T2M) across the Lanzhou–Xining urban agglomeration, we conducted an independent validation using station-based temperature observations from NOAA’s Integrated Surface Database. Specifically, 3-hourly 2 m air temperature (TMP) records from 14 meteorological stations were aggregated into monthly means and spatially matched to corresponding ERA5 grid cells for the period 2000–2025.
A total of 586 grid–station paired samples were constructed to ensure spatiotemporal representativeness across diverse elevations, land-use types, and climatic zones. Figure 5 summarizes the validation framework and results. The top-left panel overlays the spatial distribution of the 14 stations on the July 2020 T2M background, illustrating their coverage along key thermal gradients in both valley basins and upland margins. Panels (a)–(d) display four representative stations with the most complete records, highlighting the seasonal alignment between observed TMP (blue) and ERA5 T2M (red). Across different environments, ERA5 consistently captures the magnitude and seasonal dynamics of station-measured temperatures.
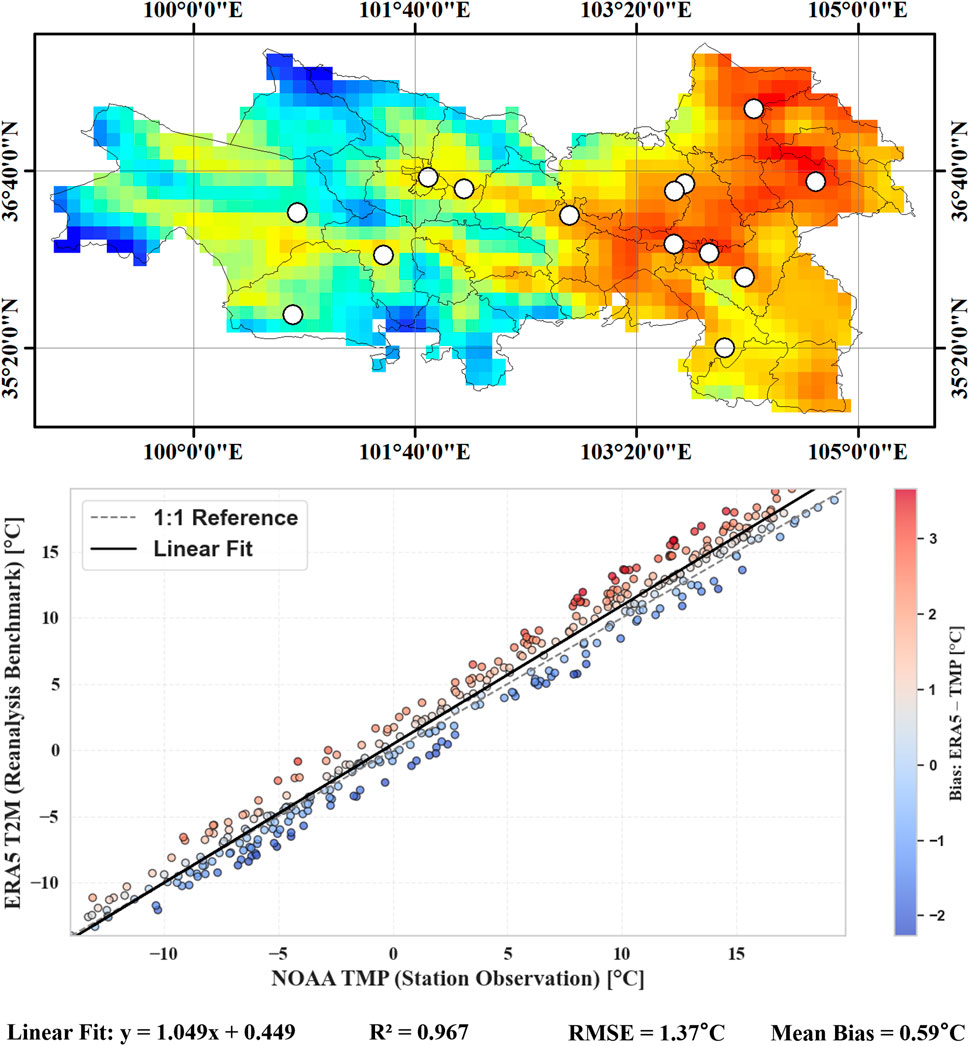
Figure 5. Validation of ERA5-Derived T2M Against NOAA TMP Observations in the Lanzhou–Xining Region. Validation results confirm strong agreement between ERA5-derived T2M and NOAA station TMP data across the LXUA, with high correlation (R2 = 0.967) and low RMSE (1.37 °C), supporting its reliability for dry–heat analysis..
The right panel presents a scatter plot comparing all 586 paired samples, with ERA5-derived T2M values on the y-axis and NOAA TMP benchmarks on the x-axis. The observations show strong linear agreement centered around the 1:1 reference line. Linear regression yields a slope of 1.049 and an intercept of 0.449, indicating a slight upward adjustment across the full temperature range. The coefficient of determination (R2) is 0.967, with a root-mean-square error (RMSE) of 1.37 °C and a mean bias of 0.59 °C. While the agreement is high, station density/siting and complex topography may introduce representativeness errors, so these metrics should be interpreted as domain-level reliability rather than point-exactness.
These validation results demonstrate the high consistency between ERA5 reanalysis temperatures and in-situ observations, confirming the credibility of T2M as a core input for characterizing dry–heat dynamics. The close station–grid agreement supports its downstream application in anomaly decomposition, compound heat index construction, and population exposure analysis across complex alpine–semiarid landscapes.
3.2 Temporal residual structures and localized anomalies in near-surface air temperature
To capture latent thermal anomalies across the Lanzhou–Xining urban agglomeration, we constructed a 305-dimensional thermal signature for each pixel by stacking monthly dry-bulb temperature records. This high-dimensional temporal profile, analogous to a hyperspectral vector, encodes seasonal patterns, long-term shifts, and abrupt perturbations.
Leveraging this structure, we adopted a Low-Rank and Sparse Matrix Decomposition (LRaSMD) framework to separate baseline climatic trends (low-rank) from transient or localized deviations (sparse). Anomaly intensity was quantified via Mahalanobis distance in the sparse subspace, enabling precise localization of statistically significant departures from the regional thermal norm.
Figure 6 illustrates the spatial distribution of these deviations. The left panel presents a continuous anomaly field, where stronger colors denote higher deviation intensities. A clear northwest–southeast gradient is observed: Gonghe, Guide, and Tongren emerge as persistent hotspots with elevated anomaly scores, likely due to topographic confinement, weak ventilation, or altered surface properties. In contrast, eastern and central basins exhibit relatively stable thermal evolution, with low-intensity, spatially diffuse deviations.
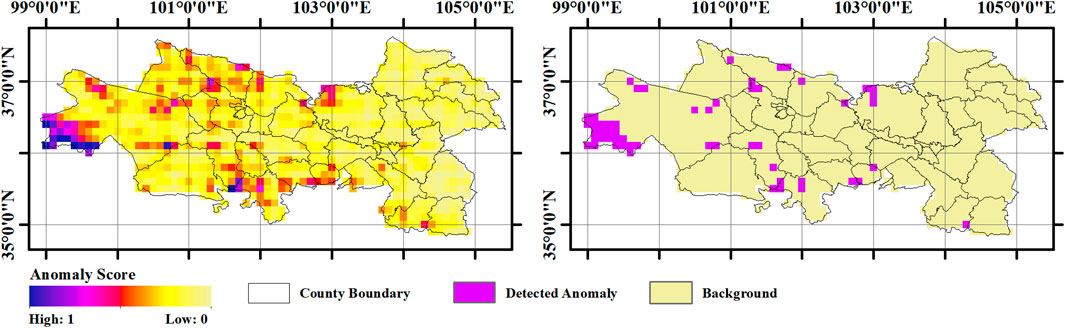
Figure 6. Spatial Mapping of Thermal Deviations Based on High-Dimensional Temporal Profiles Across the Lanzhou–Xining Urban Agglomeration. Left: Continuous anomaly scores derived from sparse residuals of the LRaSMD framework, highlighting regional gradients in thermal deviation intensity. Right: Extracted anomalous pixels (n = 55) identified via Mahalanobis distance thresholding, overlaid with county boundaries for spatial reference.
The right panel extracts 55 anomalous pixels, mapped as discrete thermodynamic outliers. Their spatial distribution is notably non-random—concentrated in elevation breakpoints, valley necks, and hydrological confluence zones, suggesting sensitivity to terrain-induced thermal inertia. Gonghe County dominates with 30 anomalies, both in count and intensity, pointing to structural instability in its local energy balance. Despite fewer counts, Guide and Tongren show mean anomaly scores exceeding 300, indicating intense but spatially focused departures. A statistical summary of anomaly intensity and frequency across counties is provided in Table 4, further illustrating the spatial heterogeneity of thermodynamic disruptions. Scattered anomalies in Huangzhong, Datong, Yongdeng, and Guinan further underscore the heterogeneity of heat response, where even single pixels can reflect localized thermal surges embedded within broader climatic coherence.
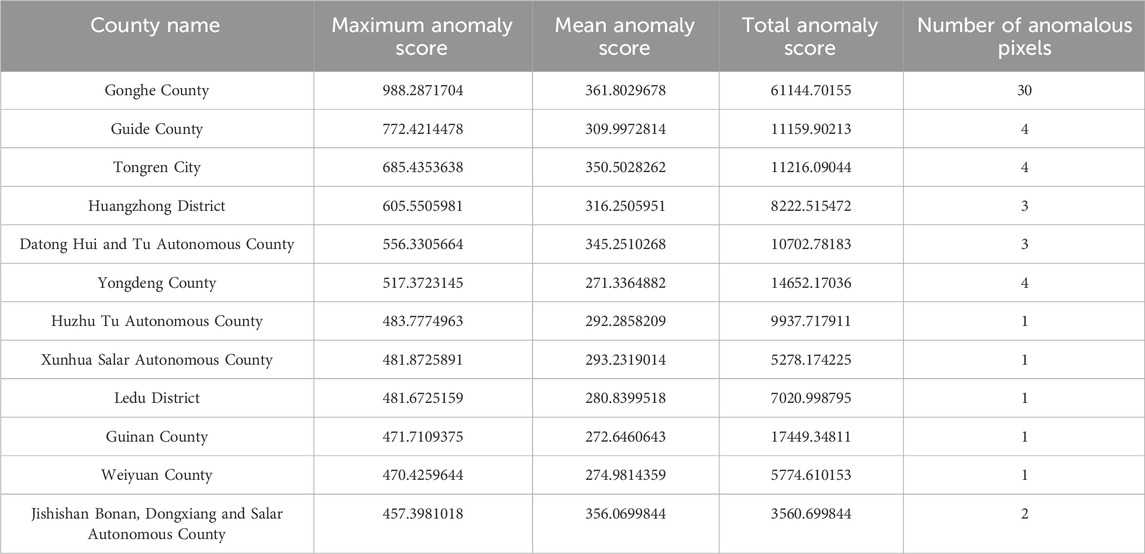
Table 4. Statistical summary of county-level thermal anomalies Identified from High-Dimensional Feature Profiling. Maximum, mean, and cumulative anomaly scores are reported for counties containing at least one anomalous pixel, along with the corresponding pixel count.
Together, this framework transforms conventional time series into a spectrally inspired anomaly landscape, offering fine-grained insights into urban–climate disequilibria. It not only delineates where thermal deviations occur but also reflects how they structurally diverge from expected temporal norms.
To further elucidate the temporal dynamics and anomaly structures of near-surface air temperature (T2M) in the Lanzhou–Xining urban agglomeration, we selected twelve representative grid pixels exhibiting significant interannual irregularities and applied an STL (Seasonal and Trend decomposition using Loess)-based residual analysis. As shown in Figure 7, the T2M time series for each pixel reveals distinct seasonal cycles superimposed with interannual trends and abrupt deviations, while the corresponding residual plots and anomaly flags highlight departures from expected climatic patterns.
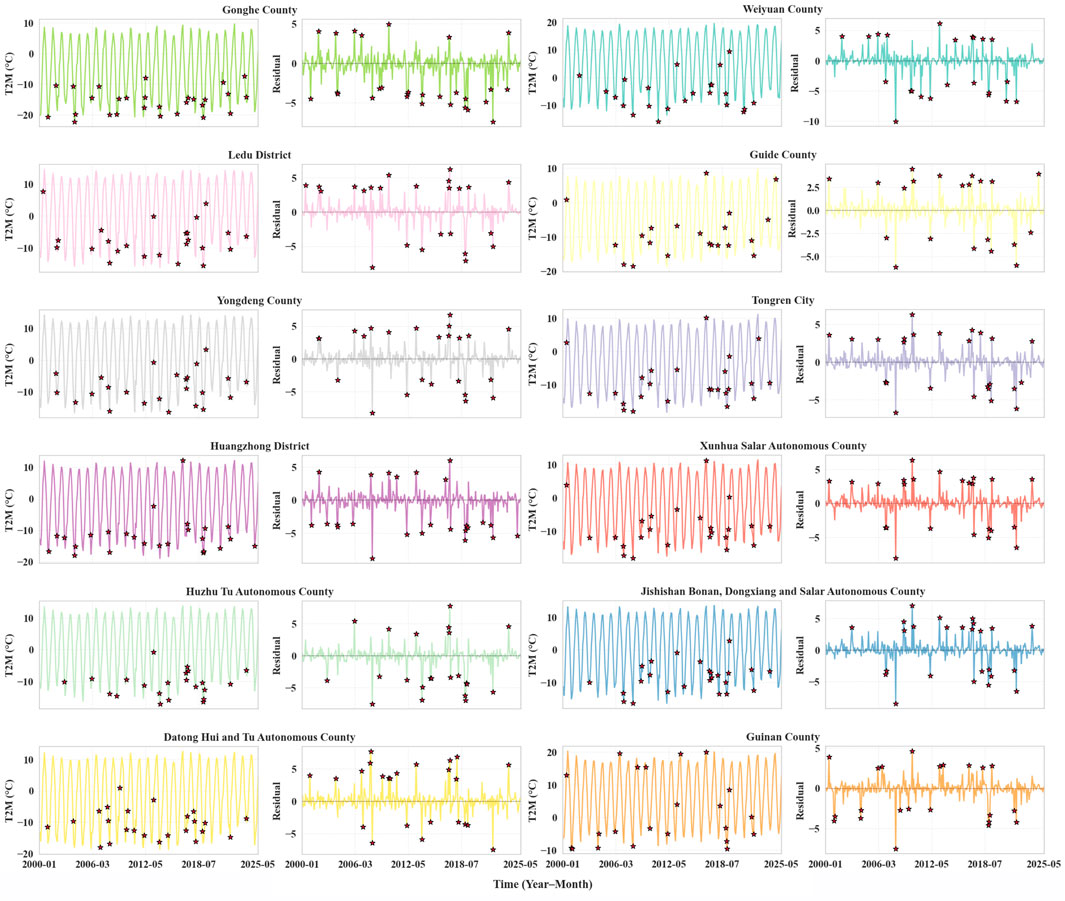
Figure 7. Monthly T2M Dynamics and STL-Based Anomaly Detection across 12 Representative Locations (2000–2025). STL-based decomposition of monthly T2M at 12 representative locations reveals diverse anomaly patterns driven by climatic variability, topographic effects, and land-surface dynamics, highlighting spatially differentiated dry–heat risks across the LXUA.
Among the sampled locations, Gonghe County (Pixel: Gonghe County) displayed a high density of warm-season anomalies, notably in 2003, 2010, and 2018, where residuals exceeded +4 °C. These warm deviations coincided with persistent surface warming phases and weakened seasonal damping, possibly linked to regional-scale land-atmosphere feedbacks. In contrast, Weiyuan County exhibited clusters of negative anomalies during the early 2000s and post-2015 periods, consistent with shifts in local vegetation cover and irrigation activities. Similarly, pixels located in Ledu District and Guide County showed amplified fluctuations around 2013–2015, with residuals breaching ±5 °C, suggesting responses to transient hydroclimatic perturbations or observation inconsistencies.
Of particular interest is the temporal instability observed in Jishishan Bonan, Dongxiang and Salar Autonomous County and Guinan County. These two locations, situated at the interface of topographic transition zones, exhibited alternating positive and negative spikes—such as the pronounced cold anomaly in Guinan County during February 2008 (residual ≈ −6.7 °C) and the warm anomaly in Jishishan in July 2022 (> + 5.1 °C). These fluctuations may stem from episodic cold surges and heatwave intrusions exacerbated by complex orographic modulation. Meanwhile, Xunhua Salar Autonomous County and Huzhu Tu Autonomous County experienced frequent but low-amplitude deviations, reflecting subtle interferences possibly from urban heat redistribution and snowmelt onset dynamics.
Temporal anomalies in Datong Hui and Tu Autonomous County and Huangzhong District were less frequent but showed sustained biases over multi-year spans, hinting at slow-varying systemic influences such as land cover transitions or data quality drift. Conversely, Tongren City and Yongdeng County exhibited high-frequency residual variance, with nearly every year marked by outliers. The prevalence of such events—especially in 2007, 2011, and 2016—suggests strong sensitivity to short-term synoptic drivers and possibly sub-grid climatic heterogeneity.
Overall, the spatially differentiated anomaly trajectories across the twelve pixels underscore the interplay of regional climate variability, topographic modulation, and potential urban–rural contrast effects. The STL-based decomposition proved effective in isolating residual anomalies from seasonal and trend components, offering a robust lens to capture both sudden shifts and creeping distortions in thermal behavior. This temporal diagnosis lays the groundwork for subsequent causal attribution, vulnerability analysis, and climate resilience planning across key urban–ecological interfaces in the study area.
3.3 Compound attribution topology of urban dry–heat exposure
The co-evolution of dry–heat forcing and population exposure over the Lanzhou–Xining urban corridor reveals marked structural divergence across indicators. From 2000 to 2024, the three composite dry–heat indices (CDH1-3) trace distinct yet interrelated dimensions of climatic intensification. CDH1, reflecting the near-surface temperature regime, exhibits a steady ascent in both mean and median, with a tightening interquartile range (IQR) after 2015—suggesting not only a general warming trend but also a reduction in temporal variability across the majority of the region. CDH2, linked to net radiative loading, displays a more episodic trajectory, punctuated by intermittent surges that align with known episodes of clear-sky extremes and albedo disruptions. Meanwhile, CDH3, designed to capture imbalance between sensible heat accumulation and evaporative buffering, portrays a fractured pattern: although median values remain moderate, mean-level fluctuations—especially in 2003, 2011, and 2020—signal sporadic breakdowns in moisture-mediated regulation under intense thermal forcing (Figure 8).
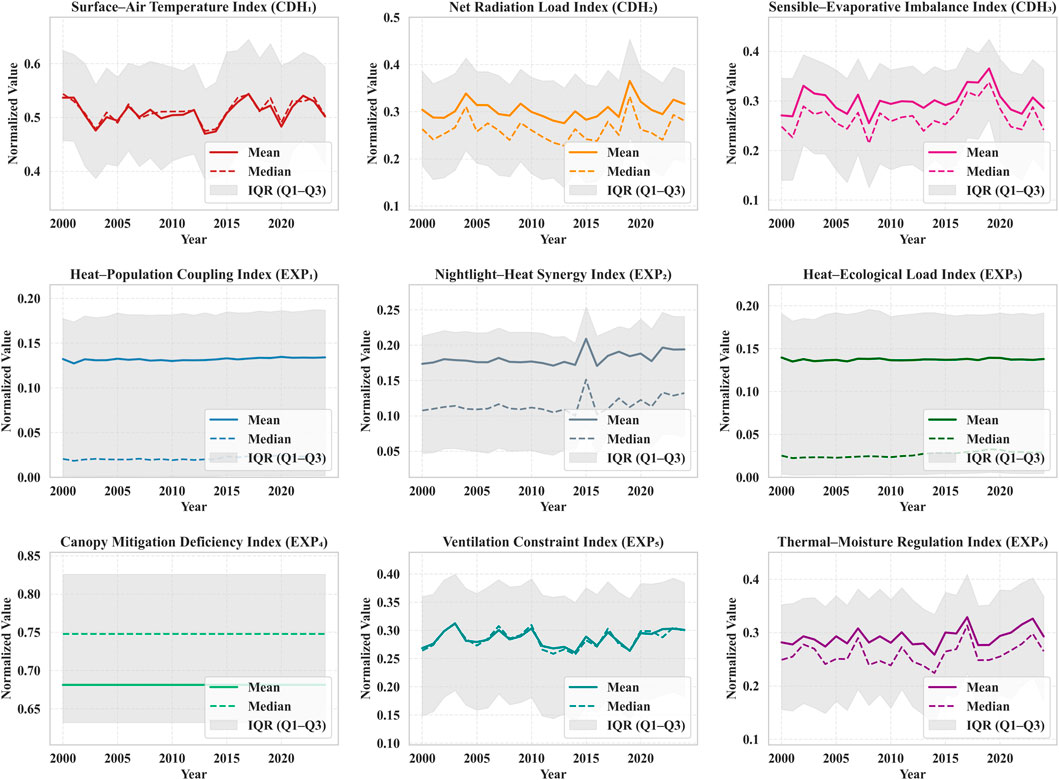
Figure 8. Temporal trajectories and interquartile dynamics of dry–heat forcing and population exposure indices (2000–2024).
Exposure-side dynamics—captured by EXP1-6—unfold along more fragmented axes. EXP1 and EXP2, representing anthropogenic and infrastructural coupling, are characterized by low medians but expansive upper quartiles in the later decade, implying the emergence of spatially discrete vulnerability pockets despite regional moderation. This decoupling is particularly notable in EXP2, where post-2010 variability suggests shifting nighttime thermal environments and potential amplification effects linked to urban morphology. In contrast, EXP4 sustains a high-level plateau with minimal interannual dispersion, denoting chronically limited vegetative mitigation capacity—a baseline constraint rather than a reactive signal. EXP5 and EXP6, tied to ventilation and soil–moisture regulation respectively, show more dynamic behavior: while EXP5 rises gradually and linearly, EXP6 demonstrates marked nonlinear escalation post-2015, hinting at a transition in hydrothermal buffering modes potentially tied to land surface transformation or climatic drying.
Notably, the relative separation between mean and median trajectories—especially in EXP6 and CDH3—points to the presence of fat-tailed spatial distributions, where localized extremes deviate significantly from regional cores. Such patterns underscore the growing role of intra-urban heterogeneity in modulating perceived and actual exposure.
Rather than converging into a single dominant driver, the nine indicators evolve in partially orthogonal directions—amplifying the compound nature of dry–heat exposure. Their diverging magnitudes, temporal rhythms, and dispersion structures reflect not only the intensity of climatic forcing but also the uneven capacity of urban systems to absorb, redistribute, or buffer these stresses.
To elucidate how compound dry–heat (CDH) stress modulates the evolution of population-level exposure, we conducted SHAP-based attribution across 25 annual XGBoost models (2000–2024), assessing the explanatory strength of three core drivers—surface–air temperature anomalies (CDH1), net radiative load (CDH2), and sensible–evaporative imbalance (CDH3)—across six functional exposure indices (EXP1-6). These indices capture a spectrum of demographic, ecological, and regulatory vulnerability dimensions. The resulting temporal attribution matrix (Figure 9) unveils a phased regime shift in dominant drivers, punctuated by critical anomalies and convergence events.
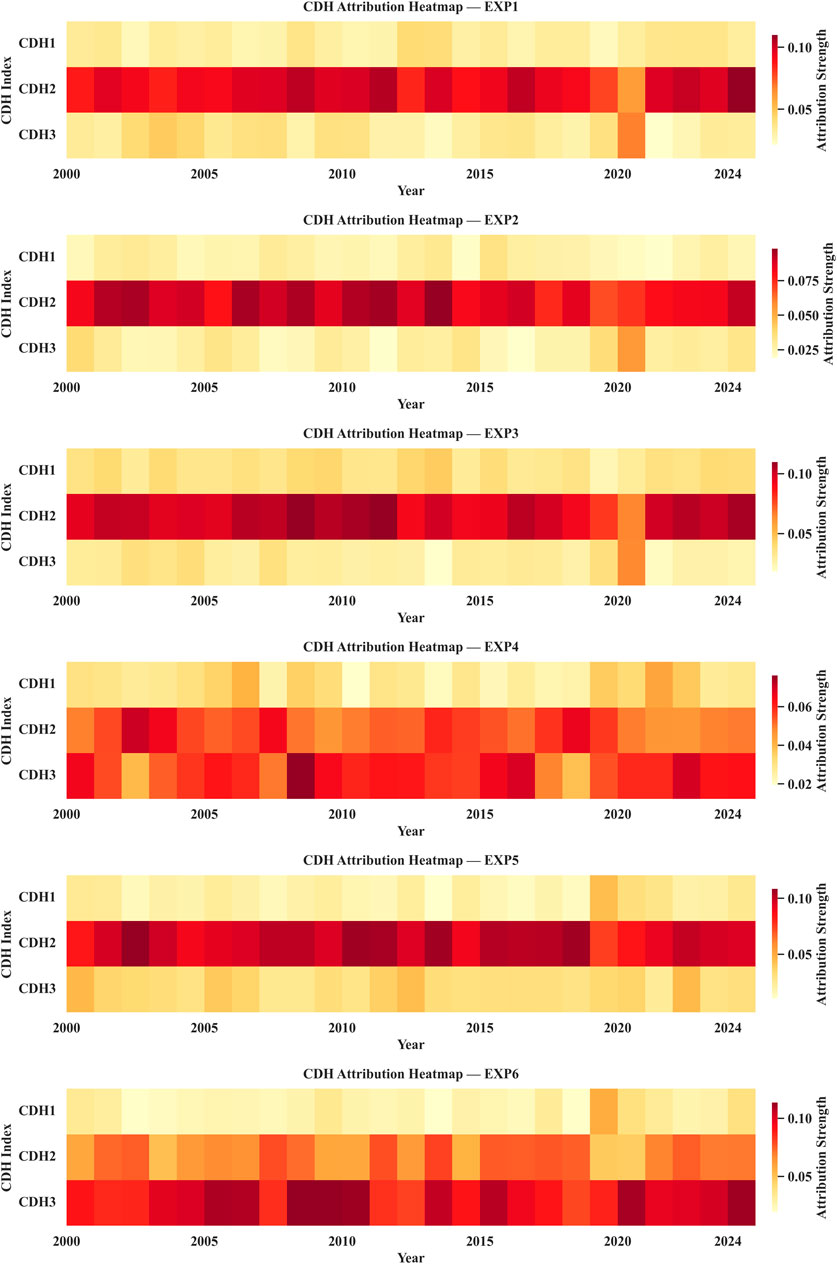
Figure 9. Temporal Evolution of CDH Contributions to Exposure Indicators (EXP1-6). Temporal attribution of CDH components to six exposure indices reveals a transition from temperature-dominated stress (2000–2004) to a mature radiative–evaporative imbalance regime post-2012, with 2019 marking a critical systemic convergence in exposure vulnerability.
3.3.1 Early coupling regime (2000–2004): temperature-dominated exposure
In the early 2000s, CDH1 stands out as the primary explanatory factor for EXP1 and EXP2, with attribution values consistently exceeding 0.10 for nightlight–heat coupling. This pattern suggests that urban exposure was initially governed by direct surface warming aligned with population density and anthropogenic heat emissions. The weak influence of CDH2 and CDH3 during this phase points to a system still largely thermally anchored, with minimal modulation from radiative or evaporative dynamics.
3.3.2 Radiative escalation (2005–2011): CDH2 emerges as a structural driver
Beginning around 2005, CDH2 steadily gains importance, particularly in ecological and mitigation-linked exposures (EXP3, EXP4). For instance, attribution to CDH2 in EXP4 (canopy mitigation deficiency) increases markedly by 2007, indicating a growing role of radiative accumulation in weakening vegetation-based thermal regulation. This period also includes 2009, a transitional year where all three CDH components simultaneously show elevated attribution across EXP4 and EXP6—signaling the emergence of compound exposure mechanisms that combine thermal intensity, radiative stress, and evaporative inefficiency. CDH3, previously negligible, begins to assert localized influence, particularly where moisture constraints interact with land surface energy balance.
3.3.3 Compound maturation (2012–2018): mechanism specialization and stabilization
The subsequent phase features a more stable yet differentiated attribution pattern. CDH2 consolidates its dominance over EXP3 and EXP4, while CDH3 emerges as a consistent driver of EXP5 and EXP6, particularly in relation to ventilation constraint and thermal–moisture regulation. CDH1’s influence recedes outside core demographic exposures. These dynamics suggest that urban heat exposure during this period became increasingly shaped by non-thermal disequilibria—radiative overload and suppressed convective release—rather than by surface temperature alone. Notably, this latent intensification phase indicates that while surface-level thermal anomalies may appear controlled, internal energy imbalances continue to escalate.
3.3.4 Systemic convergence and fragmentation (2019–2024): threshold breach and attribution decoupling
The year 2019 marks a distinct convergence event, with peak SHAP values for CDH2 and CDH3 observed across EXP1, EXP4, and EXP6. For instance, EXP4 attribution from CDH2 exceeds 0.11—its highest on record—reflecting a systemic overload in both external forcing and internal buffering. This moment likely corresponds to a climatic inflection point, where urban ecosystems failed to suppress rising thermal risks, and radiative saturation co-occurred with atmospheric stagnation. In the years following, attribution patterns become increasingly fragmented. CDH1 resurfaces in EXP1 and EXP2, while CDH3 displays renewed volatility—peaking again in 2023 for EXP6—suggesting a latent rebound in hydrothermal disequilibrium. This fragmentation may reflect rising spatial heterogeneity in exposure mechanisms, potentially shaped by localized adaptation, ecological decline, or stochastic climatic perturbations.
In sum, the 25-year SHAP attribution chronicle reveals a multi-phase, non-monotonic evolution of CDH–exposure coupling. What began as a temperature-driven exposure system has transitioned into a radiative–evaporative disequilibrium regime, where ecological buffers and physiological thresholds are increasingly strained. The year 2019 emerges as a structural break—a point of synchronized stressor saturation and declining adaptive elasticity. From a systems perspective, this trajectory highlights the increasing synergism among thermal drivers, and the need for integrated mitigation strategies that extend beyond temperature control to target radiative load redistribution and evaporative restoration.
To further distill the structural dynamics of compound dry–heat attribution, we synthesized the 25-year SHAP matrix into a composite distributional summary (Figure 10). This violin plot delineates the aggregated explanatory strength of each CDH indicator (CDH1-3) across the six exposure dimensions (EXP1-6), offering a comparative lens into their cumulative relevance and variability.
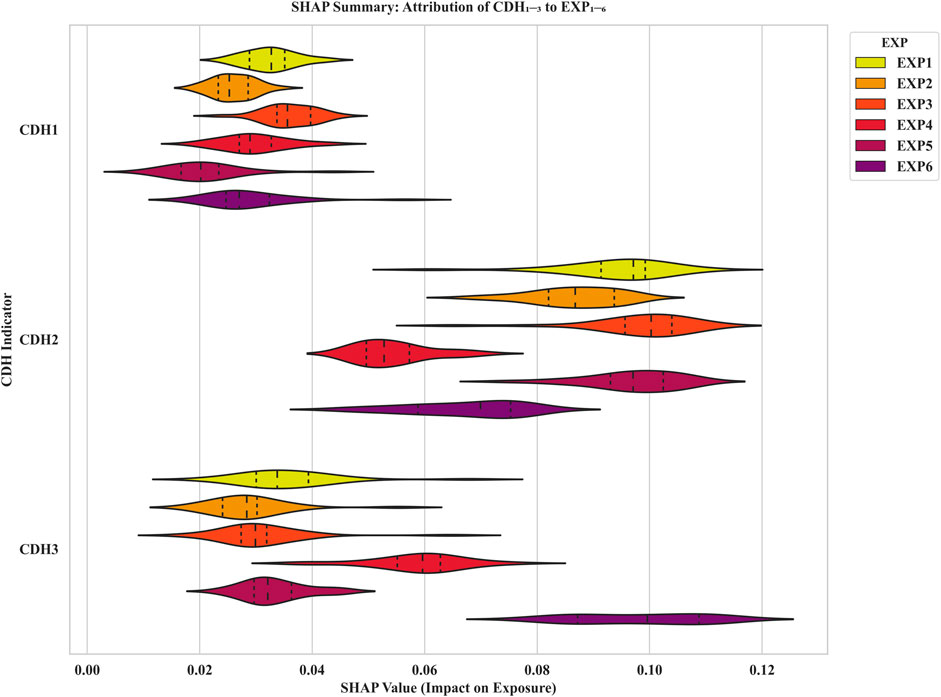
Figure 10. Distributional summary of SHAP-based attribution from CDH1-3 (dry–heat indicators) to EXP1-6 (population exposure dimensions), aggregated across 2000–2024. Violin shapes reflect value density, central quartiles, and tail behavior, capturing systemic and localized explanatory roles of thermal drivers.
Three core patterns emerge:
1. CDH1 maintains consistent, moderate explanatory power across anthropogenic-linked exposures.
CDH1 distributions are relatively compact and left-shifted, with consistently elevated SHAP values for EXP1 and EXP2. This suggests that surface temperature anomalies persist as a foundational exposure mechanism—particularly in demographically and infrastructurally dense zones—even as broader forcing regimes evolve. The constrained variance reflects a stable yet limited role: CDH1 operates as a baseline stressor whose effect is widespread but rarely extreme.
2. CDH2 exhibits high median attribution with narrow spread for EXP3 and EXP4—signaling a structurally embedded radiative constraint.
Unlike the other drivers, CDH2 reveals sharp, peaked distributions—especially for vegetation-related indices—underscoring its entrenched role in regulating ecological exposure. This pattern aligns with the earlier timeline analysis, where CDH2 progressively displaced CDH1 as the dominant explanatory variable post-2005. The low dispersion suggests a regime where radiative load is not only intensifying but structurally embedded in the exposure architecture.
3. CDH3 displays wide, fat-tailed distributions, pointing to localized and extreme sensitivity—particularly for EXP6.
As the most volatile component, CDH3 reveals long upper tails and high variance for EXP5 and EXP6. This implies that while median attribution remains modest, localized zones may experience sharp spikes in sensitivity, driven by stochastic interactions between sensible heat buildup and evaporative failure. Notably, EXP6—associated with soil moisture and thermal–hydric buffering—shows the broadest spread and highest individual SHAP outliers, reinforcing the view that hydrothermal disequilibrium constitutes the most spatially heterogeneous and potentially disruptive exposure pathway.
Together, these patterns confirm that attribution is not only temporally stratified but structurally differentiated across dimensions. CDH1 serves as a persistent demographic baseline, CDH2 as a radiative bottleneck, and CDH3 as a latent disruptor. The violin plots, by preserving distributional shape and tail behavior, offer a unique window into the compound, asymmetric, and threshold-sensitive nature of dry–heat exposure formation—where mean-based attribution alone would obscure critical nonlinearities.
Such findings underscore the necessity for targeted mitigation strategies: temperature buffering for core populations, radiative load management in vegetative zones, and hydrothermal resilience reinforcement in marginal, moisture-stressed districts. Only by aligning response architectures with the multi-faceted attribution topology can compound risks be meaningfully addressed.
4 Discussion
4.1 A spatiotemporal tensor framework for modeling dry–heat–exposure interactions
Unlike conventional metrics that rely on temporally discrete or seasonally averaged thermal inputs, this study constructs a high-resolution spatiotemporal tensor for dry-bulb temperature (T2M), aggregating 305 monthly layers into a continuous, location-specific time series. This design transforms each pixel into a dynamic thermal trajectory, enabling more nuanced assessments of compound exposure pathways (Ashworth et al., 2020; Coffel, 2025).
This tensorized architecture offers several key advantages in the context of dry–heat risk analysis:
1. Encoding Compound Forcing Trajectories for Exposure-Sensitive Learning
The T2M cube captures long-term sequences of heat accumulation, persistence, and recovery—three dimensions critical for understanding population exposure under escalating climate regimes (Chaudhury et al., 2023). By representing each location as a temporally evolving thermal fingerprint, the cube allows the detection of exposure-relevant features such as sustained plateaus, abrupt thresholds, or pre-extreme event build-up phases, which are often masked in snapshot climatologies. This temporal expressiveness supports supervised and unsupervised learning frameworks to classify exposure regimes with greater contextual accuracy (Li et al., 2020; Heo et al., 2023).
2. Structural Alignment with Functional Exposure Indices
A key strength of the T2M tensor lies in its ability to structurally align with normalized exposure metrics (EXP1-6), enabling temporally synchronized regression or attribution modeling. Because both the forcing (CDH) and response (EXP) datasets share identical temporal resolution and spatial topology, the cube allows for precise pairing of thermal stress signatures with infrastructural, ecological, or hydrometeorological vulnerabilities (Feng et al., 2020). This alignment facilitates robust SHAP-based inference on how different temporal phases of heat stress translate into distinct exposure mechanisms (Liu et al., 2025).
3. Rich Pixel-Level Temporal Embedding for Advanced Analytics
By embedding 305 months of dry-bulb temperature into a unified temporal vector at each pixel, the cube dramatically expands the information content carried by individual spatial units. This high-dimensional structure provides a solid foundation for advanced temporal analysis techniques such as clustering, regime detection, and trajectory-based classification. It enables the transition from static, year-by-year assessments to temporally continuous modeling, where exposure is understood not as isolated snapshots but as emergent properties of long-term thermal evolution.
In essence, the T2M data cube extends beyond temperature monitoring to function as an integrative platform for learning exposure-generating processes. Its utility lies not only in encoding raw thermal signals but in tracing their cascading influence on human vulnerability through aligned, high-frequency data integration. As compound exposure increasingly arises from non-obvious spatiotemporal interactions, the cube offers a scalable and analytically transparent medium to model dry–heat forcing with structural fidelity (Cao et al., 2021).
Looking ahead, coupling this cube with climate scenario projections or land-use transitions could enable forward-looking simulations of exposure risk, offering new avenues for anticipatory governance and spatially adaptive interventions.
4.2 Temporal disentanglement of exposure mechanisms under compound dry–heat stress
The SHAP-based attribution analysis across 2000–2024 reveals a temporally stratified evolution in the coupling strength between dry–heat drivers (CDH1-3) and population exposure indicators (EXP1-6). Rather than a monotonic progression, the attribution landscape undergoes multiple phase transitions, reflecting shifts in dominant mechanisms, emergent compound effects, and eventual structural fragmentation.
During the early 2000s, CDH1—representing near-surface temperature anomalies—dominates the explanatory landscape, particularly for EXP1 and EXP2. This pattern underscores a regime where anthropogenic exposure is primarily governed by thermal accumulation in densely populated or infrastructurally intensified zones. The limited role of CDH2 and CDH3 during this phase suggests a still-incipient contribution from radiative or evaporative disequilibrium mechanisms (Xiong et al., 2025).
From approximately 2005 onward, CDH2 emerges as a pivotal structural driver, with pronounced SHAP contributions to vegetation- and ecology-linked exposures such as EXP4. This shift coincides with rising radiative loads under clearer skies and reduced albedo, weakening natural cooling buffers. The year 2009 marks a critical convergence, where all three CDH indicators register simultaneous peaks in attribution across EXP4 and EXP6, indicating the formation of a compound stress regime involving temperature, radiation, and moisture imbalance (Iban and Aksu, 2024).
The period from 2012 to 2018 signals a relative stabilization in the attribution structure, yet with clear specialization: CDH2 maintains dominance over ecological exposures (EXP3, EXP4), while CDH3 increasingly shapes ventilation and hydrothermal regulation (EXP5, EXP6). Meanwhile, CDH1’s influence becomes more confined, suggesting that surface warming alone no longer serves as a sufficient predictor of exposure patterns.
A fundamental inflection occurs in 2019. Attribution values for both CDH2 and CDH3 simultaneously peak across multiple EXP indices, most notably EXP1, EXP4, and EXP6. This synchronized surge signals a systemic overload—where radiative saturation, evaporative failure, and anthropogenic exposure converge. The years following this convergence are marked by growing attribution fragmentation: CDH1 resurfaces in certain urban indicators (EXP1–2), while CDH3 exhibits renewed volatility, particularly in 2023 for EXP6. Such patterns suggest an increasingly heterogeneous and locally modulated exposure system, shaped by spatial variation in ecological degradation, microclimatic feedbacks, or stochastic forcing events (Yang et al., 2025).
Together, these findings delineate a multi-phase transition in exposure formation—from temperature-dominated origins, through radiative–ecological restructuring, to compound overload and post-peak disintegration. This trajectory highlights the nonlinear, temporally disjointed pathways through which dry–heat stress reshapes population vulnerability under sustained climatic intensification.
4.3 Functional differentiation and synergistic tension among dry–heat drivers
Beyond temporal evolution, the aggregated SHAP distributions from 2000 to 2024 (Figure 10) unveil a structurally differentiated attribution pattern among the three dry–heat indices (CDH1-3), each occupying distinct yet partially overlapping domains in the exposure landscape (Zhang et al., 2025).
CDH1, representing near-surface temperature anomalies, maintains consistent attribution strength for EXP1 and EXP2—exposures tied to anthropogenic heat and infrastructural concentration (Horton et al., 2021). Its compact distribution and moderate median indicate a foundational role in shaping demographic vulnerability. This signal is robust yet relatively uniform, reflecting a widespread but structurally bounded effect. In this sense, CDH1 functions as a baseline thermal scaffold, embedding a general warming burden across urbanized surfaces (Guo et al., 2021).
In contrast, CDH2—the net radiative loading component—exhibits high median attribution and minimal dispersion for EXP3 and EXP4, especially those linked to vegetation stress and canopy dysfunction. This sharp, peaked behavior implies systemic embedding: radiative pressure is not just episodic but hardwired into the exposure architecture. Its tight variability further suggests that once radiative saturation thresholds are breached, mitigation capacity—especially ecological—becomes uniformly compromised. CDH2 thus serves as a radiative bottleneck, imposing constraints that are less volatile but more structurally persistent.
CDH3, capturing sensible–evaporative disequilibrium, presents the most volatile attribution landscape. For EXP5 and particularly EXP6, its SHAP values span a wide, fat-tailed distribution, with extreme outliers indicating intense, spatially discrete sensitivity to hydrothermal stress. This component acts as a latent disruptor: its effects are often masked at the mean level but can dominate in marginal or moisture-deficient zones, amplifying exposure unpredictability and undermining buffering consistency.
Crucially, while each CDH factor exhibits functional specialization, their co-occurrence in key years (e.g., 2009, 2019, 2023) signals moments of synergistic tension—when structural bottlenecks (CDH2) and latent instabilities (CDH3) compound the foundational thermal scaffold (CDH1), overwhelming exposure regulation capacity. These convergence points reveal not additive stress, but systemic overload.
This triadic attribution structure points to a layered discomfort regime:
1. CDH1 governs the baseline exposure gradient;
2. CDH2 dictates long-term ecological viability;
3. CDH3 determines system volatility and local fragility.
Policy-wise, such differentiation calls for a precision targeting strategy: reduce surface heat for general population exposure (CDH1), manage radiative environments to protect vegetative buffers (CDH2), and prioritize hydrothermal resilience in fragile ecological and peri-urban zones (CDH3) (Huang et al., 2025).
Ultimately, exposure under compound dry–heat stress is not just the sum of multiple pressures—but a result of structurally misaligned drivers operating at different intensities, scales, and timescales. Future adaptation must therefore internalize this asymmetric, multi-dimensional architecture to achieve robust and equitable climate resilience.
5 Conclusion
This study presents a multi-layered analytical framework to unravel the spatiotemporal dynamics of compound dry–heat (CDH) stress and its cascading influence on population exposure (EXP) across the Lanzhou–Xining urban corridor. Specifically, we analyzed monthly-scale CDH dynamics from 2000 to May 2025, while exposure attribution via SHAP was conducted on an annual basis over 2000–2024 to ensure data completeness and comparability.
Leveraging a high-dimensional data cube constructed from monthly dry-bulb temperature (T2M) records, we developed and normalized three composite dry–heat indicators (CDH1-3), representing thermal intensity, radiative loading, and evaporative imbalance. These were linked to six population exposure metrics (EXP1-6), covering demographic, infrastructural, ecological, and physiological vulnerability dimensions.
Our findings reveal a structurally divergent evolution between climatic forcing and exposure response. While CDH1 reflects a gradual and regionally consistent warming trend, CDH2 and CDH3 exhibit episodic spikes and spatial volatility, suggesting latent instabilities in radiative balance and hydrothermal buffering. On the exposure side, the growing decoupling between median and mean trajectories—especially in EXP2 and EXP6—highlights the emergence of spatially concentrated vulnerability pockets under systemic pressure.
SHAP-based attribution analysis, implemented via 25 annual XGBoost models, further clarifies the mechanism-specific roles of CDH drivers. CDH1 persists as a baseline force governing anthropogenic exposure, whereas CDH2 structurally governs vegetation and mitigation-linked dimensions. CDH3 emerges as a volatile disruptor, inducing localized spikes in vulnerability through evaporative failure. A critical convergence is observed in 2019, marking the systemic overload of radiative and hydrothermal mechanisms, beyond which attribution patterns fragment—potentially signaling a loss of coherence in urban climate adaptation.
Together, these insights reveal that urban dry–heat exposure is governed not by a single dominant stressor but by the asymmetric interplay among multiple drivers, each modulating different facets of vulnerability. Importantly, this attribution topology is neither static nor uniform: it evolves with shifting climatic regimes, urban morphologies, and ecological thresholds.
From a methodological standpoint, the T2M data cube framework offers a powerful basis for temporal learning, anomaly detection, and compound attribution. It bridges meteorological inputs with exposure diagnostics, enabling pixel-level assessment of discomfort formation and supporting the integration of advanced modeling architectures.
Policy implications are clear: heat mitigation strategies must move beyond surface temperature control and address radiative saturation and hydrothermal resilience in tandem. Spatial targeting should prioritize not only population-dense zones but also ecologically constrained and hydrologically fragile subregions, where compound stress is both more likely and more damaging.
Data availability statement
The original contributions presented in the study are included in the article/Supplementary Material, further inquiries can be directed to the corresponding author.
Author contributions
XW: Methodology, Software, Data curation, Project administration, Writing – review and editing. AH: Methodology, Writing – original draft, Writing – review and editing, Funding acquisition. DZ: Conceptualization, Writing – review and editing. SL: Investigation, Data curation, Visualization, Writing – review and editing. ZZ: Writing – original draft, Data curation, Visualization, Software, Supervision, Project administration, Writing – review and editing. SR: Writing – original draft, Data curation, Visualization, Software, Supervision, Project administration, Writing – review and editing.
Funding
The author(s) declare that financial support was received for the research and/or publication of this article. Key Laboratory of Ecological Security Monitoring and Governance at Sichuan Minzu College of Sichuan Province (ESMG2025019), Funding for Disciplinary Construction in the School of Ecology and Agriculture at Sichuan Minzu College (010907), Sichuan Minzu College University-Level Project (XYZB2017ZB), and Project of Sichuan Provincial Science and Technology Department (2025JDKP0080). The funders had no role in the study design, data collection and analysis, decision to publish, or preparation of the manuscript.
Acknowledgments
The authors express their gratitude to the reviewers and the editor for their professional comments and suggestions.
Conflict of interest
The authors declare that the research was conducted in the absence of any commercial or financial relationships that could be construed as a potential conflict of interest.
Generative AI statement
The author(s) declare that no Generative AI was used in the creation of this manuscript.
Any alternative text (alt text) provided alongside figures in this article has been generated by Frontiers with the support of artificial intelligence and reasonable efforts have been made to ensure accuracy, including review by the authors wherever possible. If you identify any issues, please contact us.
Publisher’s note
All claims expressed in this article are solely those of the authors and do not necessarily represent those of their affiliated organizations, or those of the publisher, the editors and the reviewers. Any product that may be evaluated in this article, or claim that may be made by its manufacturer, is not guaranteed or endorsed by the publisher.
Supplementary material
The Supplementary Material for this article can be found online at: https://www.frontiersin.org/articles/10.3389/fenvs.2025.1684244/full#supplementary-material
References
Abdelrahman, M., Metwaly, M., Yossif, T., and Moursy, A. (2025). Using hyperspectral data to estimate and map surface and subsurface soil salinity, pH, and calcium carbonates in arid region. Environ. Sustain. 8, 367–387. doi:10.1007/s42398-025-00355-x
Acharki, S., Singh, S., do Couto, E., Arjdal, Y., and Elbeltagi, A. (2023). Spatio-temporal distribution and prediction of agricultural and meteorological drought in a mediterranean coastal watershed via GIS and machine learning. Phys. Chem. EARTH 131, 103425. doi:10.1016/j.pce.2023.103425
Adil, M., Lu, S., Yao, Z., Zhang, C., Lu, H., Bashir, S., et al. (2024). No-tillage enhances soil water storage, grain yield and water use efficiency in dryland wheat (Triticum aestivum) and maize (Zea mays) cropping systems: a global meta-analysis. Funct. PLANT Biol. 51. doi:10.1071/FP23267
Aditya, K., Kolla, H., Kegelmeyer, W. P., Shead, T. M., Ling, J., and Davis, W. L. (2019). Anomaly detection in scientific data using joint statistical moments. J. Comput. Phys. 387, 522–538. doi:10.1016/j.jcp.2019.03.003
Aghili, M. E., Ghassemian, H., and Arani, M. I. (2024). “Spectral-spatial anomaly detection in hyperspectral imagery based on dual-domain autoencoders,” in Proceedings of the 13TH IRANIAN/3RD international machine VISION and image processing conference. Piscataway, NJ, USA: Institute of Electrical and Electronics Engineers (IEEE). MVIP, 1–5. doi:10.1109/MVIP62238.2024.10491152
Aguilar, R., Zurita-Milla, R., Izquierdo-Verdiguier, E., and de By, R. (2018). A cloud-based multi-temporal ensemble classifier to map smallholder farming systems. REMOTE Sens. 10, 729. doi:10.3390/rs10050729
Al-Shammari, D., Fuentes, I., Whelan, B., Wang, C., Filippi, P., and Bishop, T. (2024). Combining sentinel 1, sentinel 2 and MODIS data for major winter crop type classification over the murray darling basin in Australia. REMOTE Sens. APPLICATIONS-SOCIETY Environ. 34, 101200. doi:10.1016/j.rsase.2024.101200
Alonso, L., and Renard, F. (2020). A new approach for understanding urban microclimate by integrating complementary predictors at different scales in regression and machine learning models. REMOTE Sens. 12, 2434. doi:10.3390/rs12152434
Aneece, I., Thenkabail, P., McCormick, R., Alifu, H., Foley, D., Oliphant, A., et al. (2024). Machine learning and new-generation spaceborne hyperspectral data advance crop type mapping. Photogrammetric Eng. Remote sens. 90, 687–698. doi:10.14358/PERS.24-00026R2
Anees, S., Mehmood, K., Rehman, A., Rehman, N., Muhammad, S., Shahzad, F., et al. (2024). Unveiling fractional vegetation cover dynamics: a spatiotemporal analysis using MODIS NDVI and machine learning. Environ. Sustain. Indic. 24, 100485. doi:10.1016/j.indic.2024.100485
Ashworth, K., Bucci, S., Gallimore, P. J., Lee, J., Nelson, B. S., Sanchez-Marroquin, A., et al. (2020). Megacity and local contributions to regional air pollution: an aircraft case study over London. Atmos. Chem. Phys. 20, 7193–7216. doi:10.5194/acp-20-7193-2020
Azad, M., Jalali, M., Sattari, M., and Mastouri, R. (2025). Evaporation and precipitation prediction for future time frames via combined machine learning-climate change models: Quri gol wetland case. J. Agric. Sciences-Tarim Bilimleri Dergisi 30, 447–469. doi:10.15832/ankutbd.1509731
Babaan, J., Hsu, F.-T., Wong, P.-Y., Chen, P.-C., Guo, Y.-L., Lung, S.-C. C., et al. (2023). A Geo-AI-based ensemble mixed spatial prediction model with fine spatial-temporal resolution for estimating daytime/nighttime/daily average ozone concentrations variations in Taiwan. J. Hazard. Mater. 446, 130749. doi:10.1016/j.jhazmat.2023.130749
Bahiraei, F., Berquist, J., Dutta, S., and Huchuk, B. (2023). Using smart thermostat override data to provide insights for improving heating, ventilation, and air-conditioning system scheduling in a portfolio of small commercial buildings. Sci. Technol. Built Environ. 29, 971–984. doi:10.1080/23744731.2023.2234241
Bahrami, M., Pourahmadi, M., Vafaei, A., and Shayesteh, M. R. (2021). A comparative study between single and multi-frame anomaly detection and localization in recorded video streams. J. Vis. Commun. IMAGE Represent. 79, 103232. doi:10.1016/j.jvcir.2021.103232
Bai, J., Jia, Z., Sun, Y., Zheng, C., and Wen, M. (2025). Multi-scenario simulation of land use change along with ecosystem service value for the lanzhou-xining urban agglomeration. LAND 14, 860. doi:10.3390/land14040860
Barrio-Anta, M., Castedo-Dorado, F., Cámara-Obregón, A., and López-Sánchez, C. (2020). Predicting current and future suitable habitat and productivity for Atlantic populations of maritime pine (Pinus pinaster Aiton) in Spain. Ann. For. Sci. 77, 41. doi:10.1007/s13595-020-00941-5
Barz, B., Rodner, E., Garcia, Y. G., and Denzler, J. (2019). Detecting regions of maximal divergence for spatio-temporal anomaly detection. IEEE Trans. Pattern Analysis Mach. Inteligence 41, 1088–1101. doi:10.1109/TPAMI.2018.2823766
Canero, F., Rodriguez-Galiano, V., and Chabrillat, S. (2025). Evaluating airborne Hyperspectral Scanner (AHS) for the mapping of soil organic matter and clay in a mediterranean forest ecosystem. CATENA 252, 108889. doi:10.1016/j.catena.2025.108889
Cao, S., He, Y., Zhang, L., Chen, Y., Yang, W., Yao, S., et al. (2021). Spatiotemporal characteristics of drought and its impact on vegetation in the vegetation region of northwest China. Ecol. Indic. 133, 108420. doi:10.1016/j.ecolind.2021.108420
Chakhar, A., Hernández-López, D., Zitouna-Chebbi, R., Mahjoub, I., Ballesteros, R., and Moreno, M. (2022). Optimized software tools to generate large spatio-temporal data using the datacubes concept: application to crop classification in cap Bon, Tunisia. Remote Sens. 14, 5013. doi:10.3390/rs14195013
Chaudhury, B., Sahadevan, A., and Mitra, P. (2023). Multi-task hybrid spectral-spatial temporal convolution networks for classification of agricultural crop types and growth stages using drone-borne hyperspectral and multispectral images. J. Appl. REMOTE Sens. 17. doi:10.1117/1.JRS.17.038503
Chen, J., and Cao, L. (2022). Spatiotemporal variability in water-use efficiency in tianshan Mountains (Xinjiang, China) and the influencing factors. Sustainability 14, 8191. doi:10.3390/su14138191
Chen, X., Li, N., Liu, J., Zhang, Z., Liu, Y., and Huang, C. (2020). Changes in global and regional characteristics of heat stress waves in the 21st century. Earths Future 8, e2020EF001636. doi:10.1029/2020EF001636
Chen, H., He, W., Sun, J., and Chen, L. (2022). Increases of extreme heat-humidity days endanger future populations living in China. Environ. Res. Lett. 17, 064013. doi:10.1088/1748-9326/ac69fc
Chen, D., Wu, Q., Sun, Z., Shi, X., Zhang, S., Zhang, Y., et al. (2024). Semi-automatic detection of ground displacement from multi-temporal Sentinel-1 synthetic aperture radar interferometry analysis and density-based spatial clustering of applications with noise in xining City, China. REMOTE Sens. 16, 3066. doi:10.3390/rs16163066
Cirillo, C., De Micco, V., Rouphael, Y., Balzano, A., Caputo, R., and De Pascale, S. (2017). Morpho-anatomical and physiological traits of two Bougainvillea genotypes trained to two shapes under deficit irrigation. Trees-Structure Funct. 31, 173–187. doi:10.1007/s00468-016-1466-6
Coffel, E. D. (2025). More distinct dry and humid heat in a warming world. Earths Future 13, e2024EF005770. doi:10.1029/2024EF005770
Condon, A., Richards, R., and Farquhar, G. (1993). Relationships between carbon-isotope discrimination, water-use efficiency and transpiration efficiency for dryland wheat. Aust. J. Agric. Res. 44, 1693–1711. doi:10.1071/AR9931693
Coronato, T., Carril, A. F., Zaninelli, P. G., and Abalone, R. (2024). Exploring warm extremes in South America: insights into regional climate change projections through dry-bulb and wet-bulb temperatures. Clim. Dyn. 62, 4391–4410. doi:10.1007/s00382-024-07140-2
Cui, L., Jiao, Z., Dong, Y., Sun, M., Zhang, X., Yin, S., et al. (2019). Estimating forest canopy height using MODIS BRDF data emphasizing typical-angle reflectances. Remote Sens. 11, 2239. doi:10.3390/rs11192239
Cvijanovic, I., Mistry, M. N., Begg, J. D., Gasparrini, A., and Rodo, X. (2023). Importance of humidity for characterization and communication of dangerous heatwave conditions. NPJ Clim. Atmos. Sci. 6, 33. doi:10.1038/s41612-023-00346-x
Daryanto, S., Wang, L., and Jacinthe, P.-A. (2017). Can ridge-furrow plastic mulching replace irrigation in dryland wheat and maize cropping systems? Agric. WATER Manag. 190, 1–5. doi:10.1016/j.agwat.2017.05.005
Dayan, I., Maman, S., Blumberg, D. G., and Rotman, S. (2016). “Multi-temporal anomaly detection technique,” in Electro-Optical and infrared systems: technology and applications XIII 9987. doi:10.1117/12.2239530
Diykh, M., Ali, M., Labban, A. H., Prasad, R., Jamei, M., Abdulla, S., et al. (2025). Designing empirical fourier decomposition reinforced with multiscale increment entropy and deep learning to forecast dry bulb air temperature. RESULTS Eng. 26, 104597. doi:10.1016/j.rineng.2025.104597
Feng, L., Zhang, Z., Ma, Y., Du, Q., Williams, P., Drewry, J., et al. (2020). Alfalfa yield prediction using UAV-based hyperspectral imagery and ensemble learning. REMOTE Sens. 12, 2028. doi:10.3390/rs12122028
Gavade, A., and Rajpurohit, V. (2022). Sparse-FCM and deep learning for effective classification of land area in multi-spectral satellite images. Evol. Intell. 15, 1185–1201. doi:10.1007/s12065-020-00362-3
Gilcher, M., Ruf, T., Emmerling, C., and Udelhoven, T. (2019). Remote sensing based binary classification of maize. Dealing with residual autocorrelation in sparse sample situations. Remote Sens. 11, 2172. doi:10.3390/rs11182172
Gong, Z., Liu, W., Guo, J., Su, Y., Gao, Y., Bu, W., et al. (2024). How to achieve the ecological sustainability goal of ecologically fragile areas on the Qinghai-Tibet Plateau: a multi-scenario simulation of lanzhou-xining urban agglomerations. LAND 13, 1730. doi:10.3390/land13111730
Greenway, G., Reitz, S., and Nault, B. A. (2023). A cost-benefit analysis of novel IPM-based approaches to onion thrips management in US dry bulb onions. Horticulturae 9, 1219. doi:10.3390/horticulturae9111219
Greenway, G. A., Rondon, S. I., Chitturi, A., Buhrig, W., and Reitz, S. (2025). An evaluation of insecticide and nitrogen fertility programs in dry bulb onions in the treasure valley of eastern Oregon and southwest Idaho in 2019 to 2021. J. Econ. Entomology, toaf101. doi:10.1093/jee/toaf101
Guo, J., Liu, X., Ge, W., Ni, X., Ma, W., Lu, Q., et al. (2021). Specific drivers and responses to land surface phenology of different vegetation types in the qinling Mountains, central China. REMOTE Sens. 13, 4538. doi:10.3390/rs13224538
Gutflaish, E., Kontorovich, A., Sabato, S., Biller, O., and Sofer, O. (2019). “Temporal anomaly detection: calibrating the Surprise,” in Thirty-third aaai conference on artificial InteLigence/thirty-first innovative applications of artificial InliLigence conference/ninth aaai symposium on educational advances in artificial in℡ligence, 3755–3762.
He, J., Ying, J., Li, T., Yang, Z., and Li, X. (2024). Psychological needs research on passenger’s joint journey between the hubs of yellow river basin Lanzhou-Xining urban agglomeration. Psychol. Rep. 127, 146–148.
Heo, J.-M., Kim, S.-S., Kim, D.-Y., Lee, S. W., Lee, J. S., Kang, M. H., et al. (2023). Impact of exposure temperature rise on mass mortality of tidal flat pacific oysters. Front. Mar. Sci. 10, 1275521. doi:10.3389/fmars.2023.1275521
Horton, A., Virkki, V., Lounela, A., Miettinen, J., Alibakhshi, S., and Kummu, M. (2021). Identifying key drivers of peatland fires across kalimantan’s Ex-Mega rice project using machine learning. Earth Space Sci. 8, e2021EA001873. doi:10.1029/2021EA001873
Huali, T., Peiji, S., Jun, L., and Xiaoxiao, L. (2020). The structure and pattern of urban network in the lanzhou-Xining urban agglomeration. Chin. Geogr. Sci. 30, 59–74. doi:10.1007/s11769-019-1090-7
Huang, M., Li, Y., Feng, A., Yan, H., Yu, W., Guo, Y., et al. (2025). Spatiotemporal patterns of human-perceived temperature and its drivers over the rapid urbanisation area of China. Int. J. Climatol. 45, e8898. doi:10.1002/joc.8898
Iban, M., and Aksu, O. (2024). SHAP-Driven explainable artificial intelligence framework for wildfire susceptibility mapping using MODIS active fire pixels: an In-Depth interpretation of contributing factors in Izmir, Türkiye. REMOTE Sens. 16, 2842. doi:10.3390/rs16152842
Im, E.-S., Kang, S., and Eltahir, E. A. B. (2018). Projections of rising heat stress over the western Maritime Continent from dynamically downscaled climate simulations. Glob. Planet. CHANGE 165, 160–172. doi:10.1016/j.gloplacha.2018.02.014
Jia, J., Zhang, M., Zhao, J., Wang, J., He, F., and Wang, L. (2023a). The effects of increasing the dry-bulb temperature during the stem-drying stage on the quality of upper leaves of flue-cured tobacco. PROCESSES 11, 726. doi:10.3390/pr11030726
Jia, Z., Chen, Q., Na, H., Yang, Y., and Zhao, J. (2023b). Impacts of industrial agglomeration on industrial pollutant emissions: evidence found in the Lanzhou-Xining urban agglomeration in western China. Front. Public Health 10, 1109139. doi:10.3389/fpubh.2022.1109139
Karadayi, Y., Aydin, M. N., and Ogrenci, A. S. (2020). A hybrid deep learning framework for unsupervised Anomaly detection in multivariate spatio-temporal data. Appl. Sciences-Basel 10, 5191. doi:10.3390/app10155191
Kinoshita, T., Hayashi, T., Yamauchi, D., and Yamamoto, T. (2024). Quantitative analysis of factors affecting bulb yield in terms of dry matter production across different planting dates and cultivars in spring-sown onions. Sci. Hortic. 338, 113726. doi:10.1016/j.scienta.2024.113726
Li, D., Yuan, J., and Kopp, R. E. (2020). Escalating global exposure to compound heat-humidity extremes with warming. Environ. Res. Lett. 15, 064003. doi:10.1088/1748-9326/ab7d04
Li, J., Li, G., Liang, Y., Yuan, J., Xu, G., and Yang, C. (2024). Spatiotemporal differentiation of the ecosystem service value and its coupling relationship with urbanization: a case study of the lanzhou-Xining urban agglomeration. Ecol. Indic. 160, 111932. doi:10.1016/j.ecolind.2024.111932
Liao, B., Zhou, T., Liu, Y., Li, M., and Zhang, T. (2025). Tackling the wildfire prediction challenge: an explainable artificial intelligence (XAI) model combining extreme gradient boosting (XGBoost) with SHapley additive exPlanations (SHAP) for enhanced interpretability and accuracy. FORESTS 16, 689. doi:10.3390/f16040689
Lin, W., Li, H., Ren, A., Sun, M., and Gao, Z. (2020). Optimizing the seeding rate in subsoiling for dryland wheat (triticum aestivum l.): a key to improving water use efficiency and nitrogen use efficiency in the Loess plateau of China. Appl. Ecol. And Environ. Res. 18, 3015–3026. doi:10.15666/aeer/1802_30153026
Liu, X., de Sherbinin, A., and Zhan, Y. (2019). Mapping urban extent at large spatial scales using machine learning methods with VIIRS nighttime light and MODIS daytime NDVI data. Remote Sens. 11, 1247. doi:10.3390/rs11101247
Liu, Y., Xu, X., Wang, J., Wang, Y., and Fan, C. (2025). Research on the predictability of rock strength under freeze-thaw cycles - a hybrid model of SHAP-IPOA-XGBoost. Cold Regions Sci. Technol. 231, 104416. doi:10.1016/j.coldregions.2024.104416
Racine, J., Nerney, A., Kilgore, S., Waters, T., Critzer, F., Harris, L. J., et al. (2024). Escherichia coli survival on dry bulb onions treated with crop protection sprays prepared using contaminated water in the treasure valley growing region. J. Of Food Prot. 87, 100373. doi:10.1016/j.jfp.2024.100373
Ren, J., Ma, R., Huang, Y., Wang, Q., Guo, J., Li, C., et al. (2024). Identifying the trade-offs and synergies of land use functions and their influencing factors of lanzhou-xining urban agglomeration in the upper reaches of yellow River Basin, China. Ecol. Indic. 158, 111279. doi:10.1016/j.ecolind.2023.111279
Ruhan, A., Mu, X., He, J., and Zhang, J. (2022a). Enhance tensor RPCA-LRX anomaly detection algorithm for hyperspectral image. Geocarto Int. 37, 11976–11997. doi:10.1080/10106049.2022.2063400
Ruhan, A., Mu, X., and He, J. (2022b). Enhance tensor RPCA-based mahalanobis distance method for hyperspectral anomaly detection. IEEE Geoscience And Remote Sens. Lett. 19, 1–5. doi:10.1109/LGRS.2022.3159341
Shreevastava, A., Raymond, C., and Hulley, G. C. (2023). Contrasting intraurban signatures of humid and dry heatwaves over southern California. J. Of Appl. Meteorology And Climatol. 60, 709–720. doi:10.1175/JAMC-D-22-0149.1
Tong, H., and Shi, P. (2020). Using ecosystem service supply and ecosystem sensitivity to identify landscape ecology security patterns in the Lanzhou-Xining urban agglomeration, China. J. Of Mt. Sci. 17, 2758–2773. doi:10.1007/s11629-020-6283-0
Xiong, Y., Chen, X., and Ran, Y. (2025). Method for measuring and calculating evaporative emission component space based on oxyhydrogen stable isotope observation, involves collecting research area vegetation sample and soil sample, and observing soil evaporation in research area.
Xu, P., Gan, H., Fu, H., and Zhang, Z. (2023). STEAMCODER: spatial and temporal adaptive dynamic convolution autoencoder for anomaly detection. Knowledge-Based Syst. 279, 110929. doi:10.1016/j.knosys.2023.110929
Yang, H., Lee, W., and Kim, J. (2025). Identification of key factors influencing teachers’ self-perceived AI literacy: an XGBoost and SHAP-based approach. Appl. Sciences-Basel 15, 4433. doi:10.3390/app15084433
Yin, J., Liu, H., Shi, P., and Zhang, W. (2021). Exploring coupling relationship between urban connection and high-quality development using the case of lanzhou-Xining urban agglomeration. Complexity 2021, 9933582. doi:10.1155/2021/9933582
Yin, A., Wang, Y., Chen, Y., Zeng, K., Zhang, H., and Mao, J. (2023). SSAPN: spectral-spatial anomaly perception network for unsupervised vaccine detection. IEEE Trans. Industrial Inf. 19, 6081–6092. doi:10.1109/TII.2022.3195168
Zhang, B., Yin, J., Jiang, H., and Qiu, Y. (2022). Application of social network analysis in the economic connection of urban agglomerations based on nighttime lights remote sensing: a case study in the new Western land-sea corridor, China. Isprs Int. J. Of Geo-Information 11, 522. doi:10.3390/ijgi11100522
Zhang, H., Zhao, X., Ren, J., Hai, W., Guo, J., Li, C., et al. (2023). Research on the slope gradient effect and driving factors of construction land in urban agglomerations in the upper yellow river: a case study of the Lanzhou-Xining urban agglomerations. LAND 12, 745. doi:10.3390/land12040745
Zhang, K., Lu, Y., Duan, C., Zhang, F., Ling, X., Yao, Y., et al. (2025). Variations and drivers of CO2 fluxes at multiple temporal scales of subtropical agricultural systems in the Huaihe river Basin. Agric. And For. Meteorology 362, 110394. doi:10.1016/j.agrformet.2025.110394
Keywords: compound heat exposure, dry-bulb temperature, XGBoost, SHAP, urban vulnerability, radiative stress, evaporative imbalance, spatiotemporal attribution
Citation: Wang X, He A, Zhang D, Liu S, Zhang Z and Ren S (2025) Tensor based spatiotemporal attribution of compound dry heat exposure in the Lanzhou–Xining urban agglomeration from 2000 to 2025. Front. Environ. Sci. 13:1684244. doi: 10.3389/fenvs.2025.1684244
Received: 12 August 2025; Accepted: 06 October 2025;
Published: 11 November 2025.
Edited by:
Luis Gomez, University of Las Palmas de Gran Canaria, SpainReviewed by:
Subhanil Guha, National Institute of Technology Raipur, IndiaMin Zhang, Shanghai Normal University, China
Copyright © 2025 Wang, He, Zhang, Liu, Zhang and Ren. This is an open-access article distributed under the terms of the Creative Commons Attribution License (CC BY). The use, distribution or reproduction in other forums is permitted, provided the original author(s) and the copyright owner(s) are credited and that the original publication in this journal is cited, in accordance with accepted academic practice. No use, distribution or reproduction is permitted which does not comply with these terms.
*Correspondence: Siyuan Ren, c3hyMTA4N0BzdHVkZW50LmJoYW0uYWMudWs=