 Caiyu Yan
 Xu Wang3
- 1College of Geography Science and Tourism, Xinjiang Normal University, Urumqi, China
- 2Xinjiang Arid Area Lake Environment and Resources Laboratory, Key Laboratory of Xinjiang Uygur Autonomous Region, Urumqi, China
- 3Xinjiang Academy of Forestry Sciences, Urumqi, China
- 4Animal Husbandry and Veterinary Workstation of the Fifth Division of Xinjiang Production and Construction Corps, Shuanghe, China
The Kalamaili Ungulate Nature Reserve is a vital ecological unit and an important sanctuary for wild ungulates. Given its high sensitivity to climate change, understanding the dynamics of vegetation growth in the reserve is crucial for effective management and conservation efforts. This study assessed vegetation growth in the Kalamaili Ungulate Nature Reserve using NDVI and meteorological data from 2001 to 2022. A combination of methods, including Theil–Sen trend analysis, the Mann–Kendall test, the Hurst index, partial correlation analysis, lag time analysis, and multiple regression residual analysis, were employed to evaluate the response mechanisms of NDVI to climate change and human activities. The results showed that (1) NDVI in the reserve exhibited an increasing trend from 2001 to 2022, with a growth rate of 0.0002 per year, and NDVI values were generally higher in the western region than in the eastern region. (2) Temperature was the dominant factor influencing NDVI on both annual and growing-season scales, while precipitation had a greater effect on NDVI during the annual summer, autumn, and growing seasons. (3) The NDVI trend is projected to shift from an upward to a downward trend in the future, potentially affecting 59.16% of the reserve. (4) Temperature showed a two-month lag effect on NDVI, whereas precipitation had a one-month lag effect. (5) Residual analysis revealed that both climate change and human activities contributed to vegetation improvement, accounting for 55.69% of the observed changes. These findings emphasize the importance of ongoing vegetation monitoring in the Kalamaili Ungulate Nature Reserve. Given that the reserve lies within China’s arid northwestern region and is highly vulnerable to global warming, the results provide a scientific foundation for managing the reserve and developing sustainable strategies. They also offer valuable insights for research on similar desert ecosystems.
1 Introduction
As a primary producer, vegetation acts as a conduit between the soil, air, and water, and it plays a significant role in regulating global warming (Gillespie et al., 2019; Ding et al., 2020; Liu et al., 2021). Assessing vegetation growth conditions is essential for ensuring the long-term stability and sustainability of terrestrial ecosystems (Hao et al., 2012; Meng et al., 2019). Therefore, monitoring and quantifying the spatiotemporal variations in vegetation dynamics are of great ecological importance. The Normalized Difference Vegetation Index (NDVI) is one of the most widely used indicators for assessing vegetation health because of its accessibility, high spatial and temporal resolution, and broad coverage (Nemani et al., 2003). A detailed analysis of the relationship between vegetation changes and climatic variables helps clarify their intrinsic linkages (Kong et al., 2018; Sun et al., 2021; Ding et al., 2022; Ren et al., 2023; Zheng et al., 2024). Such analyses are particularly valuable for understanding how environmental factors influence vegetation patterns in arid ecosystems.
Temperature is a key climatic factor of vegetation improvement, as it strongly influences plant growth processes, including the onset, cessation, and efficiency of respiration (Wang et al., 2011). Since 1980, global satellite observations have revealed significant alterations in vegetation structure, productivity, and coverage across the Northern Hemisphere, from temperate to boreal zones, largely attributed to rising global temperatures (Myneni et al., 1997; Nemani et al., 2003). Precipitation also serves as a critical determinant of vegetation growth (Guo et al., 2021). In arid regions, vegetation growth is mainly constrained by soil moisture; hence, even slight increases in precipitation can lead to substantial vegetation responses (Zhou et al., 2018; Du et al., 2025). The effect of precipitation varies across spatial and temporal scales. Over longer periods (≥10 years), persistent changes in precipitation can alter plant functional types and biodiversity composition within ecosystems, while interannual or seasonal precipitation variability can affect vegetation phenology and ground cover (Snyder and Tartowski, 2006). Moreover, human activities have exerted a pronounced influence on vegetation coverage (Zhang and Wu, 2020; Shi et al., 2021; Guo et al., 2023). With the acceleration of population growth and global economic development, anthropogenic impacts on ecosystems have intensified, potentially reshaping regional vegetation patterns (Liu et al., 2015). It is widely recognized that vegetation change results from the combined effects of natural and human drivers (Gao et al., 2023). However, these drivers interact in complex ways, jointly determining the spatial and temporal dynamics of vegetation.
Xinjiang, located in the arid northwestern region of China, possesses a fragile ecological environment but holds substantial ecological and strategic significance. Therefore, studying changes in vegetation cover across Xinjiang is essential for promoting ecological restoration and supporting the region’s sustainable development. Zhang et al. (2024) investigated the driving factors affecting NDVI and found that temperature exerts a greater influence on NDVI than precipitation. In contrast, Ma et al. (2025) reported that NDVI in Xinjiang is negatively correlated with temperature but shows a significant positive correlation with precipitation. Similarly, according to Cui et al. (2021), precipitation is the primary limiting factor influencing the evolution of desert vegetation in Xinjiang. Based on these studies, it can be inferred that NDVI in Xinjiang is primarily influenced by precipitation. However, inconsistencies among findings may arise due to variations in study areas, temporal scales, and methodological approaches. Although several studies have explored the impact of climate variables on NDVI, relatively few have examined how human activities contribute to its variation.
This study focuses on the Kalamaili Ungulate Nature Reserve (hereafter referred to as the “Kashan Reserve”) in Xinjiang to investigate the combined effects of climate change and human activities on NDVI dynamics. Situated on the eastern edge of the Junggar Basin, the Kashan Reserve represents a typical desert–grassland ecotone that is highly sensitive to environmental fluctuations. This unique location makes it an ideal site for exploring vegetation responses to climatic and anthropogenic factors. However, most existing NDVI research has concentrated primarily on broader regions of Xinjiang (Zhang et al., 2021; Zhang et al., 2024; Deng et al., 2024), while studies specifically targeting desert ecosystems remain limited.
Accordingly, this research takes the Kashan Reserve as the core study area and employs multiple analytical methods to comprehensively assess the interannual and seasonal spatiotemporal variations in NDVI from 2001 to 2022. The study further explores projected NDVI trends, the relationship between climate change and human activities in relation to NDVI, the relative contributions of climate and human activities, and the lag effects of climate change on vegetation. The objective is to provide a robust scientific foundation for the sustainable management of the Kashan Reserve and to offer insights for the long-term conservation of desert ecosystems.
2 Materials and methods
2.1 Study region
The Kashan Reserve (44°38′59″-46°03′43″N, 88°26′58″-90°09′43″E) is situated on the eastern periphery of the Junggar Basin and experiences a temperate desert climate (Figure 1). The topography of the area is a gradient, with lower elevation in the west and a gradual increase in elevation as it extends eastward. The reserve was established to protect a diverse range of rare and endangered ungulates and their habitats, preserving unique and vulnerable species that are critical to the region’s ecological integrity. It is one of the largest nature reserves in China’s lowland desert areas and plays a vital role in maintaining regional ecological balance and promoting biodiversity. Furthermore, the reserve functions as an essential ecological barrier preventing the eastward expansion of the Gurbantunggut Desert and an important ecological corridor connecting the Tianshan and Altay mountains.
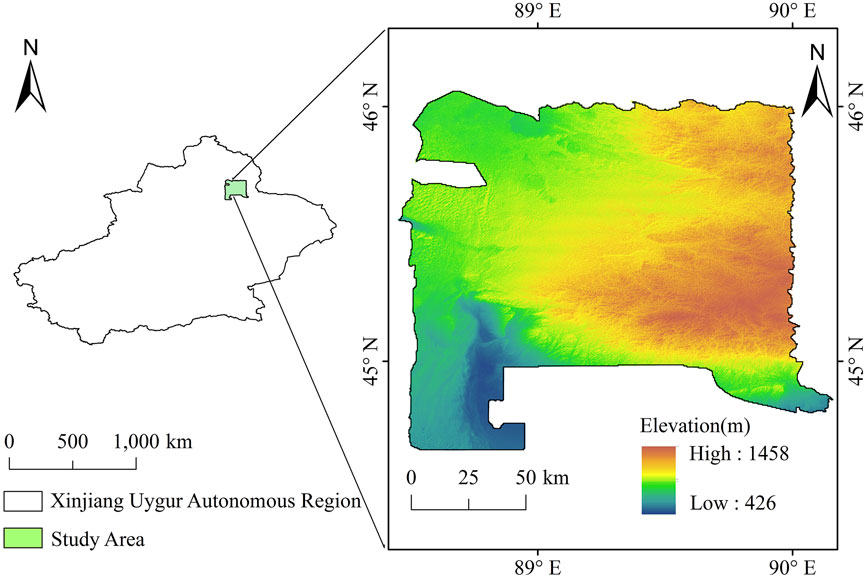
Figure 1. Location and elevation of the study area.
The Kashan Reserve supports a rich assemblage of protected species, including Equus przewalskii and Equus hemionus, both listed as national first-class protected animals, as well as Gazella subgutturosa, a national second-class protected species. This combination of ecological functions and rare fauna underscores the reserve’s exceptional conservation value in northwest China. It has been recognized as one of the principal sanctuaries for desert-adapted wildlife in the region (Xu et al., 2022).
2.2 Data preparation
The NDVI datasets used in this study were obtained from NASA’s MODIS data repository (https://search.earthdata.nasa.gov/search). Specifically, we used the MOD13Q1 product, which provides 250 m resolution, 16-day composite NDVI data and pixel reliability information, supplemented with land use data (Shao and Yang, 2023). The dataset covers China from 2001 to 2022. Prior to analysis, high-quality pixels were reconstructed using comparable valid single-period images and smoothed using the Savitzky–Golay (S–G) filtering method to produce a continuous time series. Subsequently, 16-day data were aggregated into monthly composites to ensure temporal consistency (Zhou et al., 2024).
Meteorological variables, including temperature and precipitation, were derived from the “China 1 km Resolution Monthly Mean Temperature Dataset” (https://data.tpdc.ac.cn/zh-hans/data/71ab4677-b66c-4fd1-a004-b2a541c4d5bf) and “China 1 km resolution Monthly Precipitation Dataset” (https://data.tpdc.ac.cn/zh-hans/data/faae7605-a0f2-4d18-b28f-5cee413766a2) provided by the National Tibetan Plateau Science Data Center (Chen et al., 2024; Wei et al., 2025). These datasets, stored in NETCDF format, have a spatial resolution of 1,000 m × 1,000 m, and their accuracy has been validated using observations from 496 meteorological stations across China. Seasonal divisions followed standard meteorological classifications: spring (March–May), summer (June–August), autumn (September to November), winter (December–February), and the vegetation growth period (April to October) (Wang et al., 2021).
The global anthropogenic impact dataset used in this study integrates eight variables—nighttime lights, agricultural land, grazing land, urban infrastructure, road networks, population density, rail transport, and navigable waterways—to quantify human pressures on the environment (Mu et al., 2022). Impact scores range from 0 to 50, where 0–1 indicates no human influence, 1–4 denotes minimal impact, and 4–50 reflects strong anthropogenic influence. This dataset enables a detailed assessment of how human activities contribute to landscape modification and ecological stress.
To address the spatial resolution mismatch between datasets, we applied bilinear interpolation to resample the 1 km monthly meteorological data to a 250 m resolution, aligning it with the NDVI data. Additionally, we aggregated the 16-day NDVI data to monthly intervals by calculating the average NDVI value over each month. This approach ensures that both datasets have consistent spatial and temporal. This preprocessing step ensures reliable integration and enhances the accuracy of subsequent analyses.
2.3 Methods
2.3.1 Theil-Sen trend analysis
The Theil-Sen median trend analysis serves as a reliable technique for discerning the patterns within long-term data sequences (Guo et al., 2020) (Equation 1). When β > 0, it signifies a rising tendency; when β < 0, it denotes a falling tendency (Huo et al., 2021).
2.3.2 Mann-Kendall test
The Mann-Kendall test is widely utilized to detect trends within time-series data (Neeti and Eastman, 2011; Li et al., 2020; Liu et al., 2020) (Equations 2–5). In this study, it was specifically applied to evaluate the significance of vegetation trends. When the Z value attains 1.96, it signifies that the tendency has undergone the importance test at a level of trust of 95%.
2.3.3 Hurst exponent
Reliability in quantifying long-term dependency or persistence in a time series (Mandelbrot and Wallis, 1969) has been demonstrated by the Hurst index, assessed by R/S . In particular, an index above 0.5 indicates a positive and lasting relationship in the NDVI. A Hurst index of 0.5 suggests that NDVI fluctuations follow a random walk pattern with no correlation to previous values, while a value less than 0.5 reflects a negative long-term relationship, implying that vegetation changes tend to reverse over time (Li et al., 2015). This makes the Hurst index particularly valuable for assessing the stability and sustainability of vegetation trends in arid ecosystems.
2.3.4 Partial correlation analysis
The pixel-by-pixel partial correlation approach is a widely used method for examining the relationships between vegetation growth and climatic factors such as mean temperature and cumulative precipitation (Equations 6–7). The partial correlation coefficient ranges from −1 to 1, where −1 represents a complete negative correlation, 1 indicates a perfect positive correlation, and 0 signifies no correlation (Arou and Deyganto, 2024; Zhang et al., 2024). The statistical significance of these coefficients was evaluated to identify the strength and direction of the associations.
Based on the magnitude and significance level of the coefficients, the results were categorized into six distinct types, with each type representing a unique outcome or pattern identified through the comprehensive test analysis. These types including extremely significant negative correlation (ρ < 0 and p < 0.01), significant negative correlation (ρ < 0 and 0.01 ≤ p < 0.05), non-significant negative correlation (ρ < 0 and p ≥ 0.05), non-significant positive correlation (ρ > 0 and p ≥ 0.05), significant positive correlation (ρ > 0 and 0.01 ≤ p < 0.05), and extremely significant positive correlation (ρ > 0 and p < 0.01) (Yang et al., 2016).
2.3.5 Lag time
Previous studies have shown that vegetation typically exhibits a lag of no more than one-quarter when responding to climatic factors (Wu et al., 2015). In this study, the lag effect was examined by calculating the partial correlation coefficients between NDVI and both temperature and precipitation for the current month and the preceding 1 to 3 months. By comparing these coefficients, the maximum partial correlation value for each pixel was identified, representing the strongest response of vegetation to climatic factors and determining the corresponding lag time (Liu et al., 2022; Li et al., 2023; Zhang et al., 2025) (Equations 8–11).
In the formula, RNP, RNT, and RPT denote the correlation coefficients between NDVI and precipitation and temperature and between these two factors, respectively. The sequence length is m, with Nm, Pm, and Tm representing NDVI, precipitation, and temperature data, respectively. Based on monthly data and prior research, the lag time k typically does not exceed 3 months.
2.3.6 Multiple regression residual analysis
Multiple regression residual analysis is employed to evaluate the relative influence of drivers on NDVI (Evans and Geerken, 2004; Zhao and Wei, 2024) (Equations 11–12). This approach comprises three steps: First, a regression model is established using the growing season NDVI and climate data, with NDVI as the dependent variable and climate factors as the independent variables, in order to calculate the model parameters. Secondly, predicted NDVI values (NDVICC) using the model parameters to reflect the effects of climate. Finally, calculated the difference between the observed NDVI and the predicted values (NDVIHA) to quantify the impact of human activities (Ren et al., 2024).
3 Results
3.1 Dynamics of NDVI
3.1.1 Spatiotemporal dynamics of NDVI
Figure 2 illustrates the temporal variation trend of NDVI within the Kashan Reserve from 2001 to 2022. During this period, NDVI values fluctuated between 0.076 and 0.102, with an average of 0.087. A distinct peak was recorded in 2017, when NDVI reached its maximum value of 0.102. Although NDVI values fluctuated over time, the overall trend showed a slight but non-significant upward pattern, increasing by approximately 0.0002 per year. This gradual rise suggests mild vegetation recovery, likely driven by climatic and ecological factors acting over the long term.
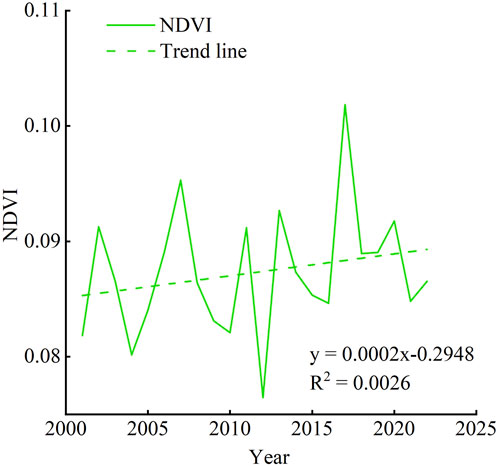
Figure 2. Temporal variation trend of NDVI in the Kashan Reserve during 2001-2022.
Using the NDVI dataset spanning 2001–2022, we calculated the NDVI index and analyzed both its spatial trends and significance of its fluctuations, as depicted in Figure 3. Figure 3a presents spatial distribution of NDVI values across the reserve. The unique topography of the Kashan Reserve, coupled with the influence of Atlantic westerlies, shapes the regional precipitation gradient, thereby affecting the spatial variability of NDVI. This demonstrates the combined effect of terrain and climate in determining vegetation patterns. Vegetation cover decreased primarily in the northern regions, while it increased in the southern parts, with NDVI change rates ranging from −0.003 to 0.004 (Figure 3b). Between 2001 and 2022, 68.11% of the reserve experienced an increase in vegetation, significantly exceeding the 31.8% of areas showing a decline. The reserve contained zones where NDVI significantly increased (11.40%), slightly increased (56.71%), or remained stable (0.40%) (Table 1). Areas showing substantial vegetation improvement were mainly located in the southern Figure 3d. These findings indicate that the southern section of the Kashan Reserve has shown relatively stable and positive vegetation dynamics over the past two decades.
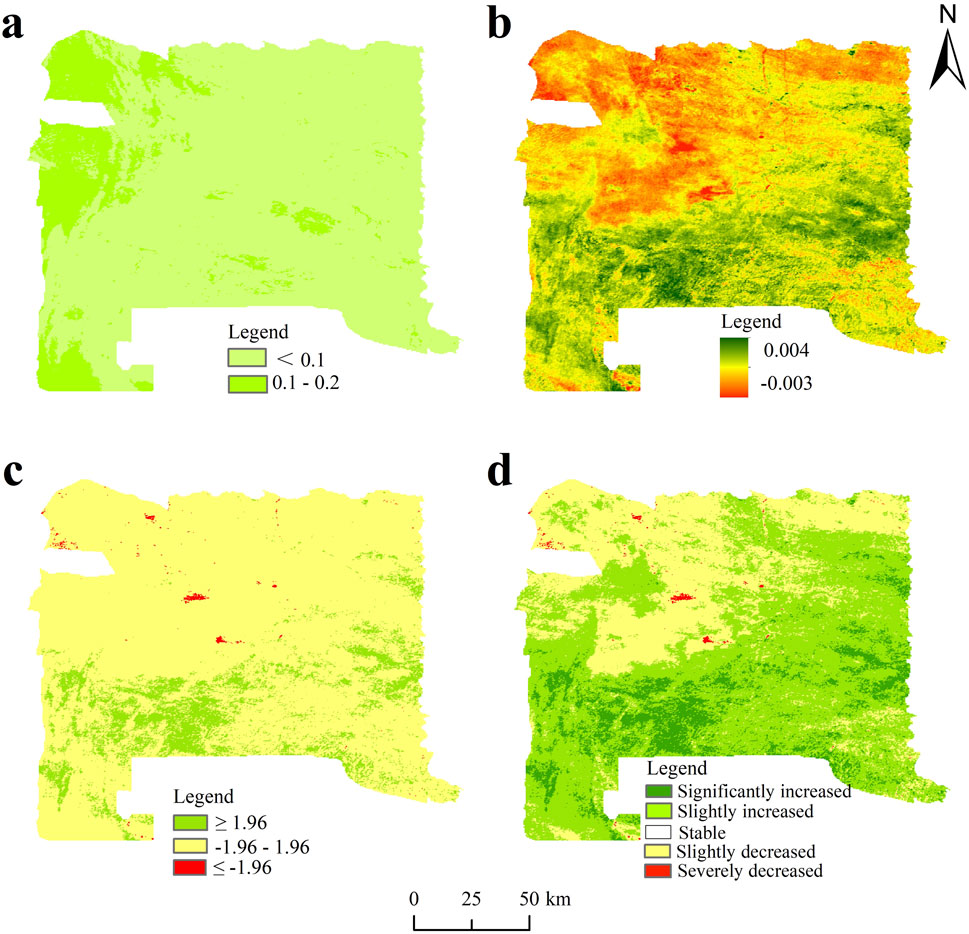
Figure 3. Interannual trend of NDVI in the Kashan Reserve during 2001-2022: (a) spatial pattern of NDVI; (b) slope of NDVI; (c) significance of NDVI trends; (d) spatial variation trends of NDVI.
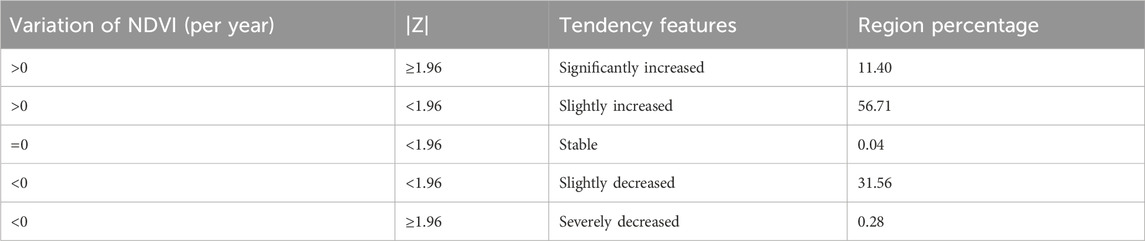
Table 1. Analysis of NDVI trends using statistical methods.
3.1.2 Sustainability of NDVI
Figure 4 provides an assessment of sustainability and trend dynamics within the Kashan Reserve from 2001 to 2022. The mean Hurst index value was 0.40, indicating low persistence and weak sustainability in vegetation growth trends. This suggests that the NDVI pattern may not maintain its current trajectory in the future. Therefore, enhanced conservation and restoration measures are necessary to mitigate potential vegetation degradation. Approximately 11.73% of the pixels exhibited a Hurst exponent greater than 0.5, while 88.26% were below 0.5, indicating that negative (reversing) trends are more dominant than positive persistence (Figure 4a).
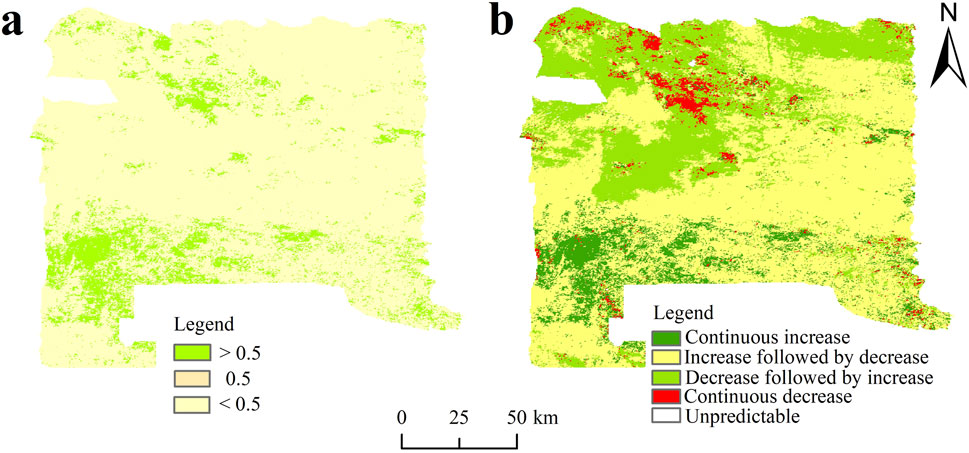
Figure 4. Future vegetation dynamics in the Kashan Reserve: (a) Hurst index of NDVI and (b) future sustainability of NDVI.
One objective is to explore potential future paths of NDVI (Jiang et al., 2015). The anticipated variations in NDVI within the Kashan Reserve are predominantly characterized by a transition from an ascending to a descending trend, impacting 59.16% of the reserve’s area (Table 2). The spatial distribution of these predicted changes is highly heterogeneous (Figure 4b). This projection emphasizes the importance of proactive ecological management and continuous monitoring to prevent vegetation decline and ensure ecosystem resilience.
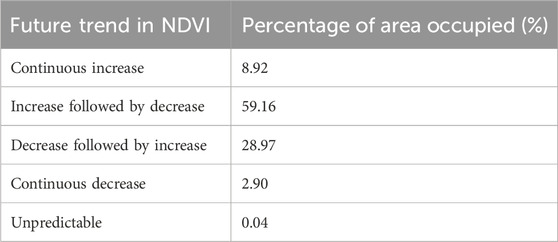
Table 2. NDVI potential developments in vegetation cover in the Kashan Reserve.
3.2 Dynamics of climatic factors
3.2.1 Annual dynamics of climatic factors
Figure 5a depicts the temperature gradient across the Kashan Reserve, showing a decrease from southwest to northeast. The southwestern part, where most human settlements are located, is relatively warmer. This pattern results from the region’s geographical position and the influence of westerly winds, which also create a precipitation gradient decreasing from west to east (Figure 5c). Over the study period, temperature increased at an average annual rate of 0.0342 °C (Figure 5b), whereas precipitation decreased at a rate of 0.6451 mm per year (Figure 5d). These observations are consistent with previous findings on climate change in Xinjiang from 2000 to 2022 (Zhang et al., 2024). Such divergent temperature and precipitation trends indicate growing climatic stress that may influence vegetation sustainability in the region.
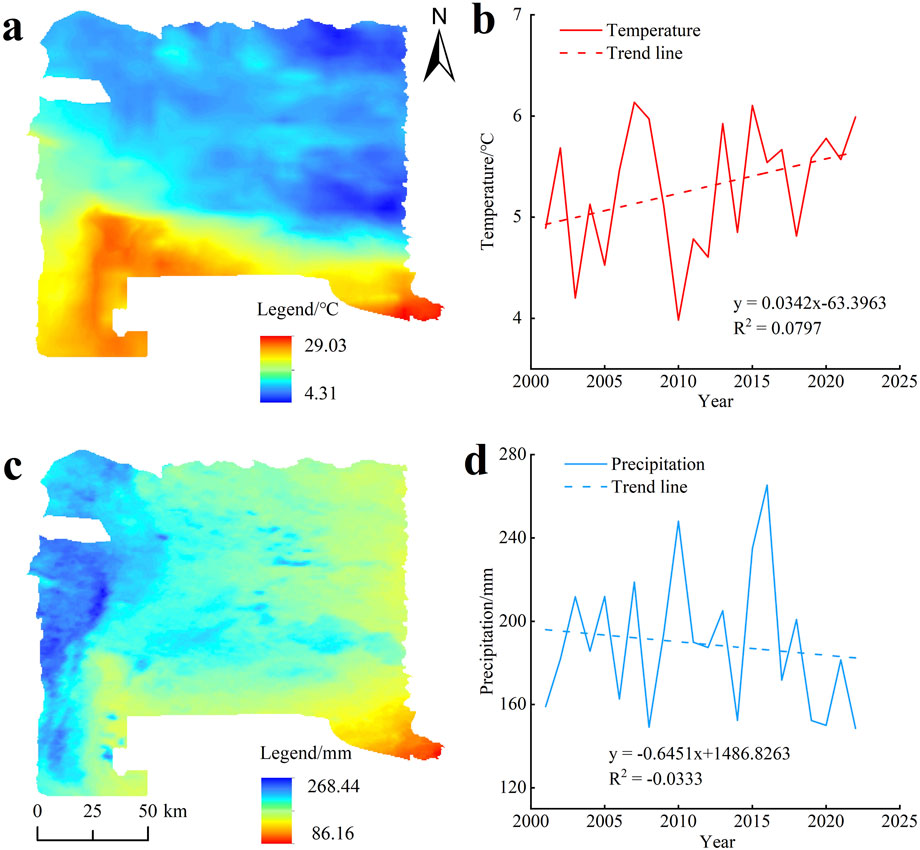
Figure 5. Spatial and temporal distribution: (a) temperature spatial distribution; (b) temperature temporal trend; (c) precipitation spatial distribution; (d) precipitation temporal trend.
3.2.2 Seasonal dynamics of climatic factors
From 2001 to 2022, the Kashan Reserve exhibited pronounced spatiotemporal variations in temperature, precipitation, and NDVI across different seasons. In spring, rising temperatures coincided with declining precipitation but were accompanied by an increase in NDVI, indicating that vegetation growth during this season is primarily temperature-sensitive (Figure 6a). In contrast, summer exhibited both rising temperatures and falling precipitation, which together caused a marked decline in NDVI. This suggests that high temperatures and drought conditions impose dual stress on vegetation, leading to reduced NDVI values during this season (Figure 6b). In autumn, NDVI declined despite increasing precipitation and falling temperatures (Figure 6c). This phenomenon likely reflects the late-stage growth phase of vegetation, during which physiological and energy limitations restrict plant growth, preventing substantial increases and contributing to the observed decline in NDVI (Figure 6c). Throughout the growing season, an increase in temperature and a decrease in precipitation led to an increase in NDVI. This suggests that the vegetation exhibits a high level of drought tolerance and is capable of sustaining growth through adaptive water-use strategies (Figure 6d). This adaptive behavior highlights the resilience of desert–grassland vegetation under water-limited conditions.
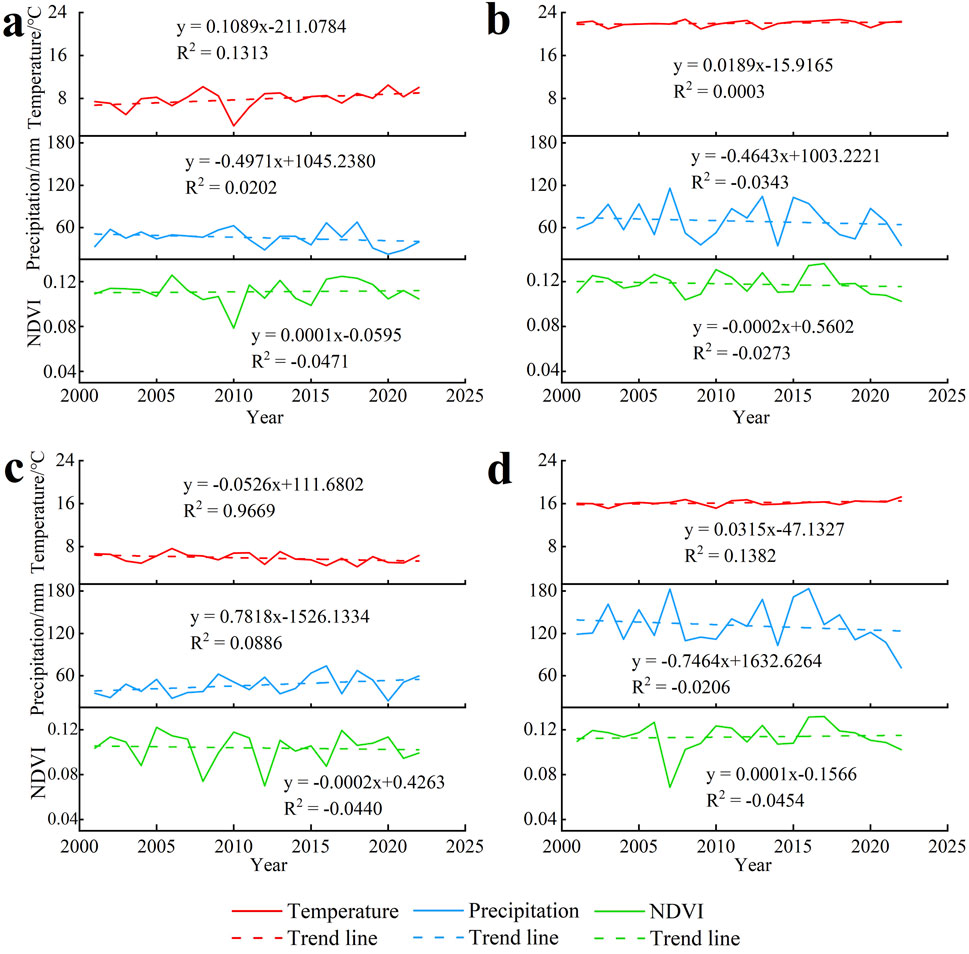
Figure 6. Trends of temperature, precipitation, and NDVI for (a) spring, (b) summer, (c) autumn, and (d) the growing season in the Kashan Reserve during 2001-2022.
Figures 7a–d, reveal the spatial distribution of seasonal NDVI variations within the Kashan Reserve. The significance of these NDVI trends is further highlighted in Figures 7e–h. The most notable increase in springtime NDVI is localized to the southern region, which accounted for 52.70% of the total area. Conversely, NDVI decreased during summer across 79.89% of the reserve. In autumn and throughout the growing season, NDVI showed modest reductions, covering 72.34% and 56.44% of the area, respectively (Table 3). Figures 7i–l depict the spatial heterogeneity in temperature distribution. While, Figures 7m–p notably shows that the topographic slope of the reserve decreases from east to west, closely aligning with seasonal precipitation distribution. This tight coupling between topography, precipitation, and vegetation response underscores the complex interactions that shape ecological patterns within the Kashan Reserve.
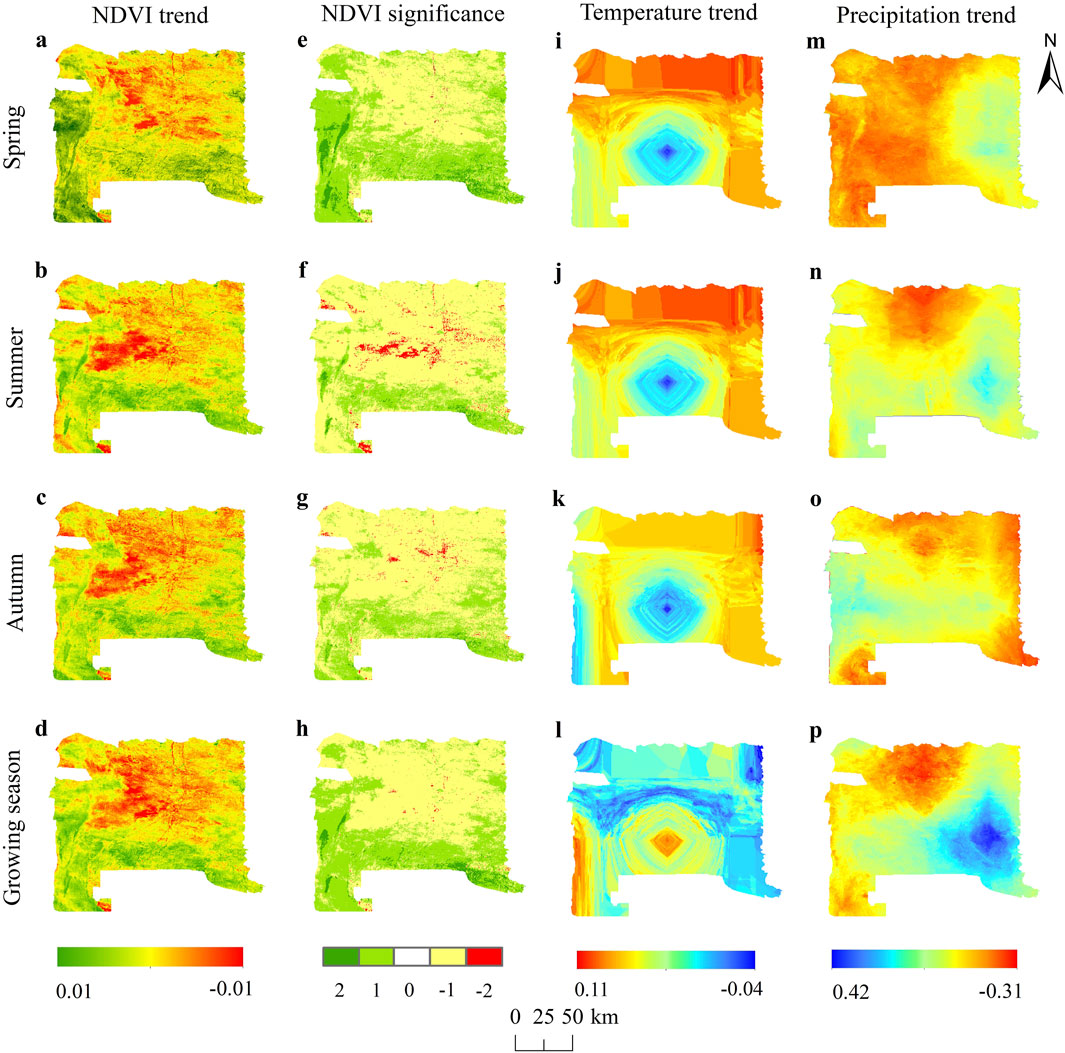
Figure 7. The trends of NDVI, temperature, and precipitation: (a–d) NDVI trends; (e–h) the significance of NDVI trends; (i–p) temperature and precipitation trends.
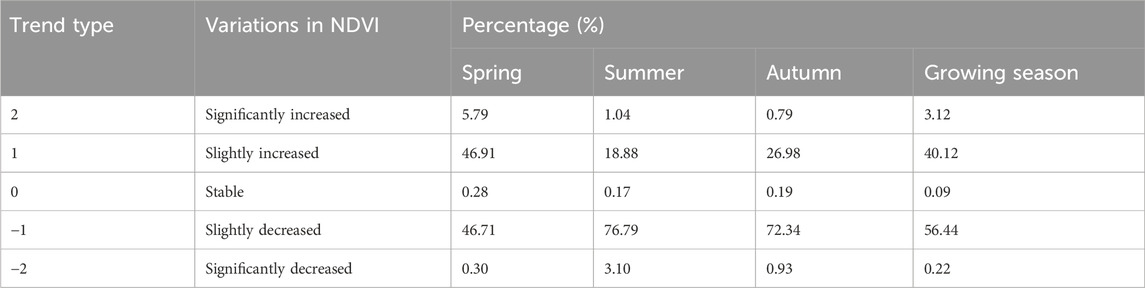
Table 3. The seasonal significance of NDVI trends in the Kashan Reserve.
3.3 Partial correlation analysis between NDVI and drivers
3.3.1 Exploring the impact of climate factors on NDVI
This research explored the correlation between NDVI, temperature, and precipitation in the Kashan Reserve. As shown in Table 4, the annual NDVI showed a significant positive relationship with temperature (81.01%) and a significant negative correlation with precipitation (59.59%). These results indicate that temperature plays a more prominent role than precipitation in influencing vegetation dynamics on an annual scale.
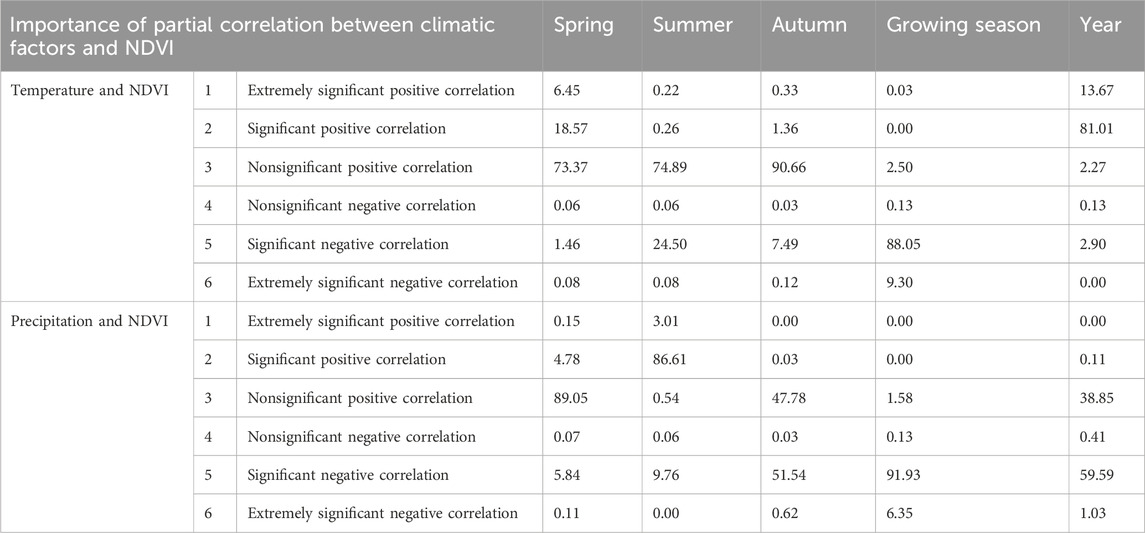
Table 4. Significance of temperature, precipitation, and NDVI.
Seasonally, NDVI showed positive correlations with temperature during spring, summer, and autumn, accounting for 98.39%, 75.37%, and 92.35% of the total area, respectively. In spring, correlation coefficients between temperature and NDVI ranged from −0.991 to 0.950, with most areas showing a non-significant positive relationship (Figures 8a,f). During summer, the correlation varied from −0.991 to 0.994, again dominated by non-significant positive associations (Figures 8b,g). In autumn, correlations ranged from −0.986 to 0.974, maintaining a generally weak positive pattern (Figures 8c,h). However, during the growing season, NDVI and temperature exhibited a range from −0.701 to 0.590, characterized mainly by significant negative relation (Figures 8d,i).
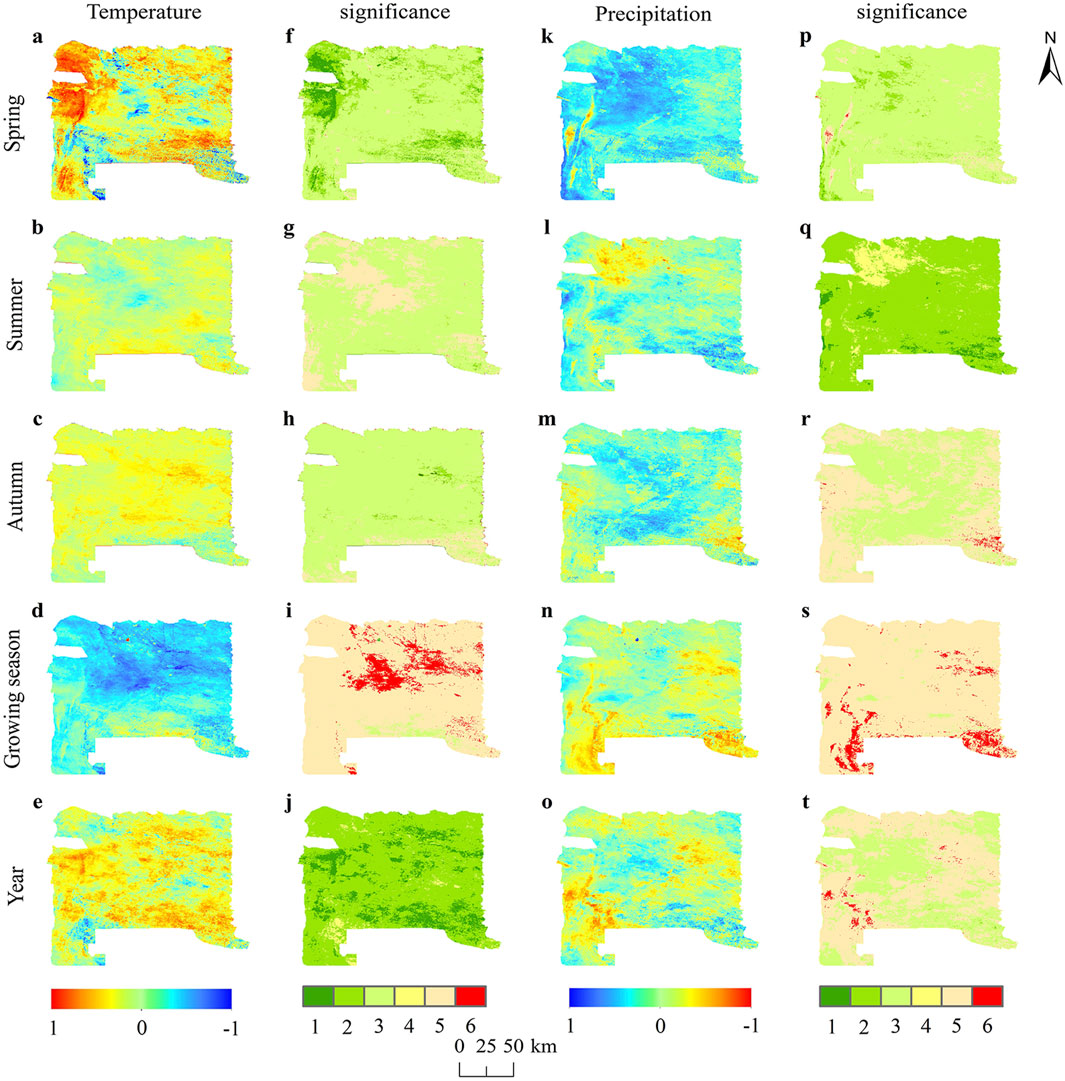
Figure 8. The figures show the correlation and significance among NDVI, temperature, and precipitation across spring, summer, autumn, the growing season, and the interannual during 2001-2022. (a–e) NDVI response to temperature; (f–j) significance between NDVI and temperature; (k–o) NDVI response to precipitation; (p–t) significance between NDVI and precipitation.
NDVI was positively correlated with precipitation in spring and summer, accounting for 93.98% and 90.16% of the total area, respectively. Conversely, NDVI was negatively correlated with precipitation during autumn (52.19%) and the growing season (98.41%). In spring, NDVI–precipitation correlations ranged from −0.773 to 0.742, primarily showing non-significant positive relation (Figures 8k,p). In summer, correlations spanned −0.528 to 0.789, with most regions exhibiting significant positive relationships (Figures 8l,q). In autumn, the values ranged from −0.791 to 0.590, indicating predominantly significant negative correlations (Figures 8m,r). During the growing season, NDVI varied between −0.771 and 0.399 in relation to precipitation, showing an overall significant negative relation (Figures 8n,s).
The study demonstrated that temperature is the predominant climatic factor influencing NDVI during the growing season and on an annual basis, while precipitation exerted greater influence in summer, autumn, and during the overall growing period. These findings suggest that vegetation in the Kashan Reserve is more sensitive to temperature fluctuations under limited water availability, whereas precipitation becomes critical during peak growth stages when moisture stress intensifies.
3.3.2 Exploring the impact of human activity on NDVI
Analysis of anthropogenic impact data from 2001 to 2020 revealed that areas with minimal human disturbance are more extensive than those with no human influence, while regions with significant disturbance occupy the smallest proportion. This pattern likely reflects the cumulative effects of human activities such as mining, road construction, and industrial park development. These activities are not confined to the periphery of the reserve but are dispersed across its core, buffer, and experimental zones, resulting in widespread low-to-moderate anthropogenic pressure.
Figure 9a illustrates that the interannual anthropogenic impact trend ranges from −0.059 to 0.066. A decreasing trend in human disturbance was observed across 63.85% of the reserve, while only 36.14% showed an increasing trend. This overall decline suggests that conservation measures and management efforts within the reserve have been largely effective. Figure 9b shows that areas of low human impact (48.46%) are primarily distributed in desert regions, while zones of substantial human activity (5.83%) are concentrated near Wucaiwan town, Provincial Highway S11, and National Highway G216. Correlation analysis between annual NDVI and anthropogenic impact data revealed coefficients ranging from −0.698 to 0.927. Positive correlations were mainly clustered around Wucaiwan (Figure 10a), indicating that human-modified areas may experience localized vegetation improvements, possibly due to irrigation or restoration efforts. However, only 4.39% of the area exhibited statistically significant correlations, predominantly near towns and transport corridors with frequent human activity (Figure 10b). These results suggest that while human activities have altered vegetation patterns locally, their overall influence on NDVI dynamics remains secondary to climatic factors.
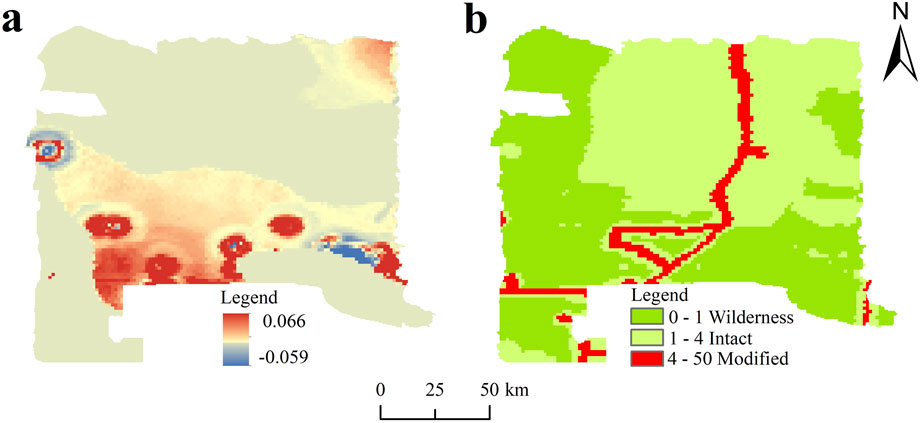
Figure 9. (a) The interannual trend of human activity; (b) the spread of human activity over time.
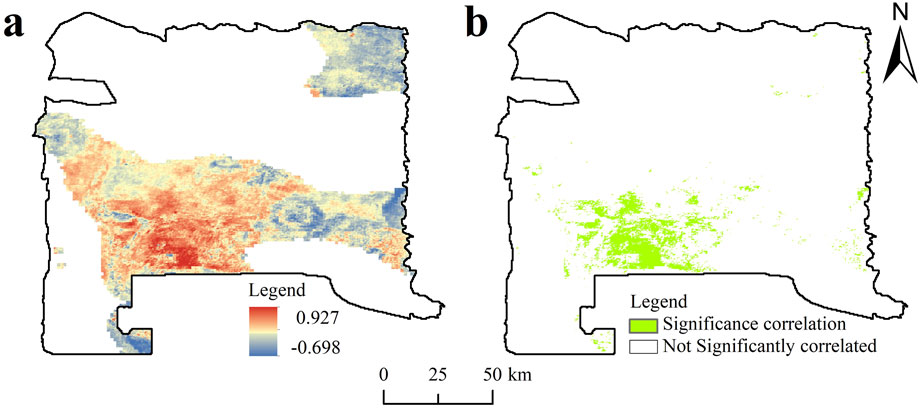
Figure 10. Analysis of the relationship between NDVI and human activity: (a) correlational analysis and (b) evaluation of impact significance.
3.3.3 Lag effect of NDVI on climate factors
Figure 11a shows that the maximum partial correlation coefficients between NDVI and temperature are lower in the northern and southwestern parts of the reserve and higher in the southern and northwestern regions. Areas with maximum partial correlation coefficients below −0.2 constitute the largest proportion (75.57%). As illustrated in Figure 11b, 93.23% of the reserve exhibited a lagged response to temperature changes. The most prominent lag period was 2 months, covering 48.31% of the area, primarily in the central region. Areas showing a 3-month lag were located mainly in the western and eastern regions (33.22%), where elevation differences are more pronounced. The extended lag in the higher-elevation east corresponds with slower soil temperature responses and delayed vegetation greening, reflecting the topographic influence on thermal dynamics.
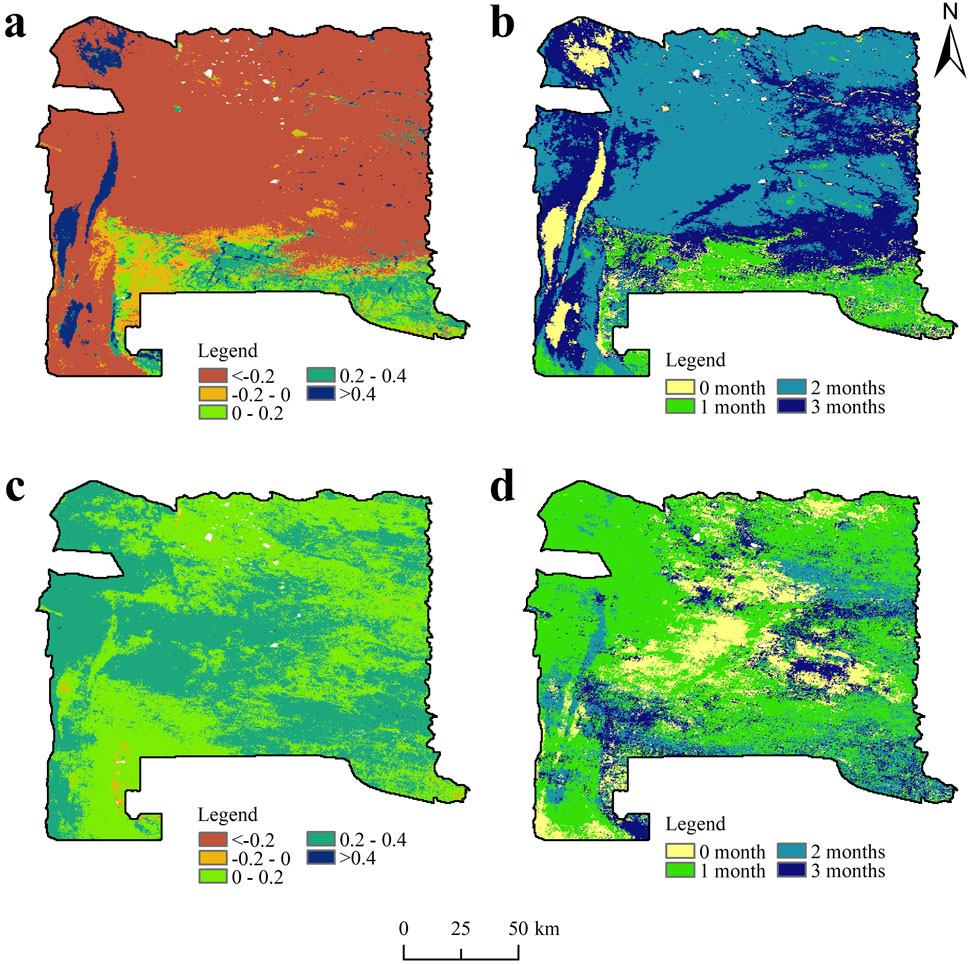
Figure 11. Maximum partial correlation coefficient, and lag time among NDVI, temperature, and precipitation in the Kashan Reserve during 2001–2022: (a) The maximum partial correlation coefficients between NDVI and temperature. (b) The lag time between NDVI and temperature. (c) the maximum partial correlation coefficients between NDVI and precipitation. (d) the lag time between NDVI and precipitation.
Figure 11c shows that only 0.57% of areas have a maximum partial correlation coefficient of less than zero, while 99.05% have coefficients ranging from 0 to 0.4. This suggests that while vegetation does exhibit a delayed response to precipitation changes, the overall effect is modest, implying a relatively high level of drought adaptation. Besides precipitation, other factors—particularly temperature and human activity—appear to play a more dominant role in vegetation variability. Figure 11d further shows that 84.65% of vegetated areas exhibited a lagged response to precipitation of one to 3 months, with the majority (57.47%) located in the northwestern and central regions, displaying a 1-month lag.
These findings highlight the importance of considering the effects of climate change. Incorporating such delayed effects into ecological management strategies is essential for improving conservation planning, forecasting vegetation dynamics, and enhancing the resilience of the Kashan Reserve’s ecosystem.
3.4 Analysis of drivers of NDVI
3.4.1 Factors driving NDVI dynamics
Figure 12 shows that, under the combined influence of climate change and human activities, approximately 55.69% of the vegetation in the Kashan Reserve has improved, primarily in the southern part of the reserve. About 13.21% of the observed vegetation increase is attributed solely to climatic factors. These areas are located near the southern Altay region, which receives relatively higher precipitation, thereby providing favorable conditions for vegetation growth. In contrast, improvements in vegetation caused exclusively by human activities account for only 0.93% of the total area, mainly distributed along the reserve’s periphery. However, approximately 2.30% of the reserve has experienced vegetation degradation due to the combined effects of climate change and human activities, particularly in the central and northeastern regions. Vegetation decline driven solely by climate change constitutes about 0.17% of the total area, whereas degradation caused solely by human activities has affected around 27.07% of the region. This degradation is most pronounced in the northern sector, where extensive mining operations occurred prior to 2016. These activities disrupted surface vegetation, increased soil erosion, and accelerated ecological degradation, leaving lasting environmental impacts that underscore the vulnerability of the region’s fragile ecosystems.
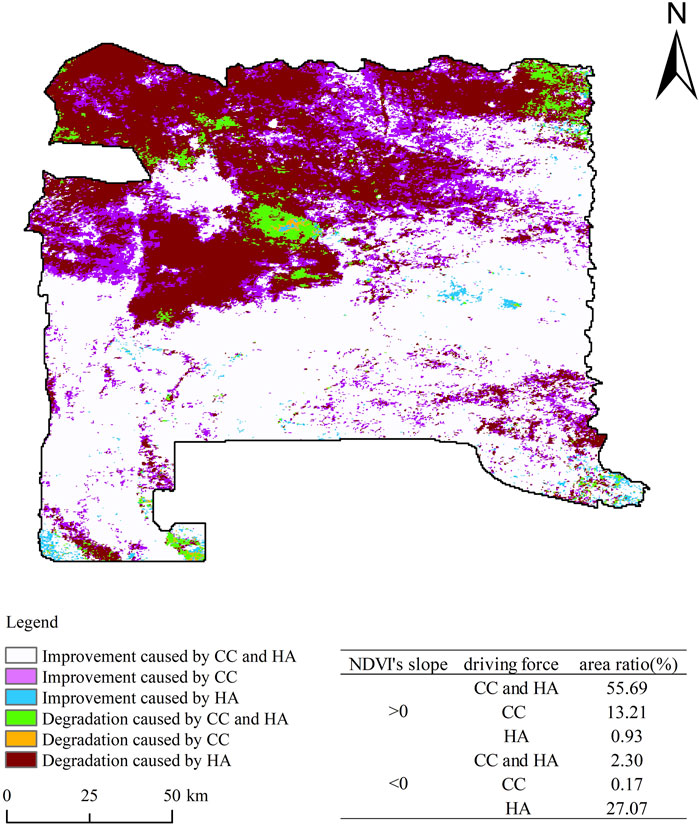
Figure 12. Drivers of NDVI change in the Kashan Reserve during 2001-2022.
3.4.2 Contributions of driving factors to NDVI
Figure 13a shows that climate change has generally had a positive effect on NDVI within the Kashan Reserve, affecting around 69.42% of the area. This impact is particularly pronounced in the southwestern and eastern regions. Notably, areas where climate change contributes more than 80% to NDVI account for 17.50% and are mainly located in the north of the reserve. Conversely, areas where climate change has had a negative impact on NDVI account for 30.58% and are mainly concentrated in the north. In these regions, the proportion of areas where climate change contributed between −20% and 0% to NDVI is relatively large, at around 29.77%. Overall, NDVI driven by climatic factors is primarily concentrated in the southern section of the reserve. This spatial pattern results from a combination of topographic gradients—higher elevations in the east and lower in the west—and localized engineering measures that create distinct microclimates, thereby enhancing spatial heterogeneity in vegetation response.
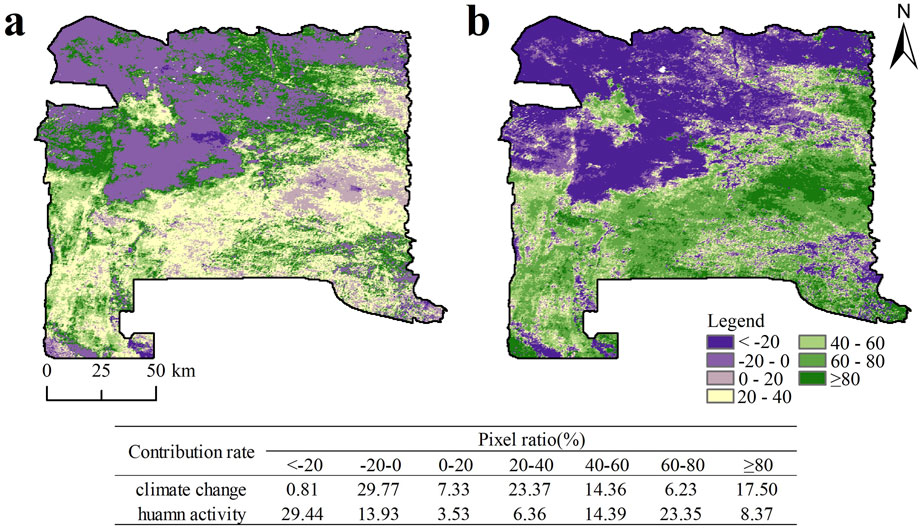
Figure 13. Contribution rate of (a) CC and (b) HA to NDVI.
Figure 13b shows that human activities positively influenced NDVI in 56.63% of the Kashan Reserve, primarily in the south. Notably, areas where human activities contributed 60–80% to vegetation improvement covered approximately 23.35% of the total area. These improvements can be attributed to higher local temperatures and precipitation, as well as the implementation of ecological restoration initiatives, such as afforestation, grassland protection, and restricted grazing policies, that have substantially enhanced vegetation coverage within and around the reserve.
4 Discussion
4.1 Analysis and interpretation of NDVI spatiotemporal dynamics
This study observed an overall upward trend in NDVI across the Kashan Reserve, aligning with vegetation evolution patterns reported for the broader Xinjiang (Liu et al., 2024; Zhang et al., 2024; Lu et al., 2025; Ma et al., 2025). The NDVI exhibited a modest yet consistent increase, with a growth rate of 0.0002 per year and a peak value in 2017. This improvement can be attributed to a series of ecological management initiatives implemented by local governments and conservation authorities in Fuyun County, Jimusar County, and the Kashan Reserve. In particular, all forms of industrial development and construction—including mining, oil extraction, and tourism projects—were suspended within the reserve. These measures have significantly contributed to ecological recovery and vegetation restoration.
Spatially, NDVI in the Kashan Reserve exhibits a distinct gradient, with higher values in the west and lower values in the east. This spatial heterogeneity results from the combined effects of terrain, temperature, and precipitation. The western part, characterized by relatively higher precipitation and warmer temperatures, offers more favorable conditions for vegetation growth, leading to higher NDVI values. Conversely, the eastern region, where precipitation is lower and temperatures are cooler, supports less vegetation cover, resulting in lower NDVI values. This west–east gradient highlights the strong control exerted by environmental factors on vegetation distribution and provides a scientific basis for targeted ecological planning and management strategies in the reserve.
The Hurst exponent analysis indicated that reverse persistence in vegetation change (tendency toward decline) is stronger than positive persistence (tendency toward continued improvement). When integrated with Sen’s slope analysis, this finding suggests a potential future transition from an upward to a downward NDVI trend. These results are consistent with the findings of Chen et al. and Ma et al., which also reported weakening vegetation stability in parts of Xinjiang (Chen et al., 2023; Ma et al., 2025). Therefore, proactive measures to enhance vegetation resilience and maintain ecosystem stability are essential for the sustainable development of the Kashan Reserve.
4.2 NDVI change driven by climate change and human activities
From 2001 to 2022, the Kashan Reserve experienced a gradual rise in temperature accompanied by a decline in precipitation. These findings are consistent with previous studies on climate change in Xinjiang (Zhang et al., 2024; Lu et al., 2025; Ma et al., 2025). The influence of climate variability on vegetation dynamics has long been acknowledged, and numerous studies have examined the relationship between climatic factors and vegetation changes across the Xinjiang (Zhu et al., 2023; Dou et al., 2025). This study explored the combined effects of climate change and human activities on NDVI variations within the Kashan Reserve. As shown in Figure 8 and Table 4, temperature emerged as the dominant climatic factor affecting NDVI on both the annual and growing-season scales, while precipitation exerted a stronger influence during the annual, summer, autumn, and growing seasons. Zhang et al. (2024) reported that precipitation is positively correlated with NDVI in spring, summer, and the growing season, but negatively correlated in autumn. Temperature was also positively correlated with NDVI, with the strongest effect observed in spring. Similarly, Lu et al. found that temperature is the main climatic driver of NDVI variation in spring and autumn, whereas precipitation plays a leading role in summer and winter (Lu et al., 2025). In this study, temperature showed a positive correlation with NDVI during spring, summer, and autumn, while precipitation showed a positive but non-significant correlation in spring. The discrepancies between these findings likely stem from differences in study area and scale. The Kashan Reserve, situated on the eastern edge of the Junggar Basin, experiences more pronounced seasonal climatic contrasts and heightened sensitivity to precipitation, resulting in more diverse vegetation responses.
At the interannual scale, NDVI demonstrated a significant positive correlation with temperature (81.01%) and a significant negative correlation with precipitation (59.59%). In contrast, previous studies (Zhang et al., 2024; Lu et al., 2025) found positive correlations for both factors. This divergence can be attributed to the dominance of desert vegetation within the Kashan Reserve, which has a limited capacity for retaining soil moisture. As temperatures rise, the increased rate of surface evaporation reduces the availability of soil water, thereby weakening the relationship between precipitation and vegetation growth.
As Xinjiang’s economy develops, human activities are playing an increasingly significant role in its ecosystems, with an undeniable impact on vegetation growth. The study utilized the residual analysis approach to differentiate the impacts of climate and human activity on NDVI. The findings indicate that NDVI variations in the Kashan Reserve are driven by both natural and anthropogenic factors. The combined effect of climate change and human activities accounts for 55.69% of the total vegetation variation. Human-induced vegetation degradation occupies the largest proportion, covering 27.07% of the reserve, while the overall vegetation trend remains positive, signifying gradual improvement. Climatic factors contributed 68.79% to NDVI variation, while human activities contributed 56%. Moreover, 31.72% of the reserve area experienced more than 60% NDVI contribution from human activities. These findings align with those of Liu et al. and Lu et al., who concluded that human activities have exerted an overall positive effect on vegetation restoration in Xinjiang (Liu et al., 2018; Lu et al., 2025). This improvement is largely attributable to government-led ecological initiatives, including vegetation restoration projects, habitat conservation, and grazing control policies that promote ecological recovery and enhance wildlife habitats.
Despite the extreme environmental pressures of drought, high temperatures, and frequent sandstorms, the Kashan Reserve remains a biodiversity hotspot, supporting a rich variety of rare and endemic species. The survival and reproduction of these species depend on specialized ecological processes and efficient water regulation mechanisms. Desert vegetation in this region has evolved distinct physiological adaptations for water uptake and utilization, enabling it to maximize the use of scarce rainfall. These ecological responses provide important insights into the functioning and resilience of vegetation in arid ecosystems.
4.3 Temporal lag effects on NDVI dynamics
The response of vegetation to climate change is not immediate but often exhibits a temporal lag. The present study identified a significant lag effect of climatic factors on vegetation dynamics. The lag period for temperature was predominantly 2 months, reflecting the gradual nature of thermal adaptation. Following an increase in temperature, vegetation requires time to adjust its physiological and metabolic processes to the new environmental conditions. In contrast, the lag period for precipitation was primarily 1 month, a pattern attributed to the desert landscape of the Kashan Reserve, where high soil permeability allows rainfall to infiltrate rapidly and become available to plants shortly after precipitation events. Wang et al. found that vegetation responds to climate changes with an average lag of 1.4 months across Xinjiang (Wang et al., 2023), consistent with the findings of this study.
4.4 Limitations and future works
The findings of our research have significant implications for the sustainable and coordinated development of desert ecosystems. In this study, we employed bilinear interpolation to resample various raster datasets to a uniform resolution, a method well-suited for continuous data requiring smooth transitions, such as temperature and precipitation maps. However, there are several limitations that warrant consideration. MOD13Q1 provides extensive vegetation cover data, it is subject to certain limitations, especially under cloud cover and atmospheric interference. To address this issue, the maximum value compositing method was applied to synthesize monthly NDVI data for the Kashan Reserve from 2001 to 2022, selecting pixels with the highest NDVI values within each time window to minimize cloud and atmospheric effects and improve data quality. Despite atmospheric correction of the MOD13Q1 data, residual atmospheric disturbances such as haze and clouds may still affect accuracy and introduce potential errors (Gao et al., 2020; Shen et al., 2022). The diverse soil types within the Junggar Basin, along with substantial variations in soil color and moisture content, can interfere with NDVI signals, introducing uncertainty in the estimation of vegetation cover (Tian et al., 2016). Furthermore, because vegetation responses to drought are often delayed, NDVI primarily reflects vegetation conditions over a certain period and may not provide immediate warnings of impending drought (Kumar et al., 2021). These limitations restrict the ability to fully capture dynamic changes in vegetation and ecosystem functions within the Kashan Reserve. In future work, research will aim to establish a more comprehensive index system to better describe and monitor ecosystem changes (Sun et al., 2025). This expanded framework will integrate NDVI with other key ecological indicators, such as soil moisture, sand index, surface temperature, and evapotranspiration, to enhance the accuracy of vegetation monitoring and to support early warning systems for ecological risks. Ecosystem services have become a central focus in ecological research, offering critical scientific foundations for conservation and sustainable development (Gong et al., 2025). Despite their importance, studies adopting small-scale, long-term, and multidimensional approaches remain limited, and this research gap will be a primary focus of future investigations.
When analyzing human activity using nighttime light data, accuracy is significantly influenced by the scale and morphology of settlements (Huang et al., 2025). The Kashan Reserve is characterized by small-scale, block-like settlements. Such settlements, often situated within densely utilized areas, are prone to overestimation of human activity because nighttime light sensors may capture illumination from surrounding regions, inflating activity measurements. Settlement morphology further affects the results, as block-shaped settlements on flat terrain can experience light saturation and background interference. Therefore, when using nighttime light data to analyze human activities, it is crucial to account for both settlement scale and morphological characteristics to ensure reliable interpretation of human influence.
5 Conclusion
This study examined how NDVI in the Kashan Reserve of Xinjiang responds to climate change and human activities, with the principal discoveries being:
1. NDVI demonstrated an upward trend characterized by fluctuations, increasing at a rate of 0.0002 per year. Spatially, NDVI followed a west-high and east-low distribution pattern, shaped by topography, climate, and human activities.
2. The effects of temperature and precipitation on NDVI exhibited significant spatial and temporal heterogeneity. Temperature was the primary factor influencing NDVI during annual and growing -season periods, while precipitation primarily affected NDVI during annual, summer, autumn, and growing -season periods.
3. Human activities such as mining, oil extraction, and tourism significantly impacted NDVI. After the implementation of ecological restoration initiatives in 2016, NDVI peaked in 2017 and has since stabilized, indicating that these measures have been highly effective in preventing further deterioration, delivering a solid scientific basis for the reserve’s future management strategies.
4. The future NDVI trend is projected to shift from an increasing to a decreasing trajectory, signaling new challenges and uncertainties for vegetation development. Temperature showed a 2-month lag effect on NDVI, while precipitation exhibited a 1-month lag.
5. The results revealed that 55.69% of the Kashan Reserve experienced increases in growing-season NDVI driven by the combined effects of climate change and human activities.
Data availability statement
The original contributions presented in the study are included in the article/Supplementary Material, further inquiries can be directed to the corresponding author.
Author contributions
CY: Conceptualization, Formal Analysis, Software, Writing – original draft, Writing – review and editing. XW: Funding acquisition, Writing – review and editing. GS: Funding acquisition, Writing – review and editing. LZ: Funding acquisition, Writing – review and editing. WH: Conceptualization, Methodology, Supervision, Writing – review and editing. HP: Visualization, Writing – review and editing. LL: Visualization, Writing – review and editing.
Funding
The author(s) declare that financial support was received for the research and/or publication of this article. This research was funded by Research and Demonstration of Restoration Techniques for Damaged Ecological Units in Kalamaili National Park (XJLYKJ-2024-01), Dynamic Capture and Trend Analysis of Static Habitat Factors at Key Nodes in Kalamaili National Park (XJLYKJ-2023-06), by Study on the Driving Mechanism of Grassland Degradation and Comprehensive Prevention and Control in Ebinur Lake Basin (2023EGA123).
Conflict of interest
The authors declare that the research was conducted in the absence of any commercial or financial relationships that could be construed as a potential conflict of interest.
Generative AI statement
The author(s) declare that no Generative AI was used in the creation of this manuscript.
Any alternative text (alt text) provided alongside figures in this article has been generated by Frontiers with the support of artificial intelligence and reasonable efforts have been made to ensure accuracy, including review by the authors wherever possible. If you identify any issues, please contact us.
Publisher’s note
All claims expressed in this article are solely those of the authors and do not necessarily represent those of their affiliated organizations, or those of the publisher, the editors and the reviewers. Any product that may be evaluated in this article, or claim that may be made by its manufacturer, is not guaranteed or endorsed by the publisher.
Supplementary material
The Supplementary Material for this article can be found online at: https://www.frontiersin.org/articles/10.3389/fenvs.2025.1685330/full#supplementary-material
References
Arou, J. A., and Deyganto, K. O. (2024). The influence of inflation rate on economic growth in South Sudan. Qeios. doi:10.32388/R0CRQI
Chen, Y., Ma, L., Liu, T., Huang, X., and Sun, G. (2023). The synergistic effect between precipitation and temperature for the NDVI in northern China from 2000 to 2018. Appl. Sci. 13, 8425. doi:10.3390/app13148425
Chen, X., Yan, Q., Yi, M., Ma, X., Li, G., Wu, Z., et al. (2024). Analysis of spatial and temporal variations of NDVI and its driving factors in the corridor of Lan-Xin railway. Front. Environ. Sci. 12, 1369974. doi:10.3389/fenvs.2024.1369974
Cui, C., Guo, Y., and Shen, Y. (2021). Spatio-temporal variation in and the driving factors of desert vegetation in Xinjiang. Chin. J. Eco-Agriculture 29, 1668–1678. doi:10.13930/j.cnki.cjea.210121
Deng, Q., Zhang, C., Dong, J., Li, Y., Li, Y., Huang, Y., et al. (2024). Variations over 20 years in vegetation dynamics and its coupled responses to individual and compound meteorological drivers in Sichuan Province, China. Atmosphere 15, 1384. doi:10.3390/atmos15111384
Ding, Y., Li, Z., and Peng, S. (2020). Global analysis of time-lag and -accumulation effects of climate on vegetation growth. Int. J. Appl. Earth Observation Geoinformation 92, 102179. doi:10.1016/j.jag.2020.102179
Ding, Y., He, X., Zhou, Z., Hu, J., Cai, H., Wang, X., et al. (2022). Response of vegetation to drought and yield monitoring based on NDVI and SIF. CATENA 219, 106328. doi:10.1016/j.catena.2022.106328
Dou, X., Li, X., Sang, G., Yang, P., Zhang, Y., Wang, J., et al. (2025). Quantifying the impacts of climate change and human activities on vegetation in ecologically fragile regions: a case study of Northern China. Theor. Appl. Climatol. 156, 259. doi:10.1007/s00704-025-05492-1
Du, Y., Lv, S., Wang, F., Xu, J., Zhao, H., Tang, L., et al. (2025). Investigation into the temporal impacts of drought on vegetation dynamics in China during 2000 to 2022. Sci. Rep. 15, 6351. doi:10.1038/s41598-025-90692-y
Evans, J., and Geerken, R. (2004). Discrimination between climate and human-induced dryland degradation. J. Arid Environ. 57, 535–554. doi:10.1016/S0140-1963(03)00121-6
Gao, L., Wang, X., Johnson, B. A., Tian, Q., Wang, Y., Verrelst, J., et al. (2020). Remote sensing algorithms for estimation of fractional vegetation cover using pure vegetation index values: a review. ISPRS J. Photogrammetry Remote Sens. 159, 364–377. doi:10.1016/j.isprsjprs.2019.11.018
Gao, S., Dong, G., Jiang, X., Nie, T., and Guo, X. (2023). Analysis of factors influencing spatiotemporal differentiation of the NDVI in the upper and middle reaches of the Yellow River from 2000 to 2020. Front. Environ. Sci. 10, 1072430. doi:10.3389/fenvs.2022.1072430
Gillespie, T. W., Madson, A., Cusack, C. F., and Xue, Y. (2019). Changes in NDVI and human population in protected areas on the Tibetan Plateau. Arct. Antarct. Alp. Res. 51, 428–439. doi:10.1080/15230430.2019.1650541
Gong, D., Huang, M., Ge, Y., Lin, H., Zhang, L., and Altan, O. (2025). Operationalizing SDGs through the water-energy-food Nexus: multi-level assessment of ecosystem service supply-demand patterns in China. Ecol. Indic. 179, 114235. doi:10.1016/j.ecolind.2025.114235
Guo, A., Zhang, Y., Zhong, F., and Jiang, D. (2020). Spatiotemporal patterns of ecosystem service value changes and their coordination with economic development: a case study of the yellow river basin, China. Int. J. Environ. Res. Public Health 17, 8474. doi:10.3390/ijerph17228474
Guo, E., Wang, Y., Wang, C., Sun, Z., Bao, Y., Mandula, N., et al. (2021). NDVI indicates long-term dynamics of vegetation and its driving forces from climatic and anthropogenic factors in Mongolian Plateau. Remote Sens. 13, 688. doi:10.3390/rs13040688
Guo, W.-W., Jin, L., Li, W., and Wang, W.-T. (2023). Assessing the vulnerability of grasslands in Gannan of China under the dual effects of climate change and human activities. Ecol. Indic. 148, 110100. doi:10.1016/j.ecolind.2023.110100
Hao, F., Zhang, X., Ouyang, W., Skidmore, A. K., and Toxopeus, A. G. (2012). Vegetation NDVI linked to temperature and precipitation in the upper catchments of yellow river. Environ. Model Assess. 17, 389–398. doi:10.1007/s10666-011-9297-8
Huang, M., Zhong, S., Ge, Y., Lin, H., Chang, L., Zhu, D., et al. (2025). Evaluating the performance of SDGSAT-1 GLI data in urban Built-Up area extraction from the perspective of urban morphology and City scale: a case study of 15 cities in China. IEEE J. Sel. Top. Appl. Earth Observations Remote Sens. 18, 17166–17180. doi:10.1109/JSTARS.2025.3584449
Huo, S., Wang, M., Chen, G., Shu, H., and Yang, R. (2021). Monitoring and assessment of endangered UNESCO world heritage sites using space technology: a case study of east rennell, Solomon Islands. Herit. Sci. 9, 101–113. doi:10.1186/s40494-021-00574-5
Jiang, W., Yuan, L., Wang, W., Cao, R., Zhang, Y., and Shen, W. (2015). Spatio-temporal analysis of vegetation variation in the yellow river basin. Ecol. Indic. 51, 117–126. doi:10.1016/j.ecolind.2014.07.031
Kong, D., Miao, C., Duan, Q., Lei, X., and Li, H. (2018). Vegetation-climate interactions on the loess Plateau: a nonlinear granger causality analysis. J. Geophys. Res. Atmos. 123, 11068–11079. doi:10.1029/2018JD029036
Kumar, P., Debele, S. E., Sahani, J., Rawat, N., Marti-Cardona, B., Alfieri, S. M., et al. (2021). An overview of monitoring methods for assessing the performance of nature-based solutions against natural hazards. Earth-Science Rev. 217, 103603. doi:10.1016/j.earscirev.2021.103603
Li, S., Yang, S., Liu, X., Liu, Y., and Shi, M. (2015). NDVI-based analysis on the influence of climate change and human activities on vegetation restoration in the Shaanxi-Gansu-Ningxia region, central China. Remote Sens. 7, 11163–11182. doi:10.3390/rs70911163
Li, D., Wu, S., Liang, Z., and Li, S. (2020). The impacts of urbanization and climate change on urban vegetation dynamics in China. Urban For. and Urban Green. 54, 126764. doi:10.1016/j.ufug.2020.126764
Li, C., Liu, Y., Zhu, T., Zhou, M., Dou, T., Liu, L., et al. (2023). Considering time-lag effects can improve the accuracy of NPP simulation using a light use efficiency model. J. Geogr. Sci. 33, 961–979. doi:10.1007/s11442-023-2115-9
Liu, Y., Li, Y., Li, S., and Motesharrei, S. (2015). Spatial and temporal patterns of global NDVI trends: correlations with climate and human factors. Remote Sens. 7, 13233–13250. doi:10.3390/rs71013233
Liu, R., Xiao, L., Liu, Z., and Dai, J. (2018). Quantifying the relative impacts of climate and human activities on vegetation changes at the regional scale. Ecol. Indic. 93, 91–99. doi:10.1016/j.ecolind.2018.04.047
Liu, Z., Wang, H., Li, N., Zhu, J., Pan, Z., and Qin, F. (2020). Spatial and temporal characteristics and driving forces of vegetation changes in the Huaihe river basin from 2003 to 2018. Sustainability 12, 2198. doi:10.3390/su12062198
Liu, H., Jia, J., Lin, Z., Wang, Z., and Gong, H. (2021). Relationship between net primary production and climate change in different vegetation zones based on EEMD detrending – a case study of northwest China. Ecol. Indic. 122, 107276. doi:10.1016/j.ecolind.2020.107276
Liu, X., Tian, Y., Liu, S., Jiang, L., Mao, J., Jia, X., et al. (2022). Time-Lag effect of climate conditions on vegetation productivity in a temperate forest–grassland ecotone. Forests 13, 1024. doi:10.3390/f13071024
Liu, Y., Zhao, Y., Wu, W., Ao, X., and Chen, R. (2024). The response of vegetation dynamics to climate in Xinjiang from 1991 to 2018. Forests 15, 2065. doi:10.3390/f15122065
Lu, Y., Yu, Y., Sun, L., Li, C., He, J., Guo, Z., et al. (2025). NDVI based vegetation dynamics and responses to climate change and human activities at Xinjiang from 2001 to 2020. Sci. Rep. 15, 25848. doi:10.1038/s41598-025-11677-5
Ma, N., Cao, S., Bai, T., Yang, Z., Cai, Z., and Sun, W. (2025). Assessment of vegetation dynamics in Xinjiang using NDVI data and machine learning models from 2000 to 2023. Sustainability 17, 306. doi:10.3390/su17010306
Mandelbrot, B. B., and Wallis, J. R. (1969). Robustness of the rescaled range R/S in the measurement of noncyclic long run statistical dependence. Water Resour. Res. 5, 967–988. doi:10.1029/WR005i005p00967
Meng, M., Huang, N., Wu, M., Pei, J., Wang, J., and Niu, Z. (2019). Vegetation change in response to climate factors and human activities on the mongolian Plateau. PeerJ 7, e7735. doi:10.7717/peerj.7735
Mu, H., Li, X., Wen, Y., Huang, J., Du, P., Su, W., et al. (2022). A global record of annual terrestrial human footprint dataset from 2000 to 2018. Sci. Data 9, 176. doi:10.1038/s41597-022-01284-8
Myneni, R. B., Keeling, C. D., Tucker, C. J., Asrar, G., and Nemani, R. R. (1997). Increased plant growth in the northern high latitudes from 1981 to 1991. Nature 386, 698–702. doi:10.1038/386698a0
Neeti, N., and Eastman, J. R. (2011). A contextual mann-kendall approach for the assessment of trend significance in image time series. Trans. GIS 15, 599–611. doi:10.1111/j.1467-9671.2011.01280.x
Nemani, R. R., Keeling, C. D., Hashimoto, H., Jolly, W. M., Piper, S. C., Tucker, C. J., et al. (2003). Climate-driven increases in global terrestrial net primary production from 1982 to 1999. Science 300, 1560–1563. doi:10.1126/science.1082750
Ren, Y., Zhang, F., Zhao, C., and Cheng, Z. (2023). Attribution of climate change and human activities to vegetation NDVI in Jilin Province, China during 1998–2020. Ecol. Indic. 153, 110415. doi:10.1016/j.ecolind.2023.110415
Ren, X., Hou, P., Ma, Y., Ma, R., Wang, J., and Xie, L. (2024). Analysis of vegetation changes and driving factors on the Qinghai-Tibet Plateau from 2000 to 2022. Forests 15, 2188. doi:10.3390/f15122188
Shao, S., and Yang, Y. (2023). Identification of ecological improvement zones in different ecological functional zones in northwest Hubei, China. Ecol. Indic. 155, 111032. doi:10.1016/j.ecolind.2023.111032
Shen, X., Liu, Y., Zhang, J., Wang, Y., Ma, R., Liu, B., et al. (2022). Asymmetric impacts of diurnal warming on vegetation carbon sequestration of marshes in the Qinghai Tibet Plateau. Glob. Biogeochem. Cycles 36, e2022GB007396. doi:10.1029/2022GB007396
Shi, S., Yu, J., Wang, F., Wang, P., Zhang, Y., and Jin, K. (2021). Quantitative contributions of climate change and human activities to vegetation changes over multiple time scales on the loess Plateau. Sci. Total Environ. 755, 142419. doi:10.1016/j.scitotenv.2020.142419
Snyder, K. A., and Tartowski, S. L. (2006). Multi-scale temporal variation in water availability: implications for vegetation dynamics in arid and semi-arid ecosystems. J. Arid Environ. 65, 219–234. doi:10.1016/j.jaridenv.2005.06.023
Sun, H., Wang, J., Xiong, J., Bian, J., Jin, H., Cheng, W., et al. (2021). Vegetation change and its response to climate change in Yunnan province, China. Adv. Meteorology 2021, 1–20. doi:10.1155/2021/8857589
Sun, H., Huang, M., Lin, H., Ge, Y., Zhu, D., Gong, D., et al. (2025). Spatiotemporal dynamics of ecological environment quality in arid and sandy regions with a particular remote sensing ecological index: a study of the Beijing-Tianjin sand source region. Geo-spatial Inf. Sci., 1–20. doi:10.1080/10095020.2025.2541875
Tian, F., Brandt, M., Liu, Y. Y., Verger, A., Tagesson, T., Diouf, A. A., et al. (2016). Remote sensing of vegetation dynamics in drylands: evaluating vegetation optical depth (VOD) using AVHRR NDVI and in situ green biomass data over West African Sahel. Remote Sens. Environ. 177, 265–276. doi:10.1016/j.rse.2016.02.056
Wang, X., Piao, S., Ciais, P., Li, J., Friedlingstein, P., Koven, C., et al. (2011). Spring temperature change and its implication in the change of vegetation growth in North America from 1982 to 2006. Proc. Natl. Acad. Sci. 108, 1240–1245. doi:10.1073/pnas.1014425108
Wang, Y., Dai, E., and Wu, C. (2021). Spatiotemporal heterogeneity of net primary productivity and response to climate change in the mountain regions of southwest China. Ecol. Indic. 132, 108273. doi:10.1016/j.ecolind.2021.108273
Wang, H., Gu, Y., Bai, Y., Wang, N., Wei, X., and Zhou, M. (2023). Dynamic pattern of vegetation in Xinjiang and its time-lag effect on climate. dbkxxb 39, 137–145. doi:10.11975/j.issn.1002-6819.202303033
Wei, P., Du, J., Bahadur, A., Zhang, H., Wang, S., Wu, T., et al. (2025). Soil erosion and risk assessment on the Qinghai-Tibetan Plateau. Commun. Earth Environ. 6, 365. doi:10.1038/s43247-025-02355-5
Wu, D., Zhao, X., Liang, S., Zhou, T., Huang, K., Tang, B., et al. (2015). Time-lag effects of global vegetation responses to climate change. Glob. Change Biol. 21, 3520–3531. doi:10.1111/gcb.12945
Xu, W., Liu, W., Ma, W., Wang, M., Xu, F., Yang, W., et al. (2022). Current status and future challenges for khulan (Equus hemionus) conservation in China. Glob. Ecol. Conservation 37, e02156. doi:10.1016/j.gecco.2022.e02156
Yang, X., Liu, S., Yang, T., Xu, X., Kang, C., Tang, J., et al. (2016). Spatial-temporal dynamics of desert vegetation and its responses to climatic variations over the last three decades: a case study of Hexi region in Northwest China. J. Arid. Land 8, 556–568. doi:10.1007/s40333-016-0046-3
Zhang, M., and Wu, X. (2020). The rebound effects of recent vegetation restoration projects in Mu us sandy land of China. Ecol. Indic. 113, 106228. doi:10.1016/j.ecolind.2020.106228
Zhang, H., Ali, S., Ma, Q., Sun, L., Jiang, N., Jia, Q., et al. (2021). Remote sensing strategies to characterization of drought, vegetation dynamics in relation to climate change from 1983 to 2016 in Tibet and Xinjiang Province, China. Environ. Sci. Pollut. Res. 28, 21085–21100. doi:10.1007/s11356-020-12124-w
Zhang, Q., Gu, L., Liu, Y., and Zhang, Y. (2024). Spatio-temporal dynamics of normalized difference vegetation index and its response to climate change in Xinjiang, 2000–2022. Forests 15, 370. doi:10.3390/f15020370
Zhang, Q., Cao, G., Zhao, M., and Zhang, Y. (2025). kNDVI spatiotemporal variations and climate lag on qilian Southern slope: Sen–Mann–Kendall and Hurst index analyses for ecological insights. Forests 16, 307. doi:10.3390/f16020307
Zhao, Y., and Wei, T. (2024). Changes in vegetation cover and influencing factors in typical counties of theLoess Plateau from 1990 to 2020. Arid Zone Res. 41, 147–156. doi:10.13866/j.azr.2024.01.14
Zheng, S., Peng, D., Zhang, B., Yu, L., Pan, Y., Wang, Y., et al. (2024). Temporal variation characteristics in the association between climate and vegetation in Northwest China. Sci. Rep. 14, 17905. doi:10.1038/s41598-024-68066-7
Zhou, X., Yamaguchi, Y., and Arjasakusuma, S. (2018). Distinguishing the vegetation dynamics induced by anthropogenic factors using vegetation optical depth and AVHRR NDVI: a cross-border study on the Mongolian Plateau. Sci. Total Environ. 616–617, 730–743. doi:10.1016/j.scitotenv.2017.10.253
Zhou, L., Zhao, Y., Zhu, C., and Shi, C. (2024). Route selection for scenic byways in karst areas based on the minimum cumulative resistance model: a case study of the Nanpan–Beipan River basin, China. Ecol. Indic. 163, 112093. doi:10.1016/j.ecolind.2024.112093
Keywords: NDVI, driving factors, climate change, human activity, Xinjiang
Citation: Yan C, Wang X, Sun G, Zhang L, Han W, Peng H and Luo L (2025) NDVI dynamics and drivers in the Kalamaili Ungulate Nature Reserve: insights from an arid ecosystem in northwest China. Front. Environ. Sci. 13:1685330. doi: 10.3389/fenvs.2025.1685330
Received: 13 August 2025; Accepted: 22 October 2025;
Published: 10 November 2025.
Edited by:
Penghai Wu, Anhui University, ChinaReviewed by:
Min Huang, Jiangxi Normal University, ChinaYongming Ma, Southwest Forestry University, China
Copyright © 2025 Yan, Wang, Sun, Zhang, Han, Peng and Luo. This is an open-access article distributed under the terms of the Creative Commons Attribution License (CC BY). The use, distribution or reproduction in other forums is permitted, provided the original author(s) and the copyright owner(s) are credited and that the original publication in this journal is cited, in accordance with accepted academic practice. No use, distribution or reproduction is permitted which does not comply with these terms.
*Correspondence: Wei Han, aGFud2VpQHhqbnUuZWR1LmNu