 Claudio S. Quilodrán
 Alexandros Tsoupas
 Mathias Currat
- 1Department of Zoology, University of Oxford, Oxford, United Kingdom
- 2Department of Genetics and Evolution – Anthropology Unit, University of Geneva, Geneva, Switzerland
- 3Institute of Genetics and Genomics in Geneva (IGE3), University of Geneva, Geneva, Switzerland
A Corrigendum on
The Spatial Signature of Introgression After a Biological Invasion With Hybridization
by Quilodrán, C. S., Tsoupas, A., and Currat, M. (2020). Front. Ecol. Evol. 8:569620. doi: 10.3389/fevo.2020.569620
In the original article, there was a mistake in the legend for Figure 4 and Supplementary Figure S3 as published. Both figure legends state “The arrows indicate the direction of the increasing level of introgression,” while they should read “The arrows indicate the direction of the invasive taxon colonization.” The corrected legends appear below.
Figure 4. Effect of time since the onset of biological invasion on the level of introgression. Two interacting taxa are represented with different colors (yellow and gray). The level of introgression (%) is estimated in both the source of the expansion and the extreme corner in which both taxa are present. The arrows indicate the direction of the invasive taxon colonization. Three scenarios of biological invasion (see Figure 1) and five demographic sub-scenarios (see Table 1) were simulated. The demographic parameters of sub-scenarios for taxon 1 and taxon 2 are also presented (taxon 1 | taxon 2). Taxon 1 is considered to be local under the “whole area” and “restricted area” scenarios but invasive under the “two invasions” scenario. Taxon 2 is always considered to be an invasive taxon. The values of introgression are averaged over 10,000 simulations.
Supplementary Figure S3. Effect of time since the stop of hybridization after a biological invasion. Two interacting taxa are represented with different colors (yellow and gray). The level of introgression (%) is estimated in both the source of the expansion and the extreme corner in which both taxa are present. The arrows indicate the direction of the invasive taxon colonization. The explored scenario corresponds to the “whole area” (see Figure 1) and five demographic sub-scenarios (see Table 1). The demographic parameters of sub-senarios for taxon 1 (local) and taxon 2 (invasive) are also presented (taxon 1 | taxon 2). Both taxa hybridize during 2,000 generations. The plotted values represent introgression during an additional time of 2,000 generations without interbreeding (4,000 generations in total). The values of introgression are averaged over 10,000 simulations.
In the original article, there was a mistake in Figure 4 and Supplementary Figure S3 as published. The triangles and circles of both figure legends should read “Corner” and “Source,” respectively. They are interchanged in the original published manuscript. The corrected Figure 4 and Supplementary Figure S3 appears below.
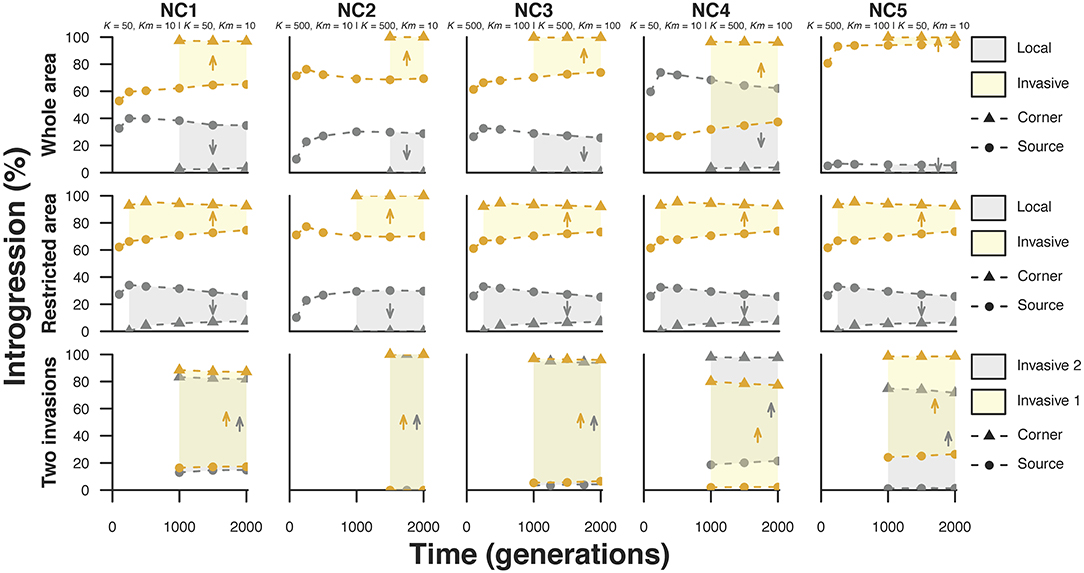
Figure 4. Effect of time since the onset of biological invasion on the level of introgression. Two interacting taxa are represented with different colors (yellow and gray). The level of introgression (%) is estimated in both the source of the expansion and the extreme corner in which both taxa are present. The arrows indicate the direction of the invasive taxon colonization. Three scenarios of biological invasion (see Figure 1) and five demographic sub-scenarios (see Table 1) were simulated. The demographic parameters of sub-scenarios for taxon 1 and taxon 2 are also presented (taxon 1 | taxon 2). Taxon 1 is considered to be local under the “whole area” and “restricted area” scenarios but invasive under the “two invasions” scenario. Taxon 2 is always considered to be an invasive taxon. The values of introgression are averaged over 10,000 simulations.
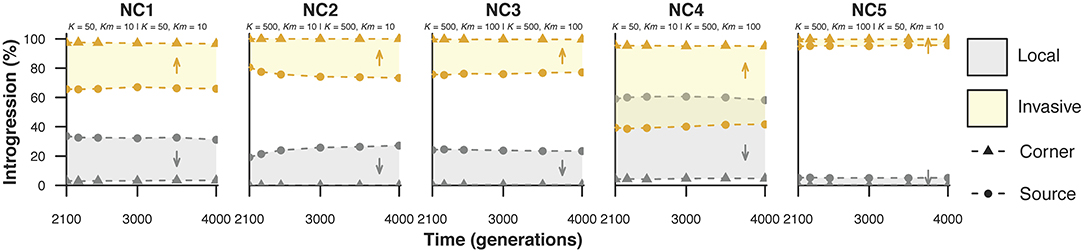
Supplementary Figure 3. Effect of time since the stop of hybridization after a biological invasion. Two interacting taxa are represented with different colors (yellow and gray). The level of introgression (%) is estimated in both the source of the expansion and the extreme corner in which both taxa are present. The arrows indicate the direction of the invasive taxon colonization. The explored scenario corresponds to the “whole area” (see Figure 1) and five demographic sub-scenarios (see Table 1). The demographic parameters of sub-senarios for taxon 1 (local) and taxon 2 (invasive) are also presented (taxon 1 | taxon 2). Both taxa hybridize during 2,000 generations. The plotted values represent introgression during an additional time of 2,000 generations without interbreeding (4,000 generations in total). The values of introgression are averaged over 10,000 simulations.
The authors apologize for this error and state that this does not change the scientific conclusions of the article in any way. The original article has been updated.
Keywords: hybridization, introgression, invasive species, range expansion, spatially explicit simulations
Citation: Quilodrán CS, Tsoupas A and Currat M (2021) Corrigendum: The Spatial Signature of Introgression After a Biological Invasion With Hybridization. Front. Ecol. Evol. 9:702432. doi: 10.3389/fevo.2021.702432
Received: 29 April 2021; Accepted: 04 May 2021;
Published: 28 May 2021.
Edited and reviewed by: Qinfeng Guo, United States Forest Service (USDA), United States
Copyright © 2021 Quilodrán, Tsoupas and Currat. This is an open-access article distributed under the terms of the Creative Commons Attribution License (CC BY). The use, distribution or reproduction in other forums is permitted, provided the original author(s) and the copyright owner(s) are credited and that the original publication in this journal is cited, in accordance with accepted academic practice. No use, distribution or reproduction is permitted which does not comply with these terms.
*Correspondence: Claudio S. Quilodrán, Y2xhdWRpby5xdWlsb2RyYW5Aem9vLm94LmFjLnVr