 Marco Ferretti
 Sucharita Ghosh1
 Elena Gottardini
- 1Swiss Federal Research Institute WSL, Birmensdorf, Switzerland
- 2Research and Innovation Centre, Fondazione Edmund Mach, San Michele all’Adige, Italy
Although several manipulative experiments provided evidence for a negative effect of defoliation on tree growth, results from observational studies were less univocal. This may be due to the ability of observed defoliation to reflect the health status of individual trees, to the influence of site condition and to the amplitude of time window used for growth assessment. Here, we investigated the relationship between two tree health indicators (crown defoliation, damage symptoms) and annual (measured by tree-ring width on 69 Norway spruce trees) and periodical (5-year and 10-year diameter increments, 346 trees from five coniferous species) tree growth. Data originated from 14 (seven for tree rings) ICP Forests Level I plots in Trentino, northern Italy. Diameter, defoliation and damage were measured between 1997 and 2011 as part of the annual crown condition survey, while cores for tree-rings were collected on a sub-sample of trees in 2012. We carried out regression modeling combined with model selection in one-step (periodical data) and two-step (annual data) approaches, using moving averages for the annual data with varying time window widths. Our results indicated an overall negative correlation between defoliation and annual or periodical stem diameter growth. The relationship between defoliation and growth changes in relation to the time window considered, and becomes stronger when data are aggregated over longer time windows (>3 years), when also the occurrence of damage symptoms plays a significant role. The effect of the amplitude of the time windows for data aggregation is probably due to the mechanisms behind the defoliation-growth relationship, which may change according to the causal factors involved. In particular, when larger time windows are considered, short-term fluctuations are likely to be smoothed out, and more general patterns may emerge. We concluded that radial growth is significantly negatively related to defoliation, and this supports the use of defoliation as a rapid indicator for forest health and vitality.
Introduction
Forest is a key component of the global carbon cycle (e.g., Friedlingstein et al., 2019) and the maintenance of forest health and productivity is a serious concern for a sustainable forest management (SFM). In this context, tree defoliation, forest damage and forest growth are considered important indicators (Forest Europe, 2020). Here, the question arises whether poor apparent tree health as monitored by forest health survey can also reveal reduced productivity. In Europe, this question raised some interest especially in relation to the early debate around the “Waldsterben” (“forest death,” otherwise known also as “forest decline”; see, e.g., Innes et al., 1993). In particular, the relationship between health and productivity has been explored considering tree defoliation and tree growth. Defoliation is defined here as “any deviation of foliage density on tree’s crown in comparison with a reference tree assumed with full foliage density” (Ferretti et al., 2021; see also below). On the other hand, the term “growth” is used here to identify stem diameter increment in trees, an important indicator of wood growth which is in turn directly related to above-ground wood volume and biomass increment (Bowman et al., 2013) and carbon sequestration (Favero et al., 2020).
Several manipulative experiments with artificially induced defoliation (e.g., Langstrom et al., 2001; Kurkela et al., 2005; Eyles et al., 2009, 2011) and meta-analyses (e.g., Jacquet et al., 2012) provided evidence for a negative effect of defoliation on tree growth. Results from observational studies were less univocal (e.g., Dobbertin, 2005), and recent reviews placed renewed criticisms on the use of defoliation in forest health assessment (Cherubini et al., 2021). With the 2018 megadrought causing widespread canopy damage to forests in central Europe (e.g., Brun et al., 2020; Schuldt et al., 2020), the question whether apparently reduced forest health can also reveal reduced tree and forest growth became of renewed interest. Such a question has clear relevance also for the functional interpretation of forest health data as collected in Europe since the 1980s (Michel et al., 2020) and for the possible role of forests in mitigating climate change (Ferretti et al., 2021). For instance, Rohner et al. (2021) showed that drought-induced defoliation and leaf browning in beech trees are associated with lower annual growth and carbon sequestration rates in Switzerland, and Ferretti et al. (2021) showed a generalized negative relationship between defoliation and periodical (10-years) basal area increment across a number of broadleaved and coniferous tree species in France. Tallieu et al. (2020) on the other hand showed that the relationship between defoliation and annual radial growth in beech trees is subject to considerable variation across France.
Discrepancies among results may be due to several reasons. Among others, the ability of the defoliation observed in the field to reflect the health status of individual trees, the influence of site condition and other tree characteristics, and the amplitude of time window used for growth assessment can play a role. In particular, this latter point can be related to the differentiated (in terms of timing and causal connection) responsiveness of trees to stressors: as reported by Dobbertin (2005), “defoliation by insects becomes first visible in crown transparency while stem growth reaction occurs with delay. On the other hand, extreme summer drought as observed in large parts of Europe in 2003 affects stem growth almost immediately, while foliage reduction becomes only visible months later.”
Here, we adopt a broader concept, and consider defoliation also in combination with other symptoms of damage as indicators of tree health. Damage symptoms on trees are defined as all visible sign from causal agents or factors that can be observed on foliage, branches, stem and collar (Eichhorn et al., 2020). We thus investigated the relationships between forest health indicators (defoliation and observed damage symptoms) and growth at different sites and at different time resolutions (1 to 10 years; see below).
We focused on coniferous trees from Level I plots of the local ICP Forests (International Co-operative Programme on Assessment and Monitoring of Air Pollution Effects on Forests) network in Trentino, northern Italy. This is because of three reasons: firstly, there is documented evidence of relationship between defoliation and growth for several conifers, such as Sitka spruce (Picea sitchensis Bong. Carrière), Norway spruce (Picea abies L. Karst.), Silver fir (Abies alba Mill.), Douglas fir [Pseudotsuga menziesii (Mirb.) Franco] and several pine species (Innes and Neumann, 1991; Söderberg, 1993; Solberg, 1999; Solberg and Tveite, 2000; Linares and Camarero, 2012; Ferretti et al., 2021); secondly, the ICP Forests provide a long-term consistent framework for annual surveys on tree health by assessing tree defoliation and damage symptoms on ca. 110,000 individual trees located at ca. 5,800 plots across Europe (Michel et al., 2020); thirdly, defoliation has been proven to be related to other tree health indicators in the region (Ferretti et al., 2018).
In particular, we investigated (i) whether there is a relationship between periodical (5 to 10 years) tree diameter growth and defoliation and damage symptoms, (ii) at what extent such a relationship is affected by site and tree factors, and (iii) how different time windows used for measuring and reporting forest health and forest growth may affect such a relationship. To do so, we considered stem diameter growth data obtained from periodical (multi-annual) stem measurements by callipering and annual radial growth obtained via analysis of tree ring cores (see below). Deliberately, we did not address the question on the causal relationship behind – and between – tree health and growth: such a question is very complex and involves the role of several environmental drivers, including, e.g., temperature, precipitation, nitrogen deposition and soil nutrients (e.g., Dobbertin, 2005; Ferretti et al., 2015; Etzold et al., 2020). Such a question is marginal in the present study which is centered around the possibility offered by defoliation data to reveal growth reduction across the tree population examined.
Materials and Methods
Study Concept and Data Resources
The study was carried out in Trentino, a 6,207-km2 alpine region of northern Italy. The elevation ranges from 66 m a.s.l. (Lago di Garda) to 3,769 m a.s.l. (Monte Cevedale) and the forests cover 66% of the area (CLC Corine Land Cover, 2000). There are three distinct climatic zones: sub-Mediterranean (annual mean temperature 12°C; annual precipitation 800–1,000 mm), oceanic-temperate (annual mean temperature 10–13°C; annual precipitation 900–1,000 mm), and continental-alpine (annual mean temperature 8–9°C; annual precipitation 1,000–1,500 mm) (Eccel and Saibanti, 2005). We investigated relationships between tree health indicators (crown defoliation, damage symptoms) and periodical and annual tree growth. Data resources are summarized in Table 1.
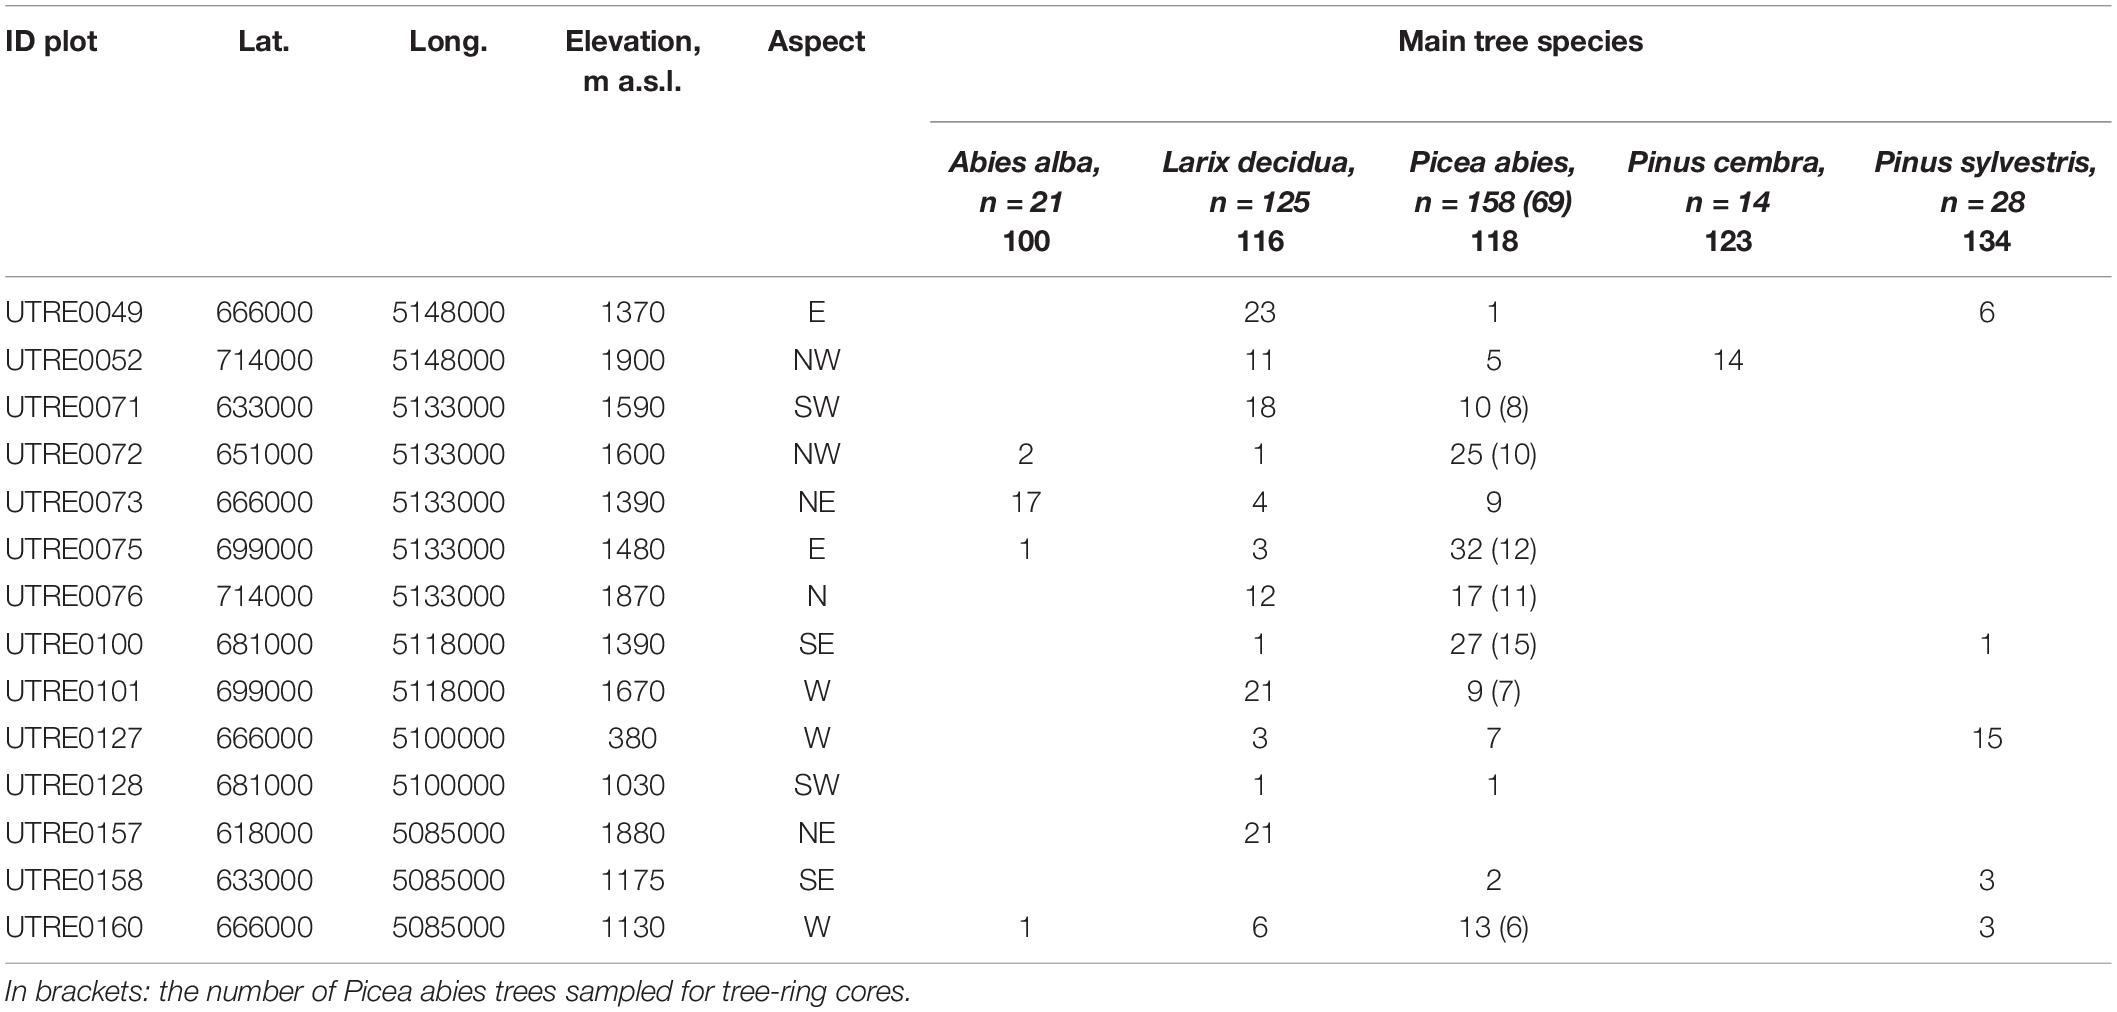
Table 1. Plot data and number of trees for each species considered for crown condition and periodical growth.
Tree crown condition (defoliation and damage) and periodical growth data (cm; expressed in terms of diameter increments) were collected on fourteen ICP Forests Level I plots, and provided by the Forest and Fauna Service of the Autonomous Province of Trento. Crown condition was assessed yearly between 1997 and 2011, and tree diameter at breast height (DBH) measured every 5 years (in 2001, 2005, and 2009), both by the local forest service. In all, 346 trees belonging to five coniferous species (n = 21 Abies alba Mill., silver fir; n = 125 Larix decidua Mill., European larch; n = 158 Picea abies (L.) H. Karst., Norway spruce; n = 14 Pinus cembra L.; Swiss pine; n = 28 Pinus sylvestris L., Scots pine) were monitored.
Annual tree growth is expressed in terms of tree-ring width (mm) measured on cores sampled in 2012 on n = 69 Norway spruce trees in seven out of the above mentioned fourteen Level I plots. The ring widths were measured in one or two cores per tree, which were then averaged for the final analysis. For the annual tree ring data, the role of increasing time windows for growth assessments was also considered by taking moving averages of time series observations on windows of varying lengths denoted by k (see below). Ring widths from the period 1997–2011 were used, thus having 15 years of parallel data on defoliation and ring widths.
Assessment and Measurement Methods
Tree crown condition (i.e., defoliation and damage) and diameter data were collected according to the ICP Forests methods (see Manual Part IV and Part V, accessible under1; accessed on 20 July 2021).
Defoliation is expressed as the percentage of missing foliage with respect to a standard local reference tree and recorded in 5% steps, from 0 (tree with full foliage) to 100% (dead tree, no foliage left). Defoliation of 25% is traditionally used as forest health threshold in international reporting (Michel et al., 2020). As for tree damage, the number of reported instances of damage due to the main categories of causal agents and factors (i.e., game and grazing, insects, fungi, abiotic agents, direct action of man, fire, atmospheric pollutants and other factors that were observed but unidentified) was considered. Both defoliation and damage were assessed every year in July-August by visual observation of each tree at all plots and following the manuals and standards in use at national and international level (Mueller and Stierlin, 1990; Ferretti, 1994; Eichhorn et al., 2016), supported by specific quality assurance procedures (Ferretti et al., 1999, 2018; Bussotti et al., 2009).
For coupling with periodical growth, defoliation and damage data were averaged over the periods 2001–2005 and 2005–2009, if at least 3 years of data were available, and over the entire 2001–2009 period, if at least 6 years of data were available.
Periodical tree growth is based on the diameter measured at breast height (DBH; conventionally at 1.30 m above ground) and expressed in terms of diameter increments during 2001–2005, 2005–2009, and 2001–2009. Implausible values (i.e., negative incremental values, implausible growth rates) were identified, checked and discarded (see Ferretti et al., 2018 for details).
Annual tree growth was measured by tree-ring width. A total of 118 tree cores (one or two cores per tree) were collected in 2012 from n = 69 Norway spruce trees on seven Level I plots. These trees were randomly selected (pure random sampling with replacement) from those considered for the diameter measurement analysis. The growth values from diameter increments and tree rings may therefore differ because of possibly different sample sizes, measurement methods and sampling positions on the stem. The tree cores were previously smoothed by sanding and subsequently measured for tree rings width at 0.01 mm resolution, with measurements recorded by means of the software TSAPWin (Rinntech, Germany) (Camin, 2013). For several reason, we did not carry out any formal detrending of tree-ring data which is actually common in dendrochronological studies that span over centuries and aim at identifying climate-growth relationship (e.g., Klesse, 2021). Firstly, tree diameter was used in the statistical models (see below). This permits to control at least in part the geometric factor related to the growth pattern. Secondly, we investigated a relatively narrow time window (15 years) over which we assumed limited (if any) effect of age on annual tree growth and defoliation. Thirdly, the aim of the paper was not to investigate tree growth in absolute terms, but in relation to defoliation levels. For doing so, we used paired growth and defoliation data which originated from measurements carried out on the same trees over the same time windows.
Data Analysis
We used regression with model selection for establishing defoliation-growth relationships, where other available data on tree and site characteristics were also included in multiple regression models. All computations were done in R (R Core Team, 2020) for Linux and Windows. Model selection to select the best covariates in multiple regression modeling was done by optimizing the Akaike Information Criterion (AIC) in a stepwise (both) procedure. The R-functions lm() and the stepAIC() were used, among others.
Prior to the analysis, the annual tree ring data (mm) were log transformed. This transformation being monotone, no ambiguity can occur in statistical inference. Some of the other data were transformed using square roots, and these include defoliation (%), damage (n) and diameter increments (cm). To safeguard against the possibility of near-zero incremental values, log transformation was not applied to the diameter increment data. Since all these observations assume non-negative values, directions of change (increase or decrease) in them, before or after transformation are interpretable in the same manner. The data about plot aspect were split into two components indicating South-North (−1 to 1) and West-East (−1 to 1) orientations, obtained from cosine and sine transformations, respectively, of directional data. The analysis was done in a one-step multiple regression modeling approach for the periodical data, whereas, a two-step model was used for the annual (moving averaged) data. These models are defined in Eqs. 1, 2, and 3 (see below).
Relationship Between Defoliation and Periodical Tree Growth
For analyzing the periodical defoliation-growth relationship, multiple regression was applied in a one-step regression modeling approach as described in Eq. 1. The periods considered were 2001–2005, 2005–2009, and 2001–2009. We used square root transformed diameter increments during a specified period as response and square root transformed mean defoliation during the same period and other tree and site characteristics as predictors (explanatory variables), namely: damage (square root of mean damage occurring in the tree during the same period), latitude, longitude, elevation (m., altitude above sea level; ASL) and aspect (split into two numerical components).
To evaluate the relationship between defoliation, damage, tree- and site characteristics and periodical tree growth, the following multiple regression model (Eq. 1) was used, combined with model selection. The full model is as given below:
where, for a chosen period such as 2001–2005, 2005–2009 or 2001–2009, (a) Yp is the vector of all observations Yij(p), which is the square root of diameter increment for tree j in plot i, (b) Xp is the design matrix, where the first column is a vector of 1 s corresponding to an intercept term, and the other elements of the matrix correspond to these explanatory variables corresponding to plot i and tree j characteristics, as described above, (c) βp is a vector of regression parameters, and (d) εp is the error term, specifically, a vector of independent zero mean and constant variance random variables. The subscript p in Eq. 1 indicates that this analysis is being done for the periodical data.
Relationship Between Defoliation and Annual Tree Growth
To analyze the annual data, a two-step approach was adopted.
Step 1: at the first step, for each individual tree, a simple linear model (Eq. 2) was fitted using moving averages of square roots of annual defoliation as the explanatory variable and moving averages of the logarithms of annual ring-widths as the response variable. Negative values of the regression slope parameters βij from this model may be indicative of a decreasing tendency in growth (ring widths) with increasing defoliation. For the annual data analysis, moving averages with windows of length k (years) were used, taking k = 1, 2, 3, 4, 5, and 10. When k equals 1, no moving averaging has been done and we have the annual data, whereas, with k ≥ 2, we have averages on wider windows along the time axis. For larger window-widths, the moving averages describe rather longer-term behavior as opposed to the smaller values of the window-width, which would include high-frequency fluctuations. Thus, the regression model in Eq. 2 should be interpreted in this light.
Step 2: at the second step, the estimated slope parameter from step 1 was used as response and its functional relation to various explanatory variables was established via multiple regression (Eq. 3). This process was repeated for each window width k. The explanatory variables used in the second step were: diameter (average of three stem diameter observations (cm) from 2001, 2005, and 2009), damage (average of square root transformed damage data over the 15-year period), elevation (m. a.s.l.), latitude, longitude, and aspect (two components of aspect: West-East, between −1 and 1, and South-North, between −1 and 1).
Specifically, Eq. 2 for step 1 is described as:
where: (a) Yij(t) is the moving average of log transformed annual ring widths, (b) Xij(t) is the moving average of square root transformed annual defoliation values, (c) εij(t) is a zero mean random variable with a constant variance, and (d) βij denotes the regression slope parameter for tree j in plot i and t denotes time, t = 1, 2,.., nij, nij being the number of moving average pairs for tree-j in plot-i. This model is fitted individually for every (i,j) pair, i.e., for every plot i and tree j combination.
For step 2, let β denote the vector consisting of the individual slopes βij. Then Eq. 3 is described as follows:
where, (a) Xβ is the design matrix which contains tree and site characteristics described earlier, (b) ζ is the vector of regression coefficients, and (c) Z is a latent random vector of zero mean and constant variance random variables, its elements being independent of εij.
Thus, in this two-step model, the slope parameter vector β (with components βij appearing in Eq. 2) is a function of tree and site characteristics and some random variation Z that is independent of the error term ε. To fit Eq. 3 we use multiple regression with estimated slope coefficients from Eq. 2 as response, the aim being to assess the relation between the tree and the site characteristics and βij. When βij < 0, it means that, increased values of defoliation lead to reduced values of ring width. When an element of ζ is negative (see Table 2), increased values of the corresponding explanatory variable lead to decreasing values of βij (eventually becoming negative), i.e., the negative influence of defoliation on ring widths becomes stronger. We use AIC (Akaike information criterion) for model selection in a stepwise approach in both directions, to arrive at the final models with reduced sets of explanatory variables.
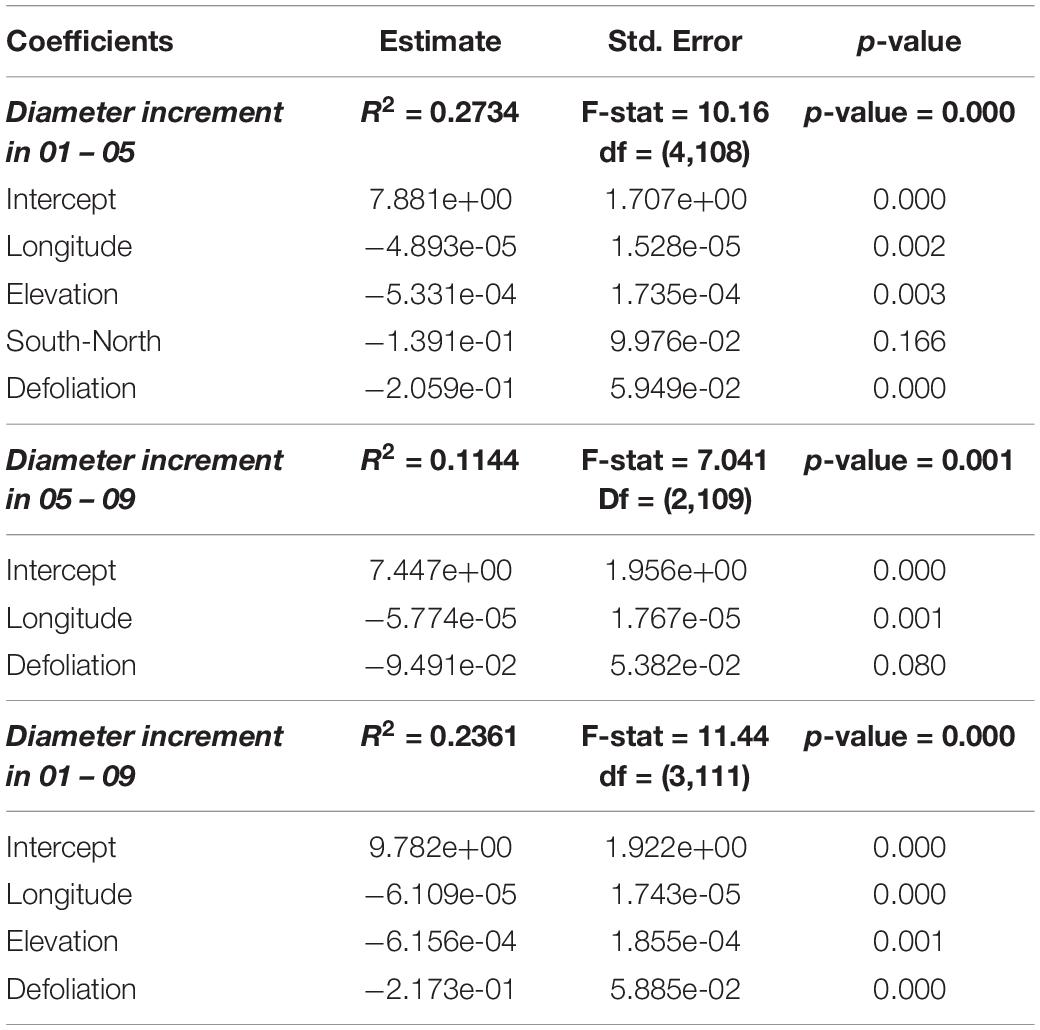
Table 2. Models describing the relation between square roots of diameter increments (in cm, before transformation) and square roots of defoliation values (in %, before transformation) as well as other variables.
Note that, if we substitute Eq. 3 into Eq. 2, we get Y = Uζ + X Z+ ε, where, Z and ε are zero mean random vectors, Z and ε are independent, U = X⋅Xβ and X and Xβ are design matrices as defined before. Substitution of Eq. 3 into Eq. 2 thus leads to the familiar linear mixed effects model format (Pinheiro and Bates, 2009). In other words, the mixed effects model is integrated in our two-stage model.
If we rewrite Y = Uζ + X Z + ε, we get Y = Uζ + e, where e = X Z + ε is a zero mean random vector. Thus Y follows a classical linear model.
Our modeling approach (also see Ghosh et al., 1997) has a few advantages. (i) Unlike in typical mixed effect model fitting strategies, we do not require assumptions on shapes of the probability distributions of Z and ε, instead, we simply make use of the Gauss-Markov theorem (Rao, 1973), which requires only second moment conditions. Testing (p-values) is justified by asymptotic properties of the estimators (Serfling, 1980; Sen and Srivastava, 1990). The relaxation of the distributional assumptions greatly enhances the applicability of the proposed model to different types of data sets. (ii) The proposed model may also be viewed as a type of varying coefficient regression model (Hastie and Tibshirani, 1993) which is integrated in Eq. 2 and Eq. 3. In this light, we are able to assess on the average, in what way the site qualities affect the way defoliation and growth are correlated, while also taking randomness into account. This is achieved by modeling the β coefficients. (iii) In Eq. 3, we characterize the plots by making use of data on site qualities. The inherent randomness present in the sites is also included in the model via Z.
Results
Defoliation, Damage and Periodical Increment
Although occasionally very high on individual tree basis, mean periodical (2001–2009) defoliation values were always below 15%, ranging from 10.0 (Swiss pine) to 14.3 (silver fir) (Table 3). Presence of damage was also limited, on average (0.5–1) with almost no difference among species. When identified, the reported damage symptoms were mostly due to insects (n = 130 trees with observed symptoms) and fungi (n = 176). There was, however, a considerable number of trees (n = 277) on which other symptoms were observed but their cause was not identified. Periodical 2001–2009 growth was in the range of 1.18–2.76 cm, higher in European larch and lower in Swiss pine.
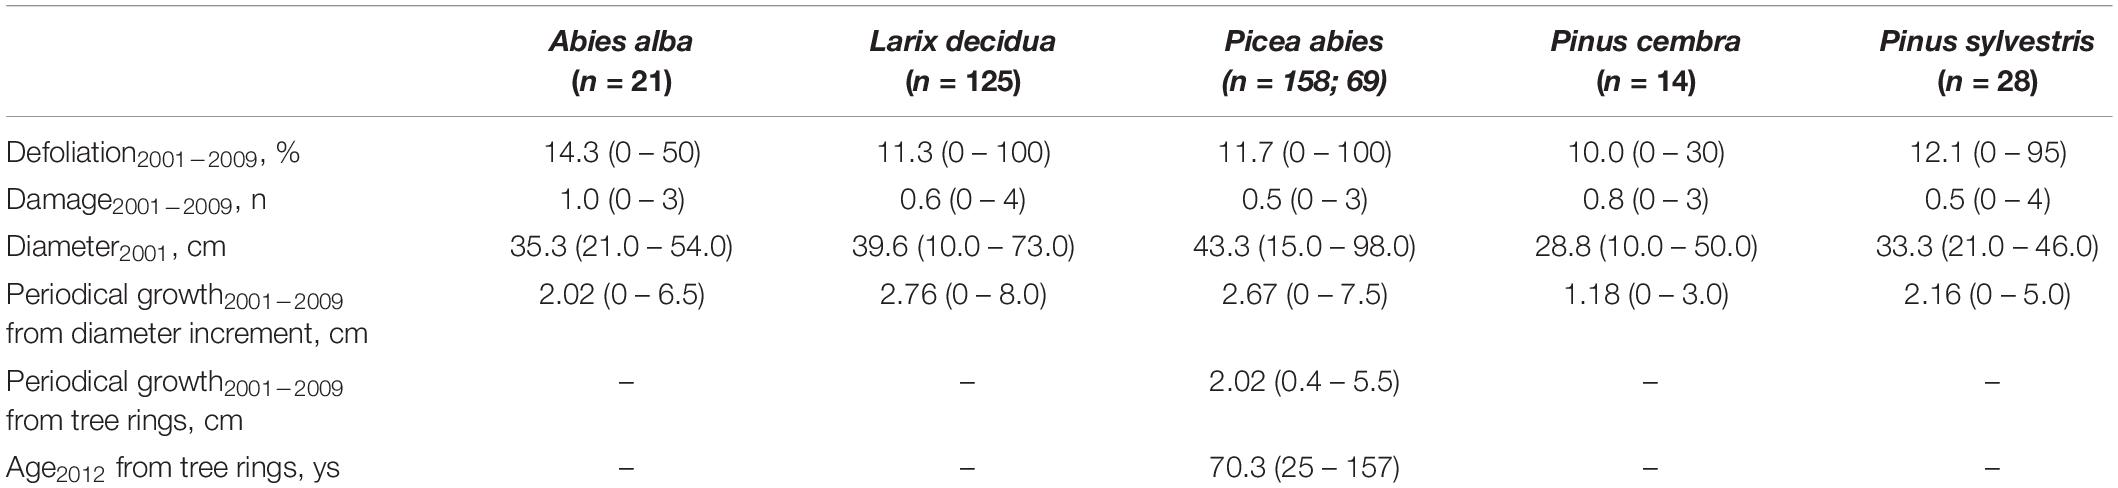
Table 3. Mean (min – max) values of defoliation, damage, tree diameter, periodical growth based on diameter increment for all species, and periodical growth and age based on tree-rings for Norway spruce.
Defoliation displayed a decreasing trend over time (Figure 1), which was more pronounced in silver fir, European larch, and Swiss pine (see Supplementary Figure 1). Damage to trees were more frequent after 2004, and their development was in good agreement with defoliation. Average growth was slightly higher during 2005–2009; in contrast, in the same period Norway spruce displayed a lower growth in comparison to the previous 2001–2005 period.
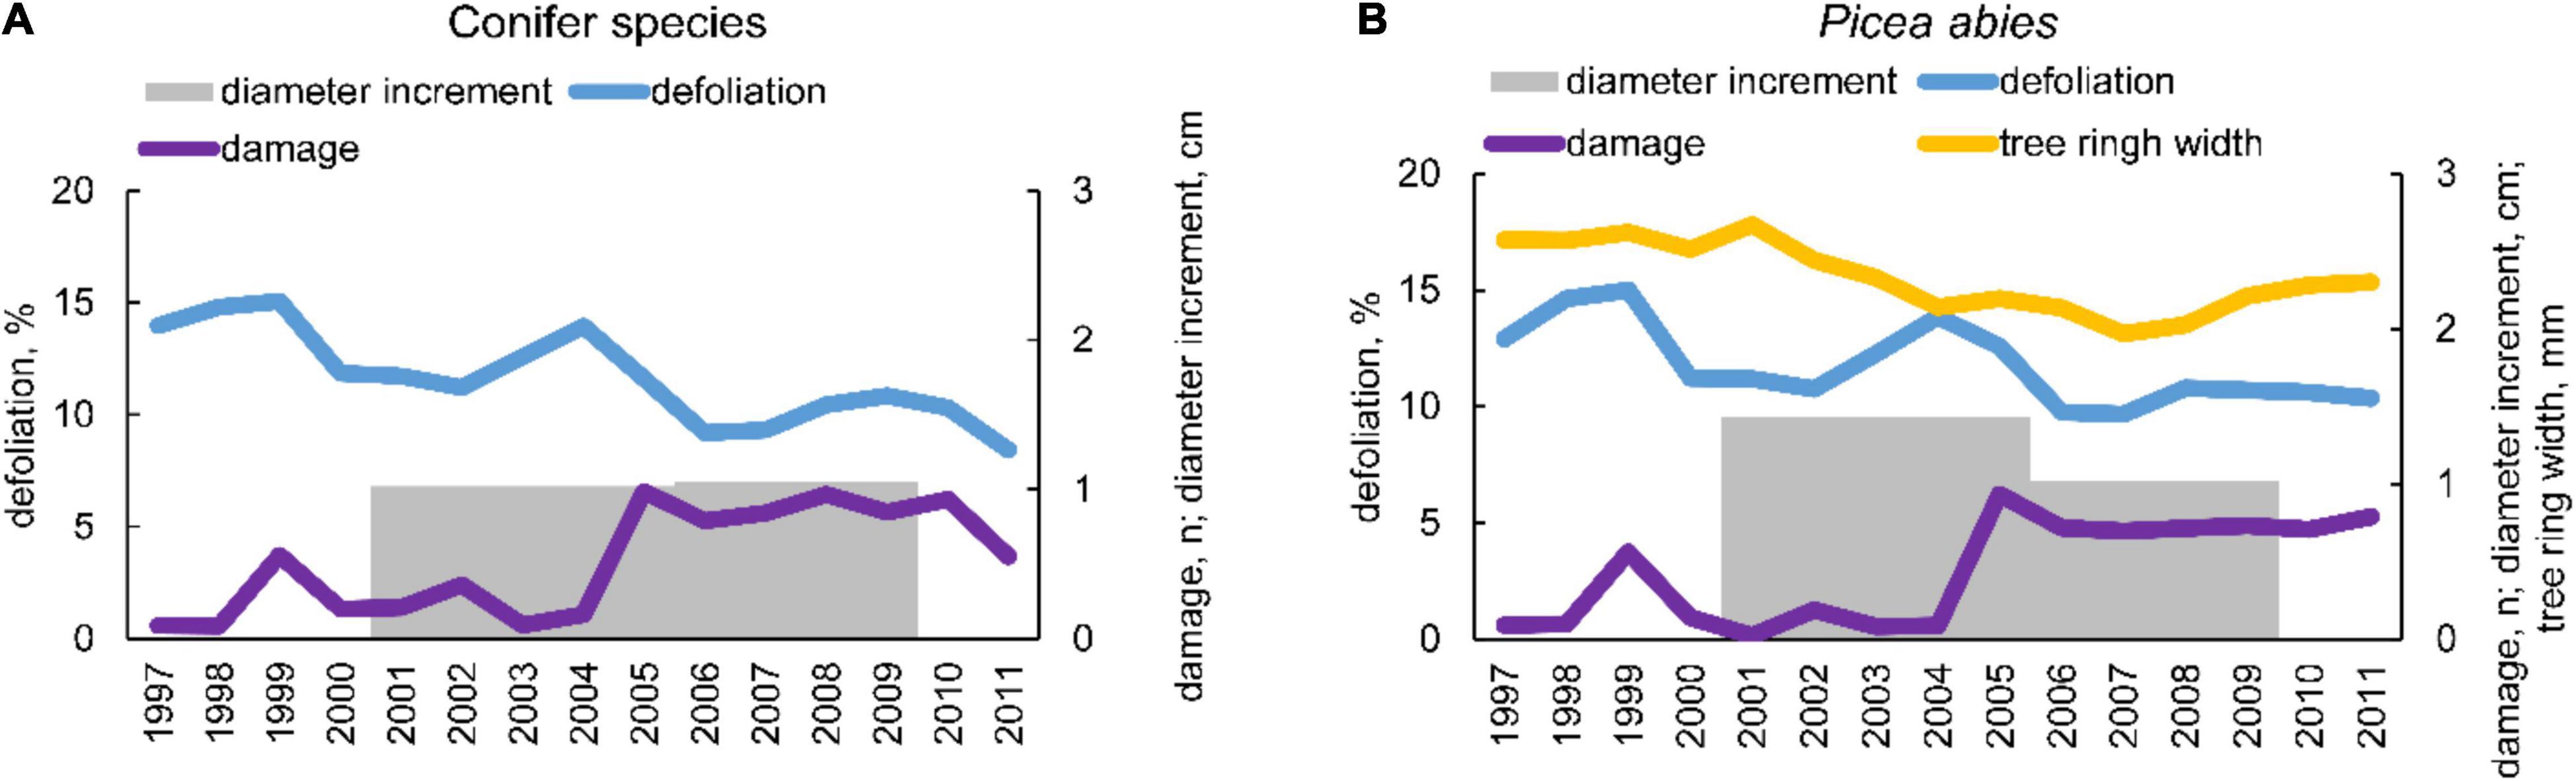
Figure 1. (A) Temporal pattern of mean yearly defoliation and damage from 1997 to 2011, and periodic diameter increment between 2001 and 2005, 2005 and 2009 for the five conifer species considered; (B) temporal pattern of mean yearly defoliation and damage from 1997 to 2011 and tree ring width, and periodic diameter increment between 2001 and 2005, 2005 and 2009 for Norway spruce (Picea abies).
There was an overall weak, still significant, negative relationship between periodical growth and defoliation over the period 2001–2009 (p = 0.0132) (Table 4). It was more pronounced in 2001–2005, and not significant in 2005–2009 (Table 4). Table 2 shows the results of model selection (final or reduced models) for the three growing periods considered. The reduced models are able to explain 11.4–27.3% of the increment variance and – for all growing periods – retained defoliation and longitude as predictors. Other predictors retained include elevation for the periods 2001–2005 and 2001–2009. Overall, periodical increments decrease with increasing defoliation, longitude and elevation (Figure 2).
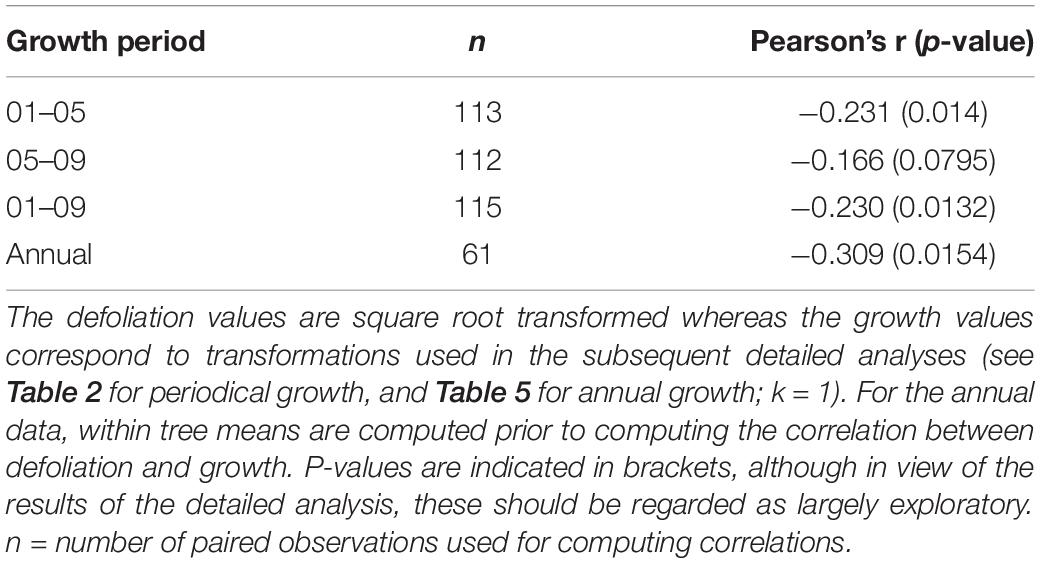
Table 4. Pearson correlations between defoliation and growth.
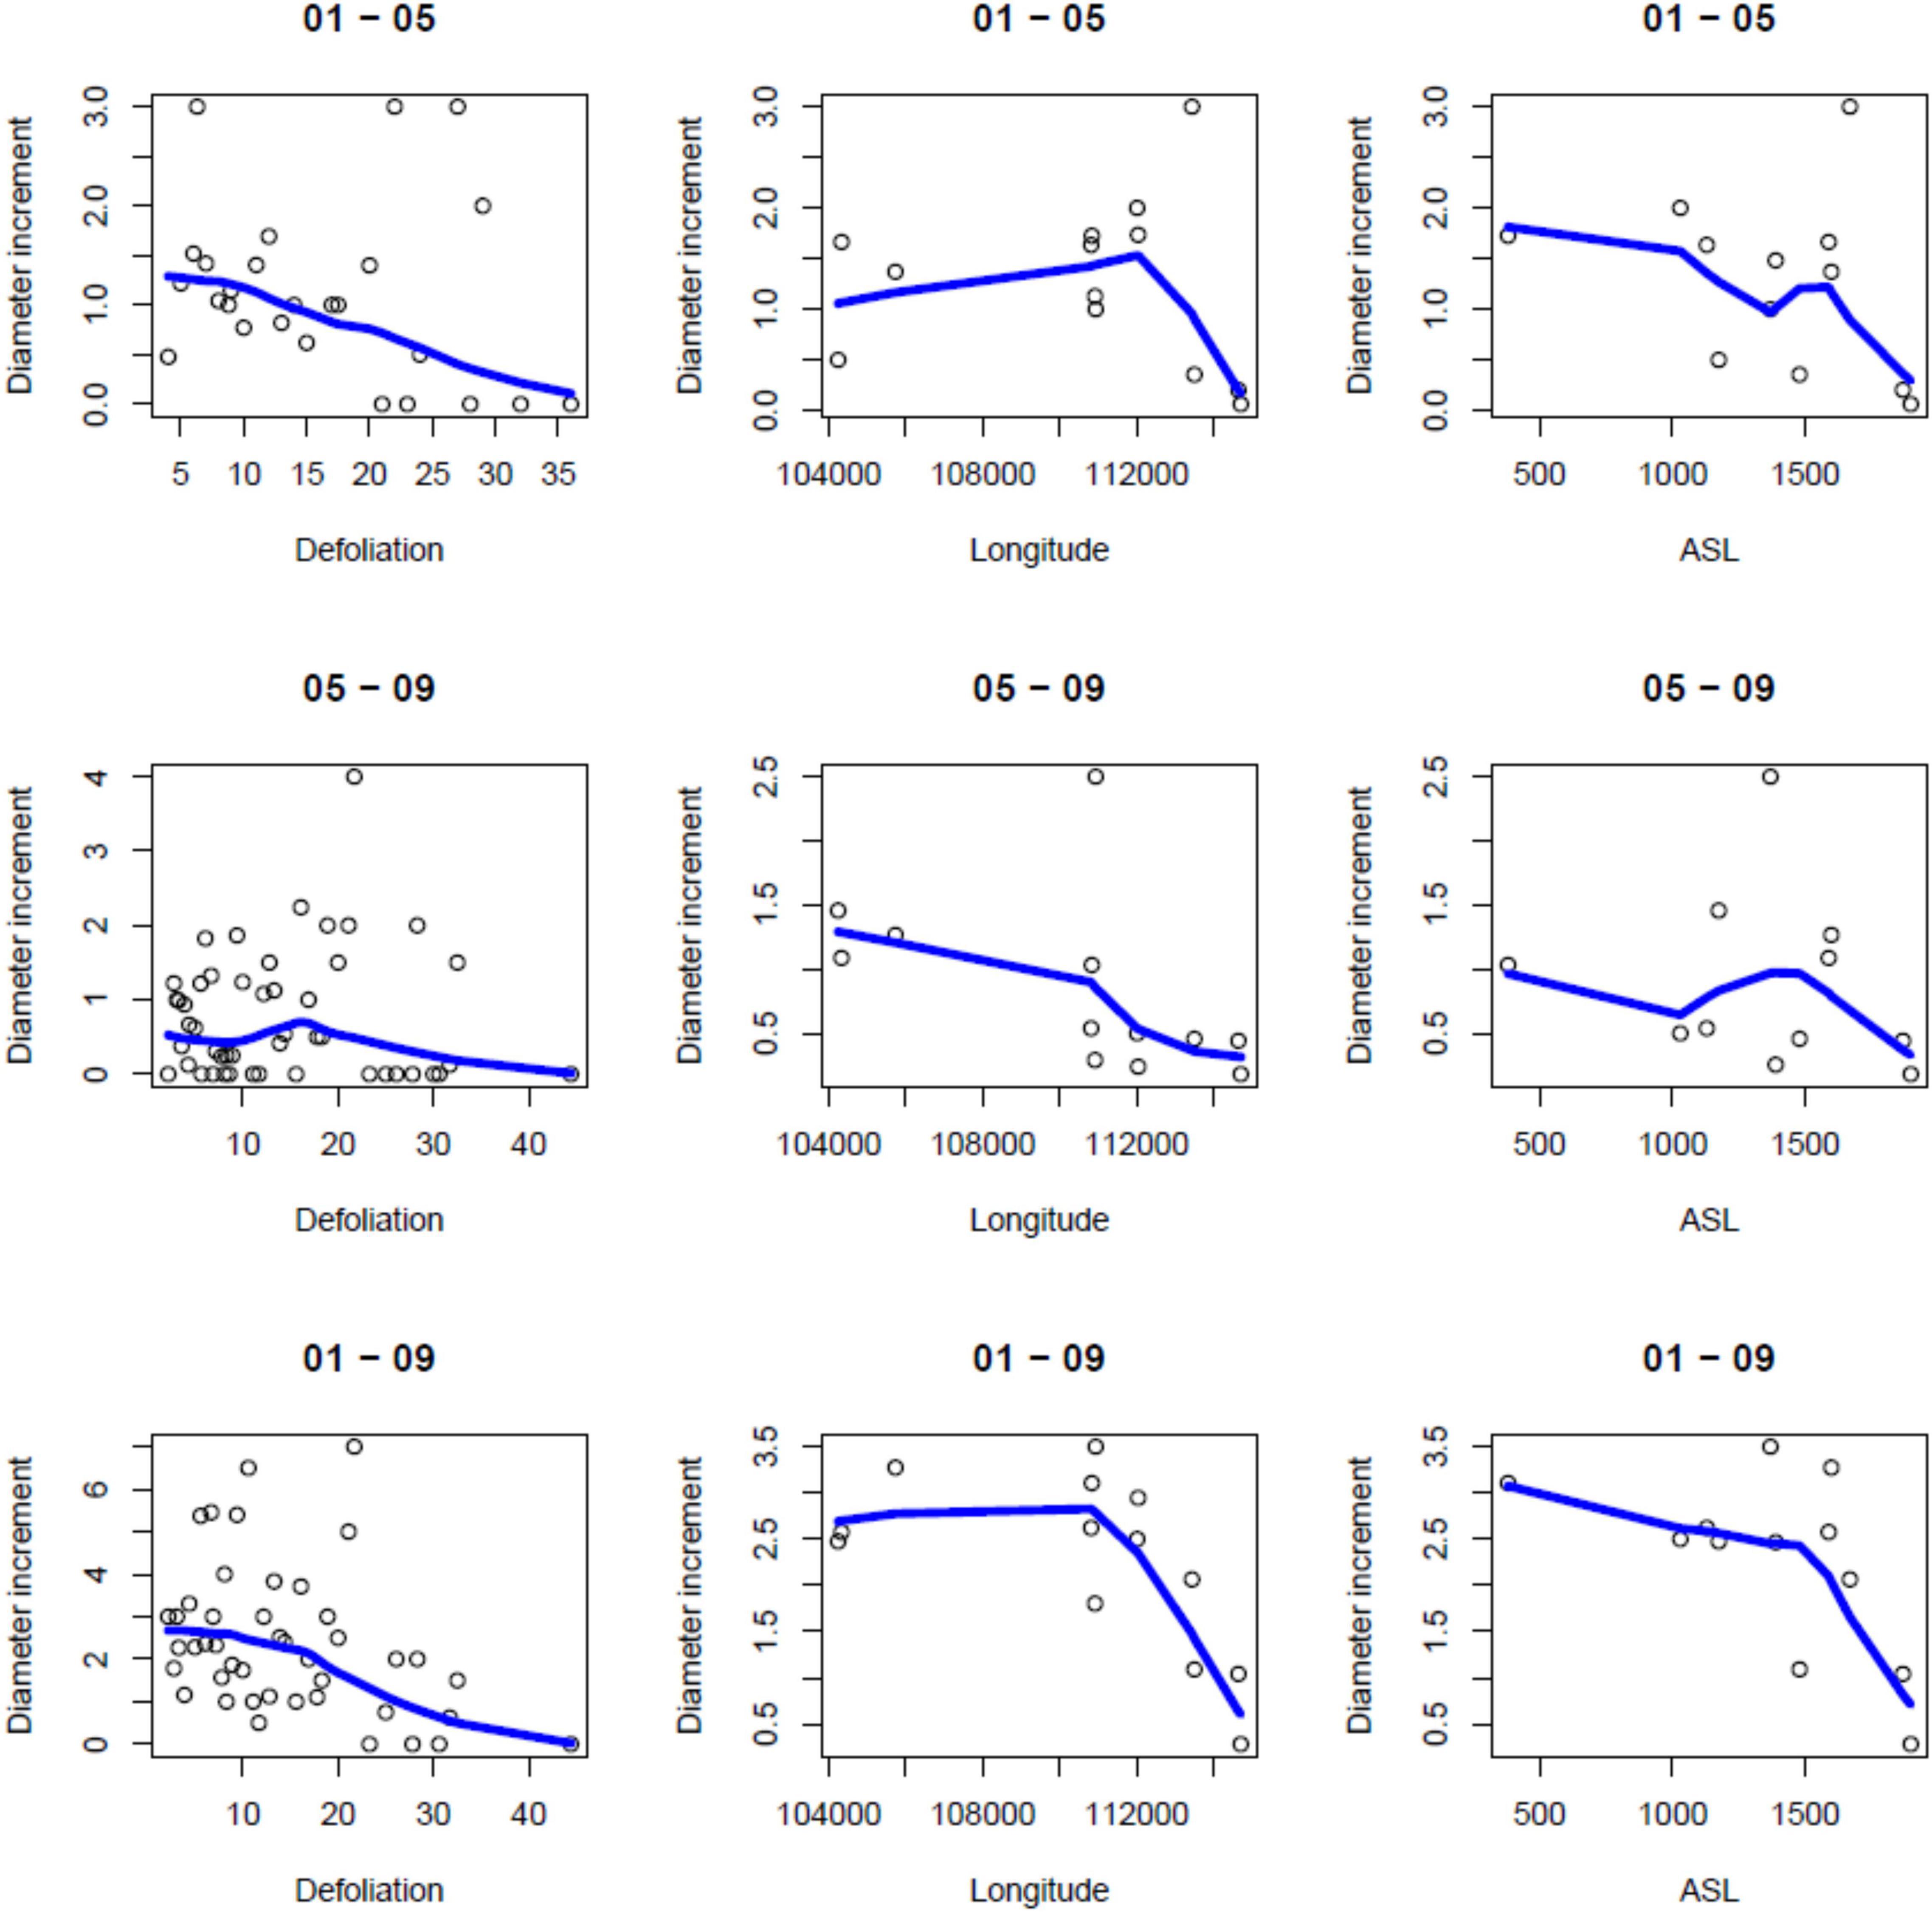
Figure 2. Scatterplots of diameter increments (cm) for various values of defoliation (%), longitude (UTM Zone 32N, m) and elevation (ASL; m a.s.l.). Local linear regression curves are superimposed on the scatterplots.
Defoliation and Annual Increment
In Figure 3, individual tree-ring widths (mm) measured on the 69 Norway spruce trees are plotted against their annual defoliation (%). There is a significant decrease in ring width with increasing defoliation level (see also Table 4), especially when defoliation is more than 20%, i.e., at least 25%: for defoliation <25%, median tree ring width is 2.065 (1.525 – 2.890, first-third quartile), whereas, for defoliation ≥25% values are 1.740 (1.018–2.055).
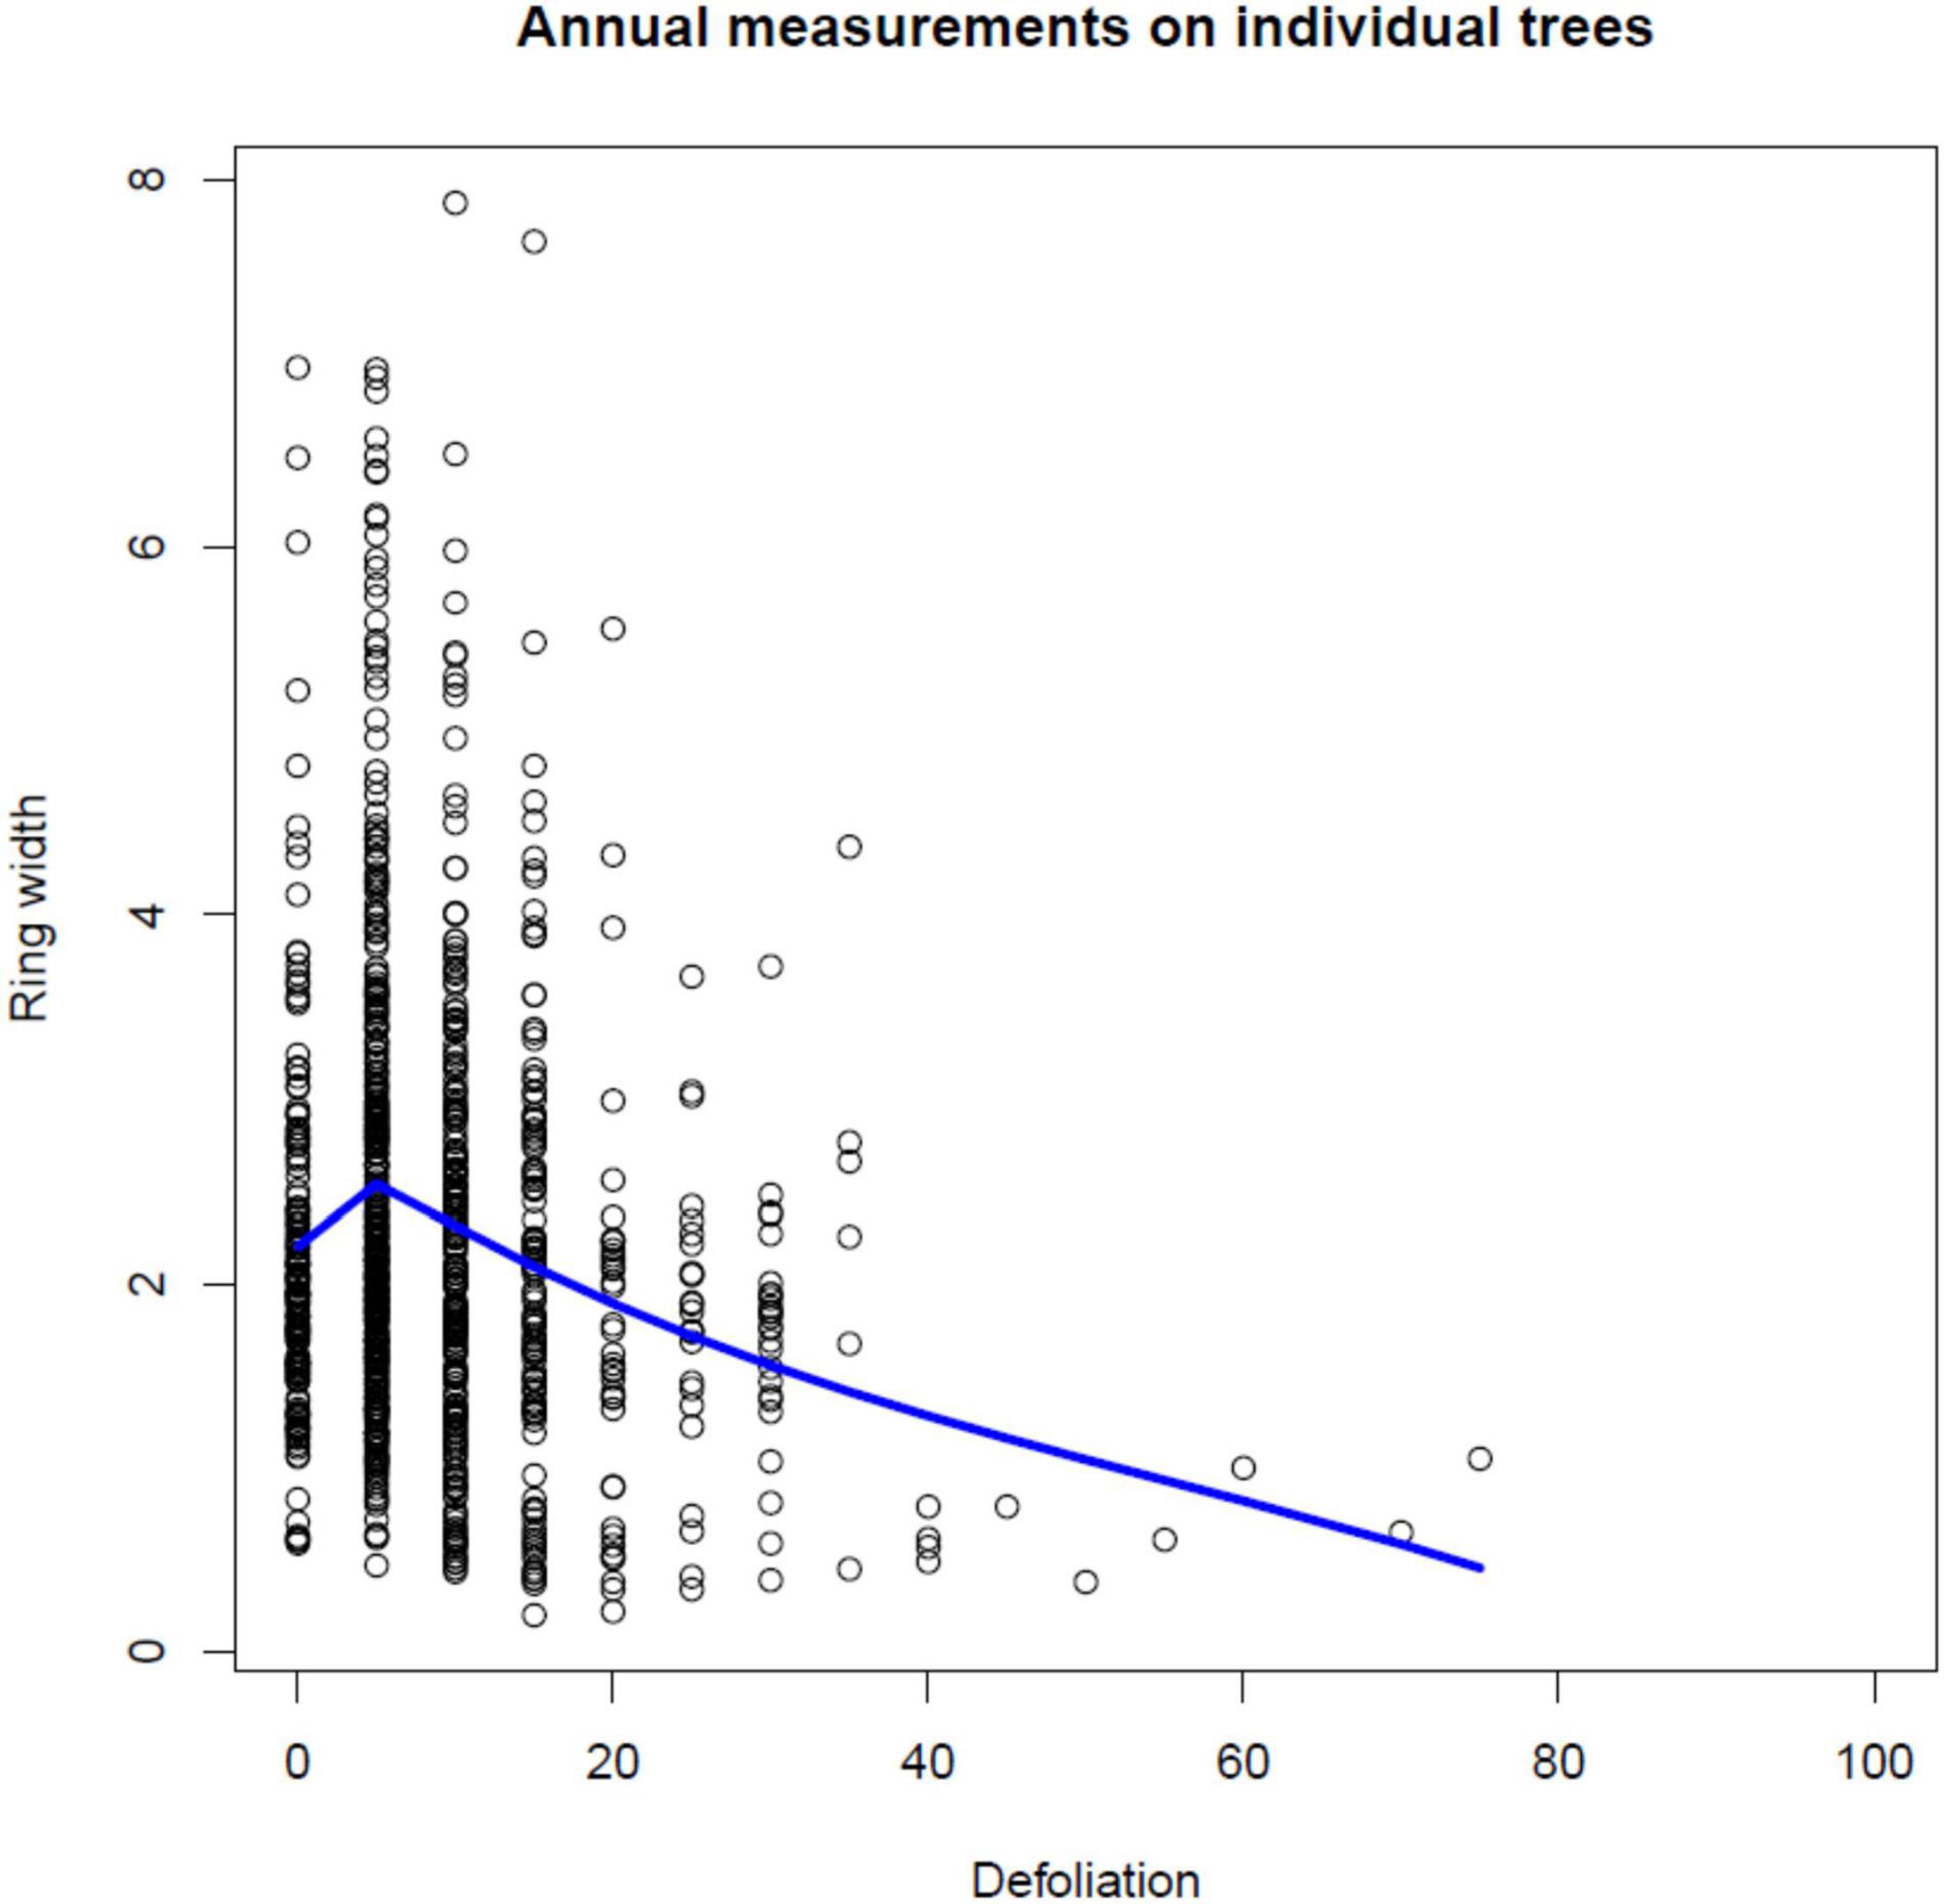
Figure 3. Scatterplot of ring widths (mm) plotted against annual defoliation (%) for individual Norway spruce trees and a superimposed local linear regression curve.
In Table 5, the final reduced models for each value of window-size (denoted by k) are presented. The amount of the variance explained (R-Square) ranges between 9 and 21.5%, suggesting a large amount of variability in the relationship between radial growth and defoliation. In this context, however, the results (Table 5) show that the significance of the models tends to increase (smaller overall p-values) with increasing k values. In detail, we observe that for k = 3, geographical properties of the site (aspect, elevation) play a role. For k > 3 (i.e., if k is at least 4), the effect of damage becomes significant and comparatively more important than other predictors, and makes the negative effect of defoliation on growth even more pronounced. An example is in Figure 4 which shows the long term (10-year window; k = 10) effect of mean damage on the relation between defoliation (%) and growth (ring widths in mm, Eq. 3): the fitted regression slopes from step 1 (Eq. 2) tend to decrease toward negative values with increased values of mean damage (we recall that a negative value of the slope parameter in Eq. 2 indicates a decreasing tendency in growth with increased defoliation).
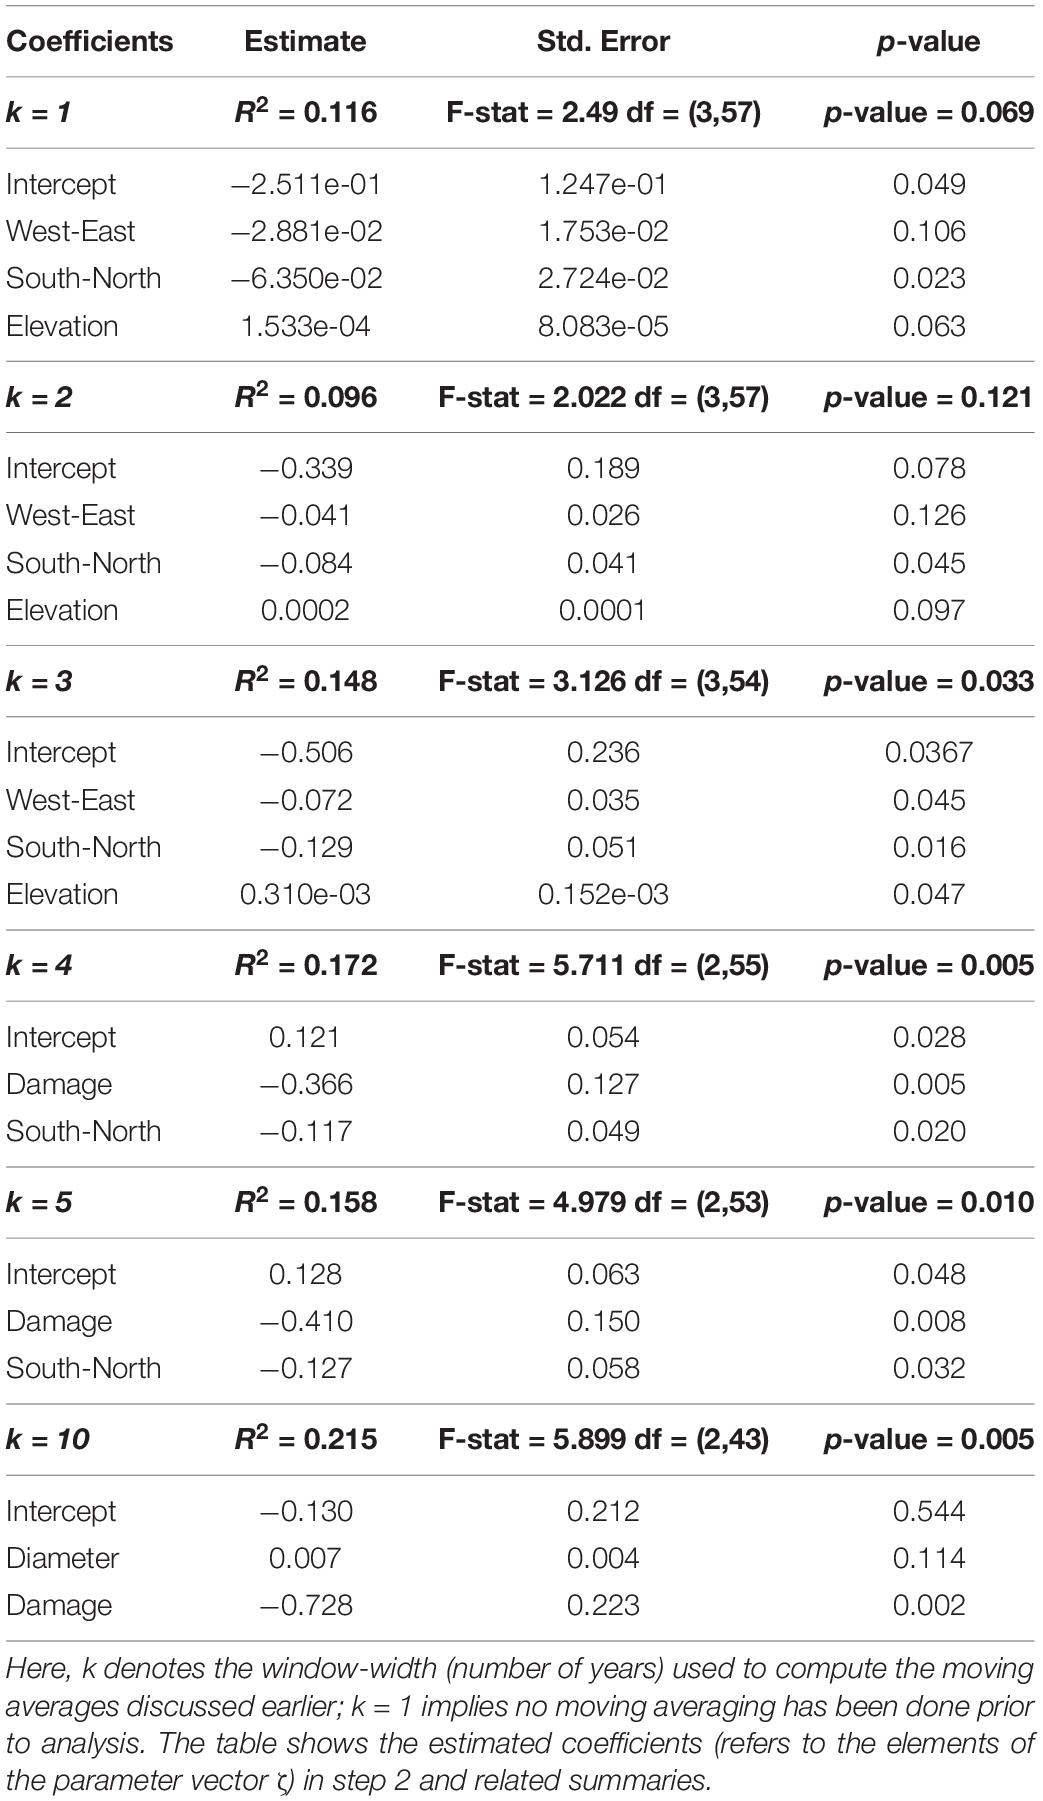
Table 5. Results of model selection after the two-step model has been fitted.
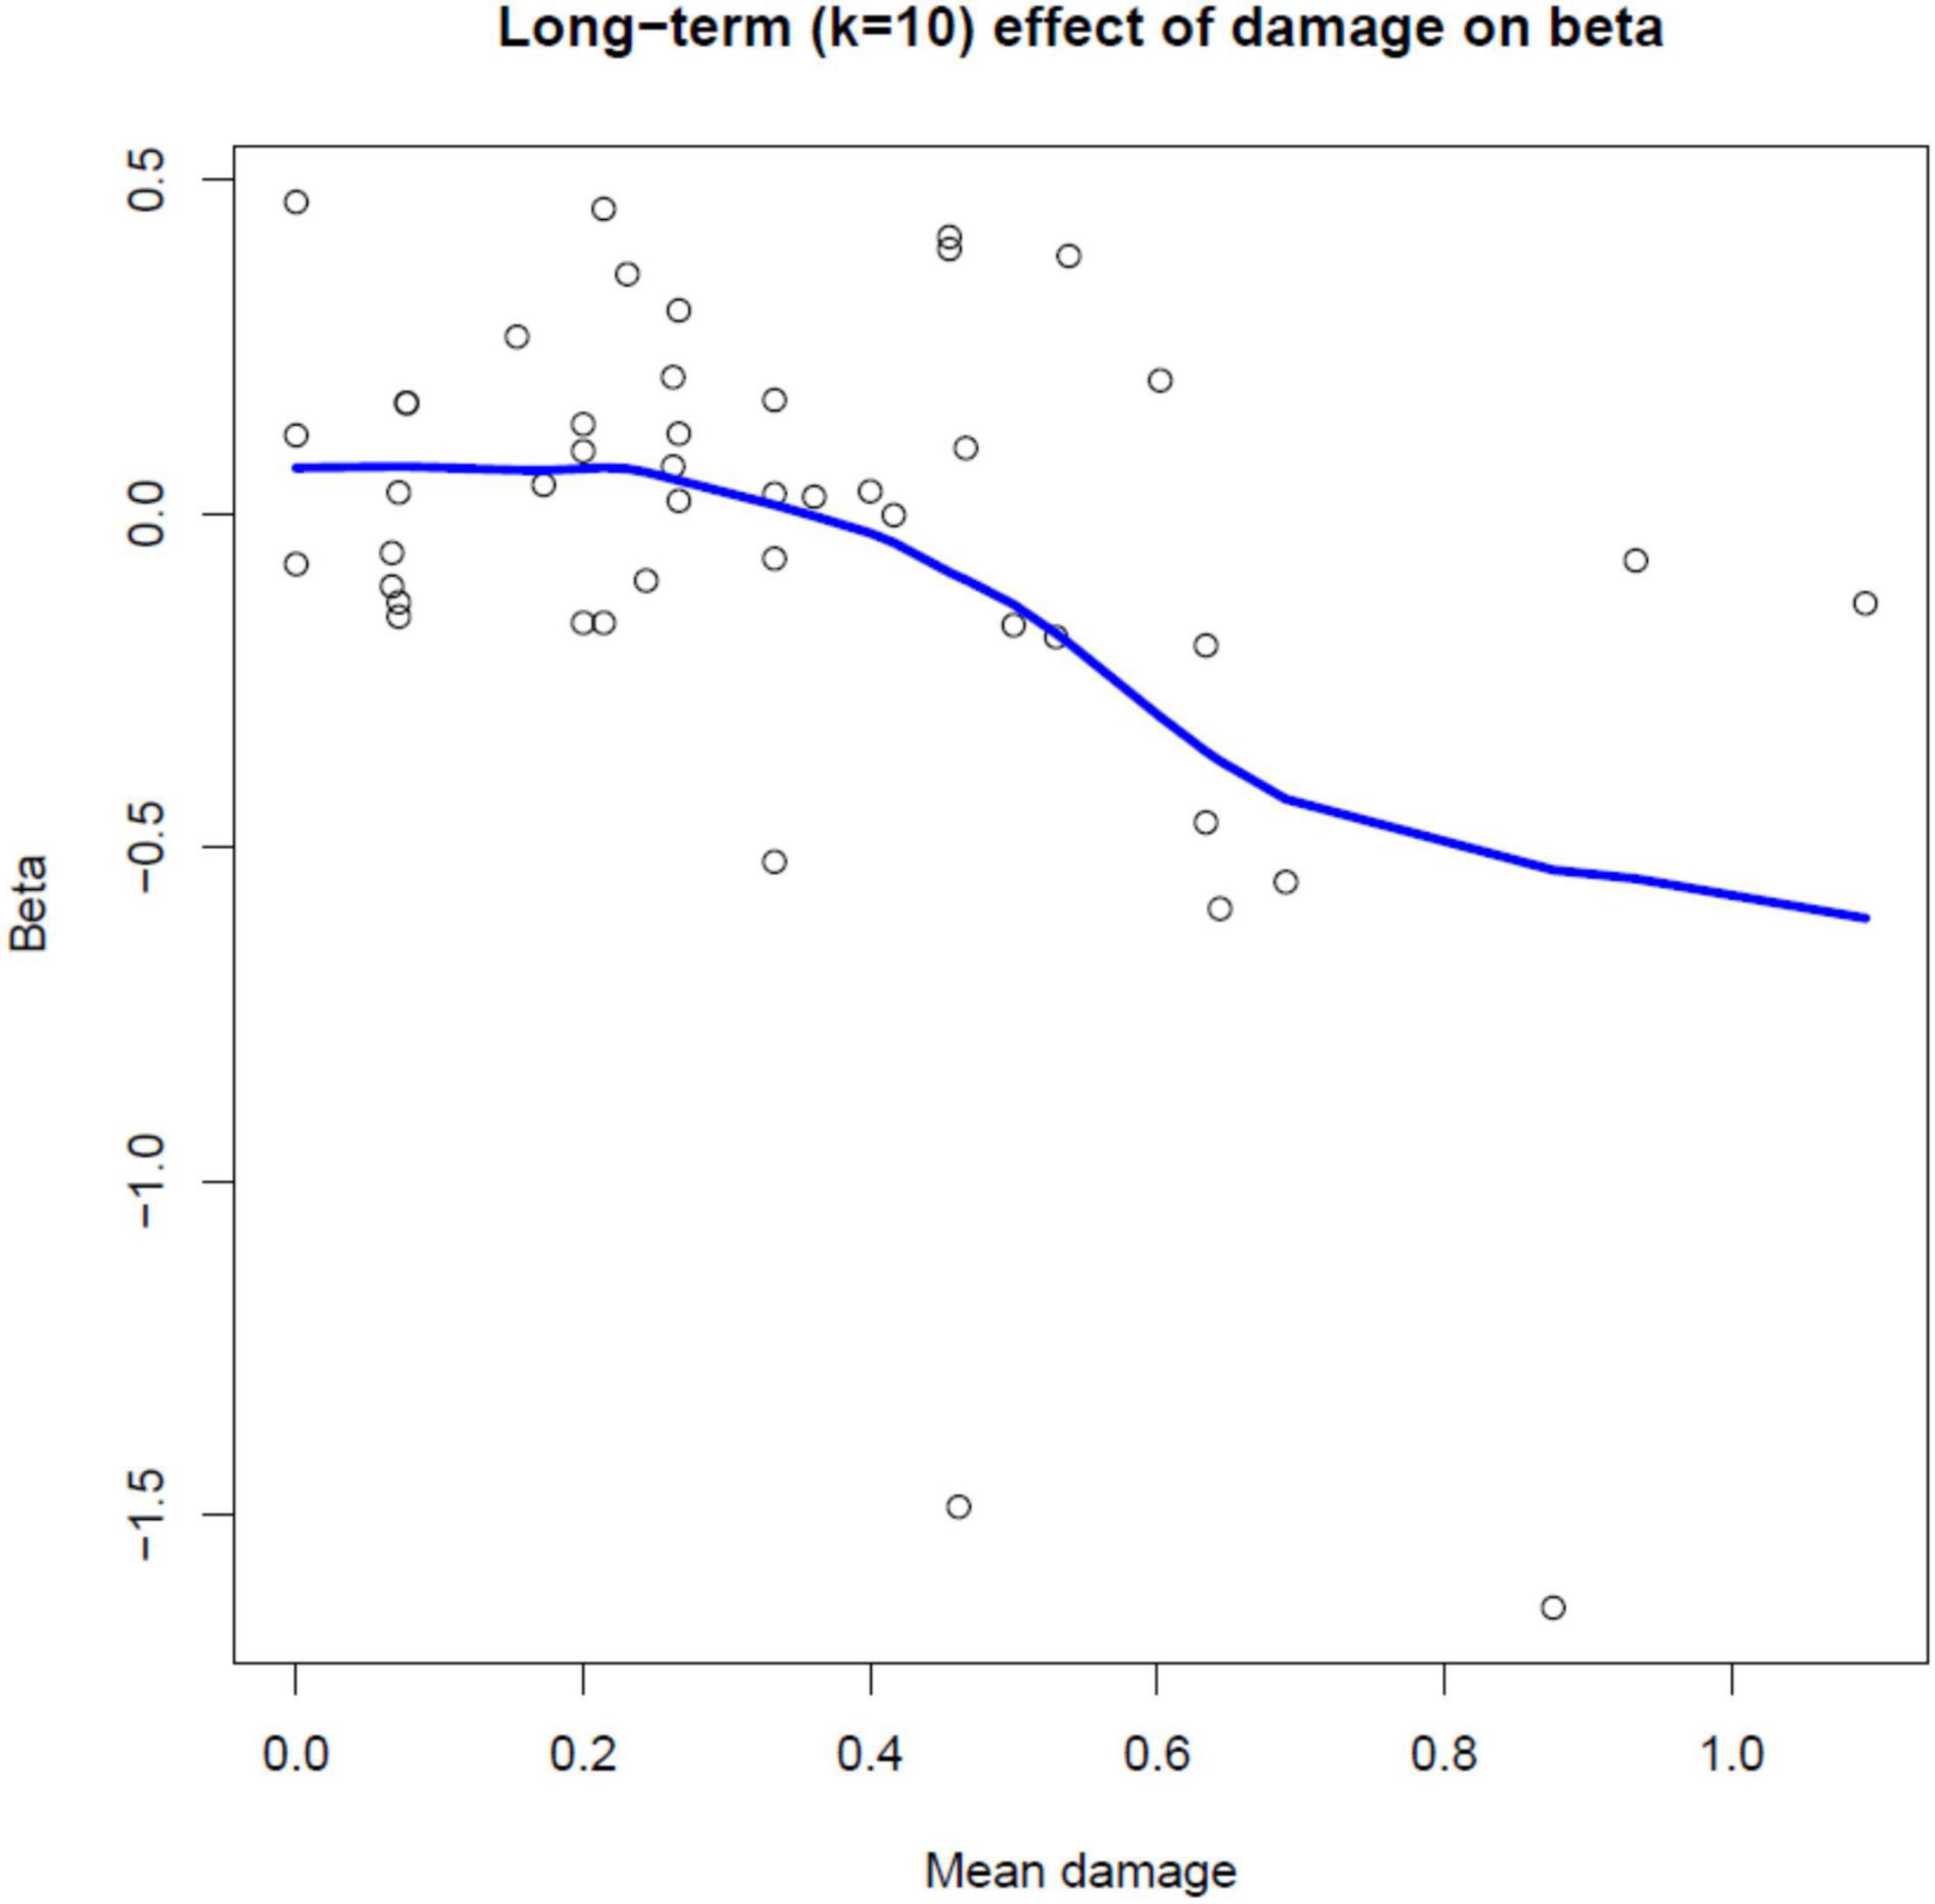
Figure 4. Scatterplot of estimated regression slope parameters from step 1 (Eq. 2) versus mean damage for individual Norway spruce trees, with a superimposed local linear regression curve (P = 0.002). The figure shows the long term (10-year window; k = 10) effect of mean damage on the relation between defoliation (%) and growth (ring widths in mm, Eq. 3).
Discussion
Many authors reported relationships between defoliation and growth (e.g., Dobbertin, 2005; Ferretti et al., 2021) and pointed out that defoliated trees can be more prone to mortality (see e.g., Dobbertin and Brang, 2001). In our study, growth was investigated in the context of defoliation and other tree and site characteristics. In particular, we considered also the occurrence of damage to trees as an additional indicator of tree health. We found defoliation as a consistent predictor of tree growth as measured on periodical (multi-annual) diameter increment and annual tree rings basis.
Periodical Increment
When periodical diameter increment is concerned, defoliation is selected by all our models, and has a negative relationship with growth. Other important variables include elevation and longitude, thus suggesting that site condition may exert a role. These latter results are in contrast with those reported by Ferretti et al. (2021) that did not find any significant effect of the geographical location on defoliation-growth relationship. Also Solberg (1999) found that site productivity, development stage or regeneration method do not affect the negative effect of defoliation on growth. Both studies, however, were carried out on a much larger basis, and in very different geographical and ecological conditions.
It is worth noting that all three time-windows considered in our study (2001–2005; 2005–2009; 2001–2009) lead to the similar conclusions, although in the final models selected by the model selection procedure the 01–05 and 01–09 windows show stronger effects (retaining more explanatory variables and larger R-square) than 05–09. The 01–09 window shows very similar results as the 01–05 time window, indicating possible legacy effects from 01 to 05.
As in other studies (e.g., Solberg, 1999; Solberg and Tveite, 2000), although significant, relationship between defoliation and periodical growth is weak. This is not surprising, given the large amount of variability existing in the data, and the large number of factors that may affect tree health and growth.
Annual Increment
When annual increment is considered, again site-related predictors (aspect, elevation) are relevant factors, and contribute to the strength of the association between defoliation and ring width in Norway spruce, at least in the short to medium terms. This pattern remains when annual data are aggregated over two or 3 years. When longer time windows are considered (k > 3), the significance of the model increases (see smaller overall p-values), damage symptoms become significant, and the negative effect of defoliation on growth becomes even more pronounced with increased damage to the tree. This apparent contrast with the results from the periodical growth (where “damage” is not retained in the final or reduced models) may be due to the multiple species used in that context while only Norway spruce was considered for annual increments.
It is worth noting that in another study along an elevation gradient in the same region, Gottardini et al. (2016) found that crown transparency (a proxy for defoliation) was related positively to damage and negatively related to needle weight, length of annual shoots, Fv/Fm (an indicator of photosynthetic potential; see Bussotti and Pollastrini, 2015), and δ18O (an oxygen isotope ratio useful to evaluate plant responses to environmental variables that influence stomatal opening). This latter pattern is consistent with the findings of Gori et al. (2014), which found oxygen isotope values decreased in the defoliated trees.
Which Time Window for Stem Radial Growth Assessment?
Relationship between defoliation and growth occurs for all the time windows considered for growth assessment (1 to 10 years), but is stronger for time windows >3 years. This may be related to causal mechanisms behind the defoliation-growth relationship, which may change according to the causal factors involved (see Dobbertin, 2005). Within the ICP Forests, growth is customary assessed on a 5-year basis (Dobbertin et al., 2020). This time resolution is certainly not suited to detect the effect (signal) of events occurring at individual years. As discussed by Ferretti et al. (2021), however, this is anyway hardly feasible in the context of defoliation-growth relationship because of different timing of measurements: tree defoliation is usually assessed in July-August, while growth is better measured after the end of the growing season (e.g., in winter). Rohner et al. (2021) demonstrated that, depending on the timing of the (climate) stress occurrence, the traditional crown defoliation assessment in early- and mid-summer is not able to capture the signal of crown deterioration and its immediate effects on tree growth. While it is always desirable to have more time intense data on tree growth, these data are not easy to be obtained at the level – for instance – of large-scale survey based on large number of plots. Coring trees for tree-ring data can be done at once, but can be rather cost-intensive. In this context, therefore, the importance of periodical, multi-annual “traditional” measurements should be not underestimated: when larger time windows are considered, short-term fluctuations are likely to be smoothed out, and more general patterns may emerge. This is because cumulated growth over 5 to 10 years has the advantage to minimize the relative importance of measurement errors, permits to focus on “average” condition and smooths out the effect of sudden short-term random events/disturbances that may create noise when looking for general association.
In conclusion, we observed a significant and consistent, although weak, association between defoliation and growth across all the time windows considered, and modulated by site factors and other tree health indicators. Our (and other’s) results support the use of defoliation as a rapid indicator of tree health and vigor, and suggest that defoliation and forest health data as collected on an annual basis across Europe can reveal spatio-temporal changes in forest growth and therefore in forest’s ability to capture carbon from the atmosphere.
Data Availability Statement
The raw data supporting the conclusions of this article will be made available by the authors, without undue reservation.
Author Contributions
MF conceptualized and designed the study. EG contributed to the study design and data collection, and assembled and curated the data. SG designed and performed the formal statistical analysis. All authors contributed in writing, reviewing and editing the manuscript.
Funding
Data on forest health and growth were collected in the frame of the project Ozone EFFORT (Ozone Effect on Forests in Trentino; see Gottardini et al., 2018) that was supported by the Forest and Fauna Service of the Autonomous Province of Trento. Tree ring data were collected for the Master degree thesis of Francesco Camin (Università degli Studi di Padova).
Conflict of Interest
The authors declare that the research was conducted in the absence of any commercial or financial relationships that could be construed as a potential conflict of interest.
Publisher’s Note
All claims expressed in this article are solely those of the authors and do not necessarily represent those of their affiliated organizations, or those of the publisher, the editors and the reviewers. Any product that may be evaluated in this article, or claim that may be made by its manufacturer, is not guaranteed or endorsed by the publisher.
Acknowledgments
We are grateful to: Forest and fauna service, Autonomous Province of Trento for data on forest health and periodical growth; Marco Carrer (Università degli Studi di Padova) and Francesco Camin for the data on tree ring increments; Fabiana Cristofolini and Antonella Cristofori (Fondazione Edmund Mach) for their support in tree core sampling. We also gratefully acknowledge constructive comments by two referees that led to substantial improvement of the manuscript.
Supplementary Material
The Supplementary Material for this article can be found online at: https://www.frontiersin.org/articles/10.3389/ffgc.2021.775600/full#supplementary-material
Supplementary Figure 1 | Temporal pattern of mean yearly defoliation and damage from 1997 to 2011, and periodic diameter increment between 2001 and 2005, 2005 and 2009 for: (A) Abies alba Mill., silver fir; (B) Larix decidua Mill., European larch; (C) Pinus cembra L., Swiss pine; (D) Pinus sylvestris L., Scots pine.
Footnotes
References
Bowman, D., Brienen, R. J. W., Gloor, E., Phillips, O. L., and Prior, L. D. (2013). Detecting trends in tree growth: not so simple. Trends Plant Sci. 18, 11–17.
Brun, P., Psomas, A., Ginzler, C., Thuiller, W., Zappa, M., and Zimmermann, N. E. (2020). Large-scale early-wilting response of Central European forests to the 2018 extreme drought. Glob. Change Biol. 26, 7021–7035. doi: 10.1111/gcb.15360
Bussotti, F., Cozzi, A., Cenni, E., Bettini, D., Sarti, C., and Ferretti, M. (2009). Measurement errors in monitoring tree crown conditions: entity, control, evolution and implications for results. J. Environ. Monit. 11, 769–773.
Bussotti, F., and Pollastrini, M. (2015). Evaluation of leaf features in forest trees: methods, techniques, obtainable information and limits. Ecol. Indic. 52, 219–230.
Camin, F. (2013). Relazioni Clima-Accrescimento Nell’abete Rosso. Analisi con Temperature e Precipitazioni Mensili e Giornaliere in Trentino. Padova: Università degli Studi di Padova.
Cherubini, P., Battipaglia, G., and Innes, J. L. (2021). Tree vitality and forest health: can tree-ring stable isotopes be used as indicators? Curr. For. Rep. 7, 69–80. doi: 10.1007/s40725-021-00137-8
CLC Corine Land Cover (2000). Available online at: http://land.copernicus.eu/pan-european/corine-land-cover.
Dobbertin, M. (2005). Tree growth as indicator of tree vitality and of tree reaction to environmental stress: a review. Eur. J. For. Res. 124, 319–333. doi: 10.1007/s10342-005-0085-3
Dobbertin, M., and Brang, P. (2001). Crown defoliation improves tree mortality models. For. Ecol. Manag. 141, 271–284. doi: 10.1016/s0378-1127(00)00335-2
Dobbertin, M., Neumann, M., Levaniè, T., Sanders, T. G. M., Skudnik, M., and Krüger, I. (2020). “Part V: tree growth level II,” in Manual on Methods and Criteria for Harmonized Sampling, Assessment, Monitoring and Analysis of the Effects of Air Pollution on Forests, ed. UNECE ICP Forests Programme Co-ordinating Centre (Eberswalde: Thünen Institute of Forest Ecosystems), 19. doi: 10.1111/j.1744-7909.2012.01141.x
Eccel, E., and Saibanti, S. (2005). Climatic setting of the Lavarone-Vezzena Plateau in the general context of Trentino. Stud. Trent Sci. Nat. Acta Geol. 82, 111–121.
Eichhorn, J., Roskams, P., Potoèič, N., Timmermann, V., Ferretti, M., Mues, V., et al. (2016). Part IV: Visual Assessment of Crown Condition and Damaging Agents, Manual on Methods and Criteria for Harmonized Sampling, Assessment, Monitoring and Analysis of the Effects of Air Pollution on Forests. Eberswalde: Thünen Institute of Forest Ecosystems, 54.
Eichhorn, J., Roskams, P., Potoèič, N., Timmermann, V., Ferretti, M., Mues, V., et al. (2020). “Part IV: visual assessment of crown condition and damaging agents,” in Manual on Methods and Criteria for Harmonized Sampling, Assessment, Monitoring and Analysis of the Effects of Air Pollution on Forests, ed. UNECE ICP Forests Programme Co-ordinating Centre (Eberswalde: Thünen Institute of Forest Ecosystems), 50.
Etzold, S., Ferretti, M., Reinds, G. J., Solberg, S., Gessler, A., Waldner, P., et al. (2020). Nitrogen deposition is the most important environmental driver associated to continental-scale growth of pure, even-aged, managed European forests. For. Ecol. Manag. 458:117762. doi: 10.1016/j.foreco.2019.117762
Eyles, A., Pinkard, E. A., and Mohammed, C. (2009). Shifts in biomass and resource allocation patterns following defoliation in Eucalyptus globulus growing with varying water and nutrient supplies. Tree Physiol. 29, 753–764. doi: 10.1093/treephys/tpp014
Eyles, A., Robinson, A. P., Smith, D., Carnegie, A., Smith, I., Stone, C., et al. (2011). Quantifying stem growth loss at the tree-level in a Pinus radiata plantation to repeated attack by the aphid, Essigella californica. For. Ecol. Manag. 261, 120–127.
Favero, A., Daigneault, A., and Sohngen, B. (2020). Forests: carbon sequestration, biomass energy, or both? Sci. Adv. 6:eaay6792.
Ferretti, M. (1994). Mediterranean Forest Trees. A Guide for Crown Assessment. Brussels: CEC-UN/ECE.
Ferretti, M., Bacaro, G., Brunialti, G., Calderisi, M., Croise, L., Frati, L., et al. (2021). Tree canopy defoliation can reveal growth decline in mid-latitude temperate forests. Ecol. Indic. 127:107749.
Ferretti, M., Bacaro, G., Brunialti, G., Confalonieri, M., Cristofolini, F., Cristofori, A., et al. (2018). Scarce evidence of ozone effect on recent health and productivity of alpine forests-a case study in Trentino, N. Italy. Enviro. Sci. Pollut. Res. 25, 8217–8232. doi: 10.1007/s11356-018-1195-z
Ferretti, M., Bussotti, F., Cenni, E., and Cozzi, A. (1999). Implementation of quality assurance procedures in the Italian programs of forest condition monitoring. Water Air Soil Pollut. 116, 371–376. doi: 10.1007/978-94-017-1578-2_32
Ferretti, M., Calderisi, M., Marchetto, A., Waldner, P., Thimonier, A., Jonard, M., et al. (2015). Variables related to nitrogen deposition improve defoliation models for European forests. Ann. For. Sci. 72, 897–906. doi: 10.1007/s13595-014-0445-6
Forest Europe (2020). State of Europe’s Forests 2020. Ministerial Conference on the Protection of Forests in Europe: FOREST EUROPE Liaison Unit Bratislava.
Friedlingstein, P., Jones, M. W., O’Sullivan, M., Andrew, R. M., Hauck, J., Peters, G. P., et al. (2019). Global carbon budget 2019. Earth Syst. Sci. Data 11, 1783–1838.
Ghosh, S., Landmann, G., Pierrat, J. C., and Müler-Edzards, C. (1997). “Spatio-temporal variation in defoliation,” in 10 Years Forest Condition Monitoring in Europe. Studies on Temporal Development, Spatial Distribution, and Impacts of Natural and Anthropogenic Stress Factors, eds C. Müller-Edzards, W. De Vries, and J. Willem Erisman (Geneva: United Nations Economic Commission for Europe / European Commission), 35–50. doi: 10.1016/j.sste.2017.07.002
Gori, Y., Camin, F., La Porta, N., Carrer, M., and Battisti, A. (2014). Tree rings and stable isotopes reveal the tree-history prior to insect defoliation on Norway spruce (Picea abies (L.) Karst.). For. Ecol. Manag. 319, 99–106.
Gottardini, E., Cristofolini, F., Cristofori, A., Camin, F., Calderisi, M., and Ferretti, M. (2016). Consistent response of crown transparency, shoot growth and leaf traits on Norway spruce (Picea abies (L.) H. Karst.) trees along an elevation gradient in northern Italy. Ecol. Indic. 60, 1041–1044.
Gottardini, E., Cristofolini, F., Cristofori, A., and Ferretti, M. (2018). In search for evidence: combining ad hoc survey, monitoring, and modeling to estimate the potential and actual impact of ground level ozone on forests in Trentino (Northern Italy). Enviro. Sci. Pollut. Res. 25, 8206–8216. doi: 10.1007/s11356-017-9998-x
Hastie, T., and Tibshirani, R. (1993). Varying-coefficient models. J. R. Stat. Soc. Ser. B 55, 757–796.
Innes, J. L., Landmann, G., and Mettendorf, B. (1993). Consistency of observations of forest tree defoliation in 3 European countries. Environ. Monit. Assess. 25, 29–40. doi: 10.1007/BF00549790
Innes, J. L., and Neumann, H. (1991). Past growth variations in Picea sitchensis with differing crown densities. Scand. J. For. Res. 6, 395–405.
Jacquet, J. S., Orazio, C., and Jactel, H. (2012). Defoliation by processionary moth significantly reduces tree growth: a quantitative review. Ann. For. Sci. 69, 857–866. doi: 10.1007/s13595-012-0209-0
Klesse, S. (2021). Critical note on the application of the “two-third” spline. Dendrochronologia 65:125786. doi: 10.1016/j.dendro.2020.125786
Kurkela, T., Aalto, T., Varama, M., and Jalkanen, R. (2005). Defoliation by the common pine sawfly (Diprion pini) and subsequent growth reduction in Scots pine: a retrospective approach. Silva Fenn. 39, 467–480.
Langstrom, B., Annila, E., Hellqvist, C., Varama, M., and Niemela, P. (2001). Tree mortality, needle biomass recovery and growth losses in Scots pine following defoliation by Diprion pini (L.) and subsequent attack by Tomicus piniperda (L.). Scand. J. For. Res. 16, 342–353. doi: 10.1080/02827580152496731
Linares, J. C., and Camarero, J. J. (2012). Growth patterns and sensitivity to climate predict silver fir decline in the Spanish Pyrenees. Eur. J. For. Res. 131, 1001–1012. doi: 10.1007/s10342-011-0572-7
Michel, A., Prescher, A.-K., and Schwärzel, K (eds) (2020). Forest Condition in Europe: The 2020 Assessment. ICP Forests Technical Report Under the UNECE Convention on Long-Range Transboundary Air Pollution (Air Convention). Eberswalde: Thünen Institute. doi: 10.3220/ICPTR1606916913000
Mueller, E., and Stierlin, H. R. (1990). Sanasilva. Tree Crown Photos. Birmensdorf: Swiss Federal Institute for Forest, Snow and Landscape Research.
Pinheiro, J., and Bates, D. (2009). Mixed-Effects Models in S and S-Plus. 2nd printing. New York, NY: Springer.
R Core Team (2020). R: A Language and Environment for Statistical Computing. Vienna: R Foundation for Statistical Computing.
Rao, C. R. (1973). Linear Statistical Inference and Its Applications, 2nd Edn. New York, NY: John Wiley & Sons.
Rohner, B., Kumar, S., Liechti, K., Gessler, A., and Ferretti, M. (2021). Tree vitality indicators revealed a rapid response of beech forests to the 2018 drought. Ecol. Indic. 120:106903. doi: 10.1016/j.ecolind.2020.106903
Schuldt, B., Buras, A., Arend, M., Vitasse, Y., Beierkuhnlein, C., Damm, A., et al. (2020). A first assessment of the impact of the extreme 2018 summer drought on Central European forests. Basic Appl. Ecol. 45, 86–103.
Sen, A., and Srivastava, M. S. (1990). Regression Analysis, Theory, Methods and Applications. New York, NY: Springer.
Serfling, R. (1980). Approximation Theorems of Mathematical Statistics. New York, NY: John Wiley & Sons.
Söderberg, U. (1993). “Increment analysis. The relation between defoliation and increment,” in Proceedings from the Meeting in the SNS-Ad Hoc Group on Monitoring Forest Damage, 26-28.4 1993, ed. M. G. Thomsen (Ås: Norsk Institutt for Skogforskning, og institutt for skogfag, Norges landbrukshögskole).
Solberg, S. (1999). Crown condition and growth relationships within stands of Picea abies. Scand. J. For. Res. 14, 320–327. doi: 10.1080/02827589950152638
Solberg, S., and Tveite, B. (2000). Crown density and growth relationships between stands of Picea abies in Norway. Scand. J. For. Res. 15, 87–96. doi: 10.1080/02827580050160510
Keywords: ICP Forests, tree defoliation and damage, diameter increment, tree rings, statistical modeling
Citation: Ferretti M, Ghosh S and Gottardini E (2021) Stem Radial Growth Is Negatively Related to Tree Defoliation and Damage in Conifers, Northern Italy. Front. For. Glob. Change 4:775600. doi: 10.3389/ffgc.2021.775600
Received: 14 September 2021; Accepted: 08 November 2021;
Published: 07 December 2021.
Edited by:
Jürgen Kreuzwieser, University of Freiburg, GermanyReviewed by:
Stefan Leca, National Institute for Research and Development in Forestry Marin Dracea (INCDS), RomaniaTamara Jakovljevic, Croatian Forest Research Institute, Croatia
Copyright © 2021 Ferretti, Ghosh and Gottardini. This is an open-access article distributed under the terms of the Creative Commons Attribution License (CC BY). The use, distribution or reproduction in other forums is permitted, provided the original author(s) and the copyright owner(s) are credited and that the original publication in this journal is cited, in accordance with accepted academic practice. No use, distribution or reproduction is permitted which does not comply with these terms.
*Correspondence: Marco Ferretti, bWFyY28uZmVycmV0dGlAd3NsLmNo