 Myeong-Ju Kim
 Sang-Deok Lee
- 1Department of Forest Environment System, Kangwon National University, Chuncheon, South Korea
- 2Division of Forest Science, Kangwon National University, Chuncheon, South Korea
High hourly concentrations of ozone, a secondary pollutant produced from the photochemical reactions of primary precursors, have been increasing in South Korea, bringing potential adverse effects on vegetation. Deforestation caused by high ozone concentrations has been investigated in China and Japan. Using ozone measurements from East and West, Gangwon Province, South Korea, from 2001 to 2018, this study compared changes in surface ozone concentrations and analyzed the influences of meteorological factors and air pollutants. This study calculated accumulated ozone exposure over a threshold of 40 ppb (AOT40) and investigated the possibility of ozone affecting deforestation. Monthly average surface ozone concentrations increased rapidly in both regions from 2009. Although the daily total insolation (a meteorological factor that significantly impacts photochemical reactions) of West Gangwon and East Gangwon did not differ significantly, the ozone concentration was lower in East Gangwon than in West Gangwon (1.5 times lower from 2001 to 2018) owing to local strong winds. Moreover, there was a negative correlation between nitrogen dioxide and ozone generation. AOT40 in West Gangwon was about twice that in East Gangwon and exceeded 10,000 ppbh, the critical level for forests, every year since 2003. Potential damage from high concentrations of ozone was higher in West Gangwon than in East Gangwon.
Introduction
Ozone (O3) is a secondary pollutant generated from photochemical reactions by ultraviolet rays when precursors, nitrogen oxides (NOx) and volatile organic compounds (VOCs), are present in the atmosphere. NOx is generated during fossil fuel combustion. In the Seoul metropolitan area, 57% of NOx emissions come from road transportation pollution sources, such as automobiles (Ministry of the Environment Metropolitan Air Quality Management Office, 2022). VOCs easily evaporate in the atmosphere owing to their low boiling point, and 72% come from the use of organic solvents, such as in chemical and pharmaceutical factories and plastic drying processes (Ministry of the Environment Metropolitan Air Quality Management Office, 2022). Owing to rising emissions of NOx and VOCs from anthropogenic sources, O3 concentrations have been steadily increasing (Volz and Kley, 1988) and are expected to further increase in the future with rising anthropogenic pollutant emissions (Vingarzan, 2004; Meehl et al., 2007).
Although primary air pollutants play a role in the generation of high O3 concentrations, meteorological conditions, such as temperature, insolation, relative humidity, and wind speed, are also key factors (Osrodka and Swiech-Skiba, 1997; Treffeisen and Halder, 2000; Walczewski, 2005). Among meteorological conditions, O3 tends to rise in proportion to insolation and temperature and decreases with increasing cloud and rain (Ferretti et al., 2003). When the temperature rises, emissions of volatile hydrocarbons increase and solar radiation increases, thereby increasing photochemical processes, accelerating the formation of O3 (Fiala et al., 2003).
According to the Seoul Metropolitan Area Atmospheric Environment Agency (2005) published by the Metropolitan Air Environment Agency of the Korean Ministry of Environment, meteorological conditions in which high concentrations of O3 occur can be largely categorized as follows: (1) temperature of 25°C or higher, (2) relative humidity of 75% or lower, (3) continuous wind speed of 4 m/s or less, (4) total insolation from sunrise to noon of 6.4 MJ/m2 or more, and (5) continuous strong insolation and no clouds in sunny weather. When high concentrations of O3 occur, if the atmosphere is stable and convection does not occur owing to frontal or subsidence inversion, then anthropogenic air pollutants emitted by anthropogenic activities become trapped near the earth’s surface with the surrounding air, which can adversely impact human health and forest ecosystems. It is necessary to monitor the interaction between weather factors and air pollutants for a long time to identify the condition of the atmosphere and the degree of air pollutants and establish air pollution policies.
High concentrations of O3 adversely impact the human body and are highly toxic to plants and the degree of damage varies with the O3 concentration and period of exposure. During gas exchange between leaves and the environment, O3 penetrating through open stomata (Rich et al., 1970) can lead to acute damage, such as necrosis and spots, and chronic damage, such as pigmentation and dieback (Krupa and Manning, 1988). Long-term exposure to high O3 concentrations adversely impacts crop yields, forest growth, and species composition (Ashmore, 2005).
The critical level of O3 for vegetation was first defined in Germany in 1988 (ECE, 1988). This was further developed and the concept of accumulated exposure to O3 above the critical level for a given time was adopted. The indicator for the impact of O3 exposure on vegetation is accumulated O3 exposure over a threshold of 40 ppb (AOT40), which set a concentration of 40 ppb (0.04 ppm) for the AOTx indicator widely used in Europe. The average AOT40 in East Asia is steadily increasing, and damage from ozone is expected to increase (Chang et al., 2017). In order to manage the damage caused by ozone in the long term, it is necessary to study at a local level.
As forests occupy approximately 63% of the total land in South Korea (Korea Forest Service Home, 2022), forest damage caused by O3 is expected to grow in severity. Recently, high O3 concentrations are frequently occurring in South Korea and the number of O3 warnings issued is increasing (Air Korea, 2022).
As climate change becomes serious, the function of forests in carbon absorption is being discussed as a means of responding to climate change. However, there are concerns about the decline of forests owing to air pollutants (Takahashi et al., 2020). To prevent forest reduction, it is necessary to study the regional critical level and create and manage forests accordingly. As such, there is a growing need for studies on the impacts of O3 on forests, but such research is insufficient. The primary aim of this study is to investigate the possibility of O3 adversely impacting the productivity of forests in South Korea. Long-term changes in O3 concentration and AOT40 were calculated and analyzed using national data on surface O3 concentrations in East Gangwon and West Gangwon, Gangwon Province, from 2001 to 2018.
Materials and methods
Monitoring sites
Gangwon Province, South Korea, has a total area of 16,875 km2, approximately 17% of the country’s total land area. About 81% (13,716 km2) of Gangwon Province’s total area is forest, making it the largest forest area in South Korea [approximately 21.6% of national forest cover (Korea Forest Service, 2021)]. Gangwon Province is divided into East Gangwon and West Gangwon by the Taebaek Mountains, the longest mountain range in South Korea, stretching from South Hamgyong Province in North Korea to Busan in South Korea, known as the backbone of the Korean Peninsula. The Taebaek Mountains crossing Gangwon Province consist of a continuously connected high and wide mountain range with an average elevation of 800–1,000 m above sea level. They act as a boundary, separating cultures within the province and causing distinct climates.
Regarding general meteorological characteristics, in East Gangwon, the steep slopes of the mountain range are connected to the sea and form a narrow and long topography along the coastline with barely any plains. Consequently, the region has many meteorological characteristics associated with oceanic climates, such as heavy rain and heavy snowfall during northeasterly currents. It also experiences warm winters and relatively cool summers for its latitude, so the annual temperature difference is relatively small (Gangwon Regional Meteorological Administration, 2011).
In West Gangwon, there is a gradual distribution of mountain ranges and basins to the west, plains are more developed than in East Gangwon, and springs from the Gwangju, Charyeong, and Sobaek Mountains gather to become the source of the Han River and other major rivers. Owing to its central inland location, West Gangwon has characteristics closer to a continental climate, with less precipitation than East Gangwon (Gangwon Regional Meteorological Administration, 2011).
Changes in O3 can be clearly observed in Gangwon Province depending on the region when diverse variables are considered, such as meteorological conditions and air pollutant emission concentrations. Accordingly, to compare East Gangwon and West Gangwon centered around the Taebaek Mountains, this study selected Gangneung-si (East Gangwon) and Wonju-si (West Gangwon) as the monitoring sites (Figure 1). From the monitoring network, measurement data from Okcheon-dong [2179 Gyeonggang-ro, Gangneung-si, Gangwon-do (37°45′36.6″N 128°54′10.6″E)] were used for East Gangwon and measurement data from Myeongnyun-dong [171 Dangu-ro, Wonju-si, Gangwon-do (37°21′12.6″N 127°56′54.7″E)] for West Gangwon.
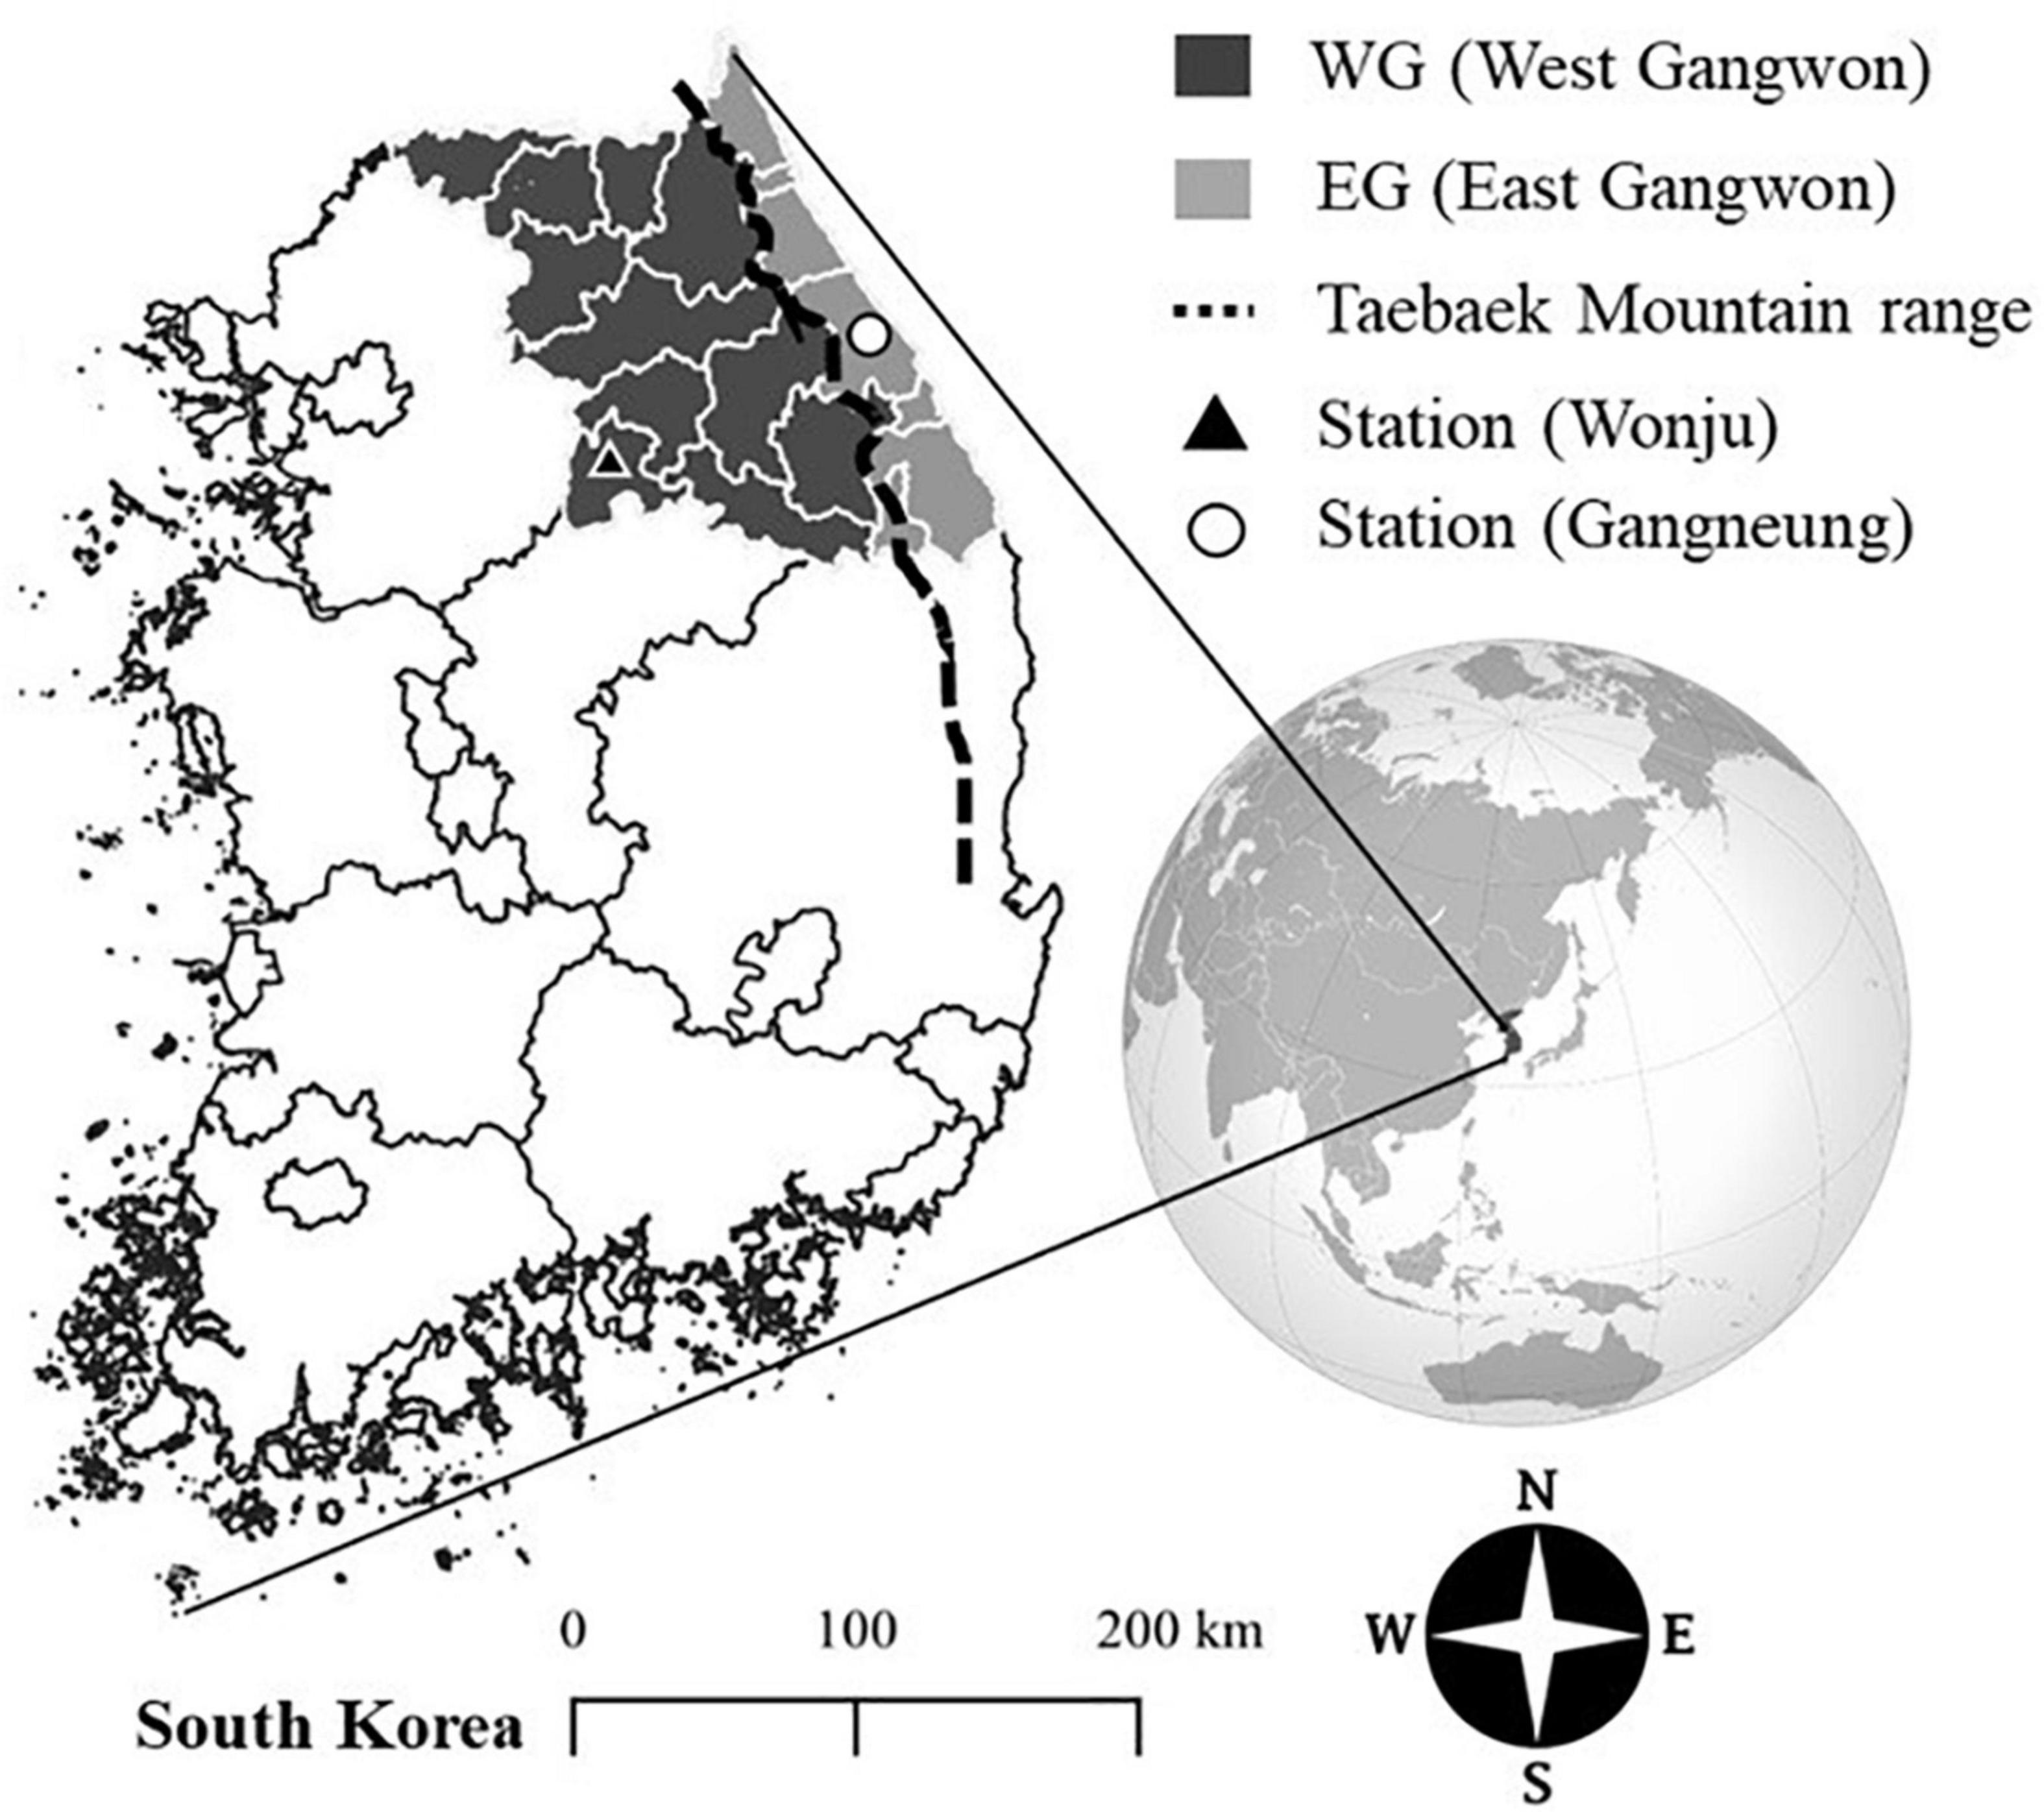
Figure 1. Monitoring sites (East Gangwon, West Gangwon).
Database and data processing
Since 2021, the public website Air Korea has provided real-time air pollution information for South Korea consisting of air quality standard data measured from 600 urban atmospheric monitoring networks installed in 228 cities and counties nationwide, roadside atmospheric monitoring networks, national baseline concentration monitoring networks, suburban atmospheric monitoring networks, and port atmospheric monitoring networks. In this study, national data that conducted QA/QC according to Korea’s air pollution measurement network operating guidelines were used, and a total of two urban air measurement stations were used, one each in Gangneung and Wonju.
The measurement methods of each air quality standard item vary; O3 is measured hourly and daily using the UV photometric method. Observational data from nationwide air-quality monitoring stations were collected and converted to the maximum daily 8 h ozone average (MDA8O3). To calculate MDA8O3 for a given calendar day, we selected the highest value among 24 possible 8 h rolling mean concentrations from the hourly ozone data observed at each station. If >25% of hourly data for a given day were not valid, MDA8O3 was not calculated for those days and was excluded from further analysis. Yearly MDA8O3 averages were calculated from daily values. This study used hourly O3 measurements from January 2001 to December 2018 from the urban atmospheric monitoring networks and calculated the annual and monthly average O3 concentrations based on 8 hours during the daytime (9:00 to 17:00), when photosynthesis is active.
To analyze the O3 concentrations according to meteorological factors and primary pollutants, this study used public national data on nitrogen dioxide (NO2) concentrations and meteorological factors, including average temperature, average relative humidity, average wind speed, average cloud cover, and daily total insolation. As daily total insolation is a major factor affecting the O3 concentrations according to photochemical reactions (Massambani and Andrade, 1994; Ellis et al., 2000; Kumar et al., 2010), this study analyzed its correlation using meteorological data from the same regions as the O3 monitoring stations.
Ozone exposure indices
Two indices for analyzing the long-term effects of O3 exposure on vegetation (e.g., crops and trees) are AOT40, which is mainly used in Europe, and SUM60, which is mainly used in the US (Tong et al., 2009). AOT40 and SUM60 are similar evaluation measures, but in the case of AOT40, experimental data on trees or crops exist. In this study, AOT40 was used to determine the biological relevance according to the O3 concentration.
AOT40 refers to the accumulated quantity of O3 exceeding a concentration of 40 ppb in a specific period. Studies have reported that forest production declines by over 10% when the AOT40 value from April to September, the growth period of trees, exceeds 10,000 ppbh, which was defined as the O3 critical level for forests (Loibl et al., 2004; Kohno et al., 2005). Deciduous tree species, such as ash (Fraxinus excelsior) and black alder (Alnus glutinosa), have higher sensitivity to O3 (Ozolincius et al., 2005), and based on the O3 exposure index, a study showed that the growth of beech (Fagus sylvatica) considerably decreased when AOT40 exceeded 10,000 ppbh (Braun and Flückiger, 1995). Given that vegetation mainly absorbs O3 during the daytime when the stomata are open, only the period when solar radiation energy exceeds 50 W/m2 should be considered when calculating AOT40 (World Health Organization [WHO], 2000). As such, to calculate AOT40, this study extracted only O3 concentrations of 40 ppb or higher during 8 h in the daytime (9:00 to 17:00) from the hourly O3 concentration measurement data from 1 January 2001 to 31 December 2018. Additionally, the daily averages were calculated and AOT40 of East Gangwon and West Gangwon was obtained using the accumulated sum of 6 months (180 days). For 2001, data for calculating AOT40 were available starting from July. The changes in AOT40 by year were observed by dividing the research period into 2001–2008 and 2009–2018. This divide was chosen because O3 concentrations surged in 2009.
Results and discussion
Comparison of ozone concentrations in East Gangwon and West Gangwon
Figure 2 compared yearly atmospheric O3 concentrations in East Gangwon and West Gangwon from 2001 to 2018 and South Korea’s O3 air quality standard of 60 ppb is indicated by the dotted line. Owing to the absence of measurement data for 2007 in East Gangwon, we could not confirm measurement data from April to June, when high O3 concentrations are expected, so this period was excluded from the study. The average O3 concentration over 18 years was confirmed to be higher in West Gangwon (32.63 ppb) than in East Gangwon (29.85 ppb). The average annual O3 concentration was highest in 2009 (35.18 and 34.00 ppb in East Gangwon and West Gangwon, respectively; Supplementary Table 1). The average O3 concentrations in East Gangwon and West Gangwon were 30.10 ± 2.77 and 30.73 ± 2.32 ppb from 2001 to 2008 and 32.75 ± 2.83 and 34.65 ± 2.27 from 2009 to 2018, respectively, indicating that the O3 concentrations rose in both regions from 2009.
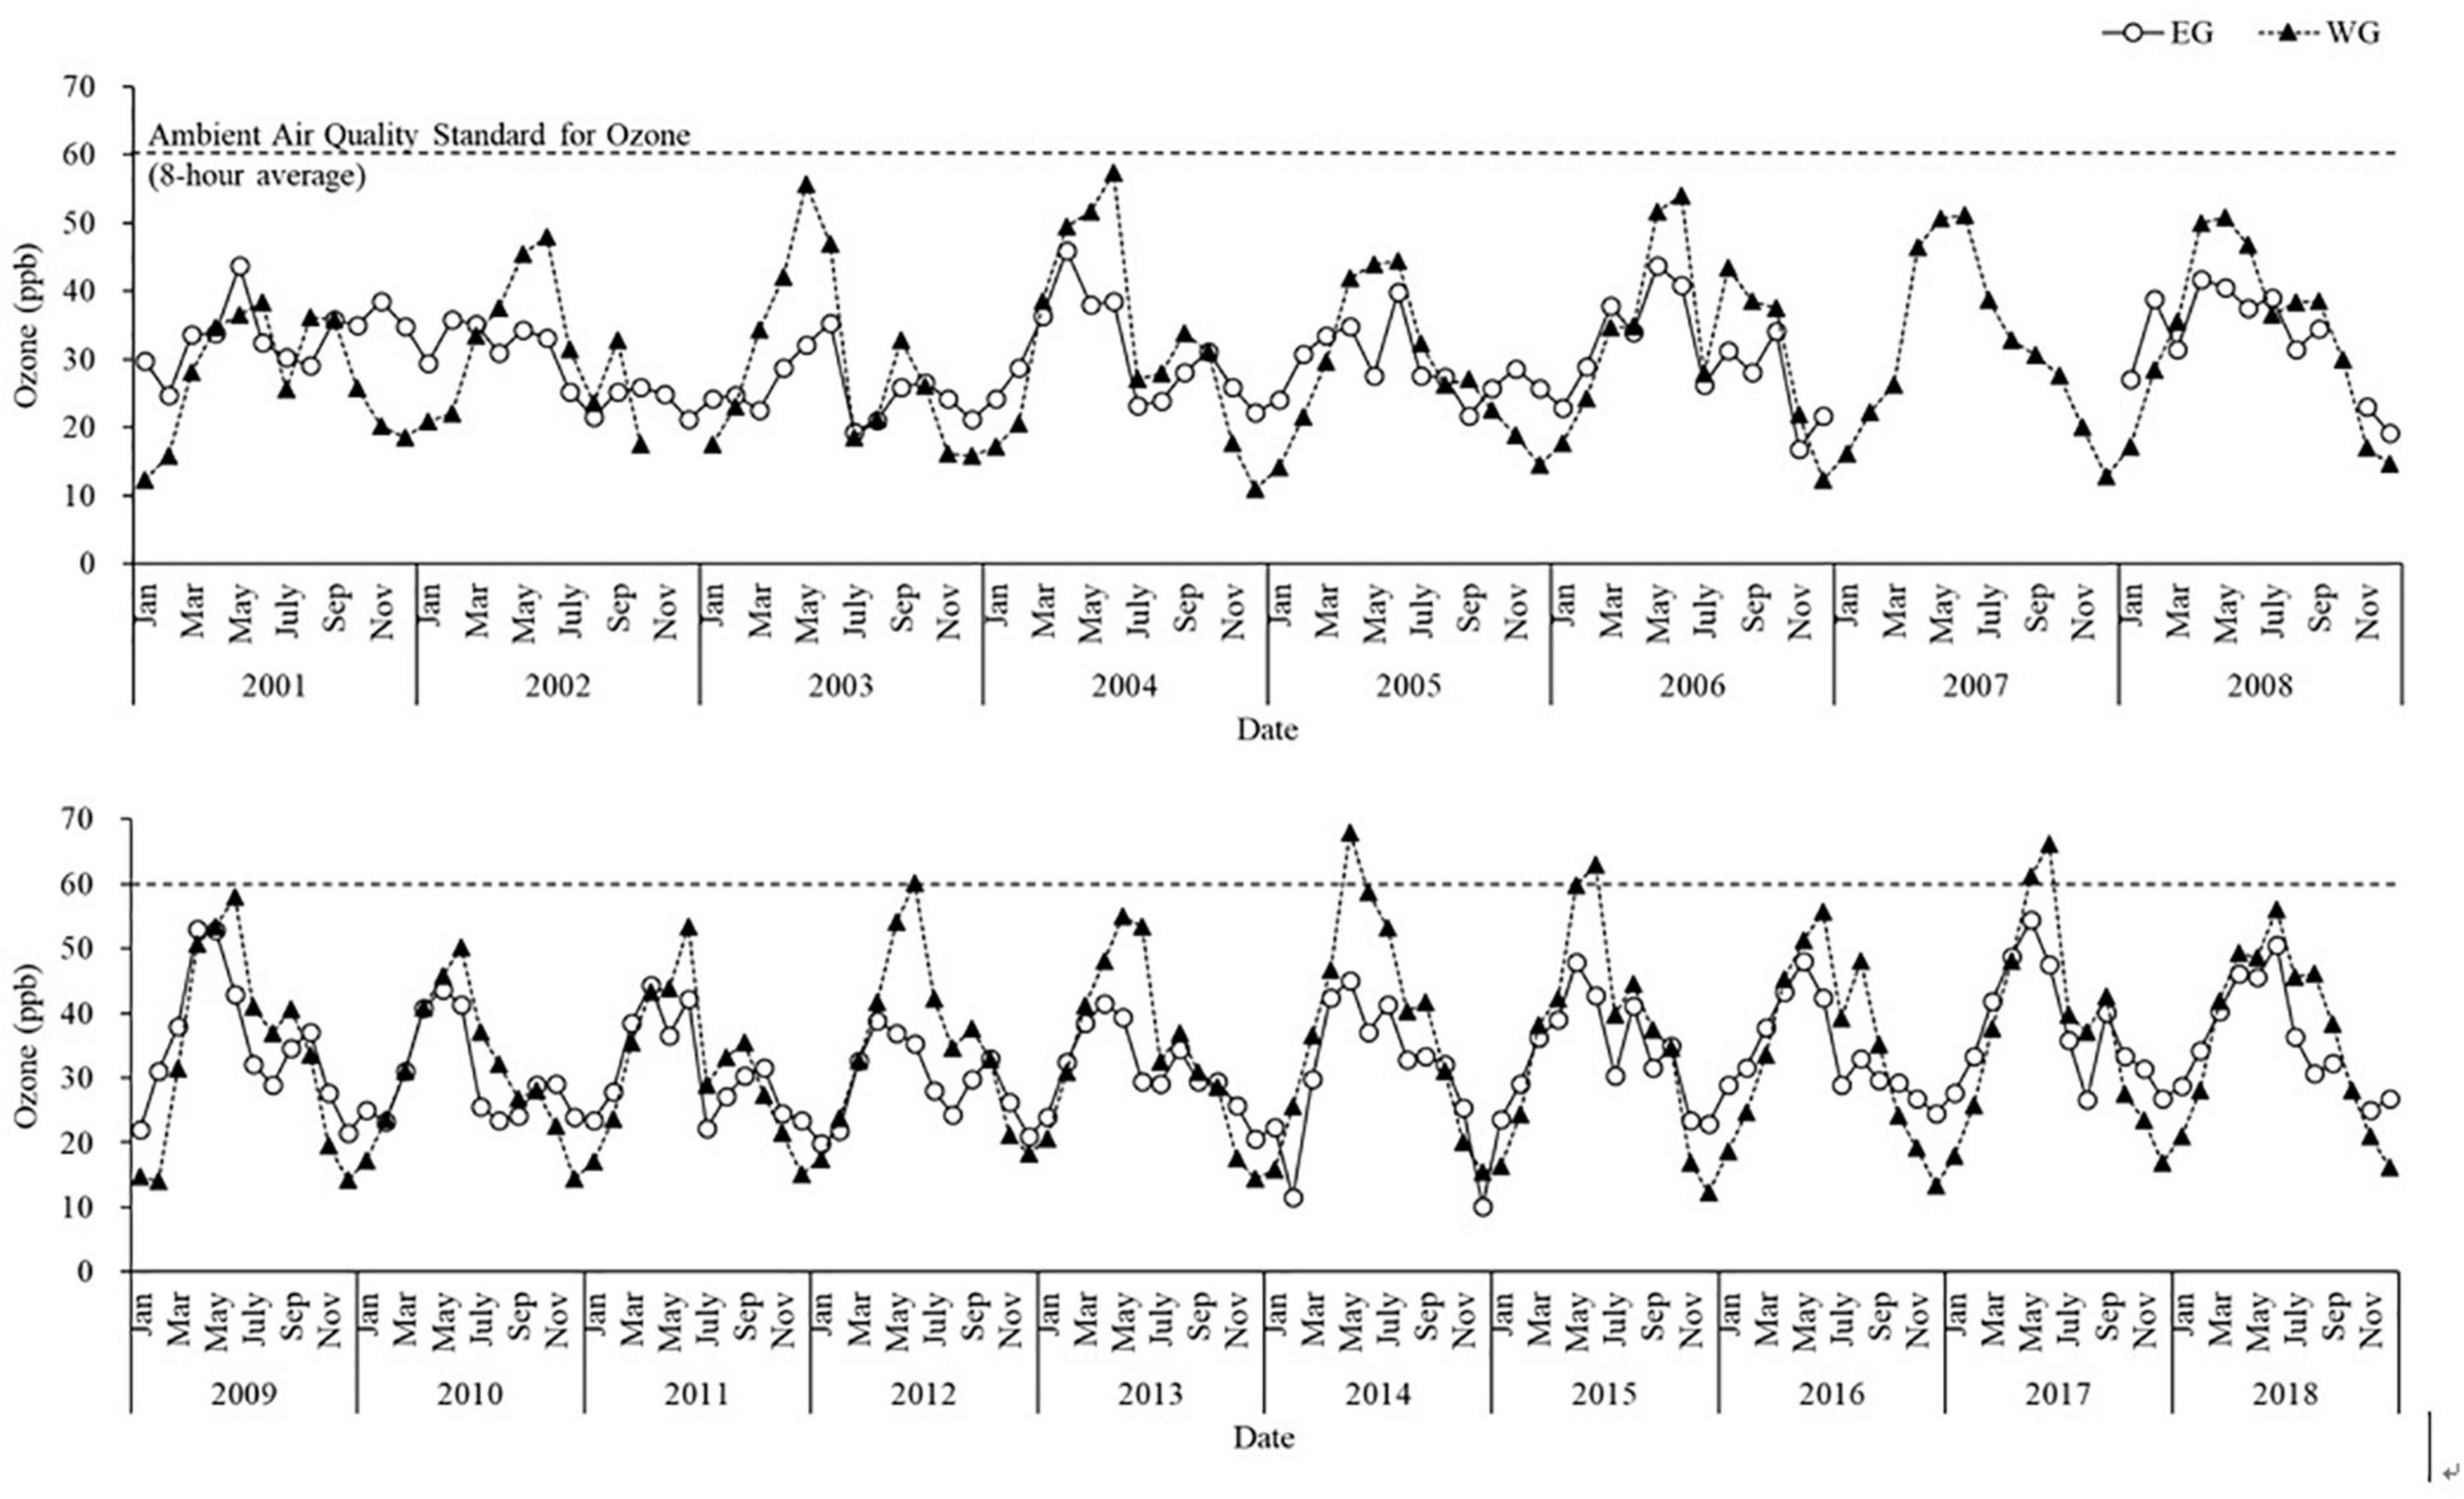
Figure 2. Changes in average O3 concentration from 2001 to 2018.
According to a comparison of the average monthly O3 concentrations in the two regions by year, the highest in East Gangwon was 54.48 ppb, measured in May 2017 and the highest in West Gangwon was 67.87 ppb, measured in May 2014. In terms of the maximum average monthly O3 concentrations per year from 2001 to 2018, in East Gangwon, maximum concentrations were observed once in February, six times in April, seven times in May, and three times in June, indicating that O3 concentrations frequently peaked in April and May. In West Gangwon, maximum concentrations were observed four times in May and 14 times in June, indicating that O3 generation peaked in May and June (Supplementary Table 1).
To clearly observe the changes in O3 concentration from 2001 to 2018, the period was divided into two (2001–2008 and 2009–2018). The overall O3 concentration rose more from 2009 to 2018 than from 2001 to 2008 in both regions, though O3 concentrations declined from December to February from 2009 to 2018 (Figure 3). East Gangwon showed the largest increase in April–May, whereas West Gangwon showed the largest increase in June–July. West Gangwon showed higher monthly average O3 concentrations than East Gangwon and tended to show higher concentrations from April–September, when the meteorological conditions for high O3 concentration were met. In contrast, from October–March, East Gangwon showed higher O3 concentrations than West Gangwon. This is likely because the average winter temperature in East Gangwon is higher than that in West Gangwon, providing better conditions for the generation of O3 (Gangwon Province, 2022).
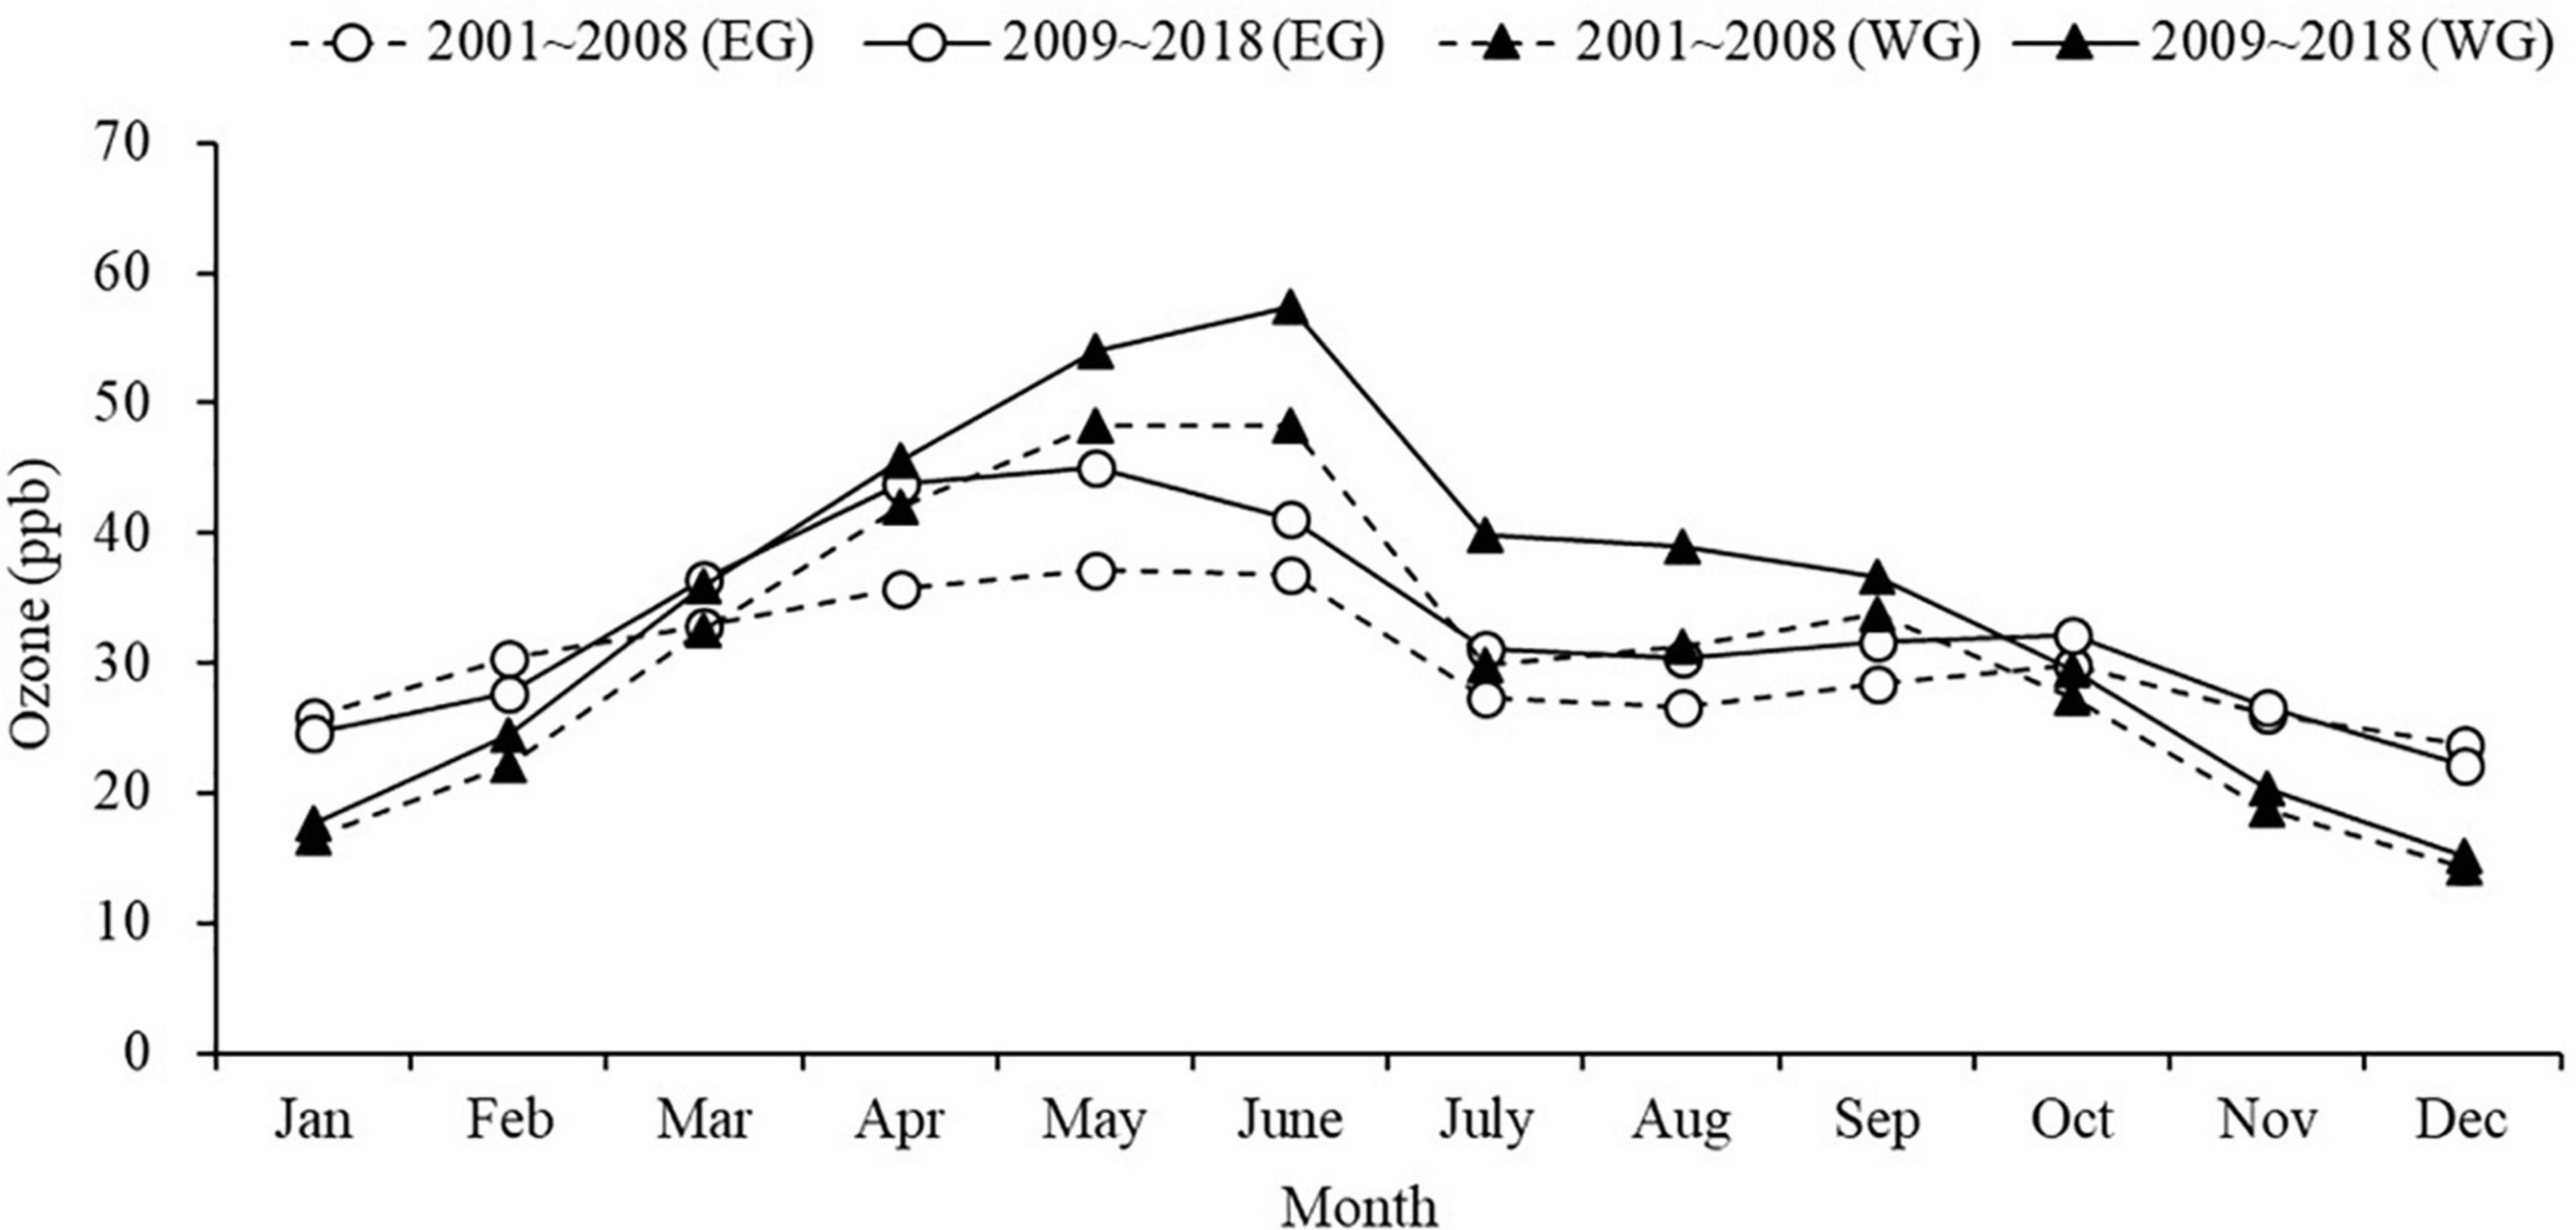
Figure 3. Monthly average O3 concentrations from 2001 to 2008 and 2009 to 2018 in East Gangwon and West Gangwon.
Changes in ozone concentration according to meteorological factors and air pollutants
Meteorological factors
Ozone is a secondary pollutant generated from the photochemical reactions of primary pollutants in the atmosphere. Therefore, insolation, which is directly related to the photochemical reactions, is a major meteorological factor affecting O3 generation. General linear regression analysis between insolation and O3 in East Gangwon and West Gangwon achieved R2 of 0.61 (y1) and 0.84 (y2), respectively (Figure 4). Insolation and O3 showed a positive correlation in both regions; however, surface O3 was more influenced by insolation in West Gangwon than in East Gangwon, as high O3 concentrations of 60 ppb or more were generated as insolation increased. In general, O3 is actively generated and deposited in a stable atmosphere (Jacob et al., 1992; Helmig et al., 2008, 2012; Xing et al., 2017; Karle et al., 2020). In East Gangwon, a regional meteorological phenomenon occurs in which a continuous wind current in the central inland region crosses the Taebaek Mountains and reaches East Gangwon, forming a temperature inversion layer on the downwind side and producing dry strong winds (Lee, 2003). Therefore, the relatively low R2 between insolation and O3 in East Gangwon despite the identical insolation can be attributed to the reduced generation of O3. Accordingly, given that East Gangwon and West Gangwon in Gangwon Province have different climatic characteristics, including average temperature, average wind speed, and insolation owing to the Taebaek Mountains’ unique geographical characteristics, O3 management measures should consider individual microclimate (Gangwon Province, 2022).
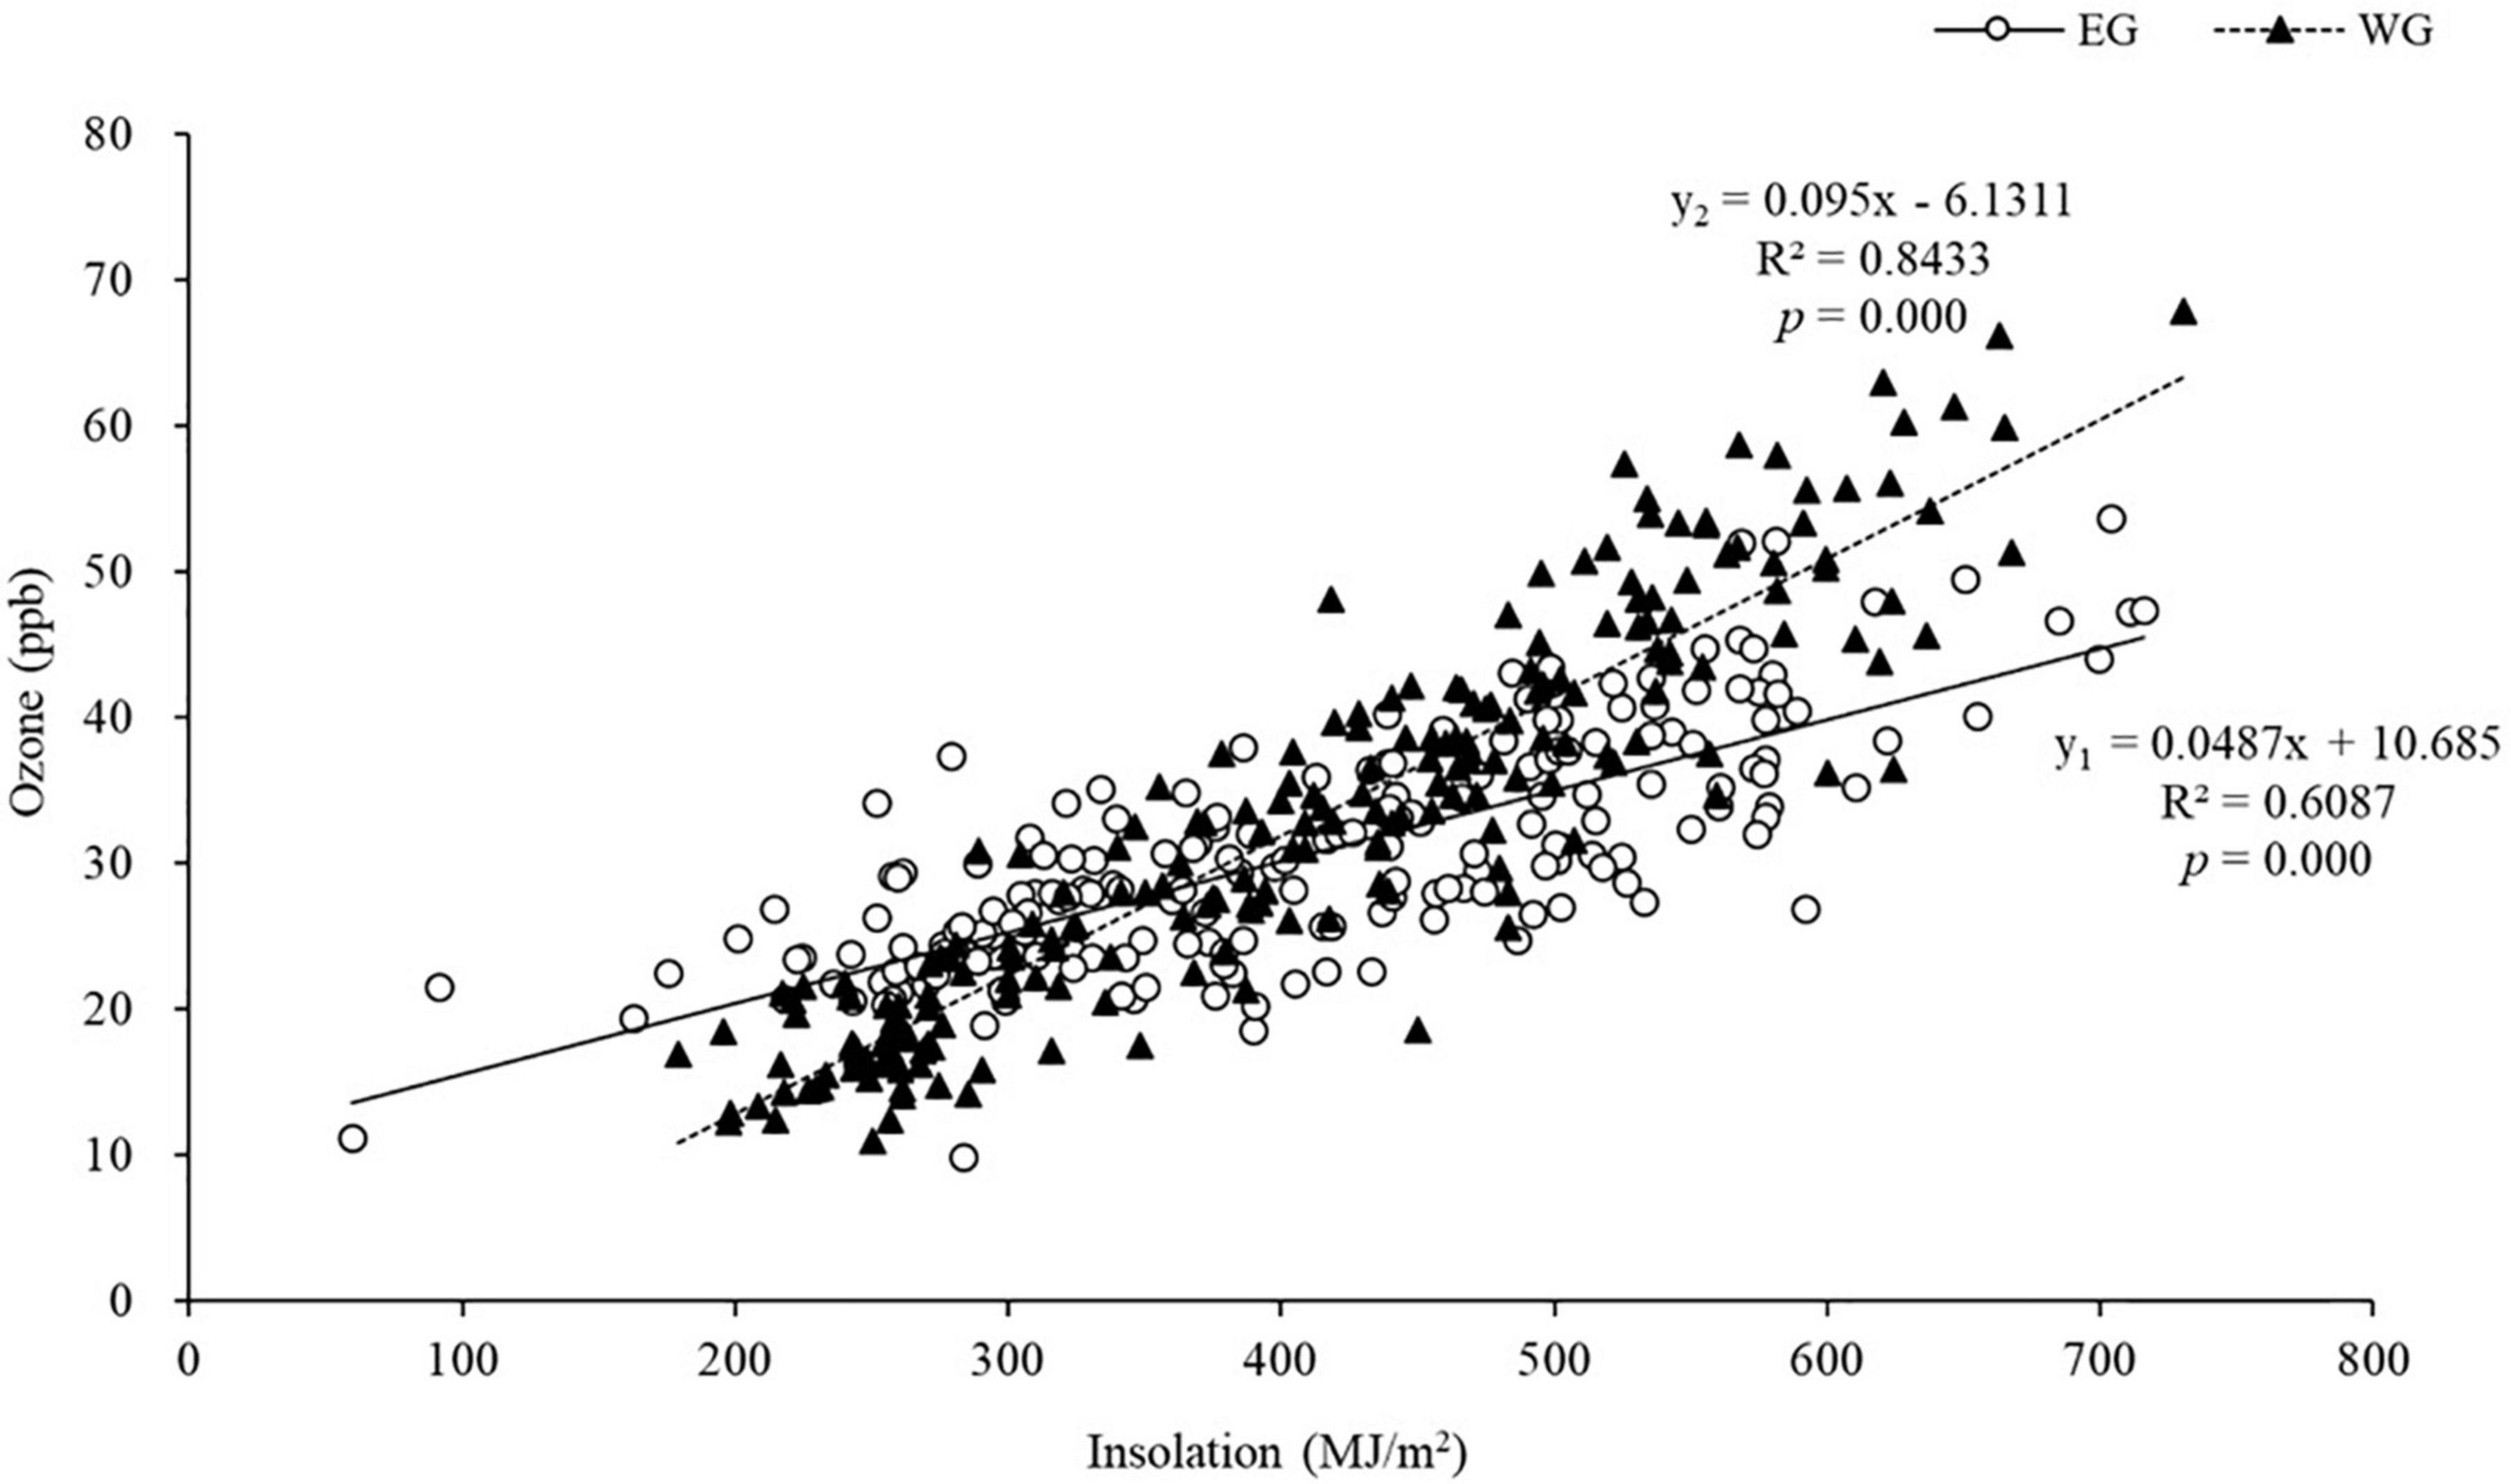
Figure 4. Changes in O3 concentration according to daily total insolation.
Air pollutants
Nitrogen oxides are a major determinant of atmospheric O3 concentrations (Grewe et al., 2012; He et al., 2013). In West Gangwon, there was a negative correlation between NO2 and O3, which can be explained by seasonal effects and the effects of VOCs-limited regime in the heavily polluted urban areas (National Research Council, 1992). In West Gangwon, from April to June, O3 concentrations were high and NO2 concentrations were low, with O3 then decreasing from July and NO2 increasing from September (Figure 6). During July and August at the monitoring sites, intensive rainfall occurred and insolation decreased, whereas insolation was highest from April to June (Isaksen et al., 1978). As insolation rises owing to seasonal factors, solar radiation increases, photochemical reactions become active, NO2 is converted to O3, and the concentration of atmospheric NO2 declines (Yienger et al., 1999; Liu and Shi, 2021), whereas that of O3 rises (Sillman, 1999; Yienger et al., 1999; Chang et al., 2017). In addition, unlike other air pollutants, O3 has non-linear efficiency, so the reduction of NOx can exacerbate O3 in the short term. As O3 concentrations change according to the ratio of atmospheric VOCs and NOx (Sillman and He, 2002; Jeon et al., 2017), it is important to control NOx and VOCs to reduce O3 concentrations. Generally, regions with a VOCs/NOx ratio of 6 or less are classified as VOCs-limited regions, which applies to large cities with heavy traffic such as Seoul, Busan, and Wonju. Researchers have reported that in Seoul, NOx is already saturated and VOCs act as a limiting factor for O3 generation (Korean Statistical Information Service, 2022a). Therefore, in large cities with high NOx emissions, control of VOCs is necessary for the effective integrated management of O3.
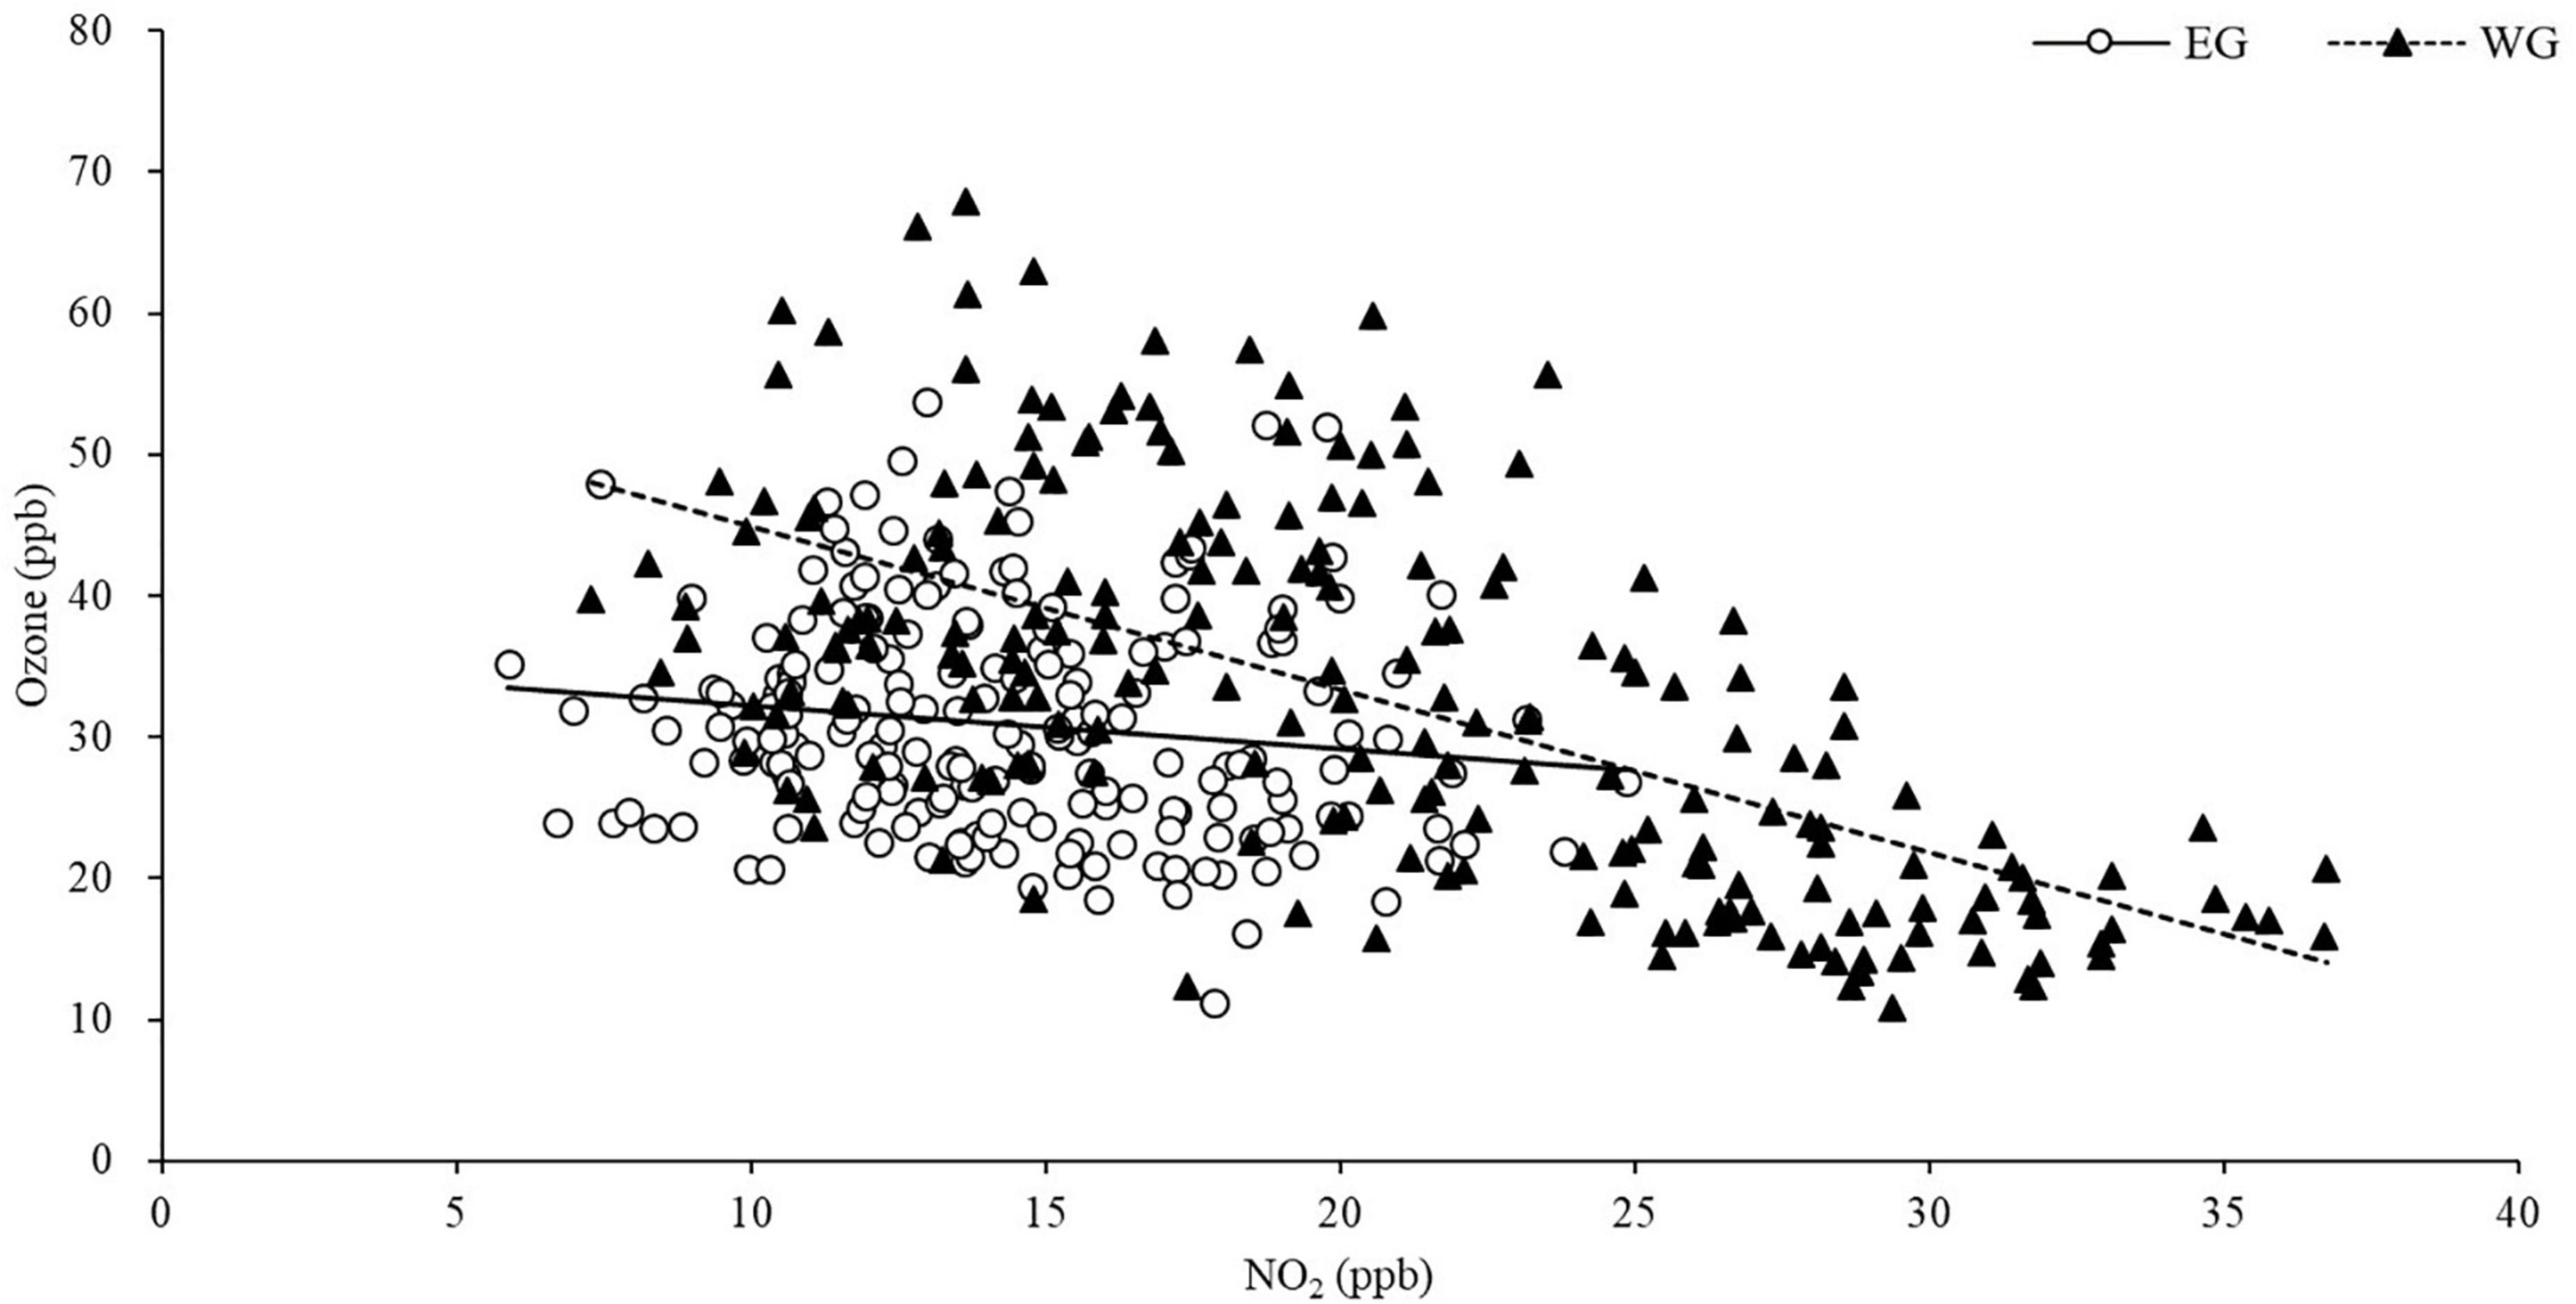
Figure 5. Changes in O3 concentration according to NO2.
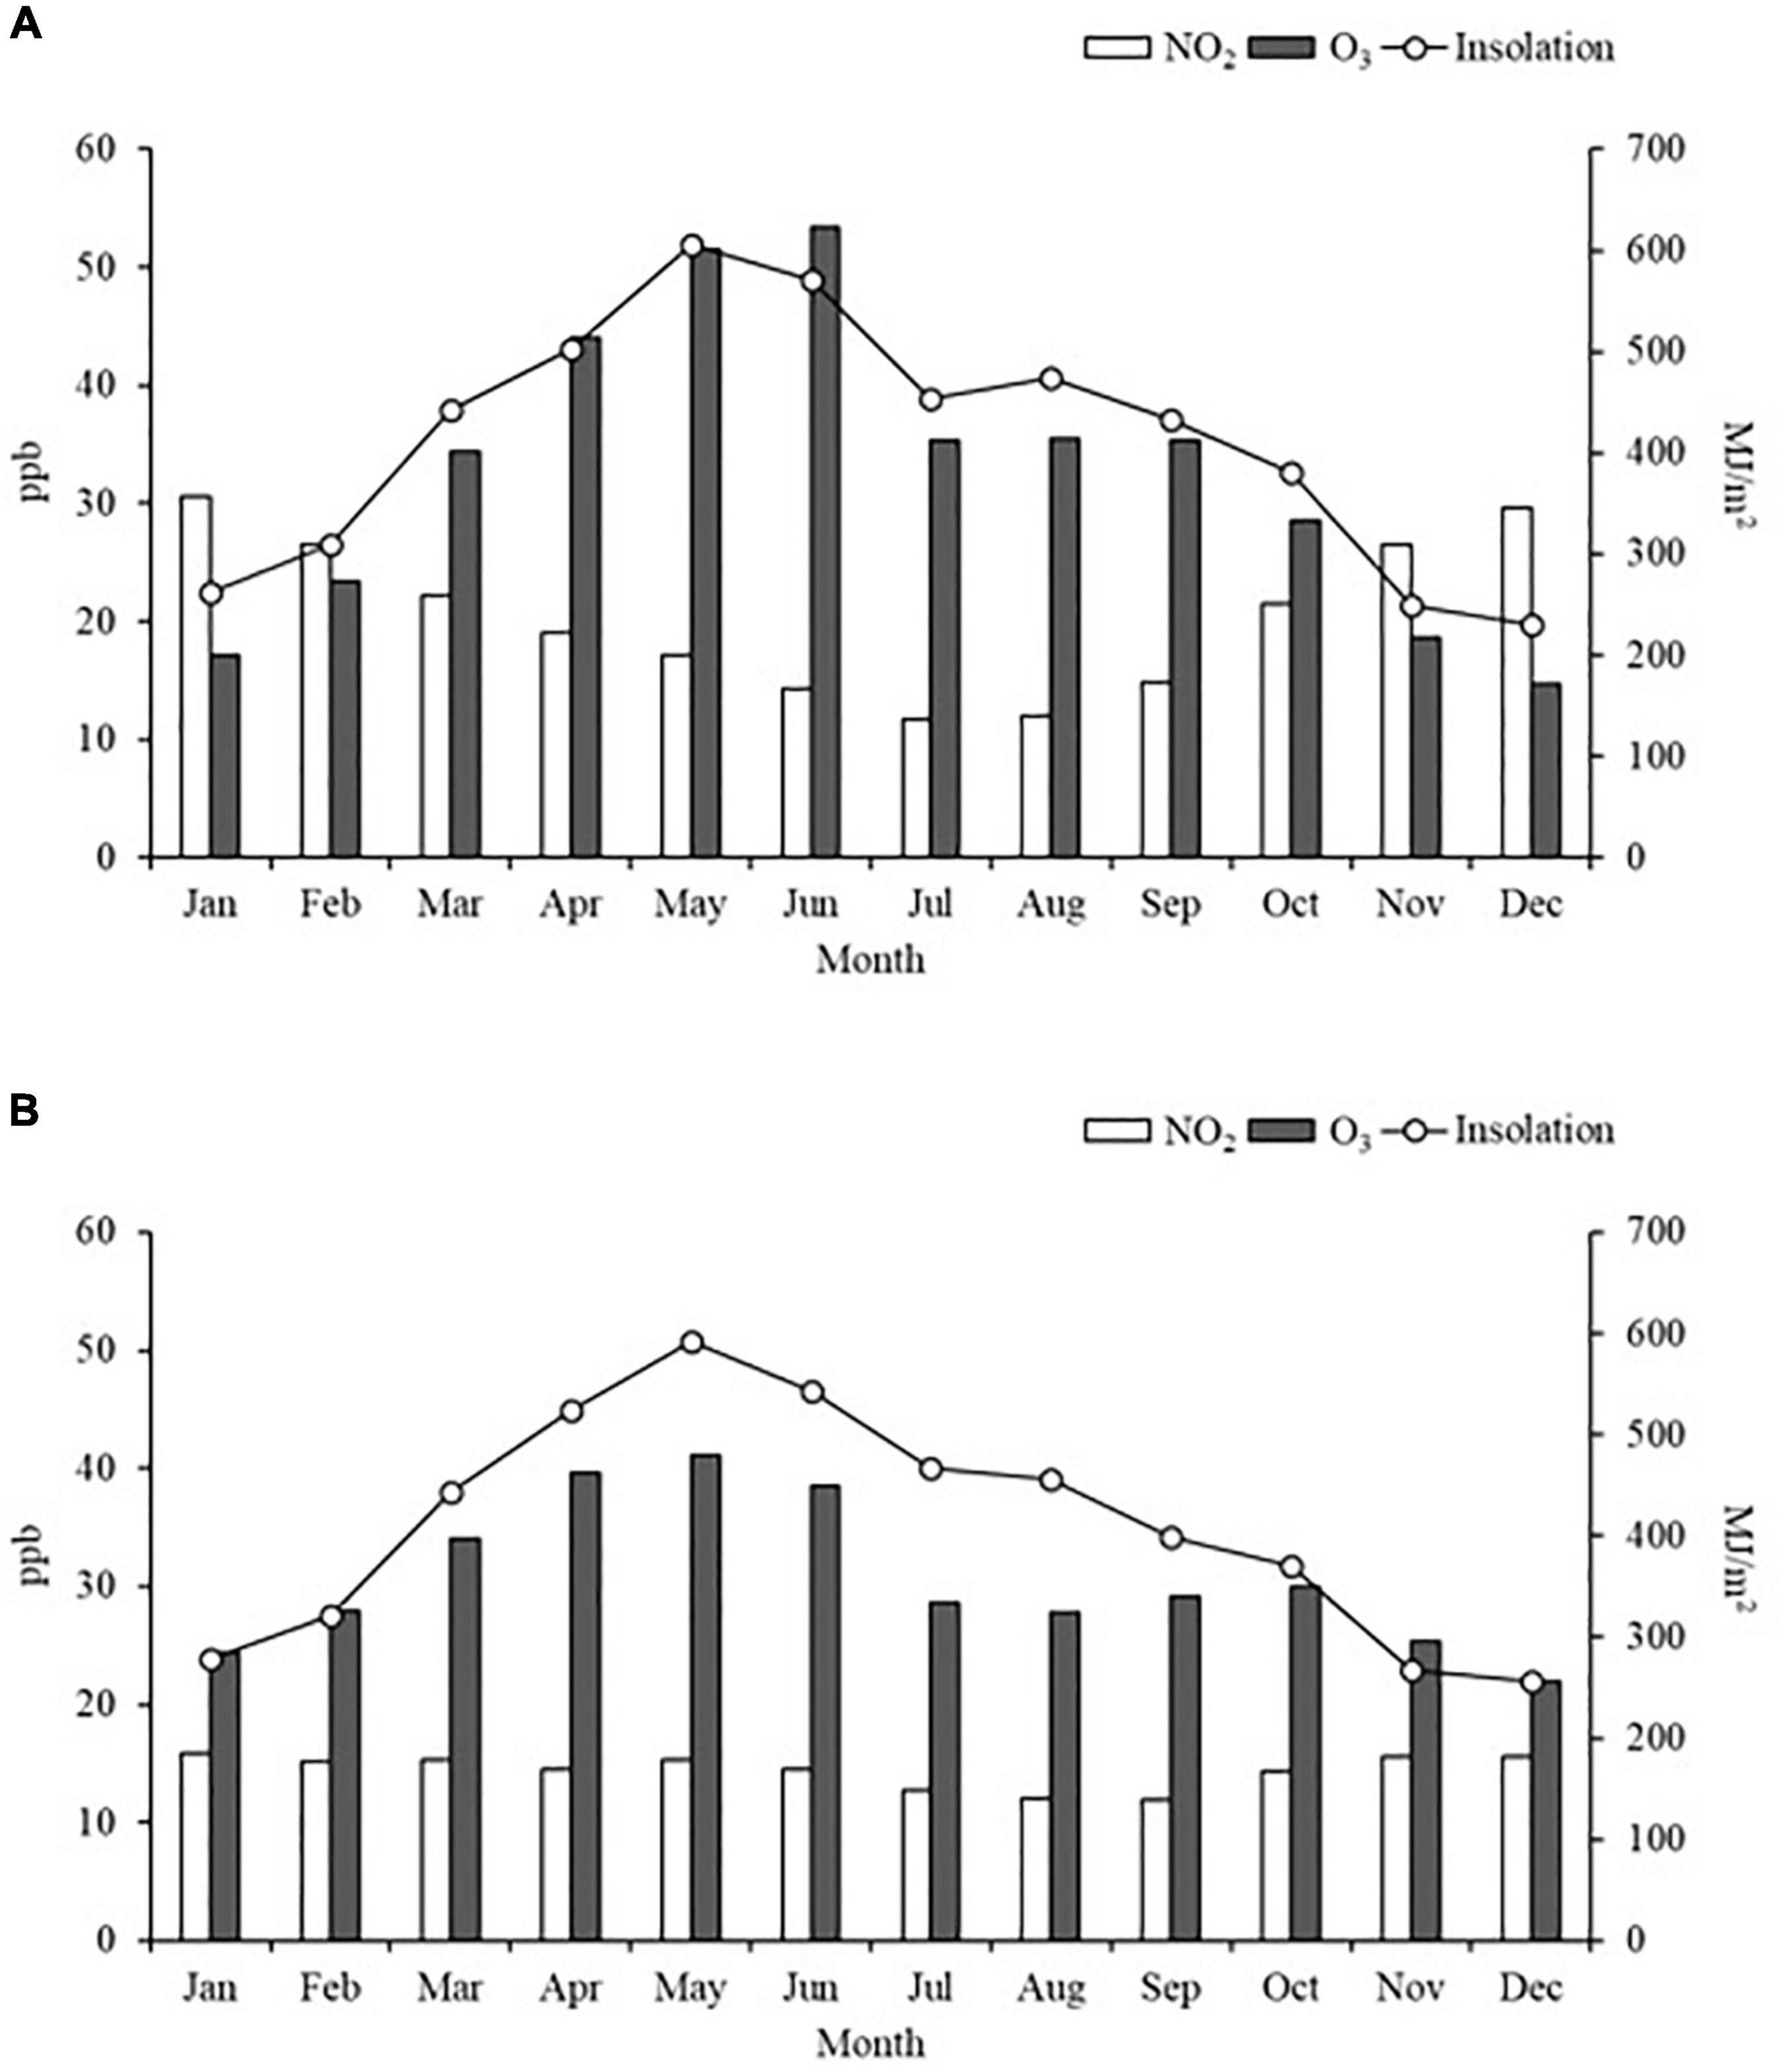
Figure 6. Monthly average NO2 and O3 concentrations and insolation from 2001 to 2018: (A) West Gangwon; (B) East Gangwon.
In contrast, NO2 concentrations throughout the year were lower in East Gangwon than in West Gangwon, and there were no large differences by month (Figure 6B). In this regard, as East Gangwon has a smaller population [as of 2021: East Gangwon 215,322 and West Gangwon 361,056 (Korean Statistical Information Service, 2022a)], traffic volume [registered vehicles as of 2022: East Gangwon 115,464 and West Gangwon 186,896 (Korea Industrial Complex Corporation, 2022)], and industrial complex size (total area of general industrial complexes as of 2015: East Gangwon 2.144 km2 and West Gangwon 2.198 km2) (Matsumura, 1997), NO2 emissions from non-point and point sources were lower than those in West Gangwon. Figures 4, 5 show that in East Gangwon, changes in O3 concentration were barely influenced by NO2 and were mainly influenced by meteorological factors, such as insolation. In East Gangwon, the atmospheric NO2 concentration is low and the atmosphere is unstable owing to its topographical features. Hence, East Gangwon had lower O3 concentrations from April to June and smaller fluctuations in O3 throughout the year than West Gangwon (Figure 6B). On the other hand, East Gangwon had higher O3 concentrations from November to February than West Gangwon (Figure 6B).
Calculation of accumulated ozone exposure over a threshold of 40 ppb and impact assessment
When trees are exposed to high O3 concentrations over long periods, damage can occur, such as leaf necrosis, browning, and spots (Günthardt-Goerg and Vollenweider, 2007). If damage accumulates, tree growth can be inhibited and species diversity reduced, leading to a decline in forest productivity. Therefore, this study observed AOT40 in East Gangwon and West Gangwon based on AOT40 10,000 ppbh, the critical level for forests reported by WHO. In South Korea, high O3 concentrations of 40 ppb and higher occur from April to June and the AOT40 accumulated over the previous 6 months was highest from July to September (Figure 7). Figure 7 shows the changes in East Gangwon and West Gangwon by year for 6 months from April to September. AOT40 in both regions fluctuated every year according to pollution and meteorological conditions in the region but there were clear differences between East Gangwon and West Gangwon. The average AOT40 in West Gangwon over the 18 years (10,106 ppbh) was about twice that of East Gangwon (5,383 ppbh). In East Gangwon, the critical level was first exceeded in 2009 (September: 12,546 ppbh) and then decreased, but starting in 2012, it showed a steady increase every year. AOT40 exceeded the critical level from 2017 (September: 12,984 ppbh) to 2018 (September: 12,483 ppbh). In West Gangwon, AOT40 began to approach the critical level from 2002 and then exceeded the critical level from July to September every year from 2003 to 2018. AOT40 rose particularly quickly in 2009 (September: 19,039 ppbh) and peaked across the whole study period in 2014 (September: 23,804 ppbh). From 2014 to 2018 in West Gangwon, the average AOT40 in September was 20,714 ppbh, more than twice the critical level. This value is higher than the average AOT40 (19,600 ppbh) in summer in East Asia (Chang et al., 2017). As such, there is a greater concern in West Gangwon than in East Gangwon about declining forest productivity from long-term exposure to high surface O3 concentrations.
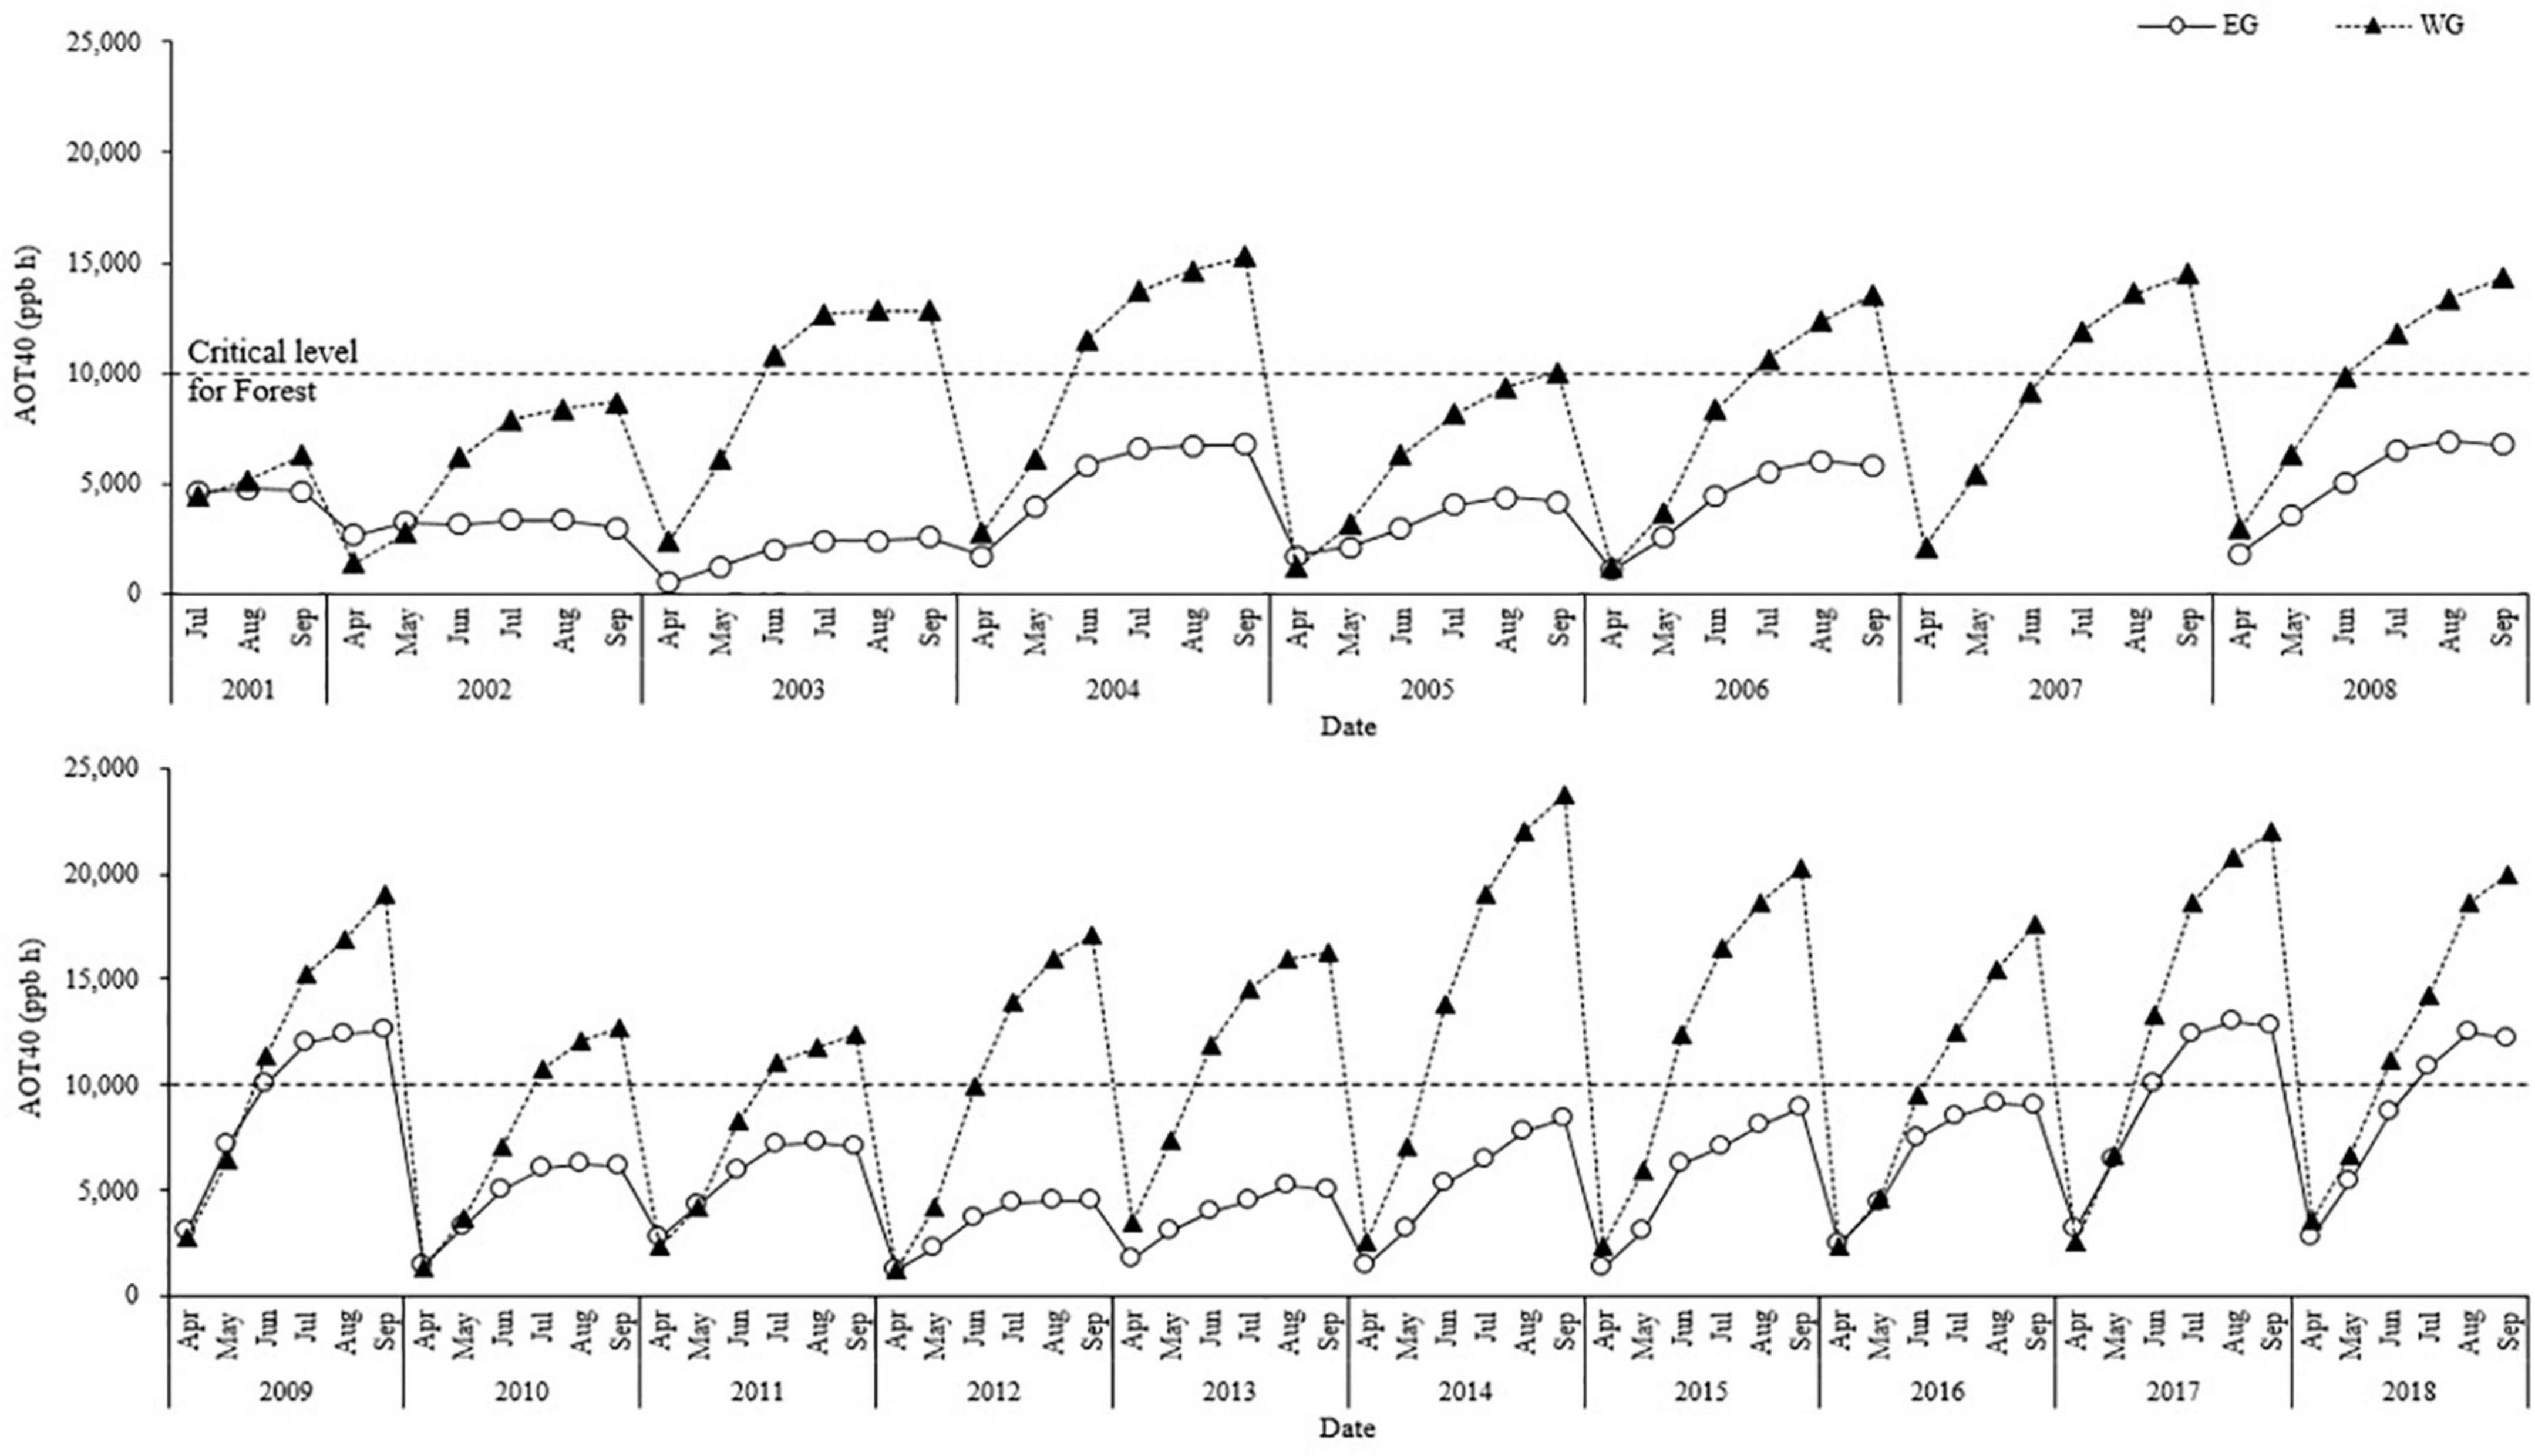
Figure 7. Changes in AOT40 values over 6 months by year in East Gangwon and West Gangwon.
Nevertheless, it is important to note that there is uncertainty regarding applying the AOT40 critical level, which was developed for Europe, in South Korea. Although this study matched the AOT40 calculation formula and critical level with the guidelines for Europe (World Health Organization [WHO], 2000), differences in forest biodiversity between Europe and East Asia and the air pollution tolerance index for each tree species lead to uncertainty in the assessment of O3 exposure in South Korea. In the neighboring country of Japan, based on a study on the O3 exposure of 16 representative native tree species (Izuta et al., 2001), researchers suggested that the AOT40 critical level for forest protection in Japan may range from 8,000 to 21,000 ppbh (Li et al., 2016). Moreover, owing to high background O3 concentration levels in East Asia (Sillman, 1999; Pochanart et al., 2002) and increased photosynthetic activity at lower latitudes compared with Europe, high O3 values from early spring to fall can influence forest damage (Chang et al., 2017).
Although there are limitations in applying AOT40 to South Korea owing to uncertainty, it is judged to be valuable as an index showing changes in atmospheric O3 concentrations. To set O3 concentration indices suitable for a specific region, there is a need for more research and long-term monitoring to identify the long-term effects of O3 concentrations.
Conclusion
West Gangwon showed substantially higher average O3 concentrations than East Gangwon, and in terms of maximum O3 concentrations, there were frequent occurrences of high O3 concentrations close to 60 ppb, the Korean O3 air quality standard. Both regions showed sharp increases in O3 concentrations in 2009 and long-term rising trends began from that year.
Insolation showed a positive correlation with O3, whereas NO2 showed a negative correlation. O3 concentrations increased as insolation increased in both regions but was less influenced by insolation in East Gangwon than in West Gangwon, even with identical insolation, owing to local meteorological phenomena, such as strong winds caused by the Taebaek Mountains. In West Gangwon, O3 and NO2 showed a completely inversely proportional relationship, which is attributed to seasonal effects and the fact that the region is VOCs-limited. Moreover, because East Gangwon has a lower population density, traffic volume, and industrial complex size than West Gangwon, NO2 concentration had a smaller influence. West Gangwon had a much higher AOT40 than East Gangwon. Although the critical level for forests (10,000 ppbh) was exceeded three times in East Gangwon (2009, 2017, and 2018), in West Gangwon, the AOT40 critical level was exceeded every year from 2003. Particularly, in West Gangwon, from 2014 to 2018, the average AOT40 in September was 20,714 ppbh, more than twice the critical level. As high O3 concentrations occurred more frequently and AOT40 values were much higher in West Gangwon than in East Gangwon, forests are expected to decline faster in West Gangwon.
Even within the same administrative zone of Gangwon Province, the O3 concentrations are not homogeneous owing to geographical features and climatic differences. As such, it is necessary to establish regional measures for managing O3. To examine the specific long-term effects of O3 on forests, it is necessary to conduct research to determine an AOT40 critical level appropriate for forest tree species in South Korea. Particularly, given that biotic factors and abiotic stresses are important factors in forest ecosystems, there is a need for research that considers diverse meteorological factors and tree stress factors in addition to air pollutants.
Data availability statement
The datasets presented in this study can be found in online repositories. The names of the repository/repositories and accession number(s) can be found below: www.airkorea.or.kr.
Author contributions
S-DL: supervision and writing—review and editing. M-JK: writing—original draft, investigation, and data curation. Both authors read and agreed to the final version of the manuscript.
Funding
This study was supported by the “Experts Training Graduate Program for Particulate Matter Management,” from the Ministry of Environment, Korea, and the Basic Science Research Program through the National Research Foundation of Korea (NRF) funded by the Ministry of Education (NRF-2021R1F1A1062524).
Conflict of interest
The authors declare that the research was conducted in the absence of any commercial or financial relationships that could be construed as a potential conflict of interest.
Publisher’s note
All claims expressed in this article are solely those of the authors and do not necessarily represent those of their affiliated organizations, or those of the publisher, the editors and the reviewers. Any product that may be evaluated in this article, or claim that may be made by its manufacturer, is not guaranteed or endorsed by the publisher.
Supplementary material
The Supplementary Material for this article can be found online at: https://www.frontiersin.org/articles/10.3389/ffgc.2022.996859/full#supplementary-material
References
Air Korea (2022). Available online at: https://www.airkorea.or.kr/eng/O3Alert?pMENU_NO=162 (Accessed on August, 13 2022).
Ashmore, M. R. (2005). Assessing the future global impacts of ozone on vegetation. Plant Cell Environ. 28, 949–964. doi: 10.1111/j.1365-3040.2005.01341.x
Braun, S., and Flückiger, W. (1995). Effects of ambient ozone on seedlings of Fagus sylvatica L. and Picea abies (L.) Karst. New Phytol. 129, 33–44. doi: 10.1111/j.1469-8137.1995.tb03007.x
Chang, K.-L., Petropavlovskikh, I., Cooper, O. R., Schultz, M. G., Wang, T., Helmig, D., et al. (2017). Regional trend analysis of surface ozone observations from monitoring networks in eastern North America, Europe and East Asia. Elem. Sci. Anthropocene 5:50. doi: 10.1525/elementa.243
Ellis, A. W., Hildebrandt, M. L., Thomas, W. M., and Fernando, H. (2000). Analysis of the climatic mechanisms contributing to the summertime transport of lower atmospheric ozone across metropolitan Phoenix, Arizona, USA. Clim. Res. 15, 13–31. doi: 10.3354/cr015013
Ferretti, M., Alianiello, F., Amoriello, T., Amorini, E., Buffoni, A., Bussotti, F., et al. (2003). Assessment of Ozone Exposure and Effects on Forest Vegetation Through Routine Monitoring Programmes-A Risk Analysis in Italy. Raleigh, NC: Swedish Water And Air Pollution Research Laboratory-Publications-IVL B, 351–362.
Fiala, J., Cernikovsky, L., de Leeuw, F., and Kurfuerst, P. (2003). Air Pollution by Ozone in Europe in Summer 2003. Overview of Exceedances of EC Ozone Threshold Values During the Summer Season April–August 2003. Copenhagen: European Environment Agency, 33.
Gangwon Province (2022). Available online at: https://www.provin.gangwon.kr/gw/eng/sub01_03_02 (Accessed on August, 13 2022).
Gangwon Regional Meteorological Administration (2011). Regional Climate Change Report. Gangwon: Gangwon Regional Meteorological Administration Press.
Grewe, V., Dahlmann, K., Matthes, S., and Steinbrecht, W. (2012). Attributing ozone to NOx emissions: Implications for climate mitigation measures. Atmos. Environ. 59, 102–107. doi: 10.1016/j.atmosenv.2012.05.002
Günthardt-Goerg, M. S., and Vollenweider, P. (2007). Linking stress with macroscopic and microscopic leaf response in trees: new diagnostic perspectives. Environ. Pollut. 147, 467–488. doi: 10.1016/j.envpol.2006.08.033
He, H., Hembeck, L., Hosley, K. M., Canty, T. P., Salawitch, R. J., and Dickerson, R. R. (2013). High ozone concentrations on hot days: The role of electric power demand and NOx emissions. Geophys. Res. Lett. 40, 5291–5294. doi: 10.1002/grl.50967
Helmig, D., Boylan, P., Johnson, B., Oltmans, S., Fairall, C., Staebler, R., et al. (2012). Ozone dynamics and snow-atmosphere exchanges during ozone depletion events at Barrow, Alaska. J. Geophys. Res. 117:15. doi: 10.1029/2012JD017531
Helmig, D., Johnson, B., Oltmans, S. J., Neff, W., Eisele, F., and Davis, D. D. (2008). Elevated ozone in the boundary layer at South Pole. Atmos. Environ. 42, 2788–2803. doi: 10.1016/j.atmosenv.2006.12.032
Isaksen, I. S. A., Hov, O., and Hesstvedt, E. (1978). Ozone generation over rural areas. Environ. Sci. Technol. 12, 1279–1284. doi: 10.1021/es60147a011
Izuta, T., Matsumura, H., Kohno, Y., and Shimizu, H. (2001). Experimental studies on the effects of ozone on forest tree species. Taiki Kankyo Gakkaishi 36, 60–77. doi: 10.11298/taiki1995.36.2_60
Jacob, D. J., Fan, S.-M., Wofsy, S. C., Spiro, P. A., Bakwin, P. S., Ritter, J. A., et al. (1992). Deposition of ozone to tundra. J. Geophys. Res. 97, 16473–16479. doi: 10.1029/91JD02696
Jeon, E. M., Cho, H. S., Kim, Y. J., Kwon, E. H., Seo, K. S., Gwon, M. H., et al. (2017). Statistical quality assurance and quality control methods for volatile organic compounds and their major emission sources. Seoul Metropolitan Government. Inst. Health Environ. Rep. 53, 168–177.
Karle, N. N., Mahmud, S., Sakai, R. K., Fitzgerald, R. M., Morris, V. R., and Stockwell, W. R. (2020). Investigation of the successive ozone episodes in the El Paso–Juarez region in the summer of 2017. Atmosphere 11:532. doi: 10.3390/atmos11050532
Kohno, Y., Matsumura, H., Ishii, T., and Izuta, T. (2005). “Establishing critical levels of air pollutants for protecting East Asian vegetation—A challenge,” in Plant Responses to Air Pollution and Global Change, eds K. Omasa, I. Nouchi, and L. J. De Kok (Berlin: Springer), 243–250.
Korea Forest Service Home (2022). Available online at: https://english.forest.go.kr/kfsweb/kfi/kfs/cms/cmsView.do?cmsId=FC_001679&mn=UENG_01_03 (Accessed on April, 15 2022).
Korea Industrial Complex Corporation (2022). Overview of Korean Industrial Complexes: Gangwon-do. Daegu: Korea Industrial Complex Corporation.
Korean Statistical Information Service (2022a). Available online at: https://kosis.kr/statHtml/statHtml.do?orgId=211&tblId=DT_211N_B00100&conn_path=I2 (Accessed on April, 26 2022).
Korean Statistical Information Service (2022b). Available online at: https://kosis.kr/statHtml/statHtml.do?orgId=116&tblId=DT_MLTM_5498&conn_path=I2 (Accessed on April, 26 2022).
Krupa, S. V., and Manning, W. J. (1988). Atmospheric ozone: Formation and effects on vegetation. Environ. Pollut. 50, 101–137. doi: 10.1016/0269-7491(88)90187-x
Kumar, R., Naja, M., Venkataramani, S., and Wild, O. (2010). Variations in surface ozone at Nainital: A high-altitude site in the central Himalayas. J. Geophys. Res. 115:D16302. doi: 10.1029/2009JD013715
Lee, J. G. (2003). A numerical study of the orographic effect of the Taebak mountains on the increase of the downslope wind speed near Gangnung area. Int. J. Environ. Sci. 12, 1245–1254. doi: 10.5322/JES.2003.12.12.1245
Li, J., Yang, W., Wang, Z., Chen, H., Hu, B., Li, J., et al. (2016). Modeling study of surface ozone source-receptor relationships in East Asia. Atmos. Res. 167, 77–88. doi: 10.1016/j.atmosres.2015.07.010
Liu, C., and Shi, K. (2021). A review on methodology in O3-NOx-VOC sensitivity study. Environ. Pollut. 291:118249. doi: 10.1016/j.envpol.2021.118249
Loibl, W., Bolhàr-Nordenkampf, H. R., Herman, F., and Smidt, S. (2004). Modelling critical levels of ozone for the forested area of Austria modifications of the AOT40 concept. Environ. Sci. Pollut. Res. Int. 11, 171–180. doi: 10.1007/BF02979672
Massambani, O., and Andrade, F. (1994). Seasonal behavior of tropospheric ozone in the Sao Paulo (Brazil) metropolitan area. Atmos. Environ. 28, 3165–3169. doi: 10.1016/1352-2310(94)00152-B
Matsumura, H. (1997). “Effects of ozone and/or sulfur dioxide on tree species,” in Proceedings of the CRIEPI International Seminar on Transport and Effects of Acidic Substances November 28–29, 1996, Tokyo, 190–205.
Meehl, G. A., Stocker, T. F., Collins, W. D., Friedlingstein, P., Gaye, A. T., Gregory, J. M., et al. (2007). Global Climate Projections. Chapter 10. Geneva: IPCC.
Metropolitan Area Atmospheric Environment Agency (2005). Area Atmospheric Environment Information. Gwacheon: Metropolitan Area Atmospheric Environment Agency press, 3–4.
Ministry of the Environment Metropolitan Air Quality Management Office (2022). Available online at: https://me.go.kr/mamo/web/index.do?menuId=590 [Accessed on April, 12 2022].
National Research Council (1992). Rethinking the Ozone Problem in Urban and Regional Air Pollution. Washington, DC: National Academies Press.
Osrodka, L., and Swiech-Skiba, J. (1997). Klimatologiczne aspekty powstawania smogu letniego na obszarze Gornoslaskiego Okregu Przemyslowego. Wiadomości Instututu Meteorologii i Gospodarki Wodnej 20, 113–128.
Ozolincius, R., Stakenas, V., and Serafinaviciute, B. (2005). Meteorological factors and air pollution in Lithuanian forests: Possible effects on tree condition. Environ. Pollut. 137, 587–595. doi: 10.1016/j.envpol.2005.01.044
Pochanart, P., Akimoto, H., Kinjo, Y., and Tanimoto, H. (2002). Surface ozone at four remote island sites and the preliminary assessment of the exceedances of its critical level in Japan. Atmos. Environ. 36, 4235–4250. doi: 10.1016/S1352-2310(02)00339-4
Rich, S., Waggoner, P. E., and Tomlinson, H. (1970). Ozone uptake by bean leaves. Science 169, 79–80. doi: 10.1126/science.169.3940.79
Sillman, S. (1999). The relation between ozone, NOx and hydrocarbons in urban and polluted rural environments. Atmos. Environ. 33, 1821–1845. doi: 10.1016/S1352-2310(98)00345-8
Sillman, S., and He, D. (2002). Some theoretical results concerning O3–NOx–VOC chemistry and NOx–VOC indicators. J. Geophys. Res. Atmos. 107, ACH–26–21–ACH–26–15. doi: 10.1029/2001JD001123
Takahashi, M., Feng, Z., Mikhailova, T. A., et al. (2020). Air pollution monitoring and tree and forest decline in East Asia: A review. Sci. Total Environ. 742:140288. doi: 10.1016/j.scitotenv.2020.14028
Tong, D. Q., Mathur, R., Kang, D., Yu, S., Schere, K. L., and Pouliot, G. (2009). Vegetation exposure to ozone over the continental United States: Assessment of exposure indices by the Eta-CMAQ air quality forecast model. Atmos. Environ. 43, 724–733. doi: 10.1016/j.atmosenv.2008.09.084
Treffeisen, R., and Halder, M. (2000). Spatial and temporal variation of ozone concentrations at high altitude monitoring sites in Germany. Environ. Monit. Assess. 65, 139–146. doi: 10.1023/A:1006405420701
Vingarzan, R. (2004). A review of surface ozone background levels and trends. Atmos. Environ. 38, 3431–3442. doi: 10.1016/j.atmosenv.2004.03.030
Volz, A., and Kley, D. (1988). Evaluation of the Montsouris series of ozone measurements made in the nineteenth century. Nature 332, 240–242. doi: 10.1038/332240a0
Walczewski, J. (2005). Meteorologiczne i klimatyczne warunki rozprzestrzeniania się zanieczyszczeń powietrza Prz. Geofiz. 3–4, 177–193.
World Health Organization [WHO] (2000). Air Quality Guidelines for Europe. Copenhagen: WHO Regional Publications.
Xing, J., Wang, J., Mathur, R., Wang, S., Sarwar, G., Pleim, J., et al. (2017). Impacts of aerosol direct effects on tropospheric ozone through changes in atmospheric dynamics and photolysis rates. Atmos. Chem. Phys. 17, 9869–9883. doi: 10.5194/acp-17-9869-2017
Keywords: surface ozone, forest, daily total insolation, AOT40, critical level
Citation: Kim M-J and Lee S-D (2022) Potential effects of surface ozone on forests in Gangwon Province, South Korea, based on critical thresholds. Front. For. Glob. Change 5:996859. doi: 10.3389/ffgc.2022.996859
Received: 18 July 2022; Accepted: 31 August 2022;
Published: 20 September 2022.
Edited by:
Jeong-Wook Seo, Chungbuk National University, South KoreaReviewed by:
Sanjeevi Nagalingam, University of California, Irvine, United StatesEva Yvonne Pfannerstill, University of California, Berkeley, United States
Copyright © 2022 Kim and Lee. This is an open-access article distributed under the terms of the Creative Commons Attribution License (CC BY). The use, distribution or reproduction in other forums is permitted, provided the original author(s) and the copyright owner(s) are credited and that the original publication in this journal is cited, in accordance with accepted academic practice. No use, distribution or reproduction is permitted which does not comply with these terms.
*Correspondence: Sang-Deok Lee, c2RsZWVAa2FuZ3dvbi5hYy5rcg==