 Vikram S. Negi1,2*
 Aseesh Pandey2Ajay Singh3Amit Bahukhandi2Dalbeer S. Pharswan2K. S. Gaira4
 Zishan Ahmad Wani5*
 Jahangeer A. Bhat6
 Sazada Siddiqui7Habab M. Yassin7
- 1Graphic Era (Deemed to be University), Dehradun, India
- 2G.B. Pant National Institute of Himalayan Environment (GBP-NIHE), Kosi-Katarma, Almora, India
- 3Wildlife Institute of India, Dehradun, India
- 4Sikkim Regional Centre, GBP-NIHE, Gangtok, India
- 5Conservation Ecology Lab, Department of Botany, Baba Ghulam Shah Badshah University, Rajouri, India
- 6Piramal Foundation for Education Leadership (State Transformation Program), Mumbai, India
- 7Department of Biology, College of Science, King Khalid University, Abha, Saudi Arabia
The present study describes how vegetation (the tree layer) is shaped along the elevation gradients in the eastern part of the Indian Himalayan Region. Various vegetation attributes, distribution, population structure, and regeneration patterns of 75 tree species belonging to 31 families were studied. Tree species richness shows a low plateau (peaked between 1,300–1,500 m) with a linearly decreasing pattern above 1,500 m asl. Ericaceae was found as the dominant family, followed by Lauraceae and Rosaceae. The distributional pattern of species-to-genera ratio (S/G) did not follow any particular trends, while β-diversity increased along the elevation gradient. The Margalef index of species richness, the Menheink index of species richness, and the Fisher alpha were found to be highest at lower altitudes (1,000–1,500 m), while the Simpson index was highest at middle altitudes (2,600–3,000 m). Random distribution was shown by maximum tree species (47.3%), followed by a contagious distribution (42.9%), and regular distribution (10.8%). The regeneration of tree species was found to be good with a healthier number of seedlings (10.2%), fair (43.5%), poor (30.3%), while 16% were observed not regenerating. Acer laevigatum (1,500 m), Prunus nepalensis (3,300 m), Viburnum sympodiale (3,400 m) were among the new regenerating species at the respective altitudes. The population structure of tree species in terms of proportion of individuals in seedlings, saplings, and the adult class varied in all the elevation transects. Species with better regeneration on upper distribution limits have been recognized as probable for upward movement.
1 Introduction
Mountain ecosystems cover about 27% of the world’s land surface and support approximately one-quarter of terrestrial biological diversity (Korner and Spehn, 2019). Mountain ecosystems are characterized by steep environmental gradients, including temperature, pressure, and moisture (Spehn, 2011; Antonelli et al., 2018). Abiotic and biotic factors influence the patterns of diversity and distribution of taxa along altitudinal gradients (McCain and Grytnes, 2010). Along an elevation gradient, environmental variables directly affect species composition, growth patterns, and ecosystem functioning, which leads to a change in the vegetation composition (Guo et al., 2013; Krömer et al., 2013; Malizia et al., 2020). The elevation regulates several abiotic factors (i.e., soil parameters, atmospheric pressure, humidity, cloudiness, solar radiation, light availability, pH, etc.) that control the composition of vegetation and the ecology of mountain forests (Cirimwami et al., 2019). Species from different taxa, families, and life forms respond specifically to these factors according to their eco-physiological properties and sensitivity (Vetaas and Grytnes, 2002; Korner, 2007; McCain and Grytnes, 2010).
Among mountain ecosystems across the globe, Asia has the highest and most populated mountain ecosystem—the Himalaya. Besides, it is endowed with an overwhelming richness, representativeness, and uniqueness of biodiversity (Rawal et al., 2018). Elevation and abiotic factors are the governing drivers for differences in species richness and composition in the Himalaya (Lee and Chun, 2016; Pandey et al., 2018a). The species composition depends directly on temperature and air pressure, which decrease along the elevation gradient (Whittaker et al., 2001; Bhattarai and Vetaas, 2006; Wani et al., 2023). It is well established that diversity declines linearly along the elevation gradient (MacArthur, 1972; Korner, 2000). However, recent studies highlight that plant diversity often peaks at mid-elevations (Rahbek, 2005; Kessler et al., 2011). This may vary among taxa and mountain ranges (Cardelus et al., 2006; Körner et al., 2017).
The elevation gradient in the Himalayan region support diverse vegetation types, from tropical forest to alpine meadow, comprised of an unusually extensive elevation and vegetation gradient (Singh et al., 1994; Tang et al., 2014; Wani et al., 2022). Among different life forms, tree species are an essential component of forest composition. Tree diversity is reported to be responsible for structural complexity and environmental heterogeneity in the mountain ecosystem (Gaston, 2000; Oommen and Shanker, 2005). Tree dynamics, particularly distribution along the elevation gradient, are important to understand in biodiversity conservation studies and ecological processes (Gaire et al., 2014). Among various ecological processes, regeneration of tree species is a crucial process for their existence in a community under varied environmental conditions (Negi et al., 2018b). The regeneration pattern depicts the current status of forest health and indicates the future composition of a particular community (Tesfaye et al., 2002; Gairola et al., 2014; Negi et al., 2018a). The size-class distribution of forest trees is a prime indicator of forest structure and dynamics and is widely used to examine the forest’s health, including regeneration and recruitment of species (Forrester et al., 2017; Bhutia et al., 2019). The stand density and basal area are excellent indices for estimating forest biomass and carbon sequestration potential.
The eastern part of the Himalayan biodiversity hotspots (Mittermeier et al., 1999; Mayer et al., 2000) is among the most diverse regions with high endemism (Behera et al., 2002). However, basic knowledge on the structure and composition of the Himalayan forests is still limited in many regions, particularly in the remote eastern parts (Chakraborty et al., 2018). Arunachal Pradesh and Sikkim are known for having the highest species diversity in the north-eastern Himalayan region (Wani et al., 2024). Few studies attempted to assess the floristic diversity pattern in the eastern Himalayan region along the elevation gradient (Behera and Kushwaha, 2006; Acharya et al., 2011; Sinha et al., 2018). However, the range of altitudinal amplitude among these studies was very limited because of the remoteness and difficult terrain. To fill this lacuna, the present study explores the distribution of woody taxa along the elevation gradients in the region. A wide range of elevation gradients (1,000–4,000 m) from subtropical forests to treeline ecotones (sub-alpine forests) has been covered in the study. The objectives of the present study include: (i) assessment of species richness, distribution pattern and relative dominance of tree species, and (ii) study the population structure and regeneration pattern of tree species, along the elevation gradients.
2 Methodology
2.1 Study area
Indian Himalayan Region (IHR) extends across nine states fully, hilly districts of two states (Assam, and West Bengal) and 02 Union Territories (Ahirwal et al., 2021). It is broadly divided into two zones; Western Himalaya and Eastern Himalaya, and represents about 16.2% of the total geographical area, 44% of the total biodiversity, and 100% of the alpine and glacial systems of the country. In present study, the upper Teesta valley of Sikkim state from Singtam (1,000 m asl) in East to Yumesamdong (4,000 m asl), Lachung North Sikkim considered as a representative site for intensive field studies along a wide elevation gradient (1,000–4,000 m asl). The dissected topography and significant variations in climatic conditions along the elevation gradient resulted in diverse vegetation types. The major forest types along the studied transect includes tropical moist deciduous forest, tropical semi-evergreen forest, and tropical wet evergreen forest, subtropical forests, temperate forests, subalpine forests and alpine meadow (Prabha and Jain, 2016).
2.2 Methods
Standard quadrat method was used for vegetation sampling along the elevation gradient. We established 31 sites between 1,000–4,000 m in the upper Teesta valley keeping a minimum of 100 m elevation difference between two sites (Figure 1). Random sampling method was used to investigate the vegetation along the elevation gradient and 50 m × 50 m plots were marked randomly at each site. Within each 50 m × 50 m plot, ten random quadrats (10 m × 10 m) were laid for enumerating trees (adult), twenty (5 m × 5 m) for saplings and forty (1 m × 1 m) for seedlings, respectively (Figure 1), following previous studies from the Himalayan region (Reshi et al., 2017; Pandey et al., 2018b). Besides, for calculating different diversity indices and data analysis, the whole altitudinal gradient (1,000–4,000 m asl) was divided into six major Forest Types (FT). These include 1,000–1,500 (FT 1-deciduous-broadleaf forest), 1,600–2,000 (FT 2-deciduous-broadleaf forest), 2,100–2,500 (FT 3-deciduous-broadleaf forest), 2,600–3,000 (FT 4-broadleaf-evergreen forest), 3,000–3,500 (FT 5-broadleaf-evergreen and coniferous-evergreen forest) and 3,600–4,000 (FT 6-coniferous-evergreen forest—Supplementary Table S1).
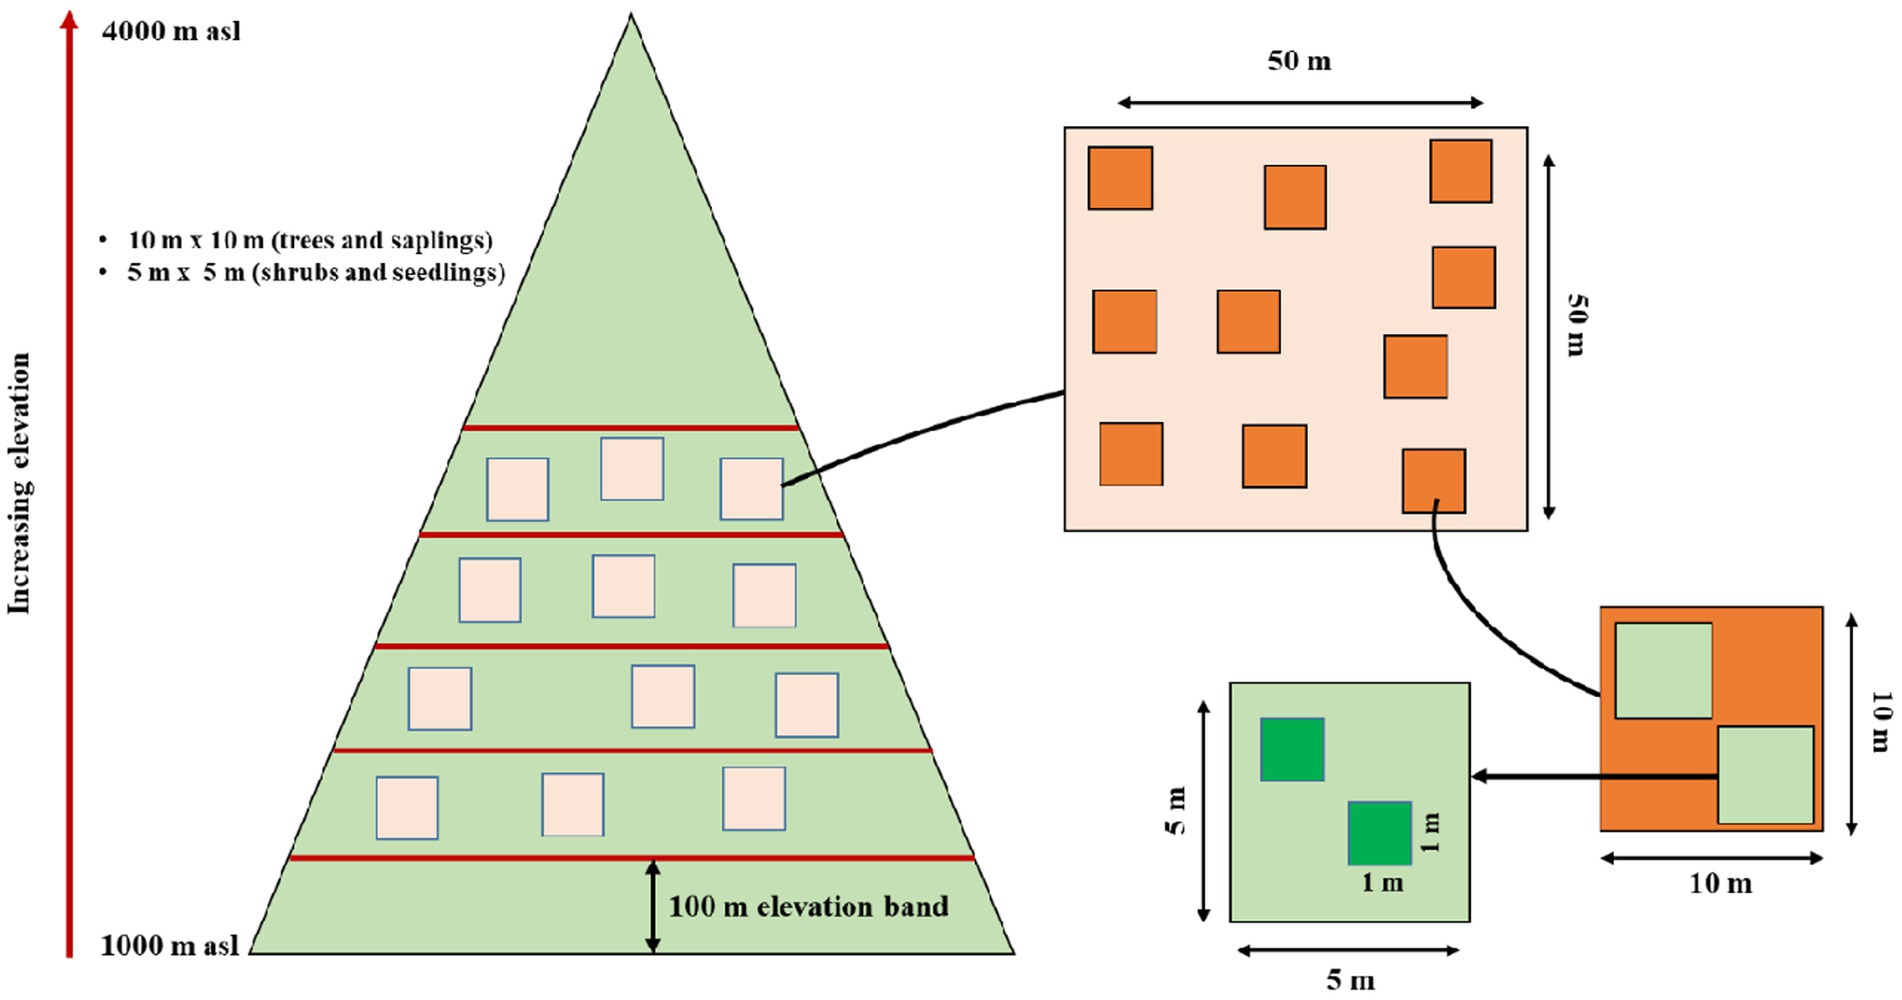
Figure 1. Pictorial diagram of altitude transect sampling method and representation of sample quadrat and plots within the altitude transect.
The forest structure and composition were determined following Misra (1968) and Mueller Dombois and Ellenberg (1974). Tree species diversity was determined using the Shannon-Wiener index [H′ = −Σpi * ln (pi)] where ln: natural log; pi: proportion of the entire community made up of ith species (Shannon and Weaver, 1963). Shannon diversity provides information on both species’ richness and relative abundance among plots and is thus sensitive to the sampling effort or the number of individuals sampled. The ratio of abundance to frequency (A/F) for different species was determined to elicit distribution patterns following Whitford (1949). This ratio has indicated regular (<0.025), random (0.025–0.05) and contagious (>0.05) distribution patterns. Circumference at breast height (cbh = 1.37 m) was taken to determine tree basal area (Odum, 1971). The basal area of all trees within the quadrats was calculated at each elevation band and the values were summed up to obtain the basal area (m2/ ha) of the elevation site following Greig-Smith (1983). Basal area was used to determine the relative dominance of a tree species (Curtis and McIntosh, 1950). Beta diversity (β) was measured using the Whittaker (1975) formula as given in Mena and Vazquez-Dominguez (Mena and Vázquez-Domínguez, 2005): β = (s/α) − 1; where “α” is the mean number of species per altitude belt and “s” is the total number of species recorded across the study system (i.e., altitude). We also estimated species richness, genus richness, and family richness for the overall forest community along the altitudinal gradient. We also estimated essential stand structural parameters: the median DBH, basal area (m2/ha), and size class distribution of forest trees.
The regeneration status of dominant trees was assessed based on the proportional distribution of individuals in each seedling, sapling, and adult stages (Saxena and Singh, 1984; Khan et al., 1987): Good regeneration is considered if number of seedlings > saplings >trees; fair regeneration is considered if number of seedlings > or ≤ saplings≤ trees, or if the species survives only in sapling stage, but no seedlings (saplings may be <, > or = trees) following Bhandari (2020) and Wani and Pant (2023). If a species is present only in tree form (absent seedling and sapling stages), it is considered not regenerating, while species having no trees but only seedling stages are considered as “new” species. Individuals of tree species measuring >30 cm diameter (diameter at breast height—130 cm above ground level) were considered trees, individuals between >11–30 cm diameter as saplings, and individuals <10 cm diameter as seedlings. The basic Circumference at Breast Height (CBH) information of individual trees generated from each quadrat was used for the development of population structures. The individuals of each tree species were grouped into seven arbitrary CBH classes (A: <10; B: 10–30; C: 31–60; D: 61–90; E: 91–120; F: >121–150; G: >150 cm) for generating demographic profiles following Saxena and Singh (1984). Class A and B represent seedlings and saplings, respectively, and other classes (C-G) represent trees with different girth size classes.
Regression analysis was used to study the relationship between elevation and species richness using SPSS version 10.0. For Alpha diversity, the total number of species at each transect was calculated and analyzed. Correlations were developed using SPSS_16 software. The Sorenson similarity index was calculated using the Estimate S_9 software. Quadratic models were fitted between altitude and species distributions. The selection of the quadratic model was made based on its performance.
3 Results
The result reveals quantitative detail on the availability, distribution, population density, and abundance of 75 tree species belonging to 31 families (Figure 2). A total of 3,439 tree individuals were measured in 93 plots along the elevation gradient. Ericaceae was found to be the dominant family (14 spp.), followed by Lauraceae (7 spp.) and Rosaceae (5 spp.).

Figure 2. Floristic diversity pool across altitudinal gradient in Teesta valley, Sikkim.
3.1 Species richness and diversity measures
The distribution of tree species at each elevation level is provided in Table 1. The Margalef Index of Species Richness, Menheink Index of Species Richness and Fisher Alpha were found to be maximum at lower altitudes (1,000–1,500 m), while the Simpson Index was found to be maximum at middle (2,600–3,000 m) altitudes. Species richness indices in different forest types along the elevation in Teesta Valley are given in Table 2. A significant decreasing trend is observed for most diversity indexes (MeI, MI, FA; Table 3). Species richness was found to be maximum (Curtis and McIntosh, 1950) at 1,300 m followed by 1,500 m (Cirimwami et al., 2019) and minimum (Antonelli et al., 2018) between 1,200–1,500 m (Figure 3A). Species richness with respect to forest type was recorded maximum (39 species) in FT1 and minimum (9 species) in FT 6 (Supplementary Table S1). Tree species richness shows a low plateau (peaked between 1,300–1,500 m) with a linear decreasing pattern above 1,500 m (Figure 3A), while species diversity (H′) was observed maximum (2.3) at 1,300 m and minimum (0.7) at 4,000 m (Figure 3B). Considering the importance of β-diversity in conservation planning, it is evaluated separately for each study site along the elevation gradient (Figure 3C). β-diversity has a positive relationship with increasing elevation. It was recorded maximum for high altitude sites; > 3,400 m (Figure 3C). Pearson correlation coefficients between various phytosociological parameters are presented in Table 3. Berger Paker Index and β-diversity showed a positive correlation, and SR, D, H, MeI, MI, while FA showed a negative correlation with the elevation.
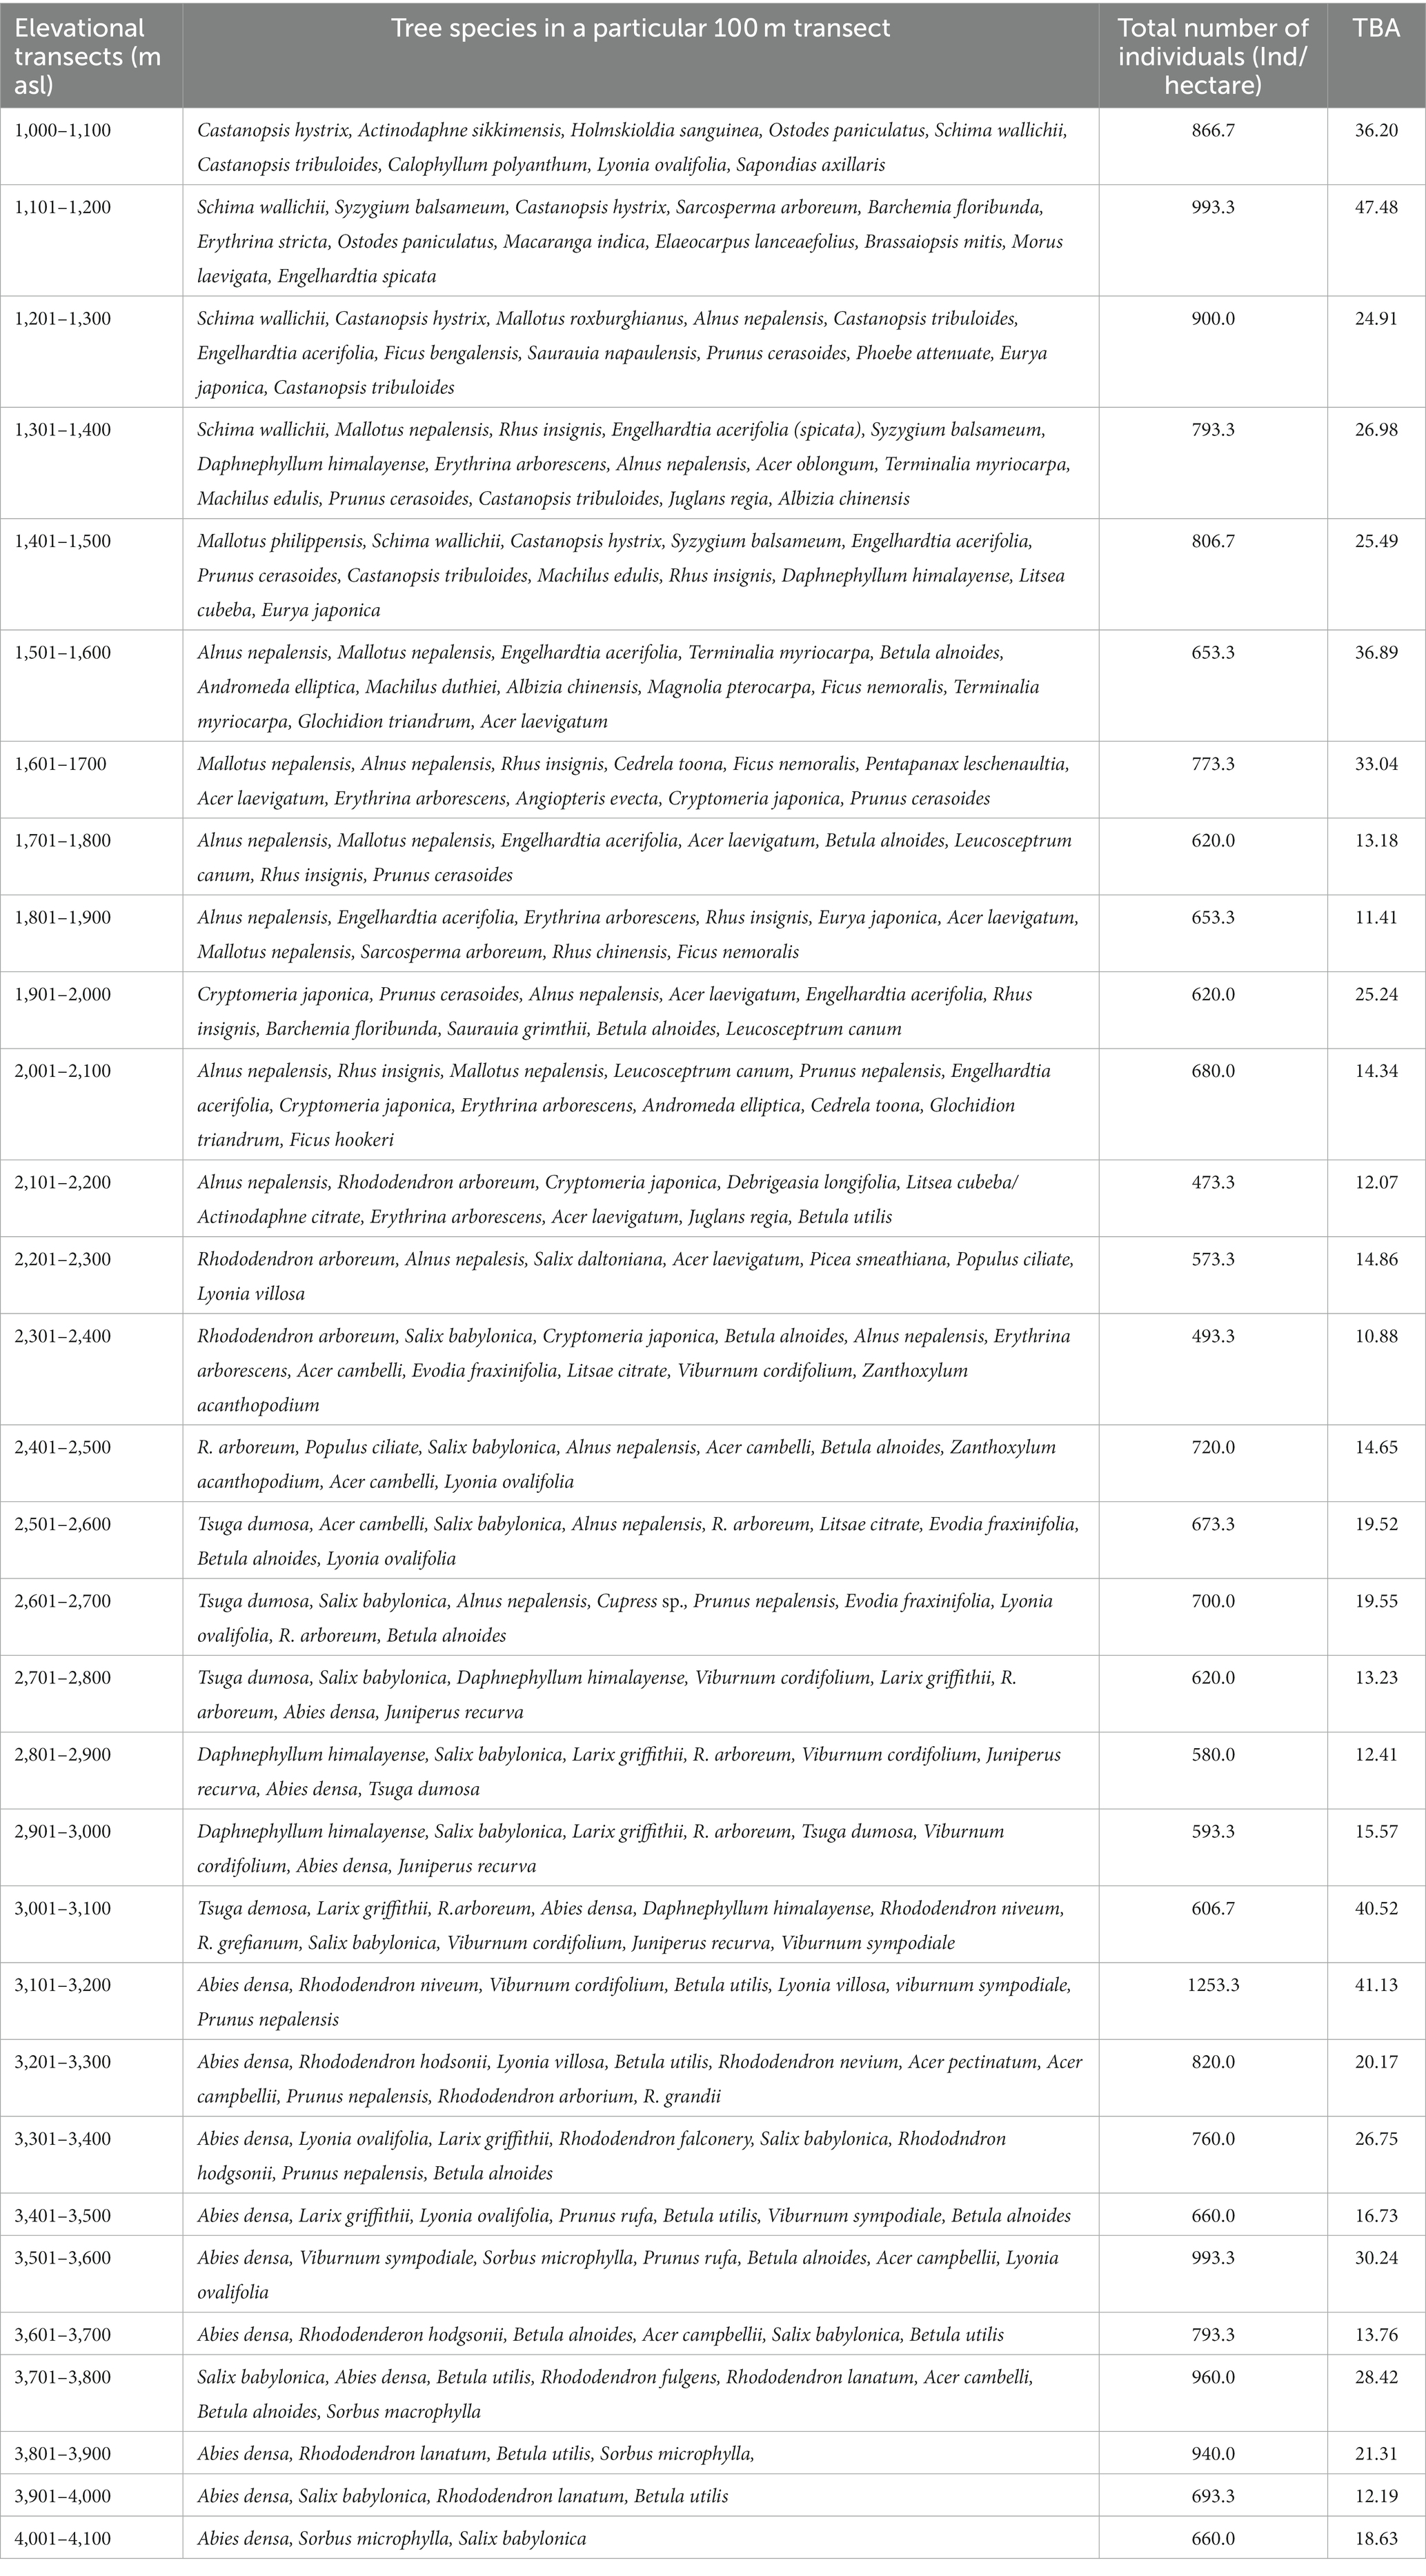
Table 1. Distribution of tree species along elevation gradient in Teesta valley (Sikkim).
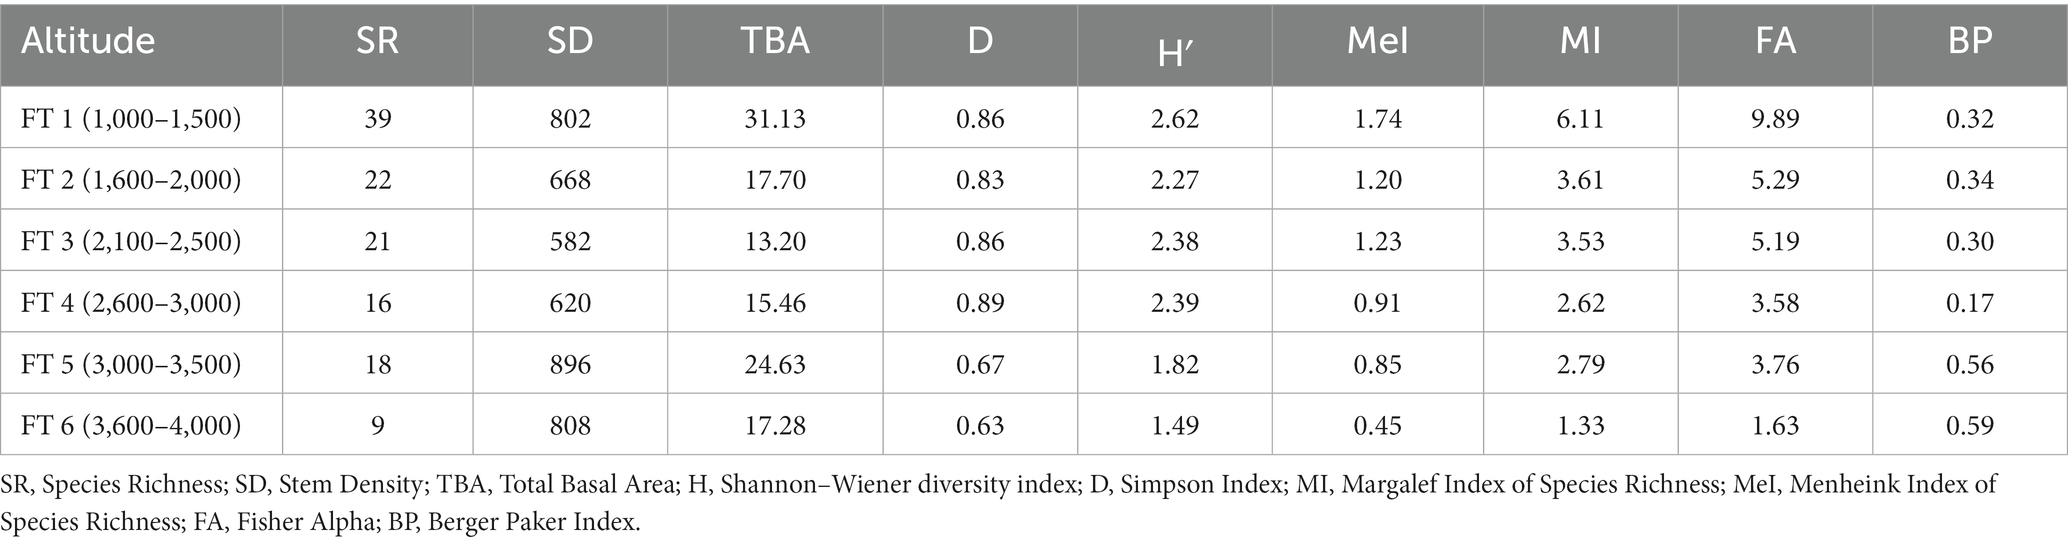
Table 2. Species richness indices in different forest types in Teesta valley, Sikkim, eastern Himalaya.
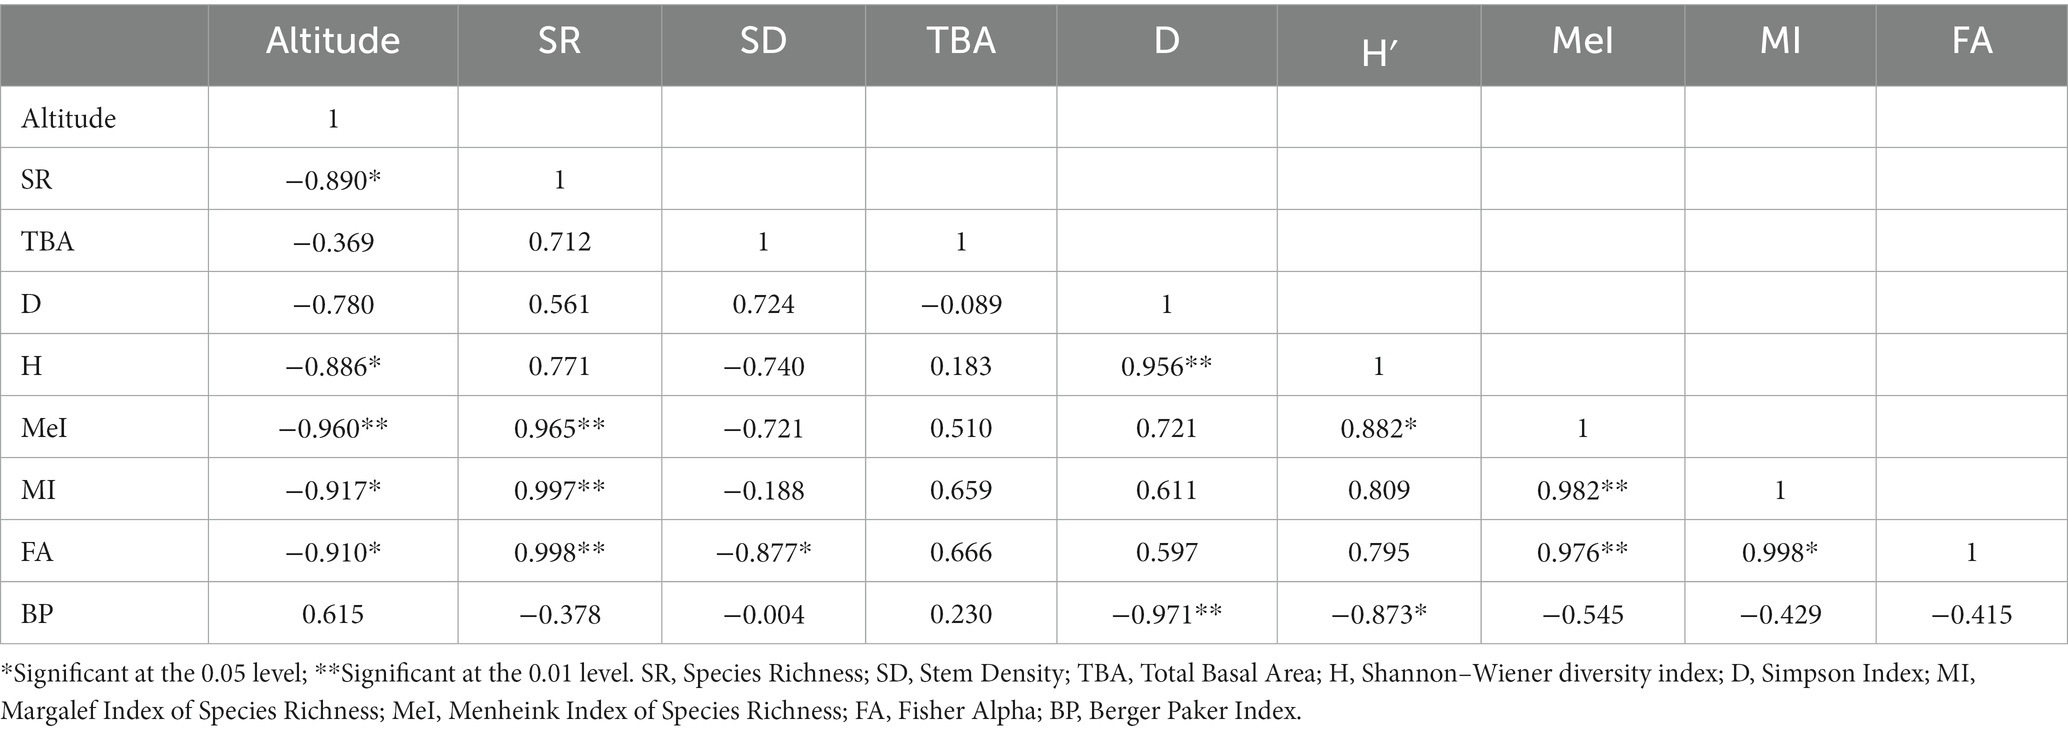
Table 3. Correlation among various parameter in the Teesta valley, Sikkim, eastern Himalaya.
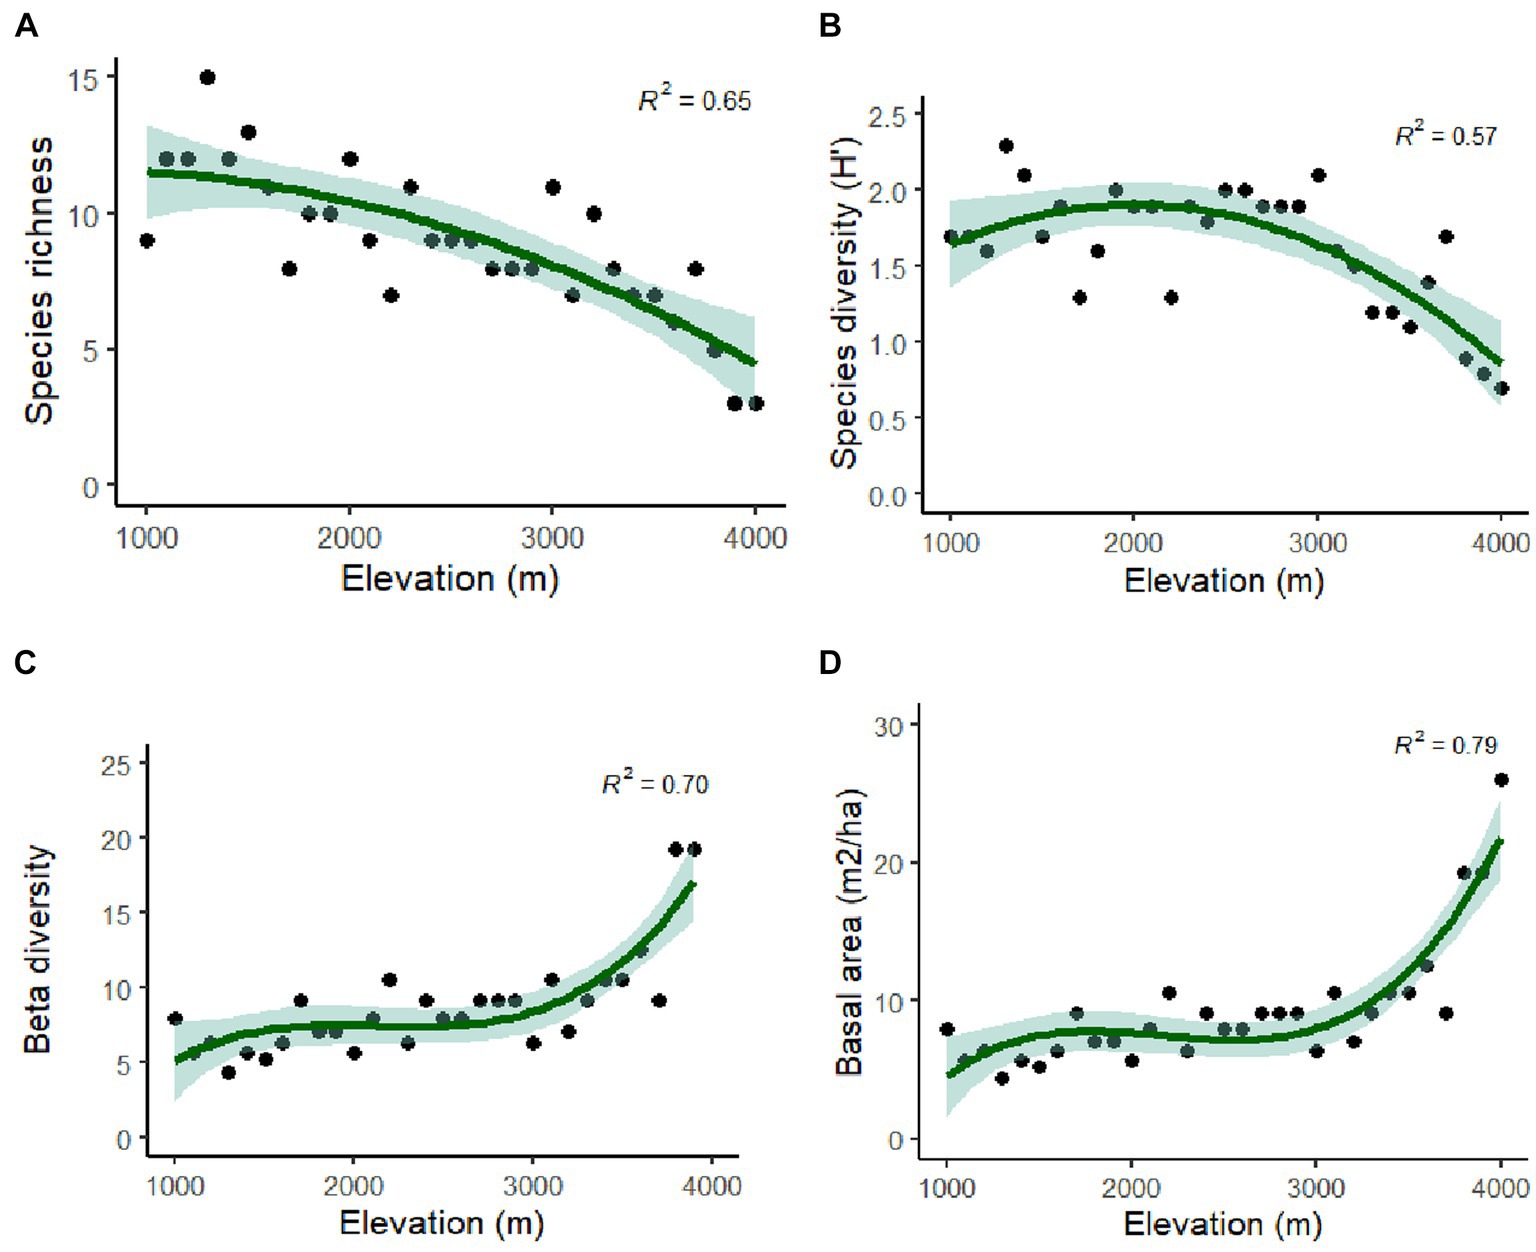
Figure 3. Polynomial regression analysis (A) between elevation and tree species richness; (B) tree species diversity and elevation; (C) between altitude and Beta diversity; and (D) between altitude and TBA.
3.2 Species distribution pattern, stand basal area and density
Rhododendron arboreum, Alnus nepalensis, Syzygium balsameum, Cryptomeria japonica, Viburnum cordifolium, Salix babylonica, Daphnephyllum himalayense, and Populus ciliata showed regular distribution along the Teesta valley. Random distribution was shown by the maximum species (47.31%), followed by a contagious distribution (42.92%), and minimum (10.77%) by regular distribution. Abies densa, Alnus nepalensis, Betula alnoides, Rhododendron arboretum, Mallotus nepalensis and Schima wallichii have a wider distribution, with appearances at eleven, ten, nine, six, and five sites, respectively. Total basal area (TBA) was found to be maximum (47.48 m2/ha) at 1,101–1,200 m followed by 41.30 m2/ha (3,100–3,201 m) and 40.52 m2/ha (3,000–3,101 m), and minimum (10.88m2/ha) at 2,300–2,401 m (Table 1). The average range of TBA was found to be between 10.88 and 47.48 m2/ha along the elevation gradient in the valley (Figure 3D); it was found to be maximum for Abies densa at higher altitudes. There was no specific pattern observed for tree density; it was found to be maximum (1,253 Ind/ha) at 3,100 m and minimum (473 Ind/ha) at 2,100 m (Figure 4A); maximum density was observed for Abies densa (693 Ind/ha) at 3,500 m.
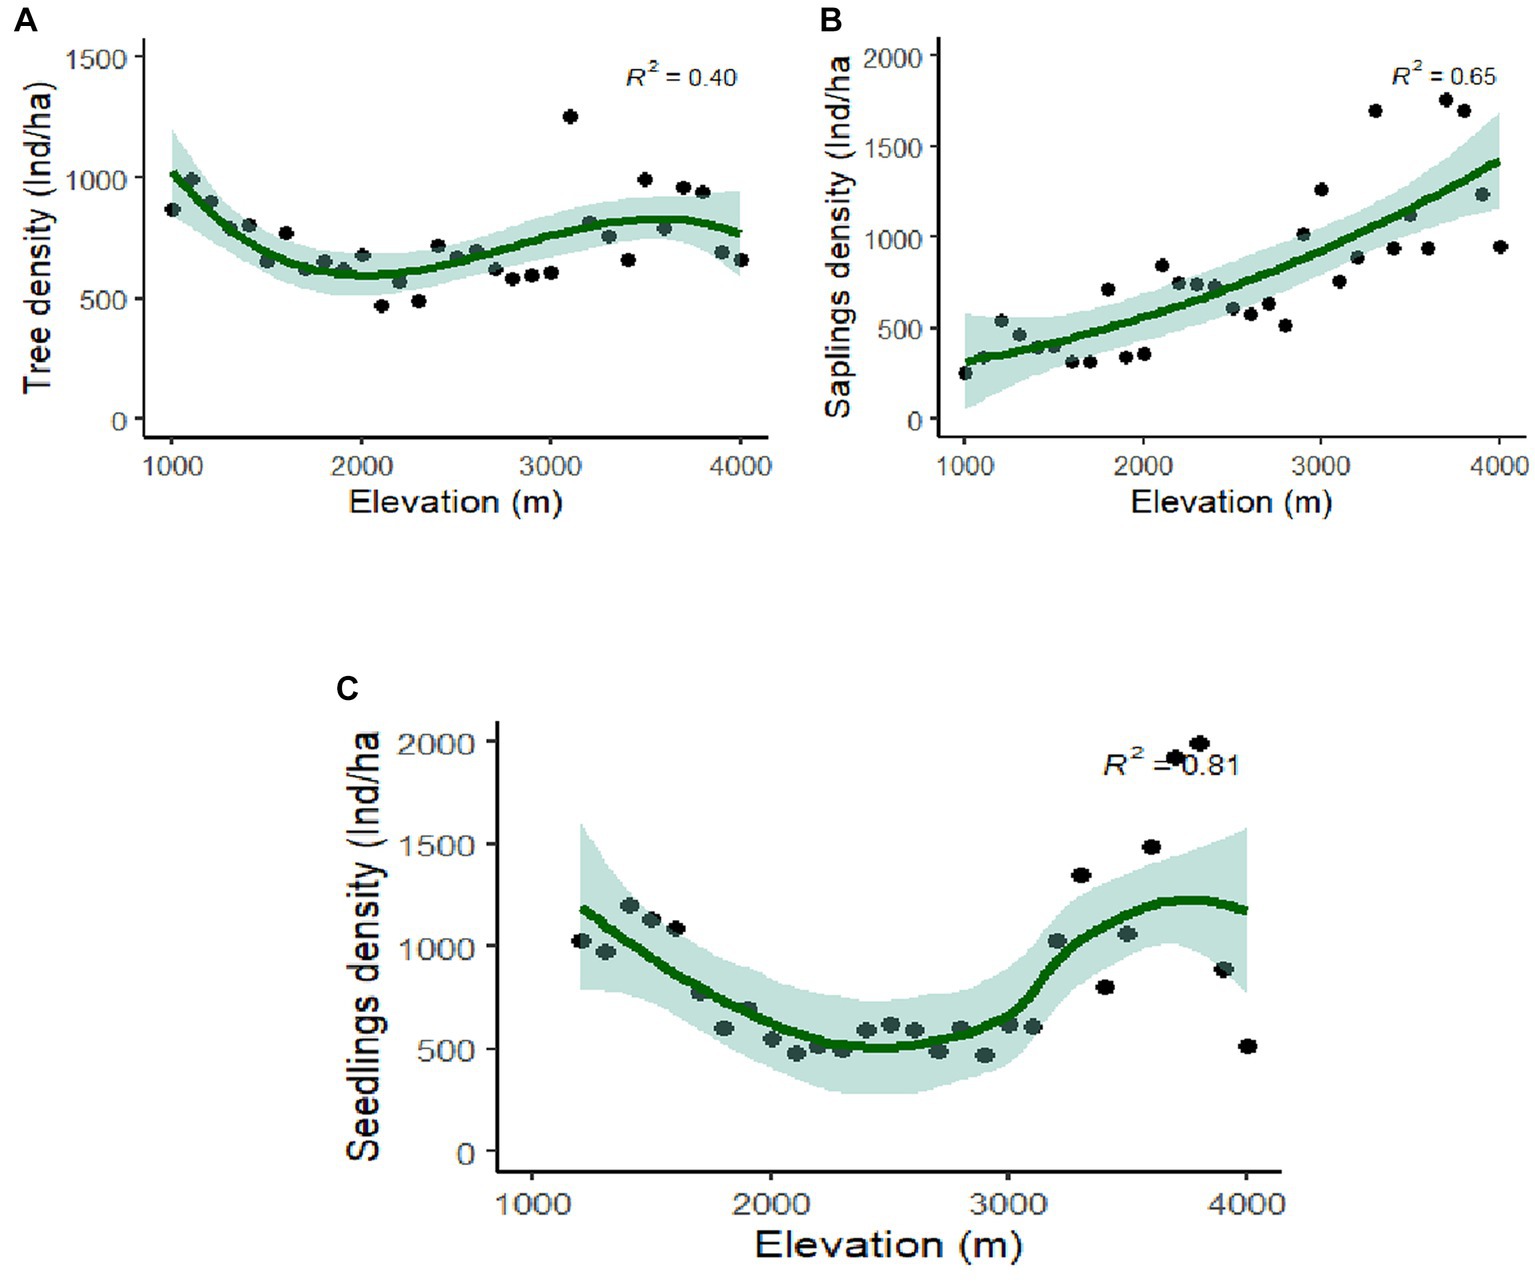
Figure 4. Polynomial regression analysis between altitude and density (A) tree; (B) saplings; and (C) seedlings.
3.3 Regeneration pattern
The overall seedling density with relation to altitude ranged between 473–3,060 Ind/ha, while the sapling density ranged from 260–1,760 Ind/ha (Figures 4A,B). Maximum seedlings (3,060 Ind/ha) were observed at 1,100 m, and minimum (473 Ind/ha) at 2,900 m (Figure 4C). The regeneration of tree species was found to be fair (43.5%) at most of the attitudes (i.e., 1,100–1,200, 1,400–1,500), followed by poor (30.3%) at 1,000–1,100, 1,200–1,300, and not regenerating (14%) at 1,100–1,200, 1,300–1,400, while it was found to be good (10.2%) at higher altitudes (3,200 m, 3,700 m and 3,800 m; Supplementary Table S2). The results further reveal that 14.2% of tree species are not regenerating at their respective elevations. Regeneration of Abies densa was found to be good at higher altitudes (>3,400 m), and of Salix babylonica at middle altitude (2,300–2,800 m). Acer laevigatum (1,500 m), Terminalia myriocarpa (1,500 m) Prunus nepalensis (3,300 m), Viburnum sympodiale (3,400 m) are among the new regenerating species in the respective elevation, as they were found only in the seedling stage.
3.4 Population structure
The population structure of the tree community and the distribution of seedlings, saplings, and adults in the forest varied along the elevation gradient (Figure 5). The high accumulation of saplings of dominant species (Schima wallichii, Castanopsis hystrix, and Engelhardtia acerifolia) between 1,000–1,500 m, the sharp decline in seedlings, and high tree-size class were characteristic of this altitudinal transect (Figure 5A). However, the overall composition of tree species forms a reverse j-shaped structure, which is reported as a progressive population structure. Alnus nepalensis showed a reverse hill-shaped structure with high seedlings, a sudden decline in saplings, and a further increase in the higher girth size class between 1,600–2,000 m. Mallotus nepalensis showed a very low number of seedlings and a sudden increase in saplings and higher girth class, while Engelhardtia acerifolia showed a hill-shaped structure with an accumulation of individuals at saplings stage, and decline in seedling and higher girth classes (Figure 5B). Population structure showed a greater proportion of individuals (Rhododendron arboreum, Alnus nepalensis) in the seedling and sapling stages between 2,100–2,500 m, and a decline in tree-size classes formed a reverse j-shaped structure (Figure 5C). Salix babylonica showed a hill-shaped structure with an accumulation of saplings, and a decline in seedlings and higher girth classes. The higher proportion of individuals (Salix babylonica, Larix griffithii) in the sapling stage was evident between 2,600–3,000 m (Figure 5D). At the temperate zone (3,100–3,500 m), the dominant species (Abies densa, Betula utilis) showed a higher number of individuals in sapling stages and adult classes, and decreasing numbers in higher tree-size classes form a bell-shaped structure (Figure 5E). Population structure at treeline ecotone (3,500–4,000 m) shows a greater proportion of individuals in the sapling stage (Betula utilis, Rhododendron nevium) and a decline in seedlings and higher tree-size classes form a hill-shape structure (Figure 5F). Abies densa showed a progressive population structure with sufficient seedlings, saplings, and individuals in higher girth size classes.
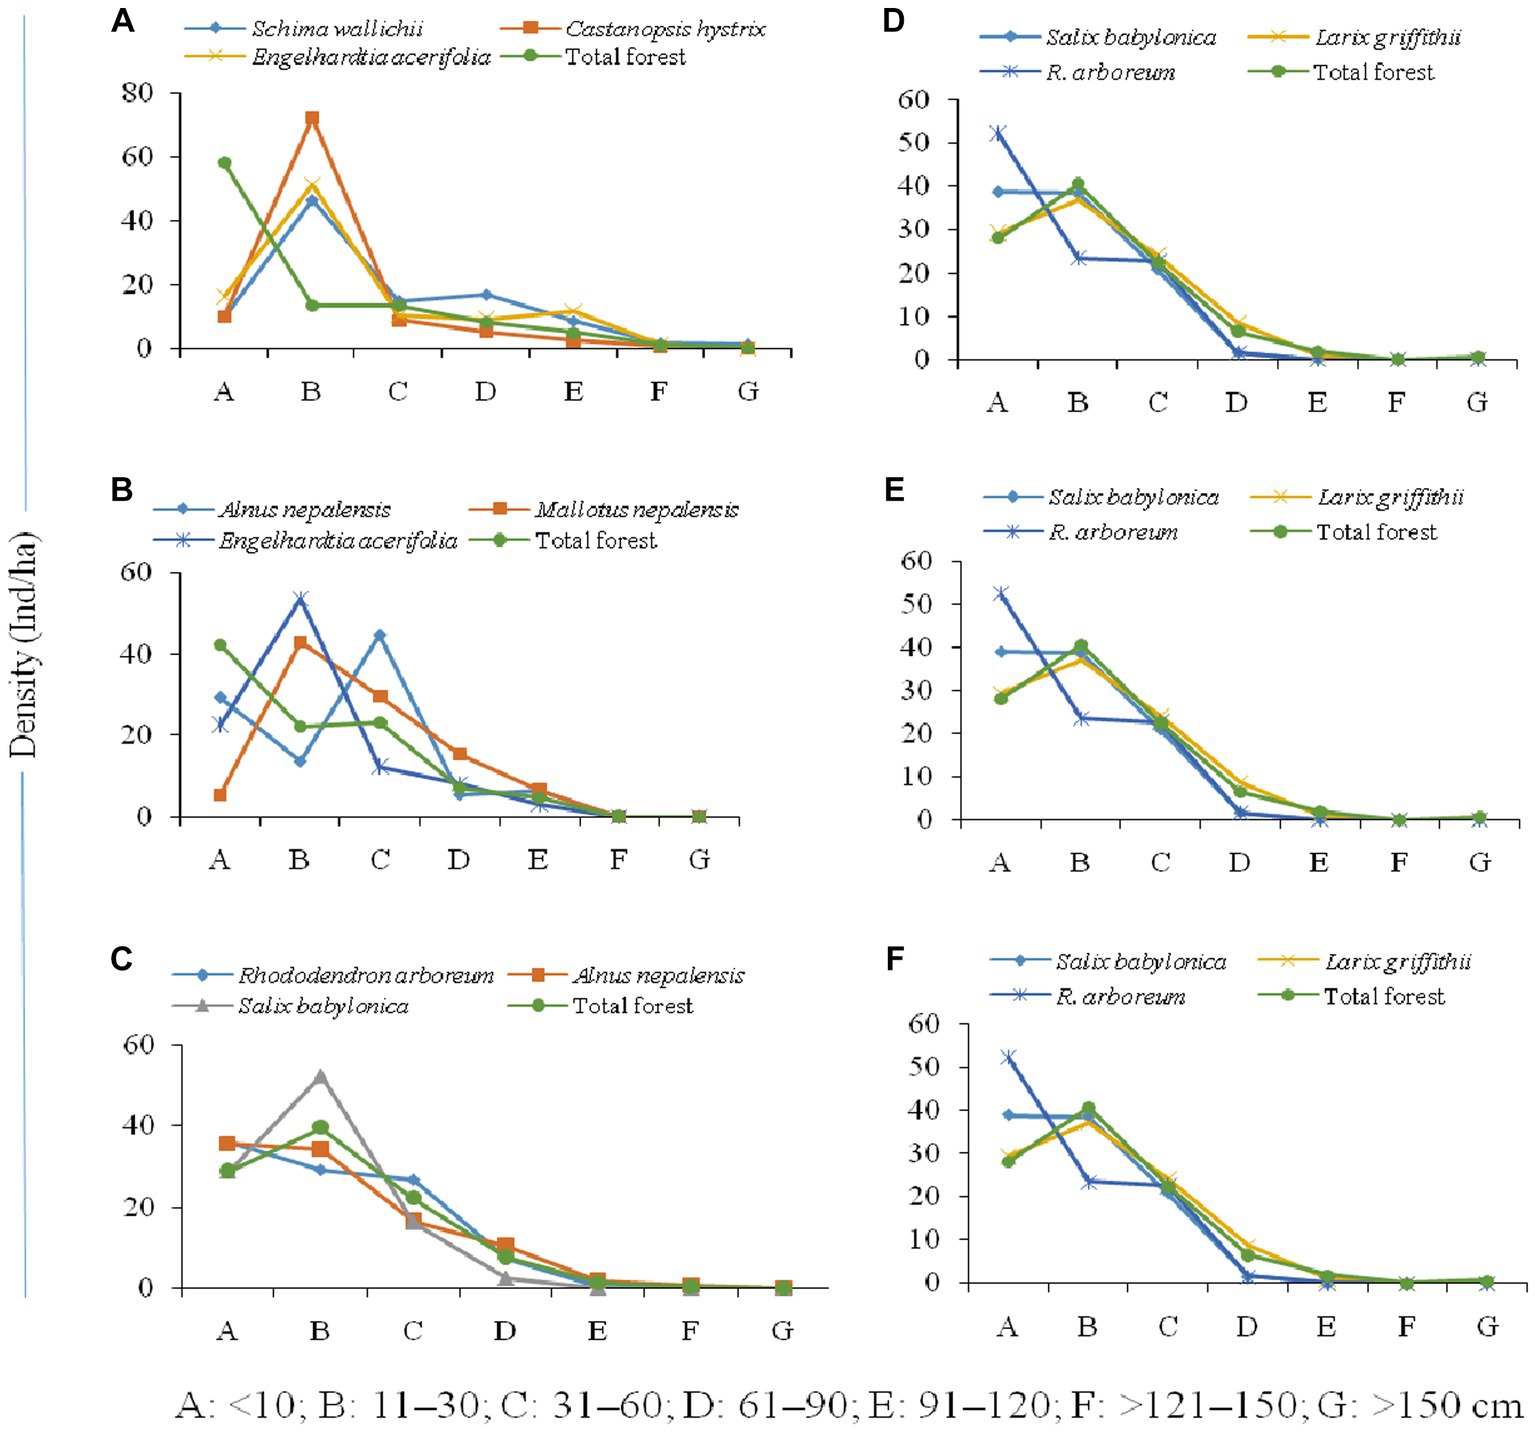
Figure 5. Population structure of forests [(A) 1,000–1,500, (B) 1,600–2,000, (C) 2,100–2,500, (D) 2,600–3,000, (E) 3,100–3,500, (F) 3,600–4,000 m] across altitudinal strata.
4 Discussion
The patterns of species-genus ratio (S/G) at the local scale in light of the hypothesis were described as part of evolutionary dynamics, wherein these ratios are related to speciation or diversification rates (Krug et al., 2008). The altitudinal decrease in the S/G ratio of trees in the Teesta valley would imply their phylogenetic over-dispersion towards the highest altitudes. Species diversity is the most crucial indices, which not only captures information on species richness but also indicates the relative abundance of species in a forest (Shaheen et al., 2012). Higher species richness between 1,300–1,500 m may be because of the presence of a slightly warmer temperature, and hence these species are localized only to specific habitats (Jetz and Rahbek, 2002; Sinha et al., 2018). In a study, Singh et al. (1994) observed an increase in tree species richness with elevations up to 1,500 m in mixed Pinus roxburghii broadleaved forests in central Himalaya. In the mountains, this trend is well reported due to various environmental factors, including decreasing temperature and air pressure along an elevation gradient (McCain and Grytnes, 2010).
It is well established that elevation itself is not causing any changes in the distribution of species but is influenced by climate and environmental factors (Bhattarai and Vetaas, 2006; Krömer et al., 2013). In a review, Rahbek (2005) showed that a decrease in species richness along the elevation gradient is not the rule, as the result of the review indicates that approximately half of the studies had a mid-elevation peak in species richness. Tree species diversity decreases with increasing elevation due to the fact that ecosystems at higher elevations have been mainly colonized by species that are tolerant of extreme weather conditions (Gaston, 2000; Trigas et al., 2013). The range of diversity (0.7–2.3) is consistent with the value reported in previous studies from the region (Singh et al., 1994; Behera and Kushwaha, 2006; Acharya et al., 2011; Pandey et al., 2018a). The average value of species diversity was analysed between 1.5 and 3.5 in the present study, which is comparable with the previous studies from the region [Ghildiyal et al., 1998 (1.86–2.73); Uniyal et al., 2010 (0.70–3.08); Raturi, 2012 (0.78–3.45); Pant and Sammant, 2012 (0.74–2.66)].
The range of the Simpson index (1-D) was found between 0 and 1 according to Simpson (1949), where zero represents no diversity and 1 represents maximum diversity. Among other diversity indices, Whittaker (1977) and Clifford and Stephenson (1975) demonstrated Margalef’s diversity index (DMg) and Menhinick’s index (DMn) as two of the best known of species richness indices. The results of DMg and DMn are consistent with the earlier studies. The result of β diversity in our study is consistent with Magurran (2004), according to which β diversity increases in heterogeneous landscapes and declines in homogenous ones. The patterns of β diversity differ considerably across the sites, and the recorded maximum is for high-altitude ones. Β-diversity patterns revealed that the species replacement rate was lower in the mid-altitude compared to lower and higher altitudes. Adjacent transects along the altitudinal zone showed low differences in the values of β diversity, which indicates species composition does not vary significantly across adjacent forest types. The range of Concentration of dominance (Cd) in the study region (i.e., 0.1–0.6) is more or less similar to the values (0.19–0.99) reported by Whittaker (1977), however higher as compared to previous studies from western Himalaya [Gairola et al., 2011 (0.12–0.25); Raturi, 2012 (0.09–0.63); Malik and Bhatt, 2015 (0.06–0.37)].
The distribution pattern of tree species in any forest ecosystem indicates its adaptability to various environmental drivers. In our study, random distribution was shown by the maximum number of species in the temperate zone, followed by contagious distribution, and the minimum by regular distribution. The species in temperate zones have been reported (Körner, 1998) to have larger environmental tolerances and may follow a random distribution, as also found in the present study. The contagious distribution pattern was more evident in the tropical zone, may be due to narrower tolerances to environmental variation and being likely to be affected by a steep temperature gradient (Oommen and Shanker, 2005). According to Odum (1971), contagious distribution has been accepted as a characteristic pattern of plant occurrence in nature. It may be due to an insufficient mode of seed dispersal or when the death of trees creates a large gap, encouraging the recruitment and growth of numerous saplings (Richards, 1996; Hubbell et al., 1999). Among species having a wider distribution, Abies densa forms the dominant forest >3,000 m to 4,100 m, and Schima wallichii between 1,000–1,400 m. Many species such as Actinodaphne sikkimensis, Barchemia floribunda, and Brassaiopsis mitis are unable to extend their ranges beyond certain elevation bands probably due to their narrow tolerance to climatic variations (Shaheen et al., 2012).
The regeneration of Rhododendron species and Abies densa was seen to be good, with a relatively greater number of seedlings, saplings, and individuals in higher girth classes above 3,000 m. The overall increase in the density of dominant species (i.e., Abies densa) at higher elevation compensates for the reduction in the number of rare species, thereby increasing overall density, as also reported by Scott (1976). The variation in tree density along the elevation transect is attributed to forest community type, age, and site characteristics (Gaire et al., 2010; Pandey et al., 2018b). According to Acharya et al. (2011), high density at higher elevations is an adaptation of species to withstand cold climatic conditions and strong wind currents, thus opting for alpine refugia (Gentili et al., 2015). Tree density in temperate coniferous forests (>3,000 m) was significantly higher as compared to sub-tropical or broad-leaved forests, which may be due to the better regeneration potential of Pinaceae (Begon et al., 2006). Abies densa showed greater recruitment on the upper distribution limit (>3,900 m) in EH, and Betula utilis in WH indicated shifting of the species towards higher altitude.
The range of Total Basal Area (TBA) in our study is similar to those reported in previous studies: Gairola et al. (2011) (35.08–84.25 m2/ha); Raturi (2012) (3.18–43.62 m2/ha); Pandey et al. (2016) (10.43–248.41 m2/ha); Malik and Bhatt (2015) (10.49–42.92 m2/ha) from various parts of IHR. The maximum number of individuals of any species in a particular forest, if represented by higher diameter classes, is considered the population of that species on the verge of population decline (Benton and Werner, 1976). The dominance of tree individuals in medium to lower diameter classes suggests that the forest is still in an evolving stage. TBA of tree species was found to be comparatively low compared to previous studies, which may be due to (i) the sparsely distribution of tree species with low girth classes (Gaire et al., 2010; Rai et al., 2012), (ii) human disturbance (Benton and Werner, 1976; Rawal et al., 2018), and (iii) higher rates of mortality relative to tree growth (Acharya et al., 2011). The relatively lower basal cover of the trees >3,500 m may be the result of the higher density of young individuals and the effect of cold and harsh climatic conditions.
Size class distribution of trees provides the population structure of forests (Saxena and Singh, 1984), and is extensively used to understand regeneration status (Veblen, 1997). The health of any forest depends on the regeneration potential of tree species and their proportional distribution among different age classes (seedlings, saplings, juveniles, and trees) in space and time (Enright and Watson, 1991; Negi and Maikhuri, 2017; Rawal et al., 2023). The proportion of different life stages of tree species facilitates possible future forest composition and also indicates their stability (Gairola et al., 2011; Negi et al., 2018a). In our study, a fair regeneration pattern was exhibited at most sites, but was also found to be poor for many species, particularly in sub-tropical zone. The poor regeneration at lower altitudes near settlements can be attributed to various environmental factors, including anthropogenic activities. Heavy browsing by animals at seedling and sapling stages is also responsible for poor recruitment of seedlings (Negi et al., 2018b). The presence of a higher density of seedlings and saplings signifies a healthy, growing forest. Good regeneration of a few species, such as Abies densa, Betula utilis, Rhododendron lanatum, Rhododendron arboreum, and Betula alnoides at higher altitudes (> 3,200 m), is attributed to low competition among the species and the complete absenence of anthropogenic disturbances. Another reason is the fact that Pinaceae have better regeneration potential compared to other tree species and are less likely to be affected by herbivores, according to Begon et al. (2006). Acer laevigatum, Prunus nepalensis, and Viburnum sympodiale were among the new regenerating species at 2,100, 3,300, and 3,400 m, respectively, indicating a shift of these species towards higher altitudes. Among these, Viburnum sympodiale was present at 3,100 m, and the appearance of the seedlings of this species at 3,400 m indicates upward movement of the species. The climatic variables prevailing above 3,500 m and up to 4,000 m are favorable for the growth of Abies densa. The species shifting towards higher elevations, coping with the changing climate, can be a factor in the accumulation of a higher number of young individuals in these elevations.
Population structure studies of any forest are keys to understanding the mechanisms of species coexistence, development within the community, and long-term ecological processes (Enright and Watson, 1991; Rai et al., 2012). Further, the size class distribution of trees provides the population structure of forests and is extensively used to understand regeneration status (Bhutia et al., 2019). Tree species that are represented by all girth classes constitute continuous regeneration, while reverse trends constitute discontinuous regeneration (Benton and Werner, 1976). The reverse J-shaped population structure in the present study shows these species are in the most dominant form in the stand and indicate a good regeneration pattern, as indicated in earlier studies (Saxena and Singh, 1984; Tesfaye et al., 2002). The reverse J-shaped distribution of species indicates uneven-aged forests (Vetaas, 2000), with a sufficient number of young individuals to replace the old mature stands. A hill-shaped curve was observed between 2,100–3,500 m due to the accumulation of individuals in the sapling stage and their decline towards both higher tree classes and seedling; this is a scenario undesirable for a sustainable forest. This type of structure indicates replacement in tree size classes, and if the current state of seedling recruitment does not improve, the population may face problems in the long-term (Negi and Maikhuri, 2017; Negi et al., 2018a). One potential factor for the absence of large trees could be the practice of cardamom (Amomum subulatum Roxb.) cultivation mainly in the low-altitude forest of Sikkim (Bhutia et al., 2019), as forests are partially cleared for its cultivation (Kanade and John, 2018). Furthermore, the drying of cardamom demands a substantial supply of fuelwood, often generated from the nearby forests in lower elevations.
A large number of juveniles relative to adults indicates that a population is in a stable or growing stage, while a few juveniles suggest a decline trend in the population. The forest structure above >3,500 m is expanding in nature, with more individuals in the seedling and sapling stages, followed by a decline in the tree size classes, indicating the movement of dominant tree species towards higher altitudes. This could be due to the convergence point of two different forest types or ecotones. However, long-term ecological monitoring is required to documents the spatial changes in the forest dynamics and to suggest better management and conservation strategies (Negi et al., 2023). Benton and Werner (1976) reported that the higher number of individuals of any species in higher girth classes represents a declining population of the dominant species in a particular forest stand. Many tree species in the study area showed ‘poor’ regeneration; even some species were not regenerating at their respective transects, which is a matter of concern.
5 Conclusion
Tree species diversity, size class distribution, and basal area are the essential attributes that describe a forest’s ecosystem, and measuring these attributes is fundamental to designing conservation strategies. Our study is able to provide an understanding of the forest composition, diversity, structure, and regeneration of forest trees along the altitudinal gradient. The study concludes the following: (i) patterns of vegetation vary considerably across sites and along elevations, thereby suggesting a stronger influence of micro-level factors and climatic conditions, (ii) tree species richness and diversity shows a low plateau with a linear decreasing pattern above 1,500 m along the elevation gradient, (iii) density did not follow a uniform pattern; however, it was found to be highest at higher altitudes due to the minimum level of anthropogenic pressure and uniform climatic conditions, (iv) tree species exhibits fair regeneration at many sites in the sub-tropical zone, and good regeneration in the temperate zone. Many species were not regenerating, which indicated need for special conservation measures, (iv) disparity in the size class distribution was observed among forests along the altitudinal gradient, (v) β-diversity patterns revealed that the species replacement rate was less in the mid-altitude compared to the lower and higher altitudes, and (vi) a reverse J-shape distribution of tree diameter, signifying the unevenness of age, particularly at lower altitudes. Our study highlights conservation concerns for the low-altitude forests that record high species diversity, although they lack large-diameter trees. Population structure above >3,500 m is expanding in nature, with more individuals in seedling and sapling stages, followed by a decline in tree size classes. This indicates an upward movement of tree species towards higher altitudes. However, long-term monitoring of seedling dynamics would help to predict potential changes in tree species distribution and the stability of the forest ecosystem under climate change regimes.
Data availability statement
The original contributions presented in the study are included in the article/Supplementary material, further inquiries can be directed to the corresponding authors.
Author contributions
VN: Conceptualization, Data curation, Formal analysis, Investigation, Methodology, Project administration, Supervision, Writing – original draft, Writing – review & editing. AP: Writing – review & editing. AS: Writing – review & editing, Formal analysis, Methodology. AB: Writing – review & editing, Data curation. DP: Writing – review & editing, Data curation. KG: Software, Writing – review & editing. ZW: Writing – review & editing. JB: Writing – review & editing. SS: Funding acquisition, Writing – review & editing. HY: Writing – review & editing.
Funding
The author(s) declare financial support was received for the research, authorship, and/or publication of this article. The authors extend their appreciation to the Deanship of Scientific Research at King Khalid University for funding this work through a Large Group Research Project under grant number (RGP2/90/44).
Acknowledgments
We are thankful to the Director G.B. Pant National Institute of Himalayan Environment (NIHE), Kosi-Katarmal, Almora for facilities. The authors are extremely thankful to late Dr. R.S. Rawal (former Director, GBP-NIHE) for conceptualisation of the study, guidance and encouragement. The authors acknowledge NMSHE Task force 3 ‘Forest Resource and Plant Biodiversity – Phase II, DST, New Delhi, Govt. of India. We thanks to Ms. Sandhya Rai, Dr. Devendra Kumar (Scientist), Ms. Prashanti Pradhan and Mr. Bhim Pandey for assisting during field work (Sikkim Regional Center, GBP-NIHE). We are extremely thankful to Sikkim Forest Department for providing permission to conduct the study.
Conflict of interest
The authors declare that the research was conducted in the absence of any commercial or financial relationships that could be construed as a potential conflict of interest.
Publisher’s note
All claims expressed in this article are solely those of the authors and do not necessarily represent those of their affiliated organizations, or those of the publisher, the editors and the reviewers. Any product that may be evaluated in this article, or claim that may be made by its manufacturer, is not guaranteed or endorsed by the publisher.
Supplementary material
The Supplementary material for this article can be found online at: https://www.frontiersin.org/articles/10.3389/ffgc.2024.1381488/full#supplementary-material
References
Acharya, B. K., Chettri, B., and Vijayan, L. (2011). Distribution pattern of trees along an elevation gradient of eastern Himalaya, India. Acta Oecol. 37, 329–336. doi: 10.1016/j.actao.2011.03.005
Ahirwal, J., Nath, A., Brahma, B., Deb, S., Sahoo, U. K., and Nath, A. J. (2021). Patterns and driving factors of biomass carbon and soil organic carbon stock in the Indian Himalayan region. Sci. Total Environ. 770:145292. doi: 10.1016/j.scitotenv.2021.145292
Antonelli, A., Kissling, W. D., Flantua, S. G., Bermúdez, M. A., Mulch, A., Muellner-Riehl, A. N., et al. (2018). Geological and climatic influences on mountain biodiversity. Nat. Geosci. 11, 718–725. doi: 10.1038/s41561-018-0236-z
Begon, M., Townsend, C. R., and Harper, J. L. (2006) Ecology: from individuals to ecosystems. Blackwell Scientific Publications, Oxford.
Behera, M. D., and Kushwaha, S. P. S. (2006). An analysis of altitudinal behavior of tree species in Subansiri district, eastern Himalaya. Biodivers. Conserv., 277–291. doi: 10.1007/s10531-006-9083-0
Behera, M. D., Kushwaha, S. P. S., and Roy, P. S. (2002). High plant endemism in Indian hotspot-eastern Himalaya. Biodivers. Conserv. 11, 669–682. doi: 10.1023/A:1015596309833
Bhandari, B. S. (2020). Natural regeneration dynamics of tree species along the altitudinal gradient in a subtropical moist deciduous forest of northern India. Curr. Sci. (00113891) 119. doi: 10.18520/cs/v119/i12/2014-2019
Bhattarai, K. R., and Vetaas, O. R. (2006). Can Rapoport’s rule explain tree species richness along the Himalayan elevational gradient, Nepal? Divers. Distrib. 12, 373–378. doi: 10.1111/j.1366-9516.2006.00244.x
Bhutia, Y., Gudasalamani, R., Ganesan, R., and Saha, S. (2019). Assessing forest structure and composition along the altitudinal gradient in the state of Sikkim, eastern Himalayas, India. Forests 10:633. doi: 10.3390/f10080633
Cardelus, C. L., Colwell, R. K., and Watkins, J. E. (2006). Vascular epiphyte distribution patterns: explaining the mid elevation richness peak. J. Ecol. 94, 144–156. doi: 10.1111/j.1365-2745.2005.01052.x
Chakraborty, A., Saha, S., Sachdeva, K., and Joshi, P. K. (2018). Vulnerability of forests in the Himalayan region to climate change impacts and anthropogenic disturbances: a systematic review. Reg. Environ. Chang. 18, 1783–1799. doi: 10.1007/s10113-018-1309-7
Cirimwami, L., Doumenge, C., Kahindo, J. M., and Amani, C. (2019). The effect of elevation on species richness in tropical forests depends on the considered lifeform: results from an east African mountain forest. Trop. Ecol. 60, 473–484. doi: 10.1007/s42965-019-00050-z
Clifford, H. T., and Stephenson, W. (1975) An introduction to numerical classification. London: Academic Press
Curtis, J. T., and McIntosh, R. P. (1950). The interrelations of certain analytic and synthetic phytosociological characters. Ecology 31, 434–455. doi: 10.2307/1931497
Enright, N. J., and Watson, A. D. (1991). A matrix model analysis for the tropical tree Araucaria cunninghamii. Aust. J. Ecol. 16, 507–520. doi: 10.1111/j.1442-9993.1991.tb01080.x
Forrester, D. I., Tachauer, I. H. H., Annighoefer, P., Barbeito, I., Pretzsch, H., Ruiz-Peinado, R., et al. (2017). Generalized biomass and leaf area allometric equations for European tree species incorporating stand structure, tree age and climate. For. Ecol. Manag. 396, 160–175. doi: 10.1016/j.foreco.2017.04.011
Gaire, N. P., Dhakal, Y. R., Lekhak, H. C., Bhuju, D. R., and Shah, S. K. (2010). Vegetation dynamics in treeline ecotone of Langtang National Park, Central Nepal. Nepal J. Sci. Technol. 11, 107–114. doi: 10.3126/njst.v11i0.4132
Gaire, N. P., Koirala, M., Bhuju, D. R., and Borgaonkar, H. P. (2014). Treeline dynamics with climate change at the central Nepal Himalaya. Clim. Past 10, 1277–1290. doi: 10.5194/cp-10-1277-2014
Gairola, S., Rawal, R. S., Todaria, N. P., and Bhatt, A. (2014). Population structure and regeneration patterns of tree species in climate-sensitive subalpine forests of Indian western Himalaya. J. For. Res. 25, 343–349. doi: 10.1007/s11676-014-0463-0
Gairola, S., Sharma, C. M., Suyal, S., and Ghildiya, S. K. (2011). Species composition and diversity in mid-altitudinal moist temperate forests of the western Himalaya. J. For. Environ. Sci. 27, 1–15.
Gentili, R., Baroni, C., Caccianiga, M., Armiraglio, S., Ghiani, A., and Citterio, S. (2015). Potential warm-stage microrefugia for alpine plants: feedback between geomorphological and biological processes. Ecol. Complex. 21, 87–99. doi: 10.1016/j.ecocom.2014.11.006
Ghildiyal, S., Baduni, N. P., Khanduri, V. P., and Sharma, C. M. (1998). Community structure and composition of oak forests along altitudinal gradient in Garhwal Himalaya. Indian J. For. 21, 242–247.
Greig-Smith, P. (1983) Quantitative plant ecology. 3rd ed. University of California Press, Berkeley, CA.
Guo, O., Kelt, D. A., Sun, Z., Liu, H., Hu, L., Ren, H., et al. (2013). Global variation in elevational diversity patterns. Sci. Rep. 3. doi: 10.1038/srep03007
Hubbell, S. P., Foster, R. B., O'Brien, S. T., Harms, K. E., Condit, R., Wechsler, B., et al. (1999). Light-gap disturbances, recruitment limitation, and tree diversity in a neotropical forest. Science 283, 554–557. doi: 10.1126/science.283.5401.554
Jetz, W., and Rahbek, C. (2002). Geographic range size and determinants of avian species richness. Science 297, 1548–1551. doi: 10.1126/science.1072779
Kanade, R., and John, R. (2018). Topographical influence on recent deforestation and degradation in the Sikkim Himalaya in India; implications for conservation of east Himalayan broadleaf forest. Appl. Geogr. 92, 85–93. doi: 10.1016/j.apgeog.2018.02.004
Kessler, M., Kluge, J., Hemp, A., and Ohlemuller, R. (2011). A global comparative analysis of elevational species richness patterns of ferns. Glob. Ecol. Biogeogr. 20, 868–880. doi: 10.1111/j.1466-8238.2011.00653.x
Khan, M. L., Rai, J. P. N., and Tripathi, R. S. (1987). Population structure of some tree species in disturbed and protected sub-tropical forests of north-east India. Acta Oecol. Oecol. Appli. 8, 247–255.
Körner, C. (1998). A re-assessment of high elevation treeline positions and their explanation. Oecologia 115, 445–459. doi: 10.1007/s004420050540
Korner, C. (2000). Why are there global gradients in species richness? Mountains might hold the answer. Trends Ecol. Evol. 15, 513–514. doi: 10.1016/S0169-5347(00)02004-8
Korner, C. (2007). The use of ‘altitude’ in ecological research. Trends Ecol. Evol. 22, 569–574. doi: 10.1016/j.tree.2007.09.006
Körner, C., Jetz, W., Paulsen, J., Payne, D., Rudmann-Maurer, K. M., and Spehn, E. (2017). A global inventory of mountains for bio-geographical applications. Alp. Bot. 127, 1–15. doi: 10.1007/s00035-016-0182-6
Korner, C., and Spehn, E. M. eds., (2019) Mountain biodiversity: a global assessment, vol. 7. London: Routledge
Krömer, T., Acebe, A., Kluge, J., and Kessler, M. (2013). Effects of altitude and climate in determining elevational plant species richness patterns: a case study from Los Tuxtlas, Mexico. Flora 208, 197–210. doi: 10.1016/j.flora.2013.03.003
Krug, A. Z., Jablonski, D., and Valentine, J. W. (2008). Species–genus ratios reflect a global history of diversification and range expansion in marine bivalves. Proc. R. Soc. B Biol. Sci. 275, 1117–1123. doi: 10.1098/rspb.2007.1729
Lee, C. B., and Chun, J. H. (2016). Environmental drivers of patterns of plant diversity along a wide environmental gradient in Korean temperate forests. Forests 7:19. doi: 10.3390/f7010019
Malik, Z. A., and Bhatt, A. B. (2015). Phytosociological analysis of woody species in Kedarnath wildlife sanctuary and its adjoining areas in western Himalaya, India. J. For. Environ. Sci. 31, 149–163. doi: 10.7747/JFES.2015.31.3.149
Malizia, A., Blundo, C., Carilla, J., Osinaga Acosta, O., Cuesta, F., Duque, A., et al. (2020). Elevation and latitude drives structure and tree species composition in Andean forests: results from a large-scale plot network. PLoS One 15:0231553. doi: 10.1371/journal.pone.0231553
Mayer, J. D., Salovey, P., Caruso, D. R., and Sternberg, R. J. (2000). “Models of emotional intelligence” in Handbook of intelligence. ed. R. J. Sternberg (Cambridge: Cambridge University Press)
McCain, C. M., and Grytnes, J. A. (2010). Elevational gradients in species richness. Encycl. Life Sci. (ELS), 1–10.
Mena, J. L., and Vázquez-Domínguez, E. (2005). Species turnover on elevational gradients in small rodents. Glob. Ecol. Biogeogr. 14, 539–547. doi: 10.1111/j.1466-822X.2005.00189.x
Mittermeier, R. A., Myers, N., Mittermeier, C. G., and Robles Gil, P. (1999) Hotspots: Earth's biologically richest and most endangered terrestrial ecoregions. CEMEX, S.A., Agrupación Sierra Madre, SC, Mexico City.
Mueller Dombois, D., and Ellenberg, H. (1974) Aims and methods of vegetation ecology. Hoboken, NJ: John Wiley & Sons, Inc.
Negi, V. S., Giri, L. S., and Sekar, K. C. (2018a). Floristic diversity, community composition and structure in Nanda Devi National Park after prohibition of human activities, western Himalaya, India. Curr. Sci. 115, 1056–1059. doi: 10.18520/cs/v115/i6/1056-1064
Negi, V. S., Joshi, B. C., Pathak, R., Rawal, R. S., and Sekar, K. C. (2018b). Assessment of fuel wood diversity and consumption patterns in cold desert part of Indian Himalaya: implication for conservation and quality of life. J. Clean. Prod. 196, 23–31. doi: 10.1016/j.jclepro.2018.05.237
Negi, V. S., and Maikhuri, R. K. (2017). Forest resources consumption pattern in Govind wildlife sanctuary, Western Himalaya, India. J. Environ. Plan. Manag. 60, 1235–1252. doi: 10.1080/09640568.2016.1213707
Negi, V. S., Rana, S. K., Dangwal, B., Thakur, S., Sekar, K. C., and Bhatt, I. D. (2023). Long-term ecological monitoring and observation: a review in the context of Indian Himalaya. Curr. Sci. 125, 623–634.
Odum, E. P. (1971) Fundamentals of ecology. Third Edition, W.B. Saunders Co., Philadelphia, PA, 1–574.
Oommen, M. A., and Shanker, K. (2005). Elevational species richness patterns emerge from multiple local mechanisms in Himalayan woody plants. Ecology 86, 3039–3047. doi: 10.1890/04-1837
Pandey, K. P., Adhikari, Y. P., and Weber, M. (2016). Structure, composition and diversity of forest along the altitudinal gradient in the Himalayas, Nepal. Appl. Ecol. Environ. Res. 14, 235–251. doi: 10.15666/aeer/1402_235251
Pandey, A., Badola, H. K., Rai, S., and Singh, S. P. (2018a). Timberline structure and woody taxa regeneration towards treeline along latitudinal gradients in Khangchendzonga National Park, eastern Himalaya. PLoS One 13:e0207762. doi: 10.1371/journal.pone.0207762
Pandey, A., Rai, S., and Kumar, D. (2018b). Changes in vegetation attributes along an elevation gradient towards timberline in Khangchendzonga National Park, Sikkim. Trop. Ecol. 59, 259–271.
Pant, S., and Sammant, S. S. (2012). Diversity and regeneration status of tree species in Khokhan wildlife sanctuary, north-western Himalaya. Trop. Ecol. 53, 317–331.
Prabha, J., and Jain, A. (2016) Northeast India: a unique biodiversity hotspot. ISBN: 978–93–85822-65-0
Rahbek, C. (2005). The role of spatial scale and the perception of large-scale species richness patterns. Ecol. Lett. 8, 224–239. doi: 10.1111/j.1461-0248.2004.00701.x
Rai, I. D., Adhikari, B. S., Rawat, G. S., and Bargali, K. (2012). Community structure along timberline ecotone in relation to micro-topography and disturbances in Western Himalaya. Not. Sci. Biol. 4, 41–52. doi: 10.15835/nsb427411
Raturi, G. P. (2012). Forest community structure along an altitudinal gradient of district Rudraprayag of Garhwal Himalaya, India. Ecologia 2, 76–84. doi: 10.3923/ecologia.2012.76.84
Rawal, R., Negi, V. S., and Tewari, L. M. (2023). Forest dynamics along altitudinal gradient covering treeline ecotone of Indian western Himalaya. Biologia 78, 3339–3352. doi: 10.1007/s11756-023-01530-3
Rawal, R. S., Rawal, R., Rawat, B., Negi, V. S., and Pathak, R. (2018). Plant species diversity and rarity patterns along altitude range covering treeline ecotone in Uttarakhand: conservation implications. Trop. Ecol. 59, 1–15.
Reshi, Z. A., Badola, H. K., and Rawal, R. S. (2017). “Assessment of vegetation patterns along altitude gradient” in Manual of Field methods – Indian Himalayan timberline project. eds. S. P. Singh and R. S. Rawal (Nainital: Central Himalayan Environment Association), 8–21.
Saxena, A. K., and Singh, J. S. (1984). Tree population structure of certain Himalayan forest associations and implications concerning their future composition. Vegetation 58, 61–69. doi: 10.1007/BF00044928
Scott, N. J. Jr. (1976). The abundance and diversity of the herpetofaunas of tropical forest litter. Biotropica 8, 41–58. doi: 10.2307/2387818
Shaheen, H., Ullah, Z., Khan, S. M., and Harper, D. M. (2012). Species composition and community structure of western Himalayan moist temperate forests in Kashmir. For. Ecol. Manag. 278, 138–145. doi: 10.1016/j.foreco.2012.05.009
Shannon, C. E., and Weaver, W. (1963) The mathematical theory of communication. Urbana, IL: University of Illinois Press.
Singh, S. P., Adhakari, B. S., and Zobel, D. B. (1994). Biomass, productivity, leaf longevity and forest structure in the central Himalaya. Ecol. Monogr. 64, 401–421. doi: 10.2307/2937143
Sinha, S., Badola, H. K., Chhetri, B., Gaira, K. S., Lepcha, J., and Dhyani, P. P. (2018). Effect of altitude and climate in shaping the forest compositions of Singalila National Park in Khangchendzonga landscape, eastern Himalaya, India. J. Asia-Pac. Biodivers. 11, 267–275. doi: 10.1016/j.japb.2018.01.012
Spehn, E. (2011) Mountain biodiversity: effects of climate change and how to manage them, vol. 60, pp.40–43.
Tang, L., Dengwu, T. L., and Meng, X. (2014). Elevational patterns of plant richness in the Taibai Mountain, China. Sci. World J. 2014:309053. doi: 10.1155/2014/309053
Tesfaye, G., Teketay, D., and Fetene, M. (2002). Regeneration of fourteen tree species in Harenna forest, southeastern Ethiopia. Flora: Morphol. Distrib. Funct. Ecol. Plants 197, 461–474. doi: 10.1078/0367-2530-1210063
Trigas, P., Panitsa, M., and Spyros, T. (2013). Elevational gradient of vascular plant species richness and endemism in Crete – the effect of post-isolation mountain uplift on a continental island system. PLoS One 8:e59425. doi: 10.1371/journal.pone.0059425
Uniyal, P., Pokhriyal, P., Dasgupta, S., Bhatt, D., and Todaria, N. P. (2010). Plant diversity in two forest types along the disturbance gradient in Dewalgarh watershed, Garhwal Himalaya. Curr. Sci., 938–943.
Veblen, T. T. (1997). Structure and dynamics of nothofagus forests near timberline in south-central Chile. Ecology 60, 937–945.
Vetaas, O. R. (2000). The effect of environmental factors on the regeneration of Quercus semecarpifolia Sm. in central Himalaya, Nepal. Plant Ecol. 146, 137–144. doi: 10.1023/A:1009860227886
Vetaas, O. R., and Grytnes, J. A. (2002). Distribution of vascular plant species richness and endemic richness along the Himalayan elevational gradient in Nepal. Glob. Ecol. Biogeogr. 11, 291–301. doi: 10.1046/j.1466-822X.2002.00297.x
Wani, Z. A., Khan, S., Bhat, J. A., Malik, A. H., Alyas, T., Pant, S., et al. (2022). Pattern of β-diversity and plant species richness along vertical gradient in northwest Himalaya, India. Biology 11:1064. doi: 10.3390/biology11071064
Wani, S. A., Khuroo, A. A., Zaffar, N., Rafiqi, S., Farooq, I., Afzal, S., et al. (2024). Data synthesis for biodiversity science: a database on plant diversity of the Indian Himalayan region. Biodivers. Conserv., 1–21. doi: 10.1007/s10531-024-02784-2
Wani, Z. A., Negi, V. S., Bhat, J. A., Satish, K. V., Kumar, A., Khan, S., et al. (2023). Elevation, aspect, and habitat heterogeneity determine plant diversity and compositional patterns in the Kashmir Himalaya. Front. For. Glob. Change 6:11. doi: 10.3389/ffgc.2023.1019277
Wani, Z. A., and Pant, S. (2023). Tree diversity and regeneration dynamics in Gulmarg wildlife sanctuary, Kashmir Himalaya. Acta Ecol. Sin. 43, 375–381. doi: 10.1016/j.chnaes.2022.05.003
Whitford, P. B. (1949). Distribution of woodland plants in relation to succession and clonal growth. Ecology 30, 199–208. doi: 10.2307/1931186
Whittaker, R. H. (1975) Communities and ecosystems. 2nd Edition. New York: MacMillan Publishing Company
Keywords: elevation gradient, species richness, population structures, regeneration, conservation
Citation: Negi VS, Pandey A, Singh A, Bahukhandi A, Pharswan DS, Gaira KS, Wani ZA, Bhat JA, Siddiqui S and Yassin HM (2024) Elevation gradients alter vegetation attributes in mountain ecosystems of eastern Himalaya, India. Front. For. Glob. Change. 7:1381488. doi: 10.3389/ffgc.2024.1381488
Edited by:
Gopal Shukla, Uttar Banga Krishi Viswavidyalaya, IndiaCopyright © 2024 Negi, Pandey, Singh, Bahukhandi, Pharswan, Gaira, Wani, Bhat, Siddiqui and Yassin. This is an open-access article distributed under the terms of the Creative Commons Attribution License (CC BY). The use, distribution or reproduction in other forums is permitted, provided the original author(s) and the copyright owner(s) are credited and that the original publication in this journal is cited, in accordance with accepted academic practice. No use, distribution or reproduction is permitted which does not comply with these terms.
*Correspondence: Vikram S. Negi, dmlrcmFtc25lZ2lpQGdtYWlsLmNvbQ==; Zishan Ahmad Wani, emlzaGFud2FuaTc4NkBnbWFpbC5jb20=