- College of Forestry, Shanxi Agriculture University, Jinzhong, China
Introduction: The unmanned aerial vehicle -based light detection and ranging (UAV-LiDAR) can quickly acquire the three-dimensional information of large areas of vegetation, and has been widely used in tree species classification.
Methods: UAV-LiDAR point clouds of Populus alba, Populus simonii, Pinus sylvestris, and Pinus tabuliformis from 12 sample plots, 2,622 tree in total, were obtained in North China, training and testing sets were constructed through data pre-processing, individual tree segmentation, feature extraction, Non-uniform Grid and Farther Point Sampling (NGFPS), and then four tree species were classified efficiently by two machine learning algorithms and two deep learning algorithms.
Results: Results showed that PointMLP achieved the best accuracy for identification of the tree species (overall accuracy = 96.94%), followed by RF (overall accuracy = 95.62%), SVM (overall accuracy = 94.89%) and PointNet++(overall accuracy = 85.65%). In addition, the most suitable number of point cloud sampling of single tree is between 1,024 and 2048 when using the NGFPS method in the two deep learning models. Furthermore, feature value of elev_percentile_99th has an important influence on tree species classification and tree species with similar crown structures may lead to a higher misidentification rate.
Discussion: The study underscores the efficiency of PointMLP as a robust and streamlined solution, which offers a novel technological support for tree species classification in forestry resource management.
1 Introduction
The accurate classification of tree species is crucial for the effective management of forest resources and the timely monitoring of species diversity (Tewari, 2016; Shi et al., 2020). Light detection and ranging (LiDAR) has emerged as a leading technology for tree species classification owing to its advantages in data collection, such as a large detection range, high measurement accuracy, and fine temporal and spatial resolution (Drake et al., 2002; Dalponte et al., 2012). Notably, the rapid advancements in unmanned aerial vehicle LiDAR (UAV-LiDAR) technology, characterized by its superior timeliness and mobility, have established a robust foundation for enhancing the efficiency of forest field surveys and the accuracy of tree species classification (Kukkonen et al., 2024). Over the past two decades, researchers have used UAV-LiDAR data to explore the possibilities of different classification methods for tree species.
Machine learning methods, such as Support Vector Machines (SVM) (Vaughn et al., 2012; Rust and Stoinski, 2024), Random Forest (RF) (Vauhkonen et al., 2010), and Extreme Gradient Boosting (XGBoost) (Lin et al., 2023; Ou et al., 2023) have been extensively used for tree species classification using LiDAR data. Rust and Stoinski (2024) used four machine learning algorithms based on terrestrial laser scanning (TLS) to classify four tree species in Poland. The highest overall accuracy (OA) was achieved with XGBoost at 96%, followed by SVM at 92%. Yu et al. (2017) employed RF with a selection of 15 optimal features, including LiDAR height features, laser penetration index, and density features, to distinguish between Scots pine, Norway spruce, and birch, achieving an OA of 90.5%. Machine learning algorithms can achieve a classification accuracy of over 80% (Yao et al., 2012; Blomley et al., 2017).
While the development of deep learning algorithms continues to progress rapidly, especially those based on multiple perspectives and voxel structures, there remains a challenge of potential information loss when converting point clouds into structured formats like 2D grids or 3D voxels (Bello et al., 2020; Ning et al., 2023). PointNet, introduced by Qi et al. (2017a), stands out as a deep learning classification approach specifically tailored for the direct processing of point clouds. However, its ability to classify local, finegrained patterns and generalize to complex scenes is somewhat limited. In contrast, the enhanced PointNet++ (Qi et al., 2017b), which has emerged as an advancement over PointNet, demonstrates significant improvement in accuracy when classifying individual objects and semantically labeling largescale point clouds. Building upon the foundation laid by PointNet and PointNet++, Ma et al. (2022) proposed PointMLP, a succinct and efficient deep residual multilayer perceptron network. This addresses concerns such as intensive computation for local feature extraction and seamless memory access. The performance of these models is impressive. The PointNet++ model achieved classification accuracy of 90.7% on the ModelNet40 dataset and 84.5% on the ScanNet dataset (Qi et al., 2017b). Meanwhile, the PointMLP model surpassed this, achieving classification accuracies of 94.5% on the ModelNet40 dataset and 85.4% on the ScanObjectNN dataset (Ma et al., 2022). Briechle et al. (2020) used the PointNet++ model to perform semantic labeling of coniferous and deciduous trees in UAV-LiDAR data, achieving classification accuracies of 90 and 81%, respectively. Additionally, Xi et al. (2020) conducted a comprehensive analysis comparing seven deep learning models and six machine learning models for tree species classification. The findings revealed that the PointNet++ model exhibited the highest accuracy. Currently, these methods are relatively less used in tree classification and exhibit many problems, but could automatically learn high-level features and fully exploit the three-dimensional structural information of point cloud data, thus enhancing the model’s generalization ability and improving the classification accuracy. Therefore, direct exploration of deep learning tree species classification models based on point clouds holds significant research implications.
The classification task based on multilayer perceptron (MLP) necessitates a fixed number of points in the single tree sample of the input model during each full training and testing session. This requirement has led scholars to conduct extensive research on point cloud sampling. Seidel et al. (2021) input 2048 points into PointNet to classify seven tree species, achieving a classification accuracy of 83% for Quercus rubra. Xi et al. (2020) employed K-means clustering to reduce the number of points in a single tree to 2048, and the highest tree classification accuracy (mIoU of 0.906) was achieved using the PointNet++. Chen et al. (2021) utilized an improved farthest point sampling method to classify birch and larch species. This method was used to downsample the single tree point cloud, and when the sampling point density was 2048 points, the accuracy evaluation indices reached their maximum value. Lv et al. (2022) proposed a feature descriptor based on the convex hull to process individual tree point clouds to 2048 points and input it into the PointNet + + model for tree species classification. This model expands the input features of the sample point cloud, improving the classification accuracy from 72.7 to 86.6%. Liu et al. (2022) compared the overall classification accuracy of tree species classification with various methods, including farther point sampling (FPS), K-means, grid average sampling, and nonuniform grid and farther point sampling (NGFPS). Among these, NGFPS, which reduced the number of points to 2048, achieved the best classification accuracy.
A series of comparative trials were designed in the study to address the problems and shortcomings of the current reaches. Based on UAV-LiDAR data, four key protected forests, Populus alba, Populus simmonii, Pinus sylvestris, and Pinus tabulformis were selected as research objects, then machine learning and deep learning techniques were used to classify four tree species in northern China. The main objectives of this paper are as follows: (1) to evaluate the accuracy of machine learning and deep learning algorithms in classifying tree species using UAV-LiDAR data; (2) to investigate the effect of different sampling points of NGFPS on the classification accuracy of deep learning; and (3) to classify the optimal machine learning and deep learning models through a series of metrics. Overall, this study aims to enhance the accuracy and effectiveness of tree species classification and to bolster the management of fragile forest ecosystems in the study area.
2 Materials
2.1 Study area
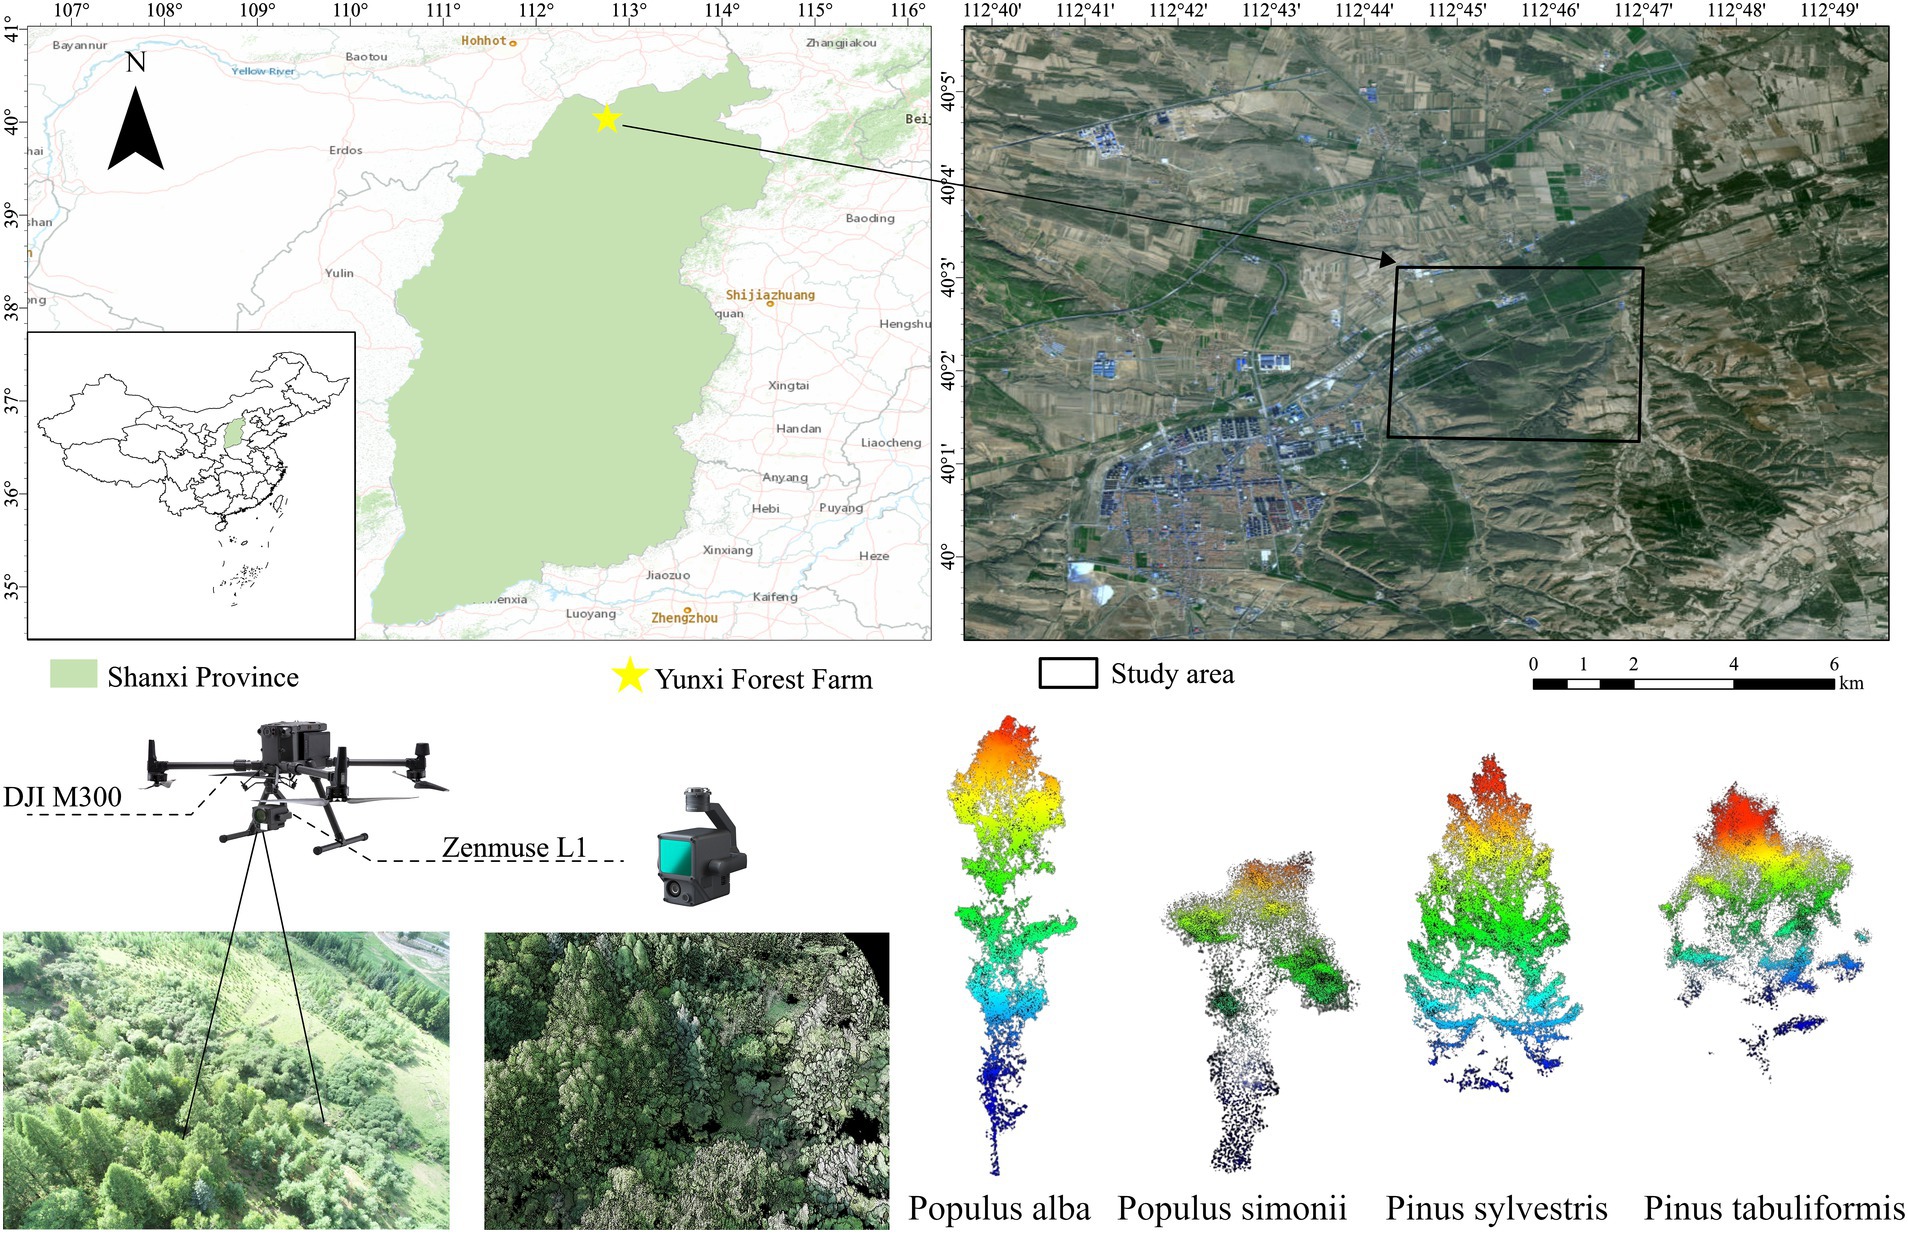
The study area is located in the Yunxi State-owned Forest Farm in Datong City, Shanxi Province (112°14′ E ~ 112°59′ E, 39°40′ N ~ 40°04′ N), which is a part of the northern of China, as depicted in Figure 1. This region has a temperate semiarid climate, characterized by an annual average temperature of 6.1°C, a frost-free period of 110 days, and an annual average rainfall of 390 mm, primarily concentrated from July to September. The area experiences windy and sandy conditions in spring, severe cold with minimal snowfall in winter, and severe drought. The predominant soil types are chestnut soil and chestnut cinnamon soil, which are mostly alkaline with a pH range of 7.5–9.0. The tree species in the study area are mainly Populus alba, Populus simonii, Pinus sylvestris, and Pinus tabuliformis. They are all planted for blocking wind and dust storm, also the important ecological barrier in North China. Populus simonii is 31 years old and has already entered the mature stage in the sample plots. Due to the occurrence of diseases and pests, the physiological function has declined, and the phenomenon of dry and dying shoots has appeared, which is called “small old tree.” Populus alba crown is narrow cylinder or spire- shaped, tall and straight, growing well. The trees of Pinus sylvestris and Pinus tabuliformis are 25 years old and 28 years old respectively, which belong to middle-aged forests and enter the vigorous growth stage. The tree shape of the two trees is slightly different, the crown of Pinus sylvestris is spire shaped, while that of Pinus tabuliformis is tower shaped, with obvious tree rings and large branches spreading out.
2.2 Data collection and preprocessing
2.2.1 Field data
The sample plot survey data were collected in August 2023. A total of 12 sample plots of 20 m × 30 m were established according to the distribution of Populus alba, Populus simonii, Pinus sylvestris, and Pinus tabuliformis. Within each sample plot, all trees with a diameter at breast height (DBH) greater than 5 cm were measured, during which important indicators such as DBH, tree height, and crown width were recorded. In addition, the absolute positions of the four corners in each sample plot and the coordinates of each tree were marked using a real-time kinetic (RTK) GNSS (CHCNAV K80, Shanghai, China). There were 2,622 trees measured in the plot (see Table 1).
2.2.2 UAV-LiDAR data
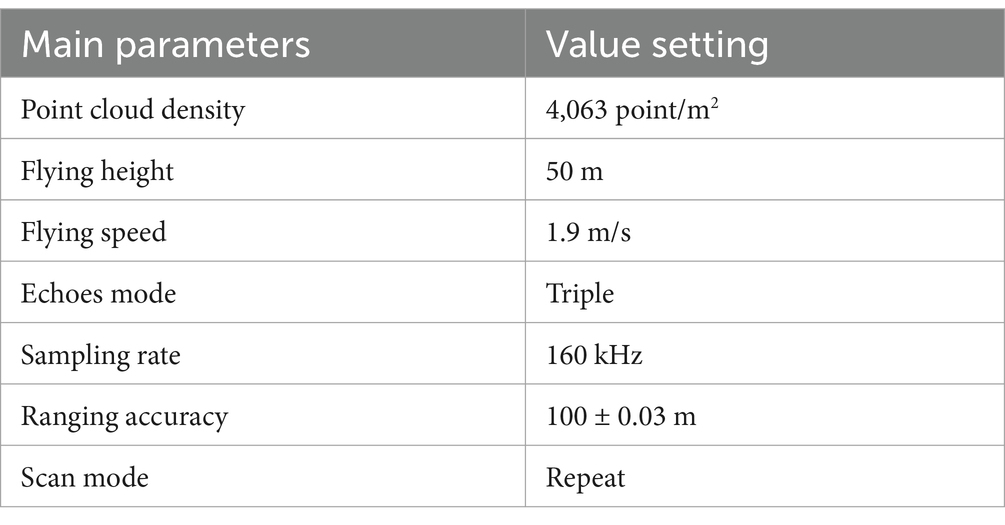
The LiDAR data utilized in the experiment was acquired using a Zenmuse L1 laser radar mounted on a DJI M300 RTK. A continuous rectangular area containing three tree species was chosen as the data collection site. The scanning was conducted on August 1, 2023 in the morning when the weather was clear and there was no wind. We did not set up a base station because the drone has its own network RTK. A normal flight pattern was adopted, with the altitude of the simulated flight route set to 50 m. The vehicle speed was maintained at 1.9 m/s, and the laser side overlap rate was 80% to maximize efficiency during data acquisition. The sample rate was set at 160 kHz, and a three-echo mode was adopted. The scanning mode was repetitive, and the point cloud density was 4,063 points/m2. A repetitive scanning mode was set to generate a color point cloud. The original data obtained comprised a set of files, including laser data, RTK data, camera calibration data, etc. The standard format file of LiDAR (*. LAS) can be obtained through the reconstruction of DJI Terra. The details of the parameters are shown in Table 2.
3 Methods
The overall flowchart of the study is shown in Figure 2. The study first preprocessed the raw UAV-LiDAR data by using LiDAR360. This process yields a single-timber point cloud and extracts single-timber features, including height and intensity features, totaling 101. A downsampling strategy, NGFPS, which combines nonuniform grid and farthest point sampling, is implemented using Python and MATLAB. Tree species classification using machine learning and deep learning models of single tree point cloud data. The final step involves analyzing and evaluating the classification results.
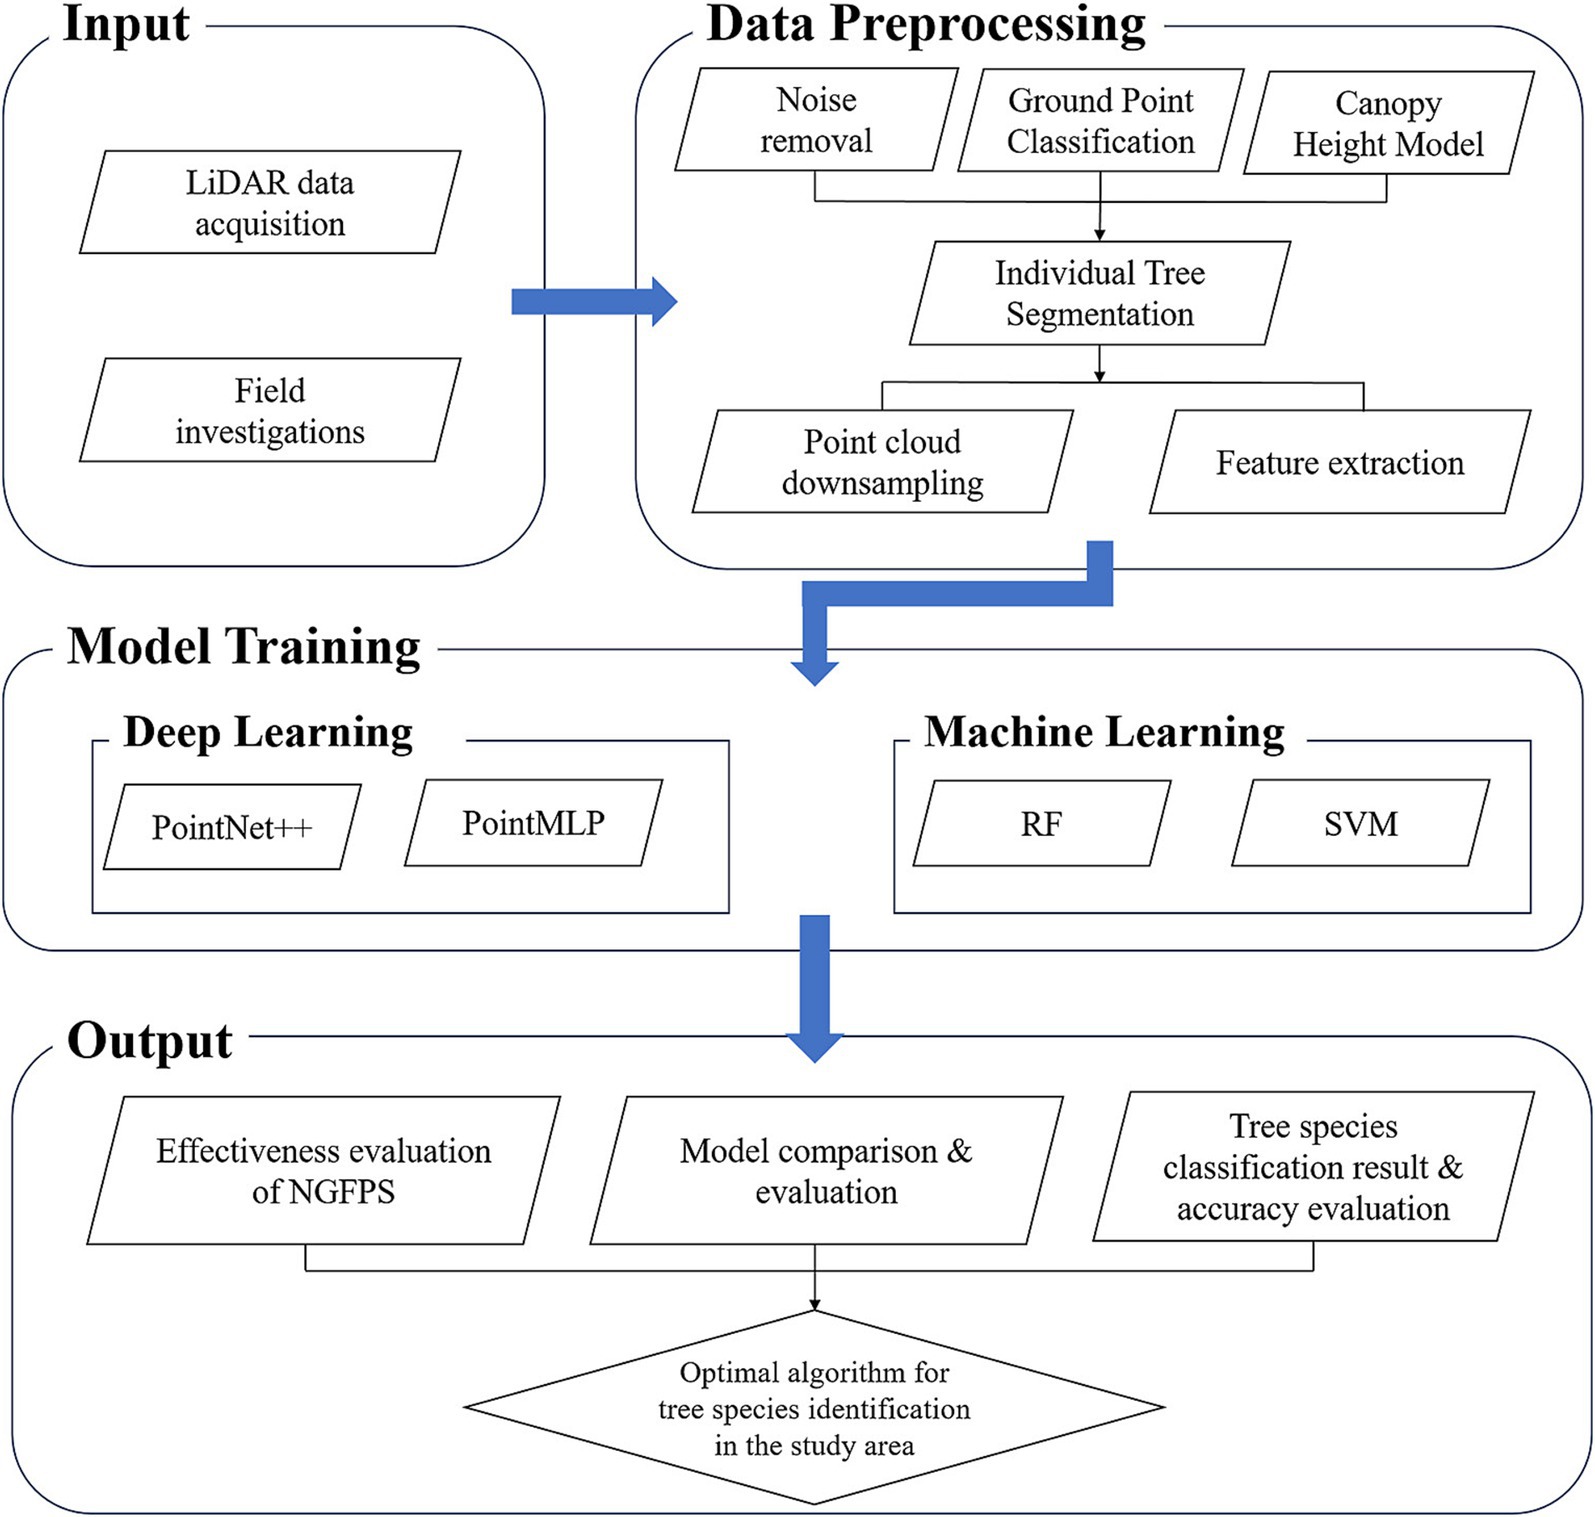
Figure 2. An overview of the workflow for individual tree points cloud-based tree species classification.
The deep learning framework and machine learning framework used for the experiments was PyTorch (2.1.2 + CUDA 12.1). Windows 10 was used for the experiments, and the computer configuration was as follows: Intel Xeon Gold 5,218 CPU, 128 GB of RAM, and an NVIDIA RTX A4000 (16 GB).
3.1 Lidar data preprocessing
3.1.1 Denoising
The K-nearest neighbor (KNN) denoising method searches for adjacent points within a specified neighborhood for each point. It calculates the mean distance (D) from the point to its neighbors, as well as the median (DMean) and standard deviation (S). If D exceeds the maximum distance (DMax), it is classified as noise and removed (Zhao et al., 2016). The neighborhood consists of 10 points, and the difference multiple was set at 5.
3.1.2 Ground point classification
For effective execution of subsequent experiments, it is crucial to separate the ground points. The traditional filtering algorithm uses slope and elevation differences to distinguish between ground and nonground points. However, this approach results in subpar filtering in complex scenes and steep terrain areas. The cloth simulation filter (CSF) is a simple physical simulation-based solution (Zhang et al., 2016). It inverts the original LiDAR point cloud, and a cloth falls onto the inverted point cloud surface. The final shape of the cloth, determined by the interaction between the nodes, cloth, and corresponding LiDAR points, helps divide the original point cloud into ground and nonground points. The algorithm relies on two key parameters: grid size and classification threshold. In order to take into account the efficiency and the integrity of the ground retention details, the grid size is set at 1.0 m. The classification threshold is affected by the slope. According to the investigation, the classification threshold is finally set at 0.8 m after many tests. Figure 3 illustrates the ground and high vegetation points.

Figure 3. Schematic of ground point classification, with ground points in yellow and high vegetation points in green (A); CSF filtered ground points (B).
3.1.3 Canopy height model
Canopy Height Model (CHM) is derived by subtracting the raster values of a digital elevation model from those of a digital surface model. This provides a direct representation of the vegetation canopy height distribution above the ground (Yang et al., 2020). The CHM resolution was set at 0.5 m.
3.2 Individual tree segmentation
The watershed algorithm (WA) was employed for individual tree segmentation in the study. WA is an image segmentation algorithm that can detect subtle changes in the gray level of a CHM and generate closed contour lines around target objects (Lu et al., 2014; Hovi et al., 2016). The algorithm automatically constructs a barrier at canopy boundaries to prevent the merging of water from two adjacent tree models. Sigma is a crucial parameter of the algorithm, affecting the number of trees segmented. A small sigma value (Sigma <0.5) can lead to over-segmentation, while a larger value (Sigma >1.5) can result in under-segmentation. Sigma was set to 1, and other parameters in the algorithm took default values.
After obtaining the seed points of individual tree segmentation based on the WA, they are matched with the coordinates and number of measured trees. Over-segmented and under-segmented individual trees are further amended and corrected to obtain high quality individual tree point cloud data.
3.3 Data set creation
After obtaining point clouds of individual tree, the study manually labeled each point cloud file with the specie name of the tree, in conjunction with the records of the field investigation. Eventually, 2,622 individual tree point cloud samples for four tree species in the study area were obtained. A stratified random sampling method was employed within each species, with 80% of each tree species randomly selected as the training data set and the remaining 20% as the test set. The training and test sets were independent and mutually exclusive in all validations.
3.4 Downsampling algorithm
The farthest point sampling (FPS) in the MLP-based deep learning algorithm is a downsampling method based on an even point cloud. As the point cloud density of collected LiDAR data is not uniformly distributed, the points representing the details of objects cannot be fully preserved in tree species classification using only the PFS method. Nonuniform grid sampling (NGS) calculates the normal vector of each point before sampling the point cloud, allowing representative points to be selected from grids of different sizes. Therefore, this study used a downsampling strategy combining a nonuniform grid and farther point sampling (NGFPS) (Liu et al., 2022). The NGS method is first used to obtain the single-point cloud closest to the specified number of points in the single-point cloud. After obtaining a sample with sufficient detail retention, FPS is used to standardize the number of points in the single-point cloud. The number of samples was set to 1,024, 2048, 3,072, 4,096, 5,120, and 6,144.
3.5 Deep learning methods
Two deep learning algorithms (PointNet++ and PointMLP) are used, both of which are tree classification methods based on downsampling. PointMLP and PointNet++ have similar design concepts, but PointMLP has a simpler network architecture.
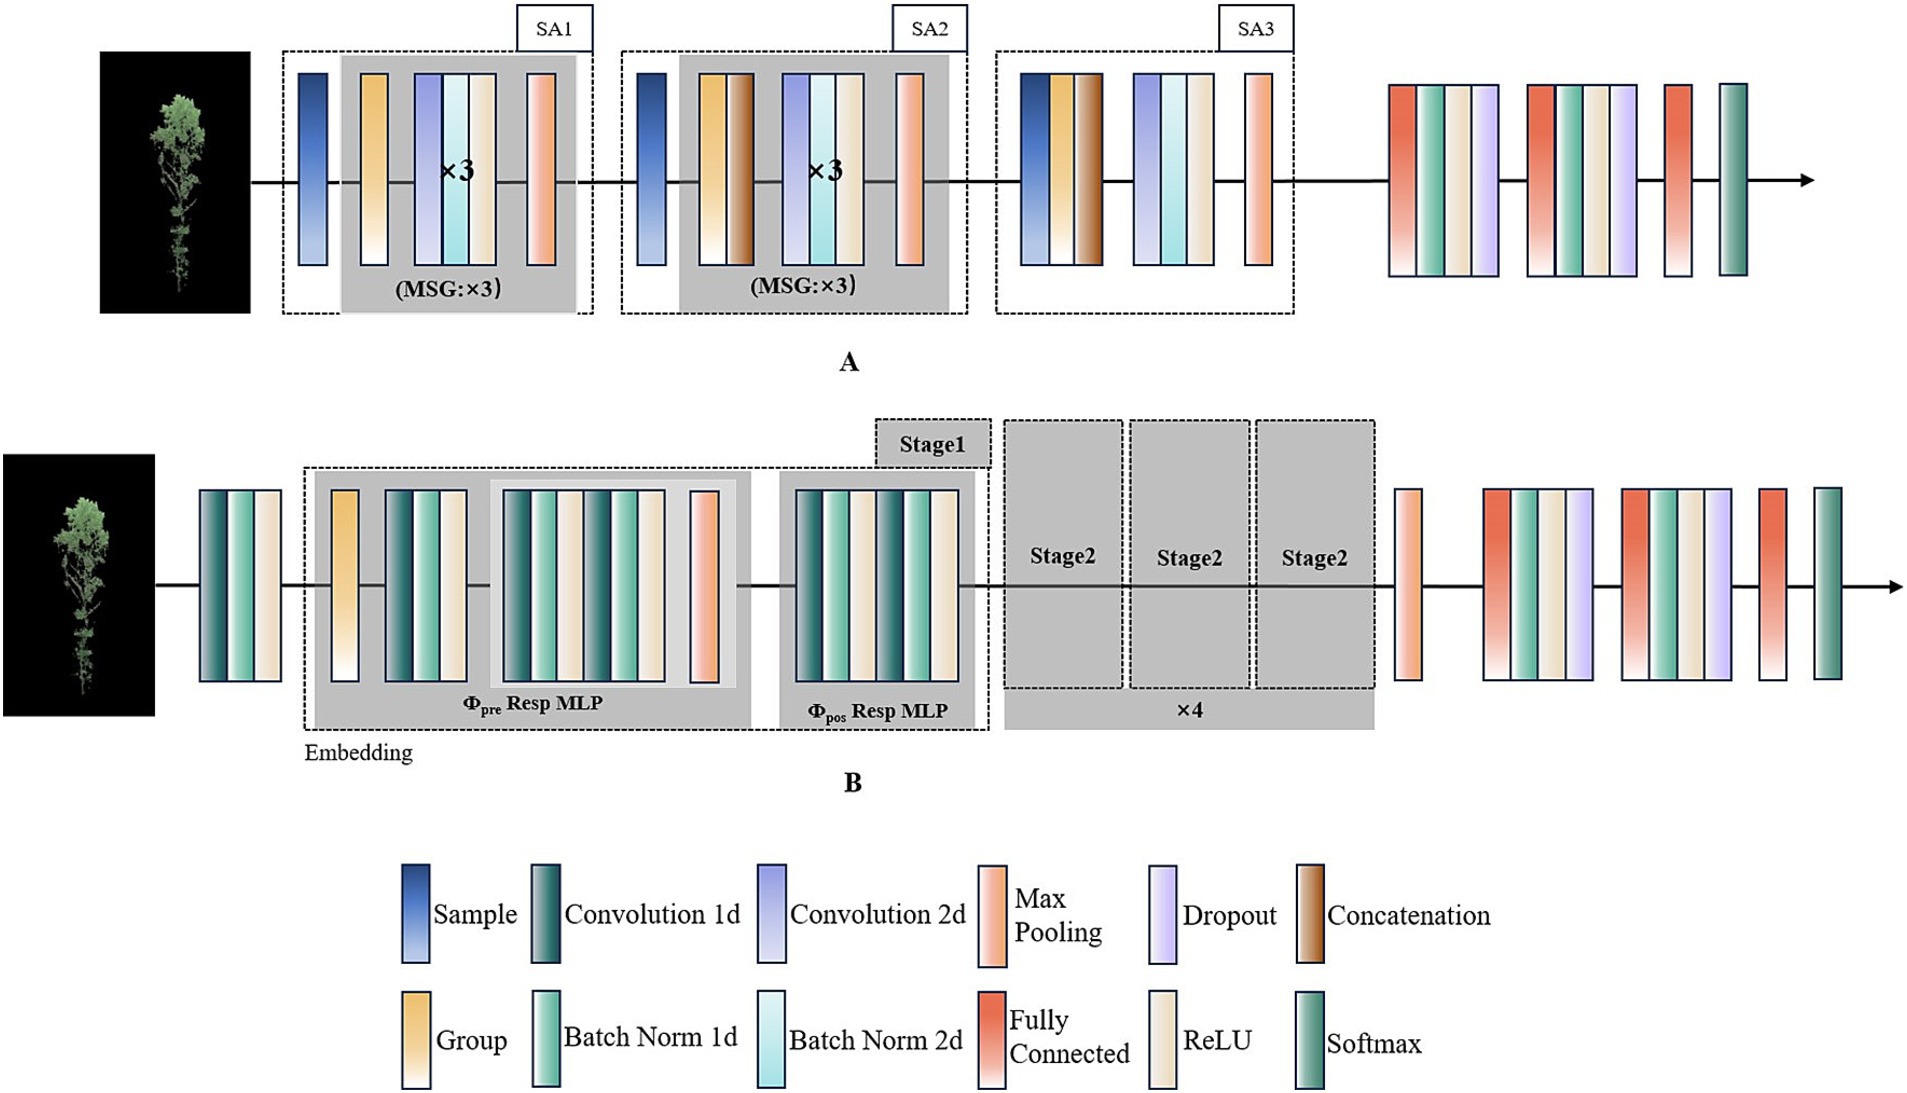
PointNet++, as illustrated in Figure 4, the Set Abstraction component of PointNet++ partitions the input point cloud into several local point sets. It then extracts the global features of each set, thereby obtaining higher-dimensional features. These data are subsequently processed by a unit PointNet to reduce the feature dimensions. This reduction not only decreases the computational load but also enhances the network’s nonlinearity, thereby improving the model’s generalization ability. The final step involves the softmax layer, which assigns a category score to each point (Qi et al., 2017b).
PointMLP is a deep residual MLP network. Its architecture includes a geometric affine module, a local weighted learning module, and a deep feature aggregation module, all of which adhere to the generic design guidelines depicted in Figure 4. In each stage of the process, local points are first transformed using a geometric affine module, and features are extracted both before and after the aggregation operation. By repeating these stages multiple times, PointMLP progressively expands the receptive field and models the complete geometric information of the point cloud (Ma et al., 2022).
3.6 Machine learning methods
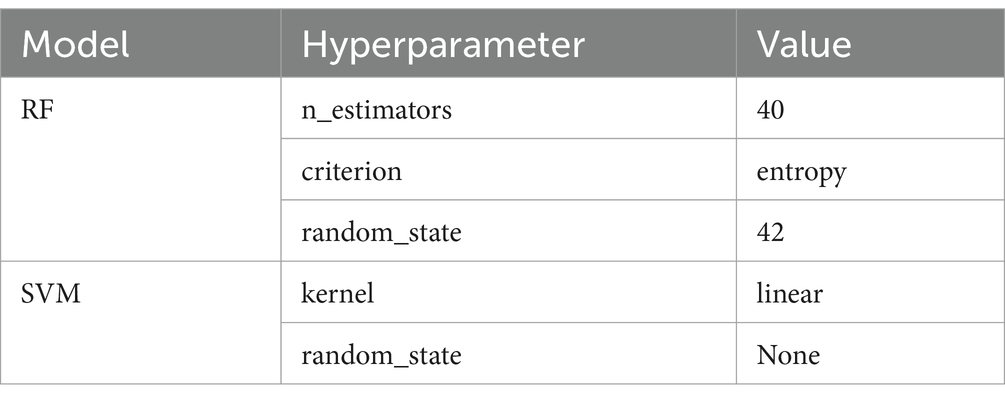
Two machine learning algorithms (RF and SVM) were used to classify tree species based on all extracted features. RF is based on decision trees, reduces overfitting through random attribute selection, and is suitable for high-dimensional data. SVM simplifies complex problems with its nonlinear mapping and maximum marginal characteristics.
RF is an ensemble algorithm that integrates multiple decision trees, offering stronger generalization ability compared to a single decision tree. RF employs a resampling meth-od to draw multiple samples from the original dataset. It first performs decision tree modeling on these samples. Subsequently, it makes predictions using these multiple decision trees and determines the final prediction result through a voting mechanism (Wu and Zhang, 2019).
SVM is a machine learning algorithm used to address binary classification problems (Zhang et al., 2013). It maps the original vectors into a higher-dimensional space and constructs a hyperplane with maximum spacing in this space. The aim is to maximize the distance between the two planes that are separated by the middle hyperplane, thereby achieving optimal separation.
3.7 Accuracy evaluation
According to the calculation results of the confusion matrix, overall accuracy (OA, Equation 1), producer accuracy (PA, Equation 2), user accuracy (UA, Equation 3) and Kappa coefficient (Equation 4) were used to evaluate the classification results of the model.
where is the total number of correct classifications of the th tree species in the test samples; is the total number of test samples classified into the th tree species; is the total number of test samples for the ith tree species; is the total number of test samples; is the number of tree species.
4 Results
4.1 Classification accuracy of deep learning methods based on different sampling points
As displayed in Figure 5, classification accuracy curves were drawn based on different sampling points of NGFPS. The overall accuracy of PointMLP remains stable between 95 and 97% across varying numbers of sampling points, achieving peak accuracy at 5120. The user accuracy for four tree species exceeds 95%. Conversely, PointNet++ achieves optimal classification accuracy at 1024 sampling points, with OA decreasing as the number of sampling points increases. The classification accuracy of Pinus sylvestris initially increases and then stabilizes with the increase of sampling points, while other tree species show a decrease in accuracy with the increase of sampling points.
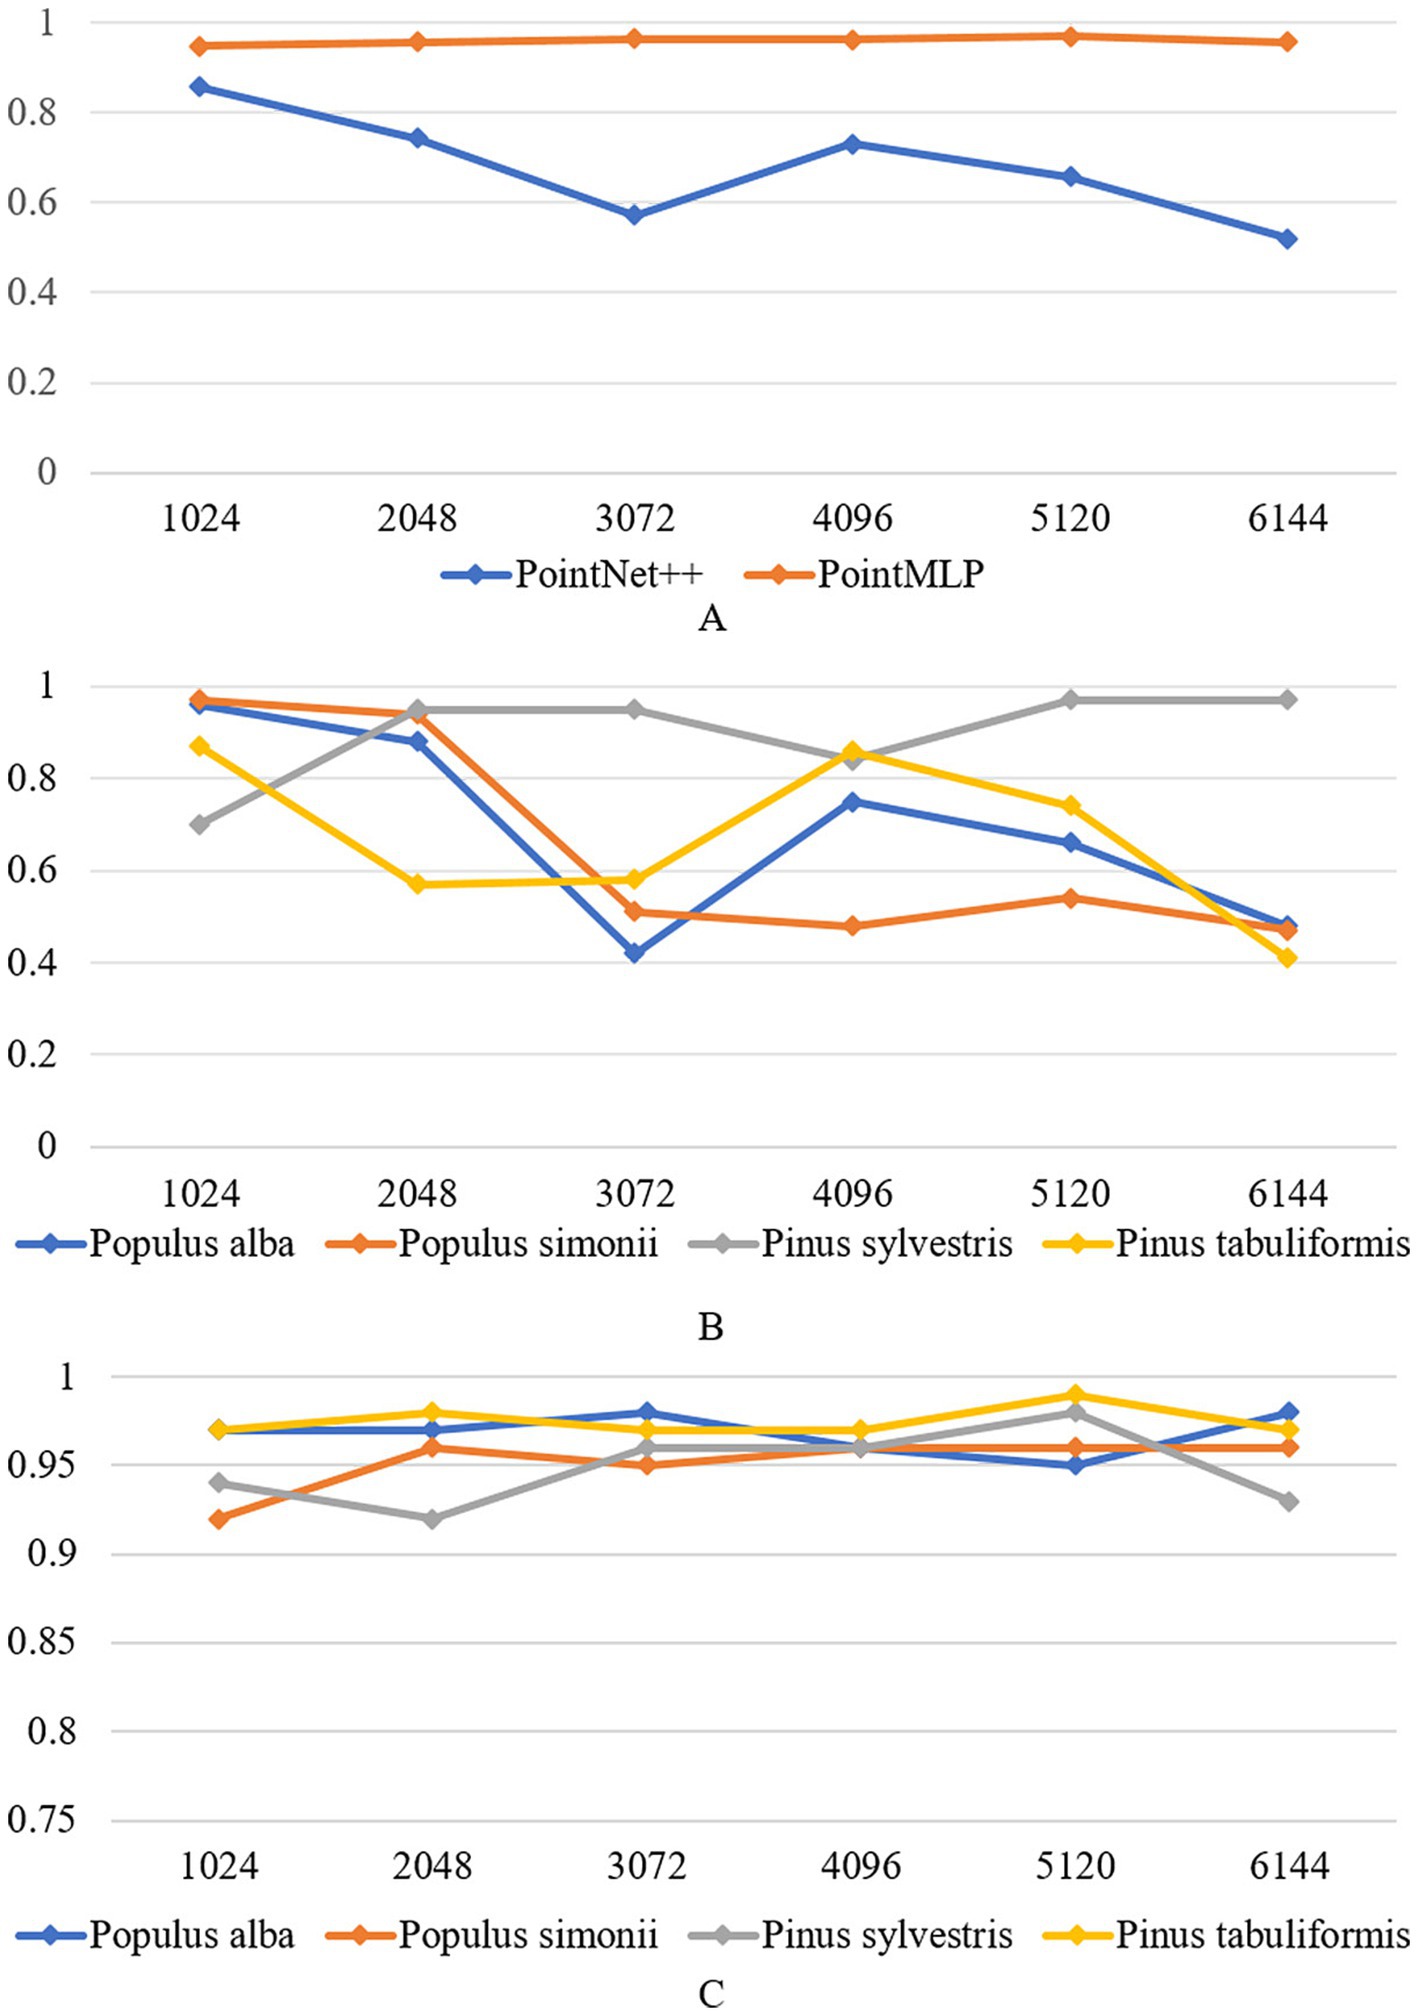
Figure 5. Comparison of the overall accuracy of PointNet++ and PointMLP (A), Comparison of the accuracy of PointNet++ for users with different number of sampling points (B), Comparison of the accuracy of PointMLP for users with different number of sampling points (C).
4.2 Classification accuracy of different tree species in the confusion matrix
This study classified Populus alba, Populus simonii, Pinus sylvestris, and Pinus tabuliformis using PointNet++, PointMLP, RF, and SVM. For PointNet++ and PointMLP, the number of sampling points was set between 1,024 and 6,144, respectively. Furthermore, this study compared the accuracy of the RF and SVM algorithms. The classification results of the four algorithms are presented in Figure 6. A confusion matrix approach was adopted to visualize the classification results, where rows represent the actual categories and columns represent the predicted categories.
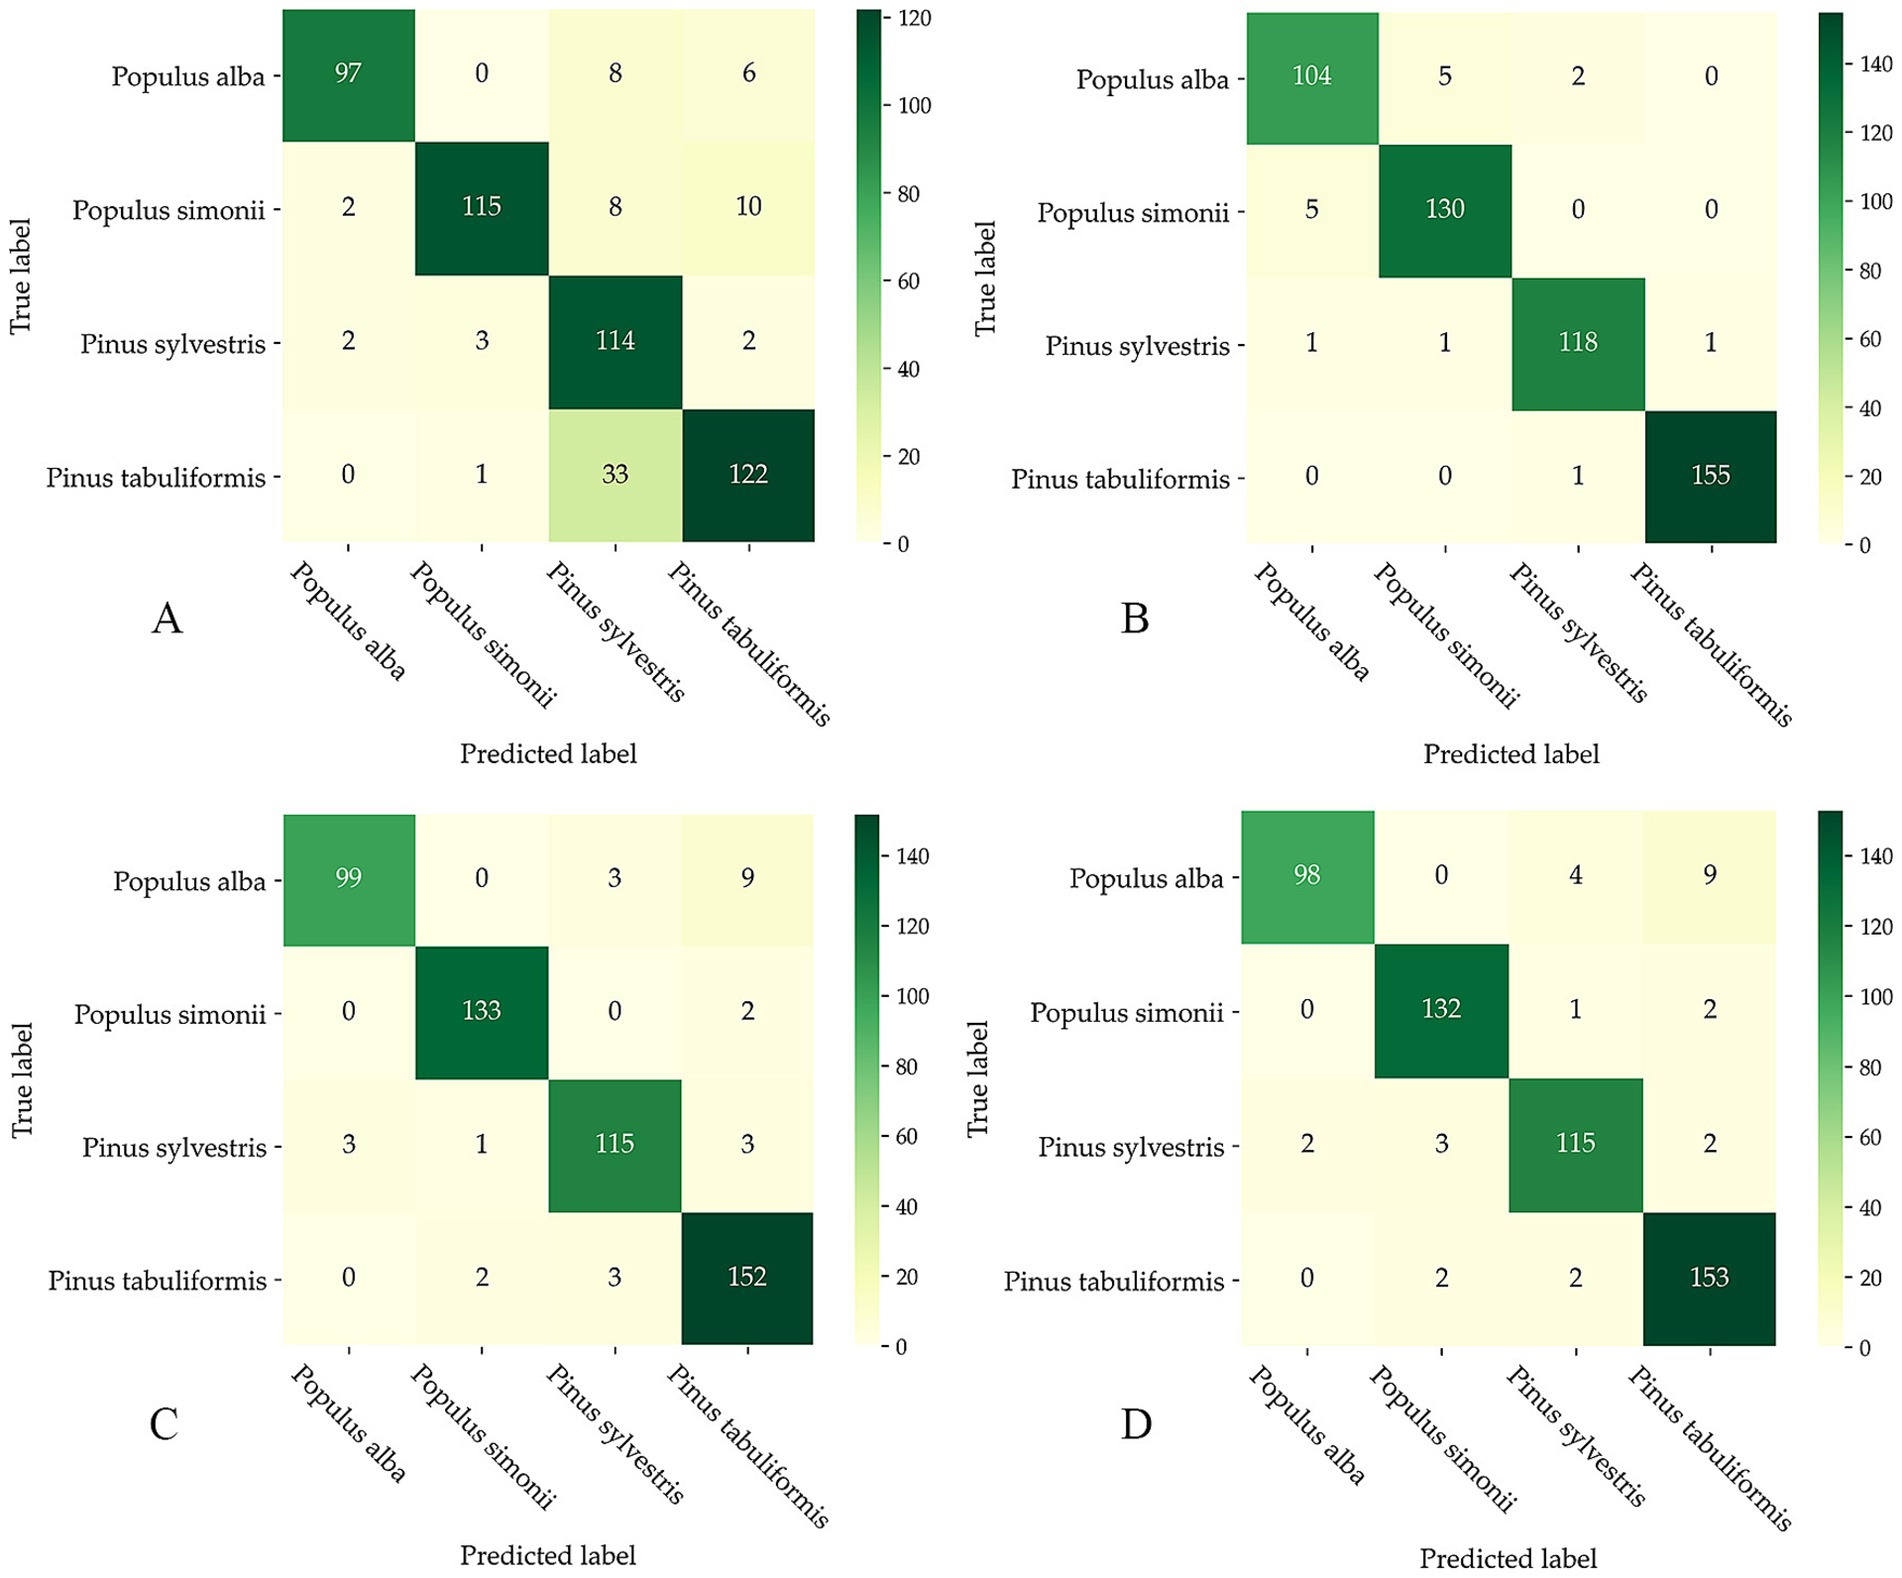
Figure 6. Confusion matrix for tree species classification of PointNet++ (A), PointMLP (B), RF (C), and SVM (D).
The OA and Kappa coefficients of different models are calculated based on the confusion matrix (Table 3), and the PA and UA are obtained similarly (Table 4). The results show that among the four models PointMLP has the highest overall accuracy, which is better than the remaining three models, and PointNet++ has the lowest overall accuracy with OA and Kappa coefficients of 85.65% and 0.8083, respectively. The classification accuracy of PointMLP was higher than 94%, RF was higher than 89%, and SVM was higher than 88%, indicating that the three models had low misidentification rates in tree species classification. Using PointNet++ classification, Pinus sylvestris of PA was 70%, Pinus tabuliformis of UA was 78%, the confusion matrix is shown as there are 33 Pinus tabuliformis was mistakenly classified as Pinus sylvestris. It shows that PointNet++ has a high misrecognition rate when classifying Pinus sylvestris and Pinus tabuliformis, which affects the overall accuracy of PointNet++ (see Tables 5, 6).
5 Discussion
The application of two machine learning models (RF and SVM) and two deep learning models (PointNet++ and PointMLP) to tree species classification was studied. The results, which align with the findings of Fan et al. (2023), Qian et al. (2023), and McGaughey et al. (2024), demonstrated high accuracy. The overall accuracy of the models was ranked as follows: PointMLP achieved the highest accuracy at 96.94%, followed by RF, SVM, and PointNet++, PointNet++ had the lowest accuracy at 85.65%.
5.1 Impact of feature value numbers and elev_percentile_99 value on the classification of tree species
Generally, feature values are selected when applying machine learning algorithms for tree species classification. This can aid in dimensionality reduction, reduce training time, and enhance the model’s generalization ability to mitigate overfitting. Better results are typically achieved by manually selecting features using algorithms such as RF and RFE-CV (Hakula et al., 2023). However, sometimes the classification results after selecting features are not satisfactory. Ba et al. (2020) selected eight features, such as tree height, echo count, and laser penetration index, for tree classification by the sQDA (Quadratic Discriminant Analysis), achieving a relatively low accuracy of 82.02%. A machine learning algorithm based on the complete set of features was used to classify the main tree species in the study, which achieved a high classification accuracy, with an OA higher than 90%. From the study, it can be seen that feature value selection has no significant effect on OA and Kappa, which is consistent with the results of Viinikka et al. (2020).
McGaughey et al. (2024) used RF to classify Western hemlock and Douglas fir, showing that elev_percentile_99th value was the most significant indicator. Western hemlock, compared to Douglas fir, has a higher leaf proportion at elev_percentile_99th (near the tree canopy), leading to more laser returns and thus higher classification accuracy. In contrast, Populus simonii achieved the highest accuracy when RF and SVM algorithms were used to classify four tree species in the study. This may be due to drought and insufficient soil moisture leading to the degradation of Populus simonii in the area, resulting in elev_percentile_99th (top of the canopy) defoliation and death, with significant lower proportion of leaves and reduced LiDAR returns. Therefore, it is considered that elev_percentile_99th has an important impact on the classification of tree species.
5.2 Impact of sampling point density on the classification accuracy of deep learning
NGFPS method was used to obtain different sampling points in both deep learning models. The accuracy of two deep learning models kept high and stable when the number of sampling points were between 1,024 and 2048. The classification accuracy of PointNet++ gradually decreased as the number of sampling points increased from 1,024 to 6,144, consistent with Liu et al. (2021). In addition, based on TLS data, Liu et al. (2022) and Fan et al. (2023) also proved that with an increase in the number of sample points, the classification accuracy of the model will decrease. The reason may be that with the increase in the number of sample points, the noise and outliers will also increase, resulting in a reduction in classification accuracy, which in turn will reduce the ability of the model to generalize to new data, resulting in an overfitting phenomenon. However, as shown in Figure 5, the overall accuracy of PointMLP in classifying the four tree species remains high and does not significantly change with the increase in the number of sampling points. This may be because PointMLP introduces a local geometric affine module to transform points in the local neighborhood, the local geometry information can be effectively captured. Therefore, to effectively process point cloud data and reduce overfitting, it is recommended to keep the number of points in the two deep learning models between 1,024 and 2048 when using the NGFPS method for single tree sampling.
5.3 Impact of tree structure on classification accuracy of model
PointNet++ misclassified eight Populus alba as Pinus sylvestris, six Populus alba as Pinus tabuliformis, and 33 Pinus sylvestris as Pinus tabuliformis when classifying tree species using four models. Furthermore, Allen et al. (2023) found the misclassification of Pinus pinaster into the same spcie as Pinus nigra and Pinus sylvestris, aligning with the findings of the study. Supplementary Figure S1 illustrates the spire-shaped crowns of Populus alba, Pinus sylvestris, and Pinus tabuliformis, which, due to their similarity, may yield similar point cloud features, increasing likelihood of misidentification. Furthermore, Pinus sylvestris and Pinus tabuliformis in the study, both from the Pinus genus, share similarities in crown and leaf shape, further enhancing misidentification potential. PointNet++ may have difficulty distinguishing between species with similar morphology or characteristics. The other three models-PointMLP, RF, and SVM—though exhibited misidentification and misclassification, also with higher accuracies. Thus, for classifying tree species with similar crown structures, these three models are recommended.
5.4 Impact of different data sources on tree species classification
Currently, ALS and TLS data sources are frequently employed for tree species classification. The differences in these data sources may influence classification accuracy. TLS capable of automatically capturing the three-dimensional structure of vegetation at high resolution is particularly advantageous for acquiring diameter at breast height (DBH) and height under branch data, thereby enhancing tree species classification. Conversely, UAV-LiDAR has limitations in collecting subcanopy point cloud information and capturing the complete structural features of individual trees, which can lead to a decrease in tree species classification accuracy (Terryn et al., 2020). Comparatively, TLS data outperforms ALS data in tree species classification. Liu et al. (2021) used a deep neural network (LayerNet) model to classify birch and larch trees based on TLS and UAV-LiDAR data sources, respectively, achieving an OA of 92.5% with TLS data and 88.8% with UAV-LiDAR data. Similar conclusions were drawn by Chen et al. (2021). The highest classification accuracy of 96.94% was achieved when using UAV-LiDAR data to classify the four major tree species in the study. This may be attributed to the fact that the point cloud data originated from a stand with a canopy density of about 0.75, most point clouds below the canopy level of single trees were obtained, which improved the classification accuracy.
6 Conclusion
This study employed deep learning algorithms (PointNet++ and PointMLP) and complete feature-set machine learning algorithms (RF and SVM) for tree species classification. The main conclusions are as follows: The sampling points should be selected between 1,024 and 2048 points in both deep learning models when using the NGFPS method for single tree sampling and PointMLP demonstrated high stability and consistency in classification accuracy at different sampling points, with OA ranging between 95 and 97%, PointMLP emerged as the most optimal model. RF and SVM also performed well, with OA higher than 88 and 89%, respectively. While PointNet++ showed the lowest OA and Kappa coefficient, suggesting that its performance may not be optimal. The study shows that machine learning and deep learning algorithms can accurately classify tree species using individual tree point clouds, and the operation process of PointMLP is more concise and efficient, providing a new solution for accurately classifying tree species and efficiently investigating forest resources. In addition, feature value of elev_percentile_99th has an important influence on tree species classification and tree species with similar crown structures may lead to a higher misidentification rate, in this case PointMLP, RF and SVM model are recommended.
Though the study achieved high accuracy for tree species classification based on small sample data, there may be limitations for large-scale application and promotion of the model. Future research will aim to expand the scale and further verify the model, enabling the use of model over larger areas for better classification accuracy.
Data availability statement
The raw data supporting the conclusions of this article will be made available by the authors, without undue reservation.
Author contributions
HZ: Conceptualization, Data curation, Formal analysis, Investigation, Methodology, Software, Visualization, Writing – original draft, Writing – review & editing. BL: Conceptualization, Formal analysis, Methodology, Software, Validation, Visualization, Writing – review & editing. BY: Conceptualization, Investigation, Writing – review & editing. JG: Data curation, Investigation, Software, Visualization, Writing – review & editing. ZH: Conceptualization, Formal analysis, Funding acquisition, Investigation, Methodology, Project administration, Resources, Validation, Writing – review & editing, Supervision. MZ: Project administration, Writing – review & editing. ZY: Project administration, Writing – review & editing. JZ: Project administration, Writing – review & editing.
Funding
The author(s) declare that financial support was received for the research and/or publication of this article. This research was funded by the Key Research and Development Programs in Shanxi, grant number 202102090301007; the Research Startup Project for Talent Introduction of Shanxi Agricultural University, grant number 2023BQ88.
Acknowledgments
We would like to thank Yuhao Zhang, Jianlin Hao, and Zixu Ge at the School of Forestry, Shanxi Agricultural University for her contributions in the sample field survey and sampling. We thank Mengjie He and Xiaomei Huo for their suggestions and help in the revision of the manuscript.
Conflict of interest
The authors declare that the research was conducted in the absence of any commercial or financial relationships that could be construed as a potential conflict of interest.
Publisher’s note
All claims expressed in this article are solely those of the authors and do not necessarily represent those of their affiliated organizations, or those of the publisher, the editors and the reviewers. Any product that may be evaluated in this article, or claim that may be made by its manufacturer, is not guaranteed or endorsed by the publisher.
Supplementary material
The Supplementary material for this article can be found online at: https://www.frontiersin.org/articles/10.3389/ffgc.2025.1431603/full#supplementary-material
References
Allen, M. J., Grieve, S. W. D., Owen, H. J. F., and Lines, E. R. (2023). Tree species classification from complex laser scanning data in Mediterranean forests using deep learning. Methods Ecol. Evol. 14, 1657–1667. doi: 10.1111/2041-210X.13981
Ba, A., Laslier, M., Dufour, S., and Hubert-Moy, L. (2020). Riparian trees genera identification based on leaf-on/leaf-off airborne laser scanner data and machine learning classifiers in northern France. Int. J. Remote Sens. 41, 1645–1667. doi: 10.1080/01431161.2019.1674457
Bello, S. A., Yu, S., Wang, C., Adam, J. M., and Li, J. (2020). Review: deep learning on 3D point clouds. Remote Sens. 12:1729. doi: 10.3390/rs12111729
Blomley, R., Hovi, A., Weinmann, M., Hinz, S., Korpela, I., and Jutzi, B. (2017). Tree species classification using within crown localization of waveform LiDAR attributes. ISPRS J. Photogramm. Remote Sens. 133, 142–156. doi: 10.1016/j.isprsjprs.2017.08.013
Briechle, S., Krzystek, P., and Vosselman, G. (2020). Classification of tree species and standing dead trees by fusing UAV-BASED LiDAR data and multispectral imagery in the 3D deep neural network PointNet++. ISPRS Ann. Photogramm. Remote Sens. Spat Inf. Sci. 2, 203–210. doi: 10.5194/isprs-annals-V-2-2020-203-2020
Chen, J., Chen, Y., and Liu, Z. (2021). Classification of typical tree species in laser point cloud based on deep learning. Remote Sens. 13:4750. doi: 10.3390/rs13234750
Dalponte, M., Bruzzone, L., and Gianelle, D. (2012). Tree species classification in the southern Alps based on the fusion of very high geometrical resolution multispectral/hyperspectral images and LiDAR data. Remote Sens. Environ. 123, 258–270. doi: 10.1016/j.rse.2012.03.013
Drake, J. B., Dubayah, R. O., Clark, D. B., Knox, R. G., Blair, J. B., Hofton, M. A., et al. (2002). Estimation of tropical forest structural characteristics using large-footprint lidar. Remote Sens. Environ. 79, 305–319. doi: 10.1016/S0034-4257(01)00281-4
Fan, Z., Wei, J., Zhang, R., and Zhang, W. (2023). Tree species classification based on PointNet++ and airborne laser survey point cloud data enhancement. Forests 14:1246. doi: 10.3390/f14061246
Hakula, A., Ruoppa, L., Lehtomäki, M., Yu, X., Kukko, A., Kaartinen, H., et al. (2023). Individual tree segmentation and species classification using high-density close-range multispectral laser scanning data. ISPRS Open J. Photogramm. Remote Sens. 9:100039. doi: 10.1016/j.ophoto.2023.100039
Hovi, A., Korhonen, L., Vauhkonen, J., and Korpela, I. (2016). LiDAR waveform features for tree species classification and their sensitivity to tree- and acquisition related parameters. Remote Sens. Environ. 173, 224–237. doi: 10.1016/j.rse.2015.08.019
Kukkonen, M., Lähivaara, T., and Packalen, P. (2024). Combination of Lidar intensity and texture features enable accurate prediction of common boreal tree species with single sensor UAS data. IEEE Trans. Geosci. Remote Sens. 62, 1–8. doi: 10.1109/TGRS.2023.3345745
Lin, H., Liu, X., Han, Z., Cui, H., and Dian, Y. (2023). Identification of tree species in Forest communities at different altitudes based on multi-source aerial remote sensing data. Appl. Sci. 13:4911. doi: 10.3390/app13084911
Liu, B., Chen, S., Huang, H., and Tian, X. (2022). Tree species classification of backpack laser scanning data using the PointNet++ point cloud deep learning method. Remote Sens. 14:3809. doi: 10.3390/rs14153809
Liu, M., Han, Z., Chen, Y., Liu, Z., and Han, Y. (2021). Tree species classification of LiDAR data based on 3D deep learning. Measurement 177:109301. doi: 10.1016/j.measurement.2021.109301
Lu, X., Guo, Q., Li, W., and Flanagan, J. (2014). A bottom-up approach to segment individual deciduous trees using leaf-off lidar point cloud data. ISPRS J. Photogramm. Remote Sens. 94, 1–12. doi: 10.1016/j.isprsjprs.2014.03.014
Lv, Y., Zhang, Y., Dong, S., Yang, L., Zhang, Z., Li, Z., et al. (2022). A convex Hull-based feature descriptor for learning tree species classification from ALS point clouds. IEEE Geosci. Remote Sens. Lett. 19, 1–5. doi: 10.1109/LGRS.2021.3055773
Ma, X., Qin, C., You, H., Ran, H., and Fu, Y. (2022). Rethinking network design and local geometry in point cloud: a simple residual MLP framework. Available online at: http://arxiv.org/abs/2202.07123 (Accessed April 1, 2024).
McGaughey, R. J., Kruper, A., Bobsin, C. R., and Bormann, B. T. (2024). Tree species classification based on upper crown morphology captured by Uncrewed aircraft system Lidar data. Remote Sens. 16:603. doi: 10.3390/rs16040603
Ning, K., Liu, Y., Su, Y., and Jiang, K. (2023). Point-voxel and bird-eye-view representation aggregation network for single stage 3D object detection. IEEE Trans. Intell. Transp. Syst. 24, 3223–3235. doi: 10.1109/TITS.2022.3225880
Ou, J., Tian, Y., Zhang, Q., Xie, X., Zhang, Y., Tao, J., et al. (2023). Coupling UAV hyperspectral and LiDAR data for mangrove classification using XGBoost in China’s Pinglu Canal estuary. Forests 14:1838. doi: 10.3390/f14091838
Qi, C. R., Yi, L., and Guibas, L. J. (2017a). PointNet: deep learning on point sets for 3D classification and segmentation, In 2017 IEEE Conference on Computer Vision and pAttern Recognition (CVPR), Honolulu, HI: IEEE, 77–85.
Qi, C. R., Yi, L., Su, H., and Guibas, L. J. (2017b). PointNet++: deep hierarchical feature learning on point sets in a metric space. Adv. Neural Inf. Process. Syst. 2017, 5105–5114. Available online at: http://arxiv.org/abs/1706.02413 (Accessed April 1, 2024).
Qian, C., Yao, C., Ma, H., Xu, J., and Wang, J. (2023). Tree species classification using airborne LiDAR data based on individual tree segmentation and shape fitting. Remote Sens. 15:406. doi: 10.3390/rs15020406
Rust, S., and Stoinski, B. (2024). Enhancing tree species identification in forestry and urban forests through light detection and ranging point cloud structural features and machine learning. Forests 15:188. doi: 10.3390/f15010188
Seidel, D., Annighöfer, P., Thielman, A., Seifert, Q. E., Thauer, J.-H., Glatthorn, J., et al. (2021). Predicting tree species from 3D laser scanning point clouds using deep learning. Front. Plant Sci. 12:635440. doi: 10.3389/fpls.2021.635440
Shi, Y., Wang, S., Zhou, S., and Kamruzzaman, M. M. (2020). Study on modeling method of Forest tree image recognition based on CCD and theodolite. IEEE Access 8, 159067–159076. doi: 10.1109/ACCESS.2020.3018180
Terryn, L., Calders, K., Disney, M., Origo, N., Malhi, Y., Newnham, G., et al. (2020). Tree species classification using structural features derived from terrestrial laser scanning. ISPRS J. Photogramm. Remote Sens. 168, 170–181. doi: 10.1016/j.isprsjprs.2020.08.009
Tewari, V. P. (2016). Forest inventory, assessment, and monitoring, and long-term forest observational studies, with special reference to India. For. Sci. Technol. 12, 24–32. doi: 10.1080/21580103.2015.1018962
Vaughn, N. R., Moskal, L. M., and Turnblom, E. C. (2012). Tree species detection accuracies using discrete point Lidar and airborne waveform Lidar. Remote Sens. 4, 377–403. doi: 10.3390/rs4020377
Vauhkonen, J., Korpela, I., Maltamo, M., and Tokola, T. (2010). Imputation of single-tree attributes using airborne laser scanning-based height, intensity, and alpha shape metrics. Remote Sens. Environ. 114, 1263–1276. doi: 10.1016/j.rse.2010.01.016
Viinikka, A., Hurskainen, P., Keski-Saari, S., Kivinen, S., Tanhuanpää, T., Mäyrä, J., et al. (2020). Detecting European Aspen (Populus tremula L.) in boreal forests using airborne hyperspectral and airborne laser scanning data. Remote Sens. 12:2610. doi: 10.3390/rs12162610
Wu, Y., and Zhang, X. (2019). Object-based tree species classification using airborne hyperspectral images and LiDAR data. Forests 11:32. doi: 10.3390/f11010032
Xi, Z., Hopkinson, C., Rood, S. B., and Peddle, D. R. (2020). See the forest and the trees: effective machine and deep learning algorithms for wood filtering and tree species classification from terrestrial laser scanning. ISPRS J. Photogramm. Remote Sens. 168, 1–16. doi: 10.1016/j.isprsjprs.2020.08.001
Yang, J., Kang, Z., Cheng, S., Yang, Z., and Akwensi, P. H. (2020). An individual tree segmentation method based on watershed algorithm and three-dimensional spatial distribution analysis from airborne LiDAR point clouds. IEEE J. Sel. Top. Appl. Earth Obs. Remote Sens. 13, 1055–1067. doi: 10.1109/JSTARS.2020.2979369
Yao, W., Krzystek, P., and Heurich, M. (2012). Tree species classification and estimation of stem volume and DBH based on single tree extraction by exploiting airborne full-waveform LiDAR data. Remote Sens. Environ. 123, 368–380. doi: 10.1016/j.rse.2012.03.027
Yu, X., Hyyppä, J., Litkey, P., Kaartinen, H., Vastaranta, M., and Holopainen, M. (2017). Single-sensor solution to tree species classification using multispectral airborne laser scanning. Remote Sens. 9:108. doi: 10.3390/rs9020108
Zhang, J., Lin, X., and Ning, X. (2013). SVM-based classification of segmented airborne LiDAR point clouds in urban areas. Remote Sens. 5, 3749–3775. doi: 10.3390/rs5083749
Zhang, W., Qi, J., Wan, P., Wang, H., Xie, D., Wang, X., et al. (2016). An easy-to-use airborne LiDAR data filtering method based on cloth simulation. Remote Sens. 8:501. doi: 10.3390/rs8060501
Keywords: deep learning, tree species, classification, UAV-LiDAR, point cloud
Citation: Zhang H, Liu B, Yang B, Guo J, Hu Z, Zhang M, Yang Z and Zhang J (2025) Efficient tree species classification using machine and deep learning algorithms based on UAV-LiDAR data in North China. Front. For. Glob. Change. 8:1431603. doi: 10.3389/ffgc.2025.1431603
Edited by:
Philemon Tsele, University of Pretoria, South AfricaReviewed by:
Bin Wang, Northeast Forestry University, ChinaAshutosh Bhardwaj, Indian Institute of Remote Sensing, India
Copyright © 2025 Zhang, Liu, Yang, Guo, Hu, Zhang, Yang and Zhang. This is an open-access article distributed under the terms of the Creative Commons Attribution License (CC BY). The use, distribution or reproduction in other forums is permitted, provided the original author(s) and the copyright owner(s) are credited and that the original publication in this journal is cited, in accordance with accepted academic practice. No use, distribution or reproduction is permitted which does not comply with these terms.
*Correspondence: Zhenhua Hu, c3huZGh6aEAxNjMuY29t
 Hanyu Zhang
 Bingjie Liu
 Bin Yang
 Zhenhua Hu
 Mengtao Zhang
 Zhaohui Yang
 Jianshuang Zhang