- 1School of Urban and Rural Planning and Architectural Engineering, Shangluo University, Shangluo, China
- 2Key Laboratory of Vegetation Restoration and Management of Degraded Ecosystems, Guangdong Provincial Key Laboratory of Applied Botany, South China Botanical Garden, Chinese Academy of Sciences, Guangzhou, China
Introduction: Uneven rainfall distribution alters tree water use patterns, ultimately influencing plantation establishment.
Methods: Based on monthly rainfall, six drought levels were classified. Whole-tree sap flux and meteorological variables were monitored across these levels from 2010 to 2013 in a pure Schima superba plantation in South China. The relationships between daily transpiration (Tt) and the influencing factors were modeled using the Support vector regression (SVR) method. Shapley additive explanations (SHAP) values were employed to characterize the sensitivity and contributions of four environmental variables to Tt.
Results: The results indicate that monthly rainfall (RFt) significantly influences the sensitivity of these four environmental variables to Tt when RFt exceeds 300 mm (Level 6). Furthermore, when RFt is 300 mm or less (Levels 1–5), the sensitivity of these factors and their total contributions to Tt are independent of tree size.
Discussion: Our findings indicate that the decoupling between Tt and environmental factors may be a significant characteristic of ongoing water stress during high rainfall months. Additionally, these findings enhance the predictive capability of machine learning models in assessing tree water use.
Introduction
Global climate change has led to an increase in the number of extreme weather events in recent years (Zia et al., 2021; Brunet et al., 2024). Since the year 2000, southern China has experienced several severe droughts, particularly during four significant events in 2001, 2006–2007, 2009–2010 and 2020–2021, which have been identified as extreme “Water crisis” (Zhang et al., 2018). The uneven distribution of rainfall is a major factor contributing to drought in this region, which seriously affects the ecological establishment of plantations. Specifically, the intensity and frequency of rainfall profoundly influence the physiological behavior and ecological environment of trees. Even during prolonged mild to moderate drought, trees become particularly vulnerable to carbon starvation and biological invasion, potentially leading to chronic mortality (McDowell et al., 2008; da Silva et al., 2013; Anderegg et al., 2013; Chen et al., 2018; Kono et al., 2019).
Transpiration plays a crucial role in the physiological functioning of trees and serves as the primary mechanism for water use. Its dynamics are influenced by various internal and external factors. Meteorological conditions primarily govern instantaneous changes in transpiration, while soil factors determine its overall level (Wullschleger et al., 1998; Jiao et al., 2019). However, these influences may differ among trees of various sizes and ontogenetic stages (Andrade et al., 1998; Meinzer et al., 2001; Meinzer, 2003). Long-term synchronous monitoring of whole-tree sap flow and environmental factors significantly enhance our understanding of the relationship between these internal and external factors influencing tree water use, ultimately improving prediction efficiency. However, few studies have focused on the performance of tree transpiration responses to meteorological factors under varying drought conditions.
Environmental factors are critical in driving water movement within plants. Photosynthetically active radiation ( ) influences the opening and closing of stomata by affecting the amount of CO2 absorbed during photosynthesis and heating the leaf surface, which subsequently impacts transpiration rates (Kume, 2017; Li et al., 2021). The air vapor pressure deficit ( ) significantly alters the water vapor pressure difference between the leaves and the surrounding air, directly affecting the transport of water vapor from the internal leaf to the external atmosphere (Fricke, 2017). Similarly, wind speed ( ) affects the boundary layer resistance of plant leaves, as well as the dynamics of stomatal opening and closing and overall leaf temperature (Monteith and Mike, 1990; Holwerda et al., 2012; Carvalho et al., 2015). Furthermore, soil moisture content ( ) impacts the ability of plant roots to absorb and transport water. A thorough understanding of these causal relationships provides a theoretical basis for predicting transpiration models based on environmental factors (Jarvis, 1976). The close relationships between sap flow, transpiration calculated based on sap flow and environmental factors have been demonstrated using double-variable analysis and multiple linear regression in different climate zones and forest types (e.g., Juhász et al., 2013; Shen et al., 2015; Wang et al., 2017; Han et al., 2019; Chen et al., 2022). However, multiple linear regression requires strict null assumptions, including linearity, independence and normality, while double-variable analysis did not adequately quantify the contributions of eigenvalues. In contrast, machine learning (ML) methods does not impose these stringent requirements. They not only demonstrate higher prediction accuracy and stability in drought sensitivity analysis but also effectively uncover and capture the relationships between input variables and forecast outcomes. Furthermore, they elucidates interactions among input variables through interpretive tools such as the SHAP algorithm and more sophisticated models. This comprehensive approach enhances our understanding of which factors are most sensitive to drought prediction (Zhang et al., 2024; Uexkull et al., 2016; Saha et al., 2023). Although ANNs are gaining increasingly popularity in predicting tree transpiration due to their flexible requirements (e.g., Liu et al., 2009; Whitley et al., 2009; Xu et al., 2017; Tu et al., 2019), there are currently no studies on Support vector Regression (SVR) in this context. The study emphasizes exploring the application of ML methods for analyzing tree transpiration sensitivity to drought. The objectives of this paper are to (1) determine the sensitivity of meteorological factors to the transpiration of three tree sizes across six levels of drought, as well as their total contributions to transpiration using SVR, and (2) examine how these responses vary with different drought levels and tree sizes.
Materials and methods
Field site and plant materials
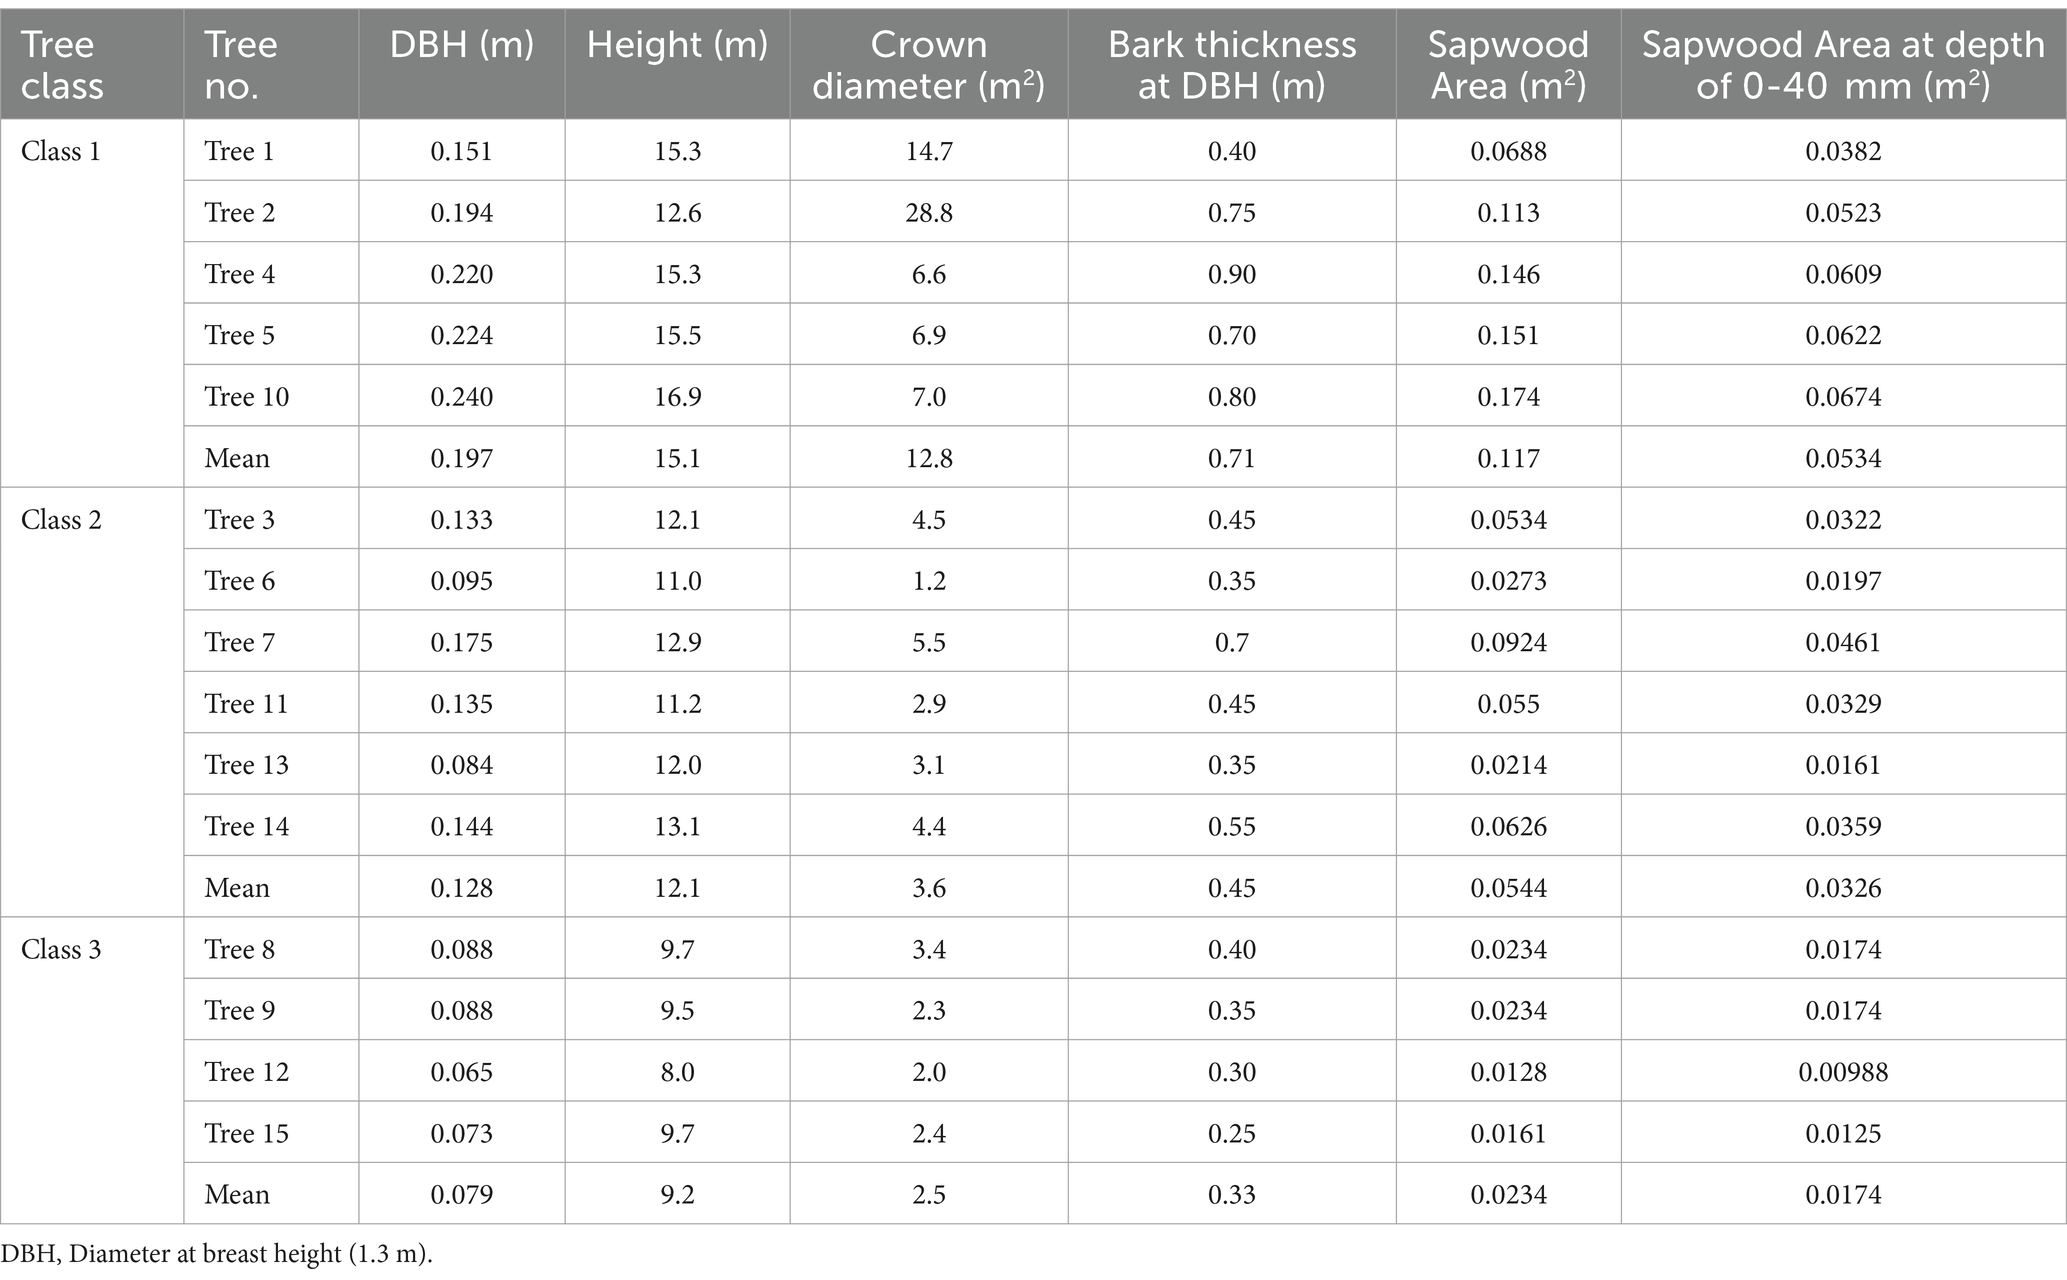
The experiments were conducted at the South China Botanical Garden station of the Chinese Academy of Sciences in Guangzhou, Guangdong, China (113°21′E 23°10’N, 40 m altitude). This area experiences a subtropical monsoon climate, characterized by a wet season (April to September) and a dry season (November to January), with an annual average temperature of 21.8°C. The region receives an averages annual precipitation in 1710.5 mm, with over 80% occurring during the wet season. A pure Schima superba forest was established in the mid-1980s at a density of 1,046 plants per hectare. We sampled 15 30-year-old individuals as test objects and divided them into three size classes based on the method of Mei et al. (2010a) (Table 1).
Sap flux density and transpiration measurement
Granier’s thermal dissipation probe (TDP) (Granier, 1985) was used to measure xylem sap flux density ( , g·m−2·s−1). These probes were 2 mm in diameter and 20 mm in length, consisting of a copper-constantan thermojunction. They were radially inserted into the sapwood of the stem samples at approximately 0.15 m apart vertically at breast height. The sensors were placed on the northern side and covered with aluminum foil to protect them from sunlight, while the top of the probes was sealed with waterproof silicone. The heated upper probe was supplied with a constant power of 0.2 W, while the unheated lower probe served as a reference. The temperature difference between the two probes were averaged every 30 s, and data were collected at 10-min intervals using a Delta-T logger. These records were then used to calculate using the empirical equation proposed by Granier (1987). Due to the substantial variation in sap flux at depths greater than 40 mm in the sapwood of Schima Superba (approximately 45% of the flux occurs at depths of 0-40 mm) (Mei et al., 2010b), the mean flux was calculated by adding the sap flux at these two depths, weighted by their respective areas. The weights were determined based on the ratio of sapwood area within the two depths to the total sapwood area. Whole-tree transpiration ( , g) was calculated every 10 min by
where, and represent the sap flux density in the outer xylem (0–40 mm) and inner xylem (>40 mm), respectively, while and are the sapwood areas corresponding to these densities, as calculated by Zhao et al. (2018). The time interval, t, is 600 s, with data averaged and recorded every 10 min by the logger.
Environmental measurements
Five environmental variables were monitored approximately 2 m above the forest upper canopy. Wind speed ( , m·s−1) was monitored using an AN4 Anemometer (Delta-T Devices Ltd., Cambridge, UK). Air temperature ( , °C) and relative humidity ( , %) were monitored using a RHT2V-418 sensor (Delta-T Devices Ltd., Cambridge, UK). The air vapor pressure deficit ( , kPa) was calculated using the difference in vapor pressure between saturated and ambient air, combining the effects of air temperature and relative humidity. Photosynthetically active radiation ( , W·m−2) was monitored with a Li-Cor quantum sensor (LI-190SA, LI-COR, USA). Soil moisture content ( , m−3·m−3) was assessed using three frequency domain sensors (SM200, Delta-T Devices, UK) at a depth of 30–40 cm. Monthly rainfall ( , mm) data were obtained from the Guangzhou Statistics Bureau1. All variables were recorded using the same logger as the sap flux measurements.
SVR
Support vector regression (SVR) is a significant extension of Support vector machine (SVM) specifically designed to address regression problems. It works by identifying a hyperplane defined by the equation (representing the predicted value in the linear case) that creates a margin of . The goal is to position this hyperplane so that most training samples fall within the margin, satisfying the condition |y − f(x)| ≤ ɛ, while keeping the complexity of the model as low as possible. This process can be formulated as an optimization problem:
subject to
where denotes the weight vector, C > 0 is the regularization parameter that balances the model’s fit accuracy and generalization ability (with C = 0.08 here). is the tolerance for prediction error (with =0.01 here). These two parameters can be determined using GridSearchCV from Scikit-learn. b is the bias, is the -th observation of the input vector (x ϵ Rd), and and are slack variables for guarding against outliers.
To transform the constrained optimization problem (Equation 2) into an unconstrained optimization one, Lagrange multipliers are introduced to formulate the Lagrangian function:
Where , , and are Lagrange multipliers; the first two correspond to inequality constraints, while the last two are associated with the non-negative constraints.
The minimum of Equation 3 can be determined based on the Karush-Kuhn-Tucker (KKT) conditions, yielding the dual optimization form in Equation 4 by taking the partial derivatives with respect to , b, and (Vapnik, 1995; Smola and Schölkopf, 2004):
subject to
thus, is equal to , and the function approximation can be rewritten as follows:
Equation 5 represents the linear case (Kernel = ‘Linear’). For the nonlinear case, SVR can map the input data to a higher-dimensional kernel space using kernel functions such as Gaussian, Polynomial and Sigmoid kernels.
Data and analyses
According to the Chinese meteorological industry standard ‘Rainfall Process Classification’ (QX/T 489–2019), six levels of rainfall intensity were defined based on monthly rainfall to explore the sensitivity of environmental factors to sap flux in three classes of S. superba under drought stress (Table 2). Accordingly, six datasets were selected from the years 2010–2013, each comprising 10-min interval sap flux data and the corresponding environmental data when was at least 5 w·m−2. Of these datasets, 80% were used for training, while the remaining 20% were used for testing. Daily transpiration ( ), calculated using Equation 1 for each class, was modeled as an output series using SVR with Scikit-learn in Python 3.12, with environmental variables served as input series. All series were standardized, denoised, and made stationary using the z-score method, Haar transformation, and differencing before modeling. Their stationarity and white noise characteristics were assessed using the Augmented Dickey-Fuller test and the Portmanteau test. During the testing phase, the Nash-Sutcliffe Efficiency coefficient (NSE) and Root Mean Square Error based on the observations’ standard deviation (RSR) were used to evaluate the effectiveness of the SVM models considering their advantages (Moriasi et al., 2007). The Root Mean Square Error (RMSE) was utilized to determine the optimum kernel function.
Where is the predicted value, is the actual value, and is the average of the actual value; n is the total number of datasets. The prediction accuracy of the models was evaluated as follows: I. very good (0.75 < NSE ≤ 1 and 0 ≤ RSR ≤ 0.5); II. good (0.65 < NSE ≤ 0.75 and 0.5 < RSR ≤ 0.6); III. Satisfactory (0.5 < NSE ≤ 0.65 and 0.6 < RSR ≤ 0.7); IV. unsatisfactory (NSE ≤ 0.5 and 0.7 < RSR).
Shapley additive explanations (SHAP) was first utilized to explain the results of the SVR models for . Unlike traditional correlation and determination coefficients, SHAP values can highlight the direction of each feature’s contribution and quantify their impacts on the final prediction, regardless of whether they are present in the test instances (Mastropietro et al., 2023). In this context, the sensitivity of environmental factors to is quantified by the mean value of |SHAP|. A higher mean value indicates greater sensitivity of those factors to , and vice versa. The accumulation of SHAP values reflects the total contributions of these factors to .
Results
Daily transpiration, sap flux and environmental factors variation
At all six levels, the coefficient of variation (CV.) of and exhibited consistent variation (Figure 1a), while their means did not align (Figure 1b). The of Class 1 was the highest, followed by Class 2 and 3. In contrast, did not consistently follow the class order, with the exception of Level 2, where Class 2 showed the highest value. This suggests that larger trees use more water in terms of transpiration. Notably, both and reached their highest values at Level 5, which may be attributed to their relative stability, indicated by lower CV value (Figure 1b).
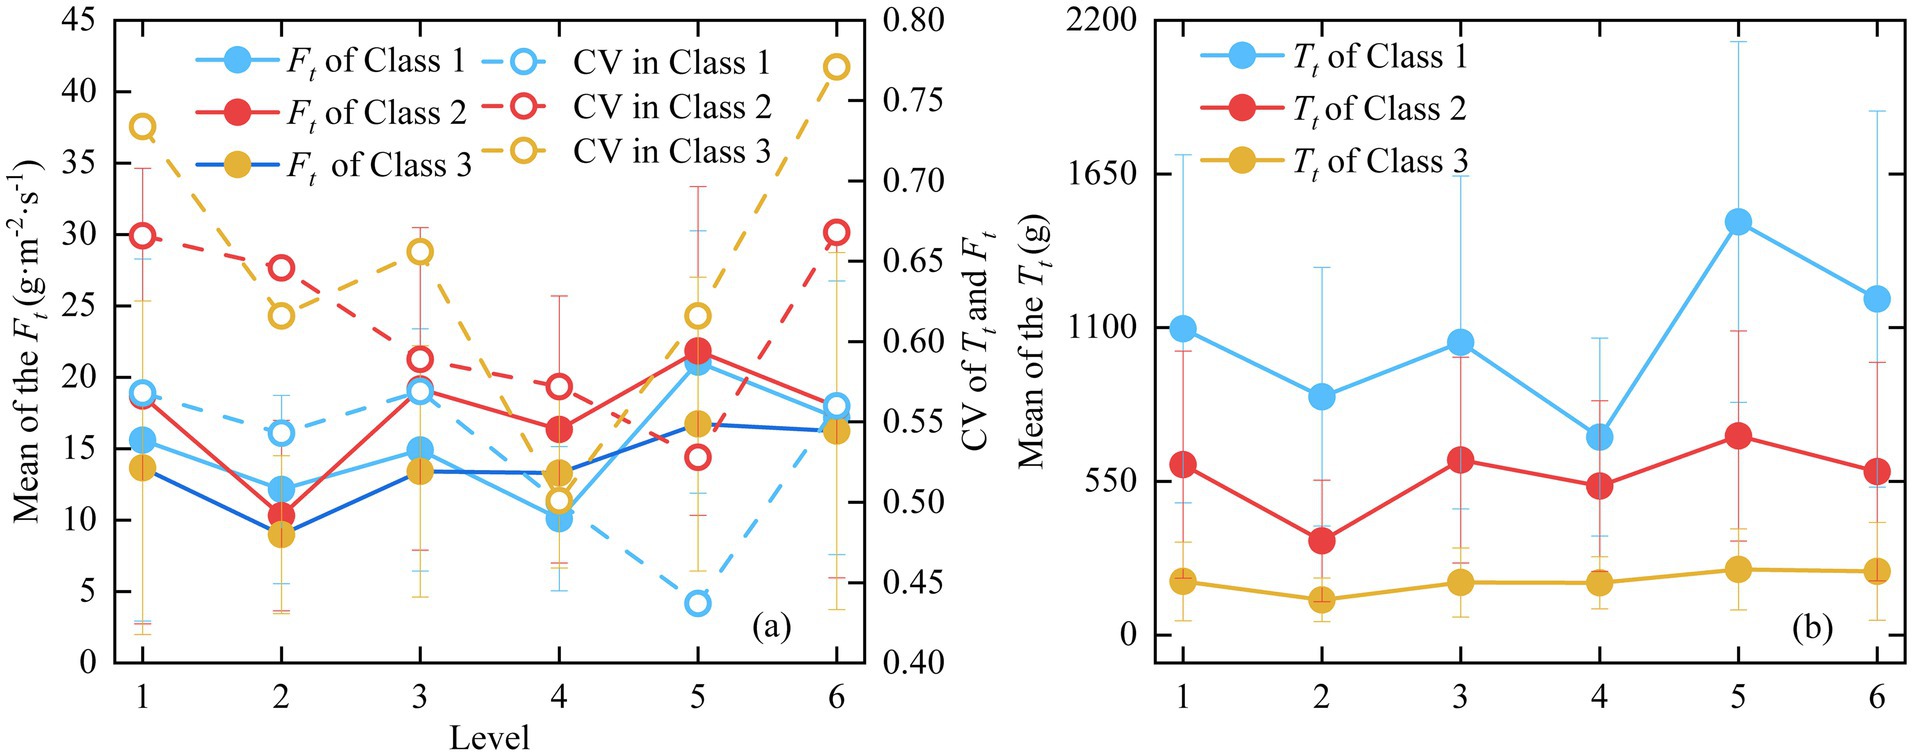
Figure 1. Changes in the original series of sap flux (Ft), daily transpiration (Tt) and their Coefficient of Variation (CV) across Levels 1 to 6. (a) mean values of Ft and CV for both Ft and Tt. (b) mean value of Tt.
Only the mean of varied consistently across the levels, indicating that monthly rainfall significantly affects . Compared to Level 1, showed a modest increase of 4% at Level 2, while it increased the most—by 52%—at Level 6 (Figure 2a). Additionally, exhibited the smallest variability among the factors (Figure 2b). For other environmental variables, the highest mean values of , and were observed at Level 5, Level 4 and Level 1, respectively, while the lowest values were found at Level 2 for , Level 2 for and Level 4 for (Figures 2a,b). Overall, exhibited the largest variability across Levels 1–4 (Figure 2b).
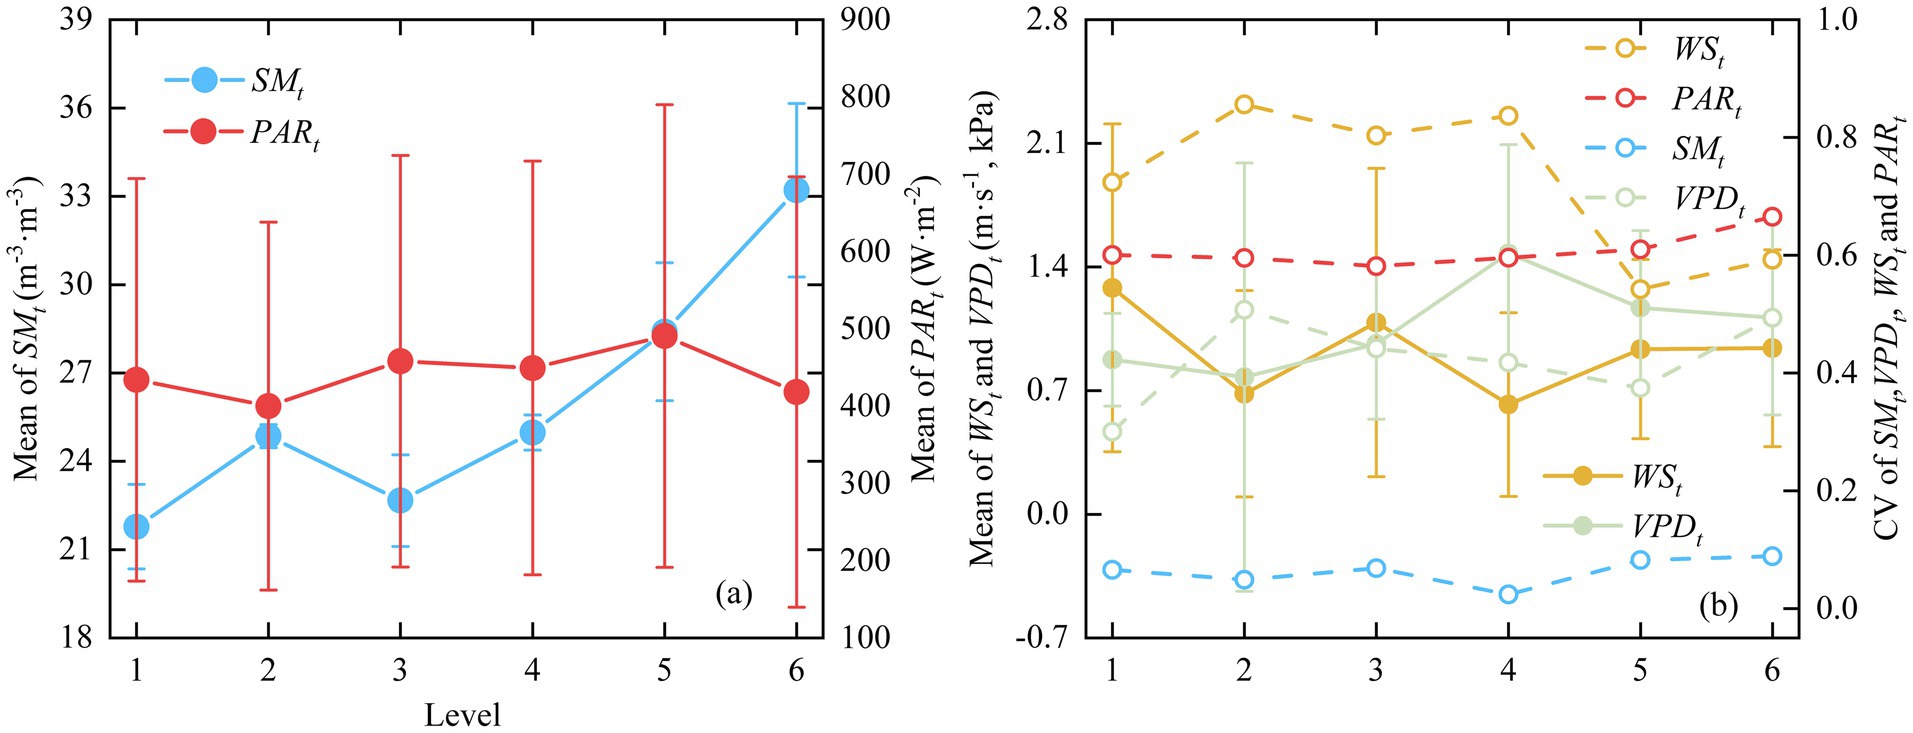
Figure 2. Changes in the original series of environmental factors and their Coefficient of Variation (CV) across Levels 1 to 6. (a) mean values of soil moisture (SMt) and photosynthetically active radiation (PARt). (b) mean values of wind speed (WSt), air vapor pressure deficit (VPDt), and the CV for SMt, VPDt and PARt.
Model establishing and calibration
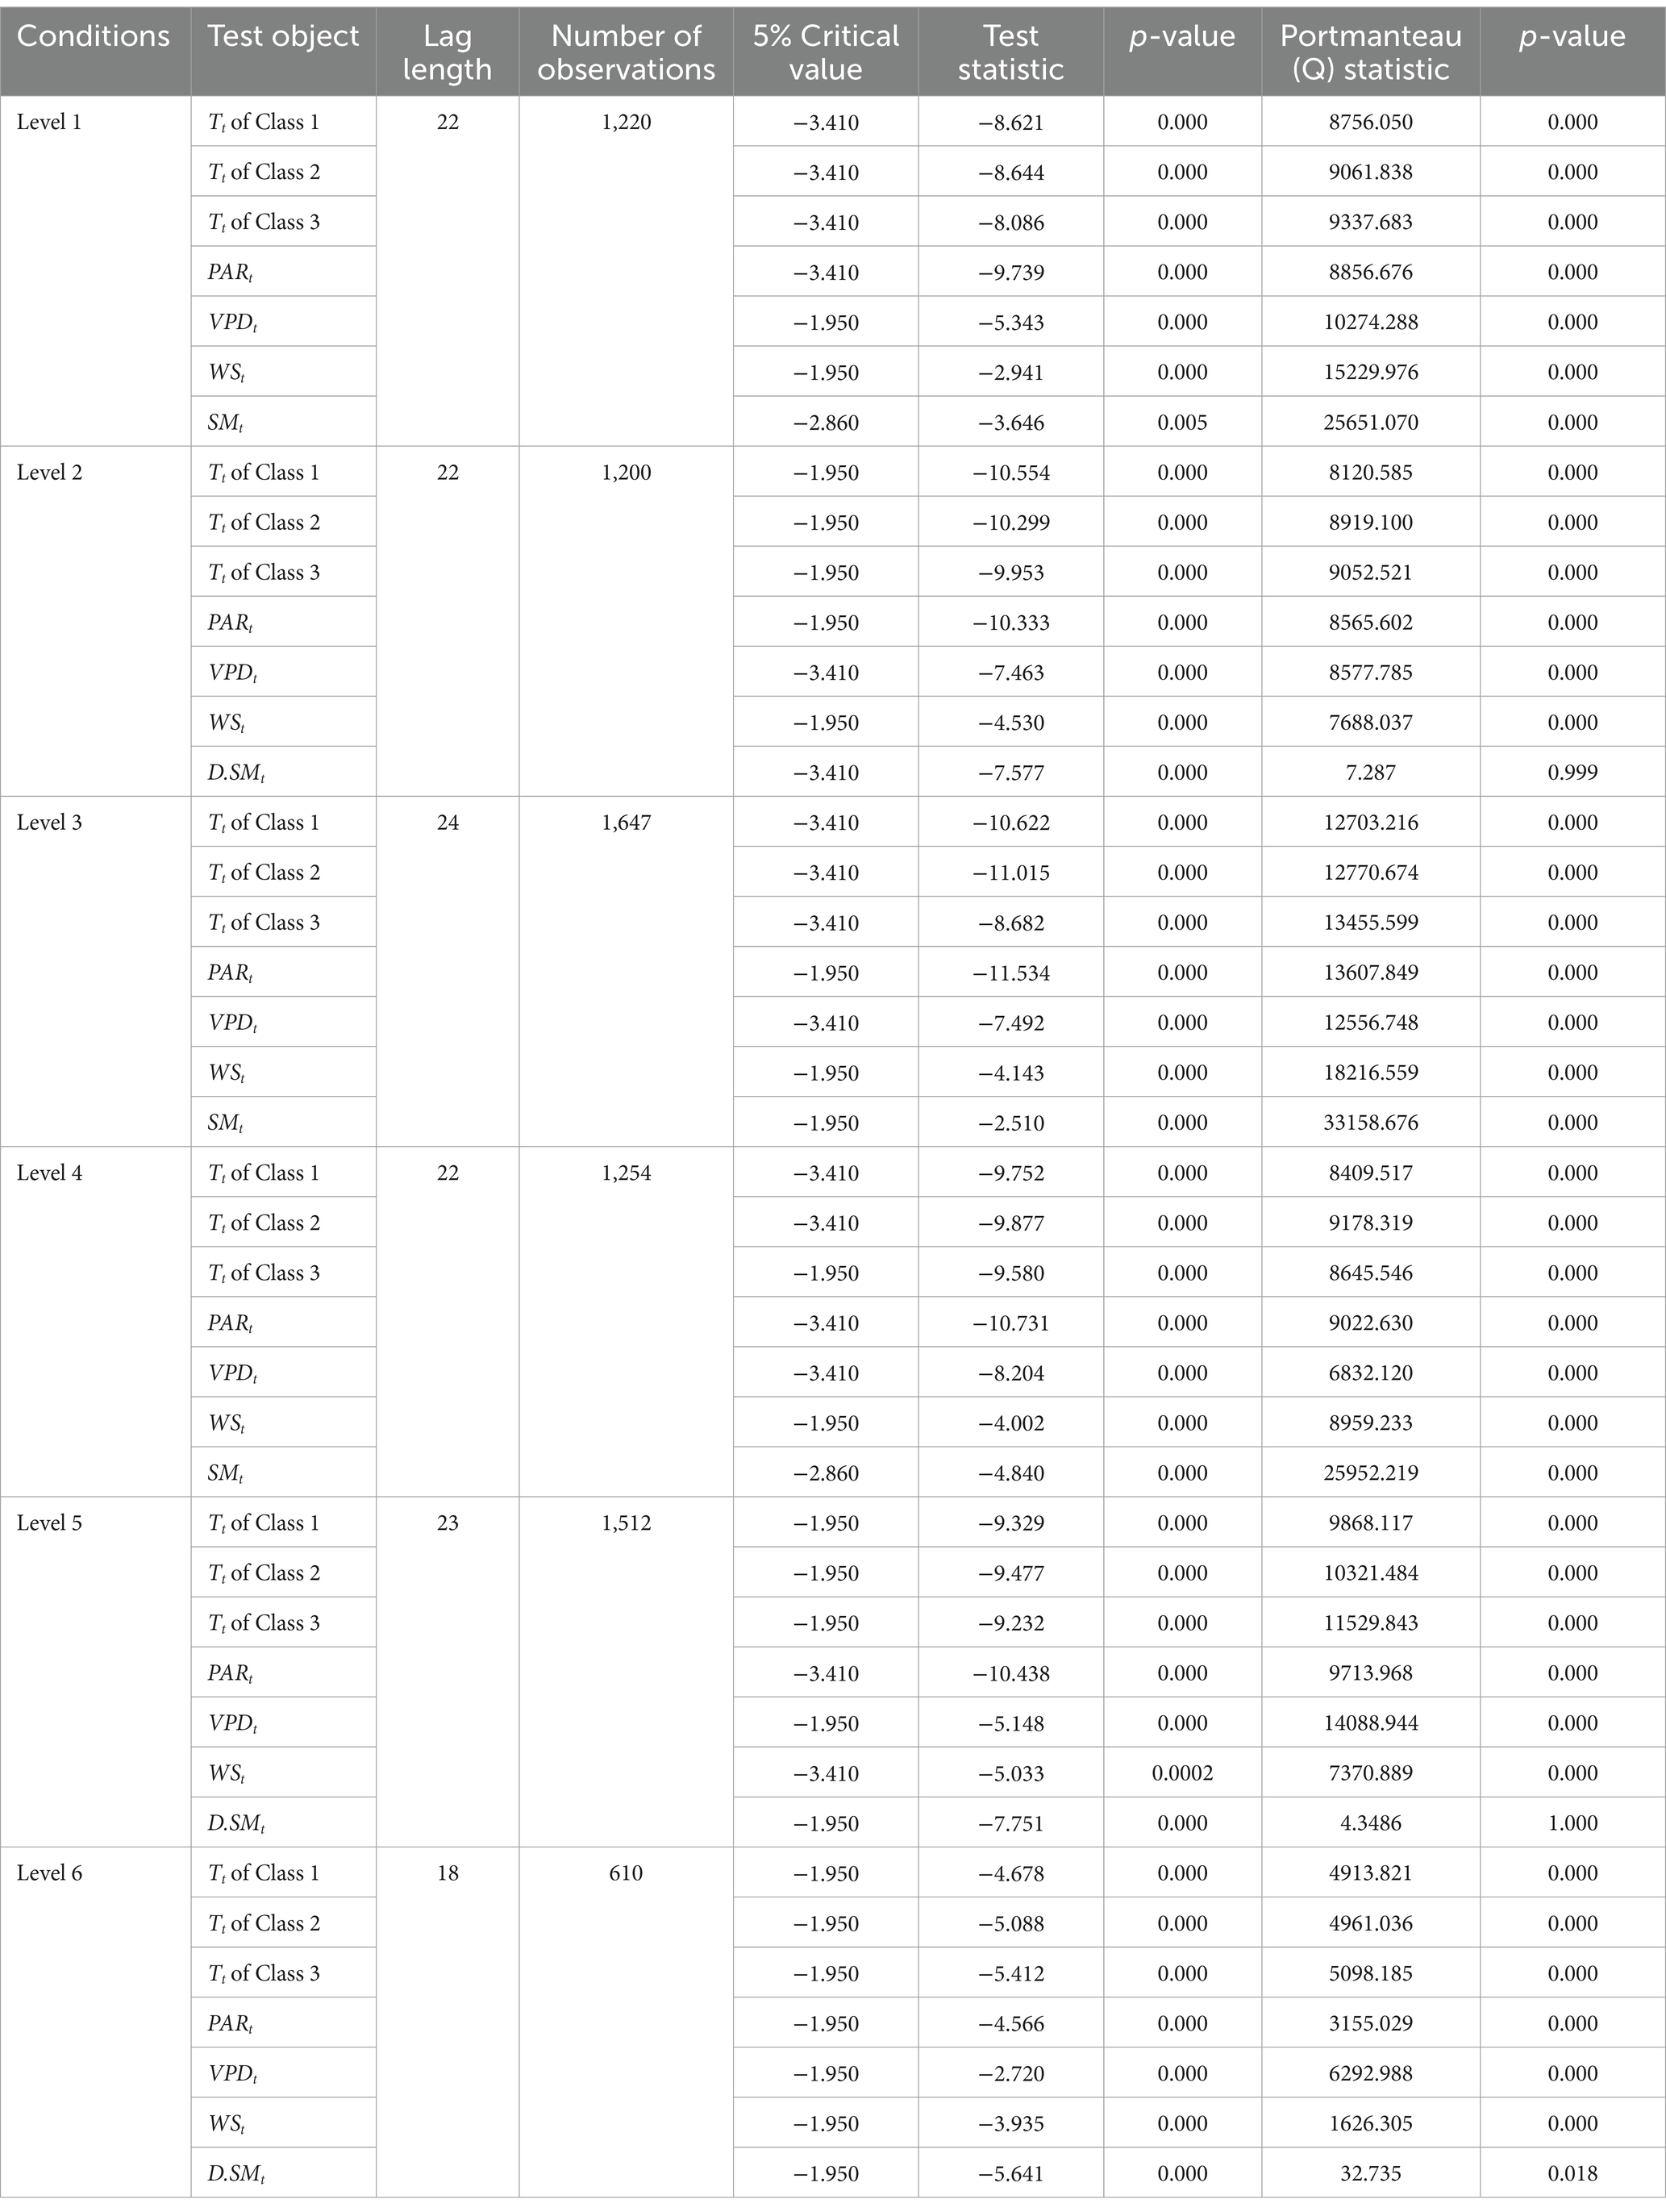
For rigor, the time series of all participating models used for training were stationary and no-white noise (Table 3). The first-order difference of (denoted as D. ) for Level 2, 5 and 6 was stationary (p < 0.05), while D. for Level 2 exhibited white noise characteristics (p > 0.05). The series for the others levels were stationary and non-white noise at the current order (p < 0.05).
Eighteen SVR models with linear kernels, based on Equation 8 and corresponding to six levels, were developed, with the predictions shown in Figure 3. Fifteen models across all three classes at Levels 1–5 were successfully constructed and performed very well based on Equations 6 and 7, with NSE values ranging from 0.77 ~ 0.98 and RSR values from 0.16 ~ 0.48. However, only three models corresponding to the three classes at level 6 performed poorly, with NSE values ranging from −0.41 to −0.17 and RSR values from 1.08 to 1.19.
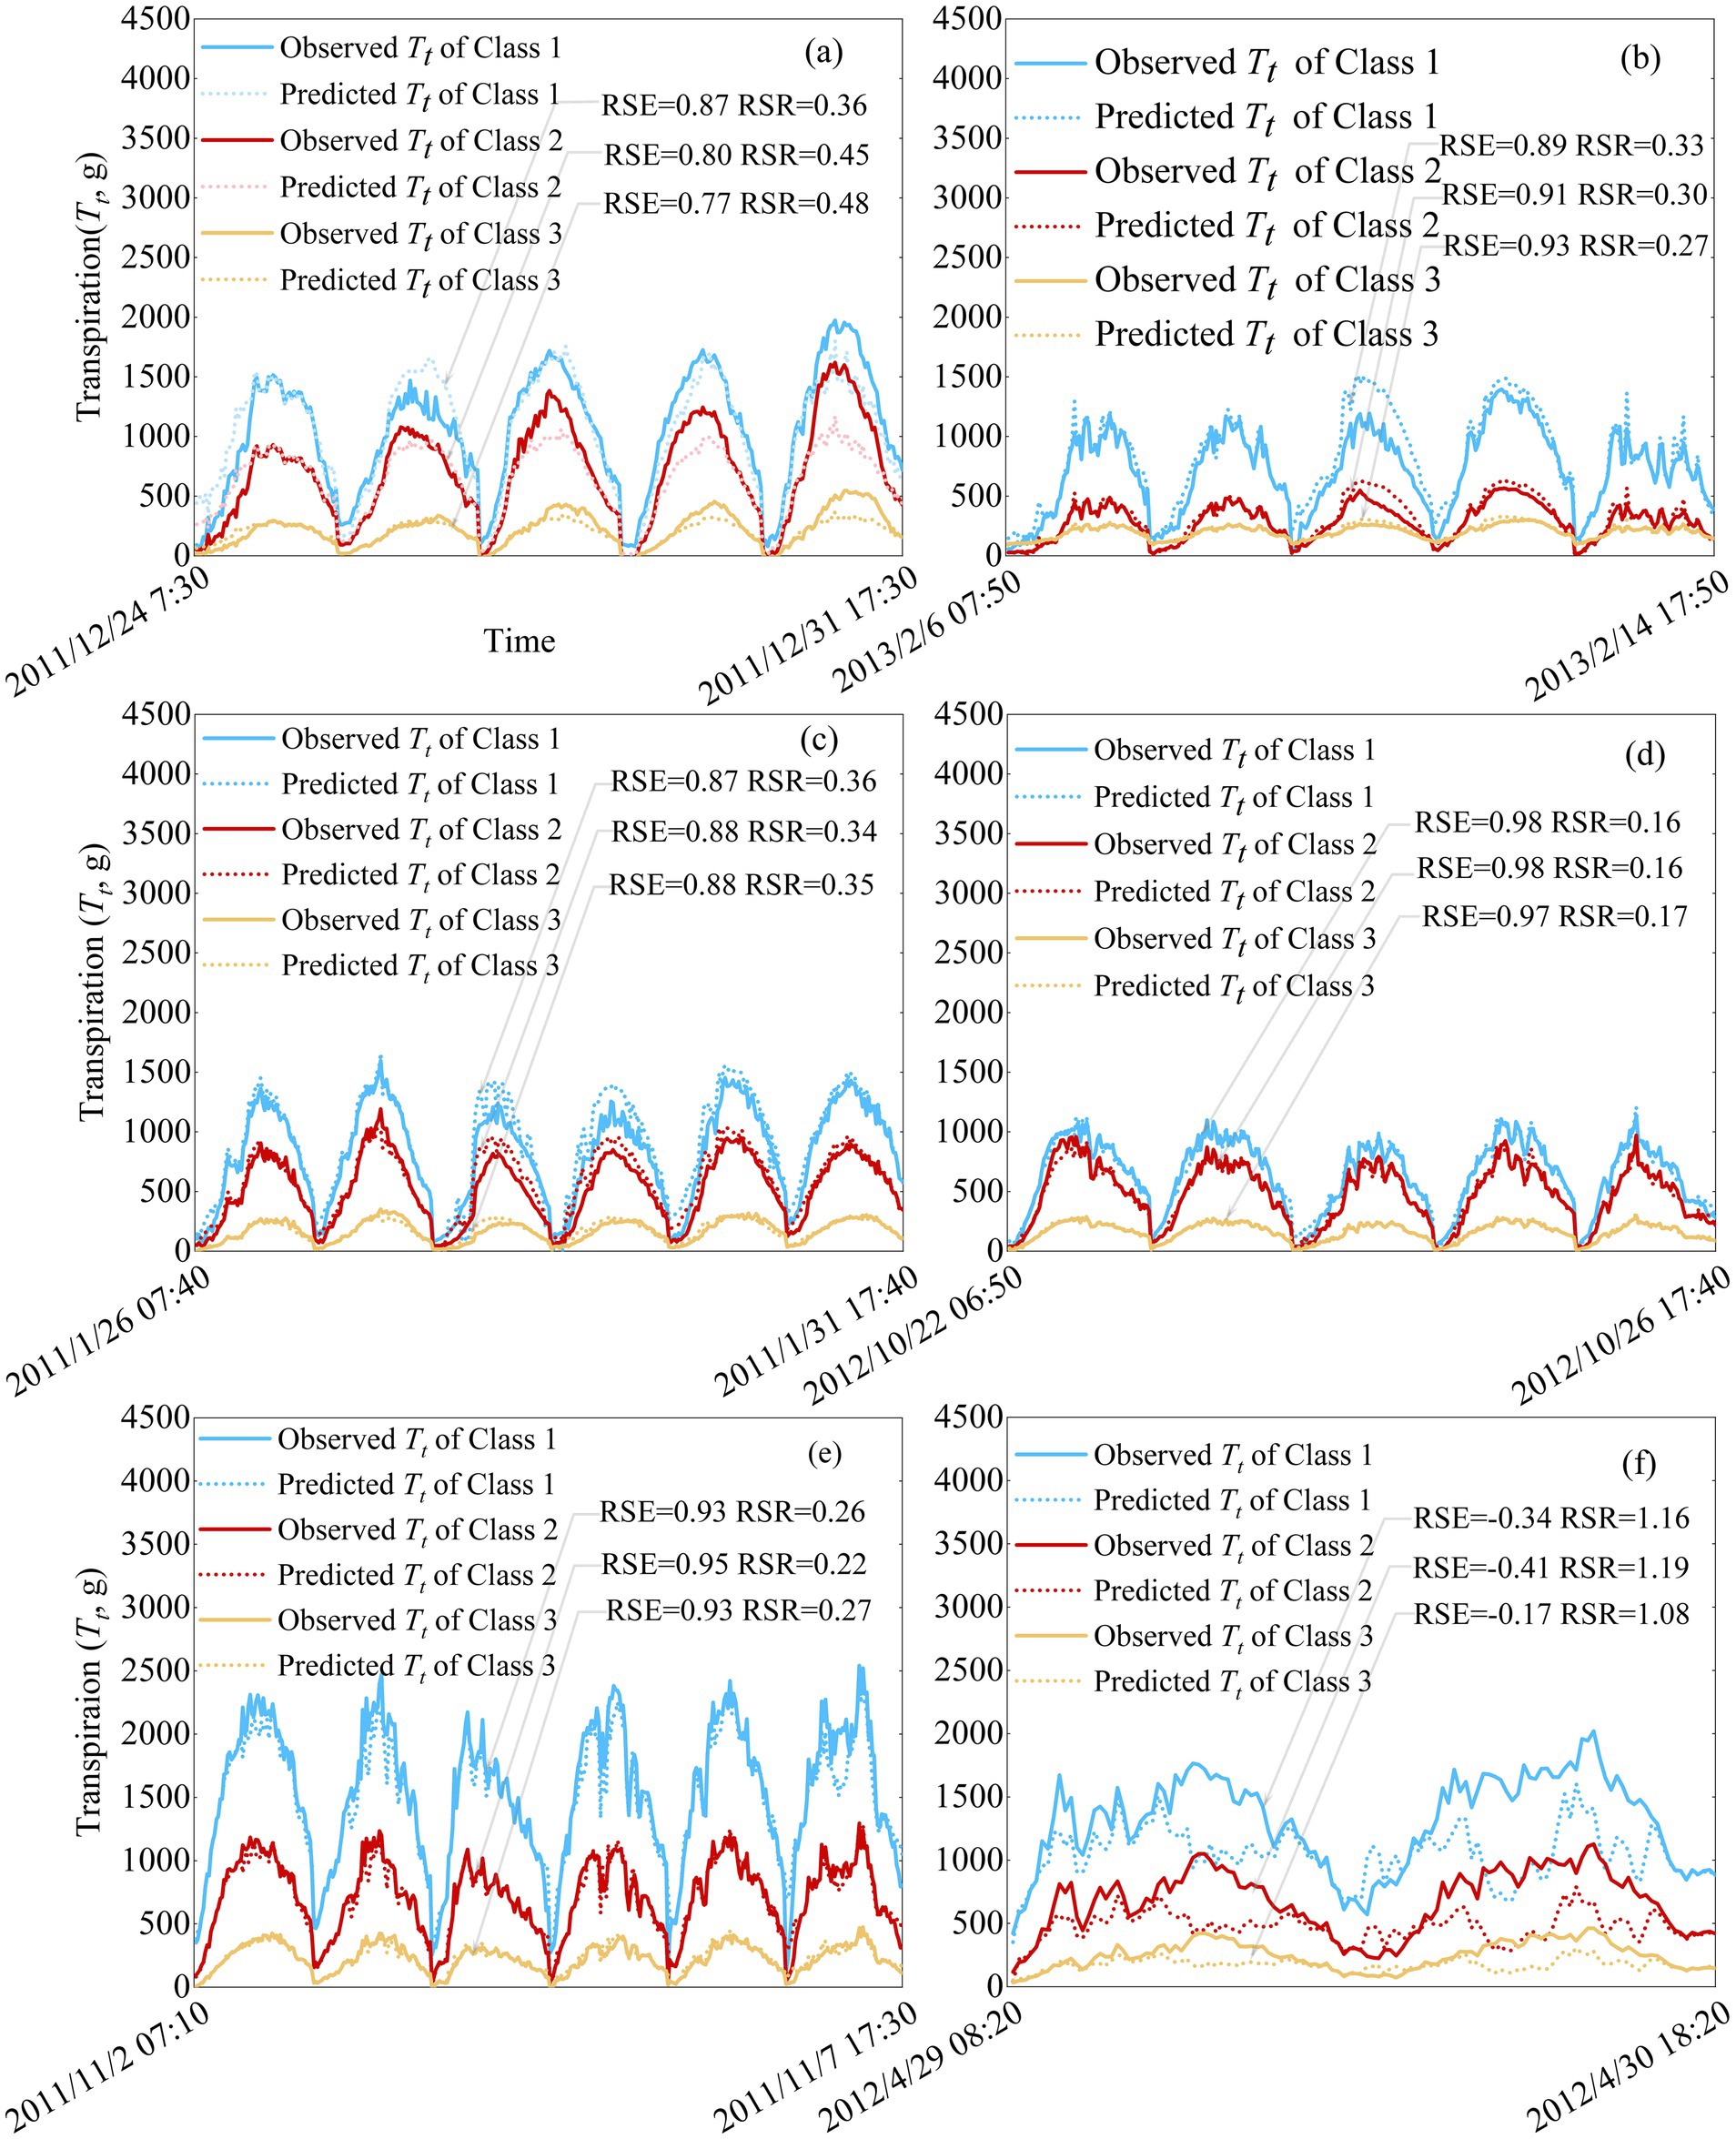
Figure 3. SVR testing results for daily transpiration in Classes1 to 3 across Levels 1 to 6. (a) Level 1. (b) Level 2. (c) Level 3. (d) Level 4. (e) Level 5. (f) Level 6.
Sensitivity of transpiration to environmental factors
From Figure 3f, the very poor performance of the SVM models at Level 6 indicated that the four environmental factors are insensitive to daily transpiration ( ). As a result, the total contribution of all factors to at Level 6 could not be predicted. At Levels 1–5, where high-accuracy prediction models were established, was found to be the most sensitive factor to , followed by and , with exhibiting the least sensitivity (Figures 4d–f–8d–f). However, the sensitivity of the three classes did not differ significantly across Levels 1–5 (p > 0.05, Table 4), suggesting that the observed sensitivity is not related to tree size. Interestingly, the total contributions of and to does not align with this order, except at levels 4 and 5 (Figures 4a–c–8a–c). The Mann–Whitney U test indicated that the contributions of all factors to among the three classes did not differ significantly between Levels 1–5 (p > 0.05, Table 5). Similar results were observed within levels, except for at level 5 and at level 1. Additionally, the directions of contribution were consistent across the same levels. However, the effect of to for three classes at Levels 2 and 5 could not be predicted, as D. was considered white noise.
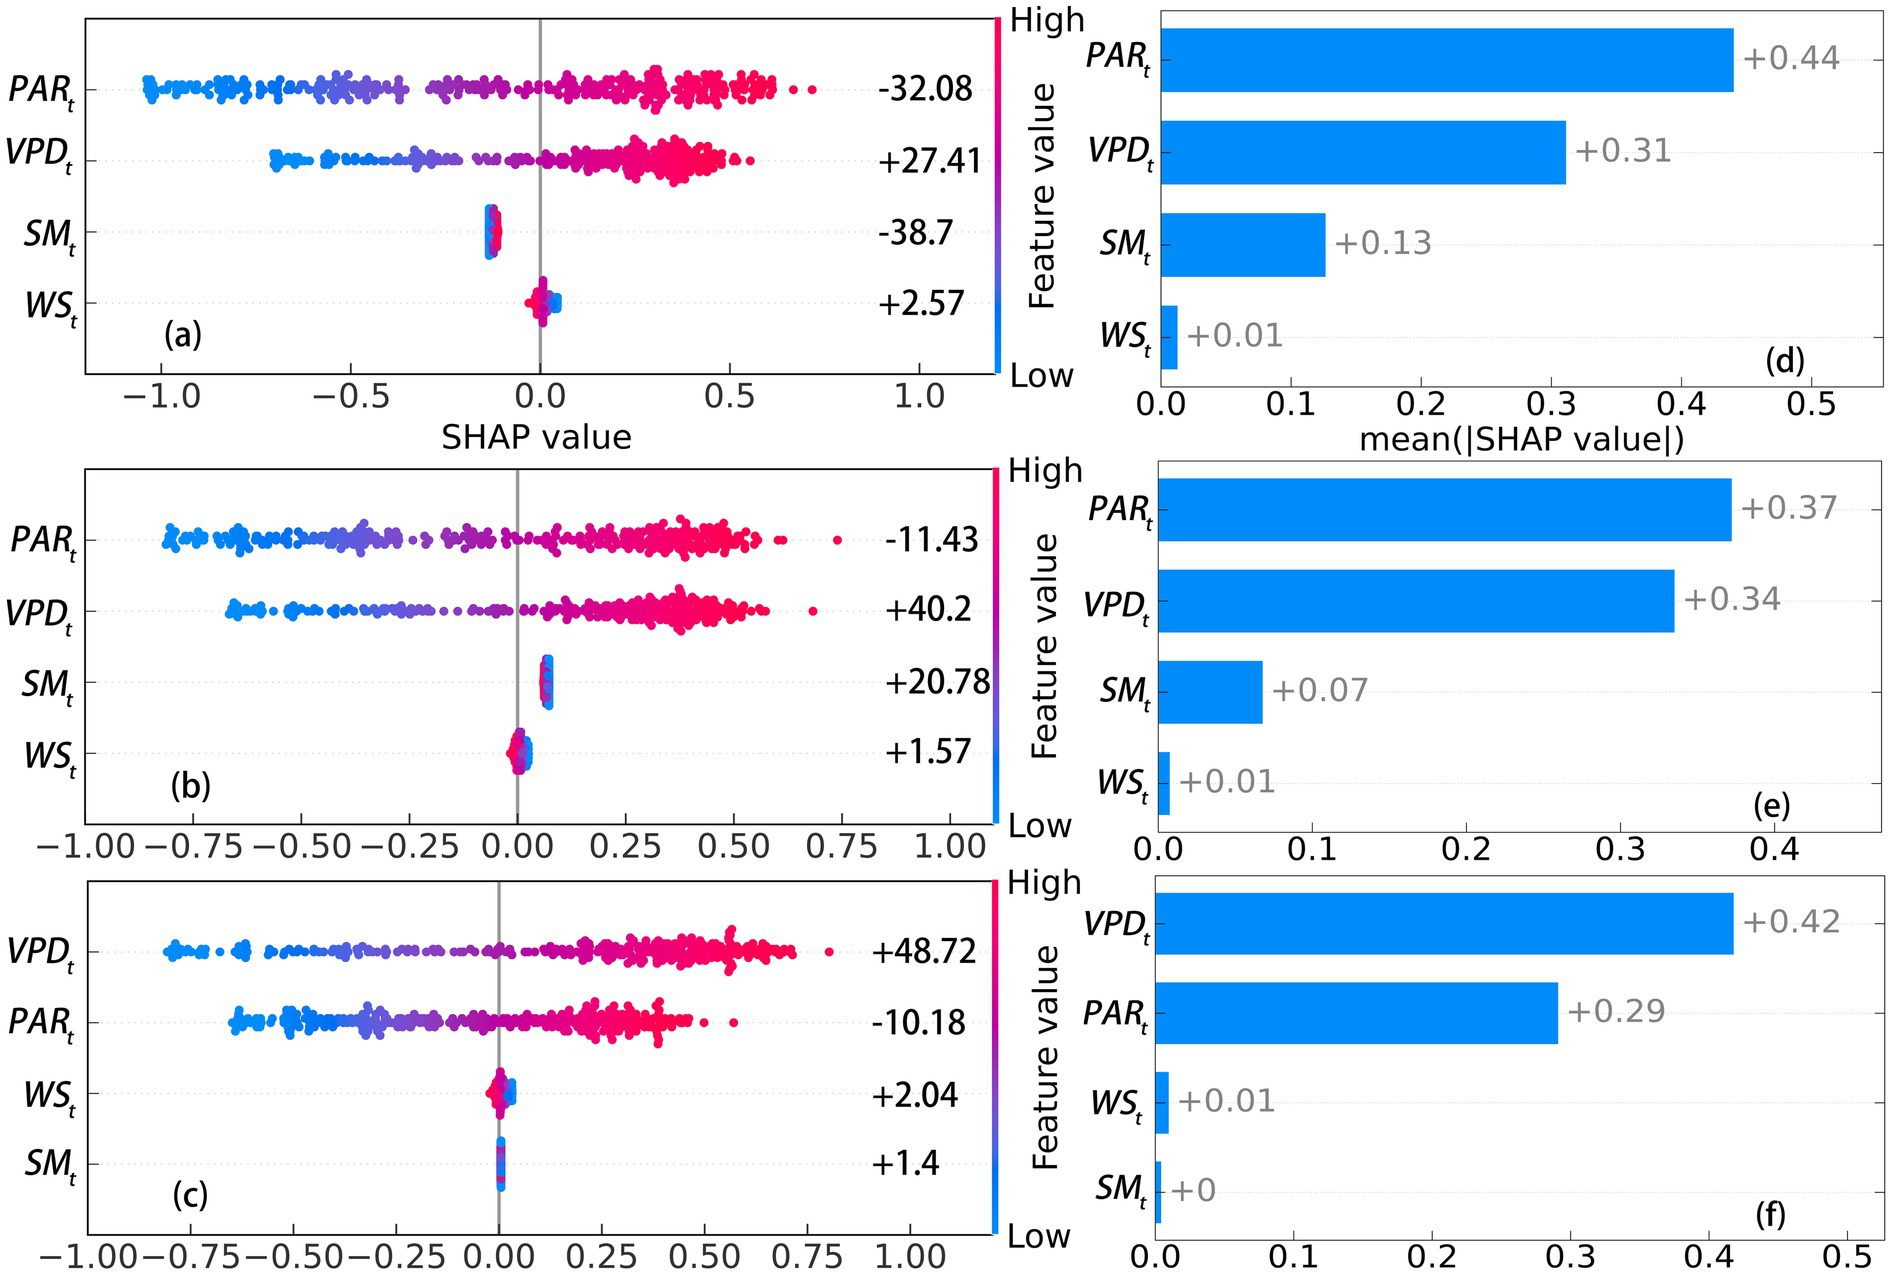
Figure 4. SHAP values of environmental factors affecting transpiration in Classes 1 to 3 at Level 1. (a-c) SHAP values for Class 1 to 3. (d-f) mean |SHAP values| for Class 1 to 3.
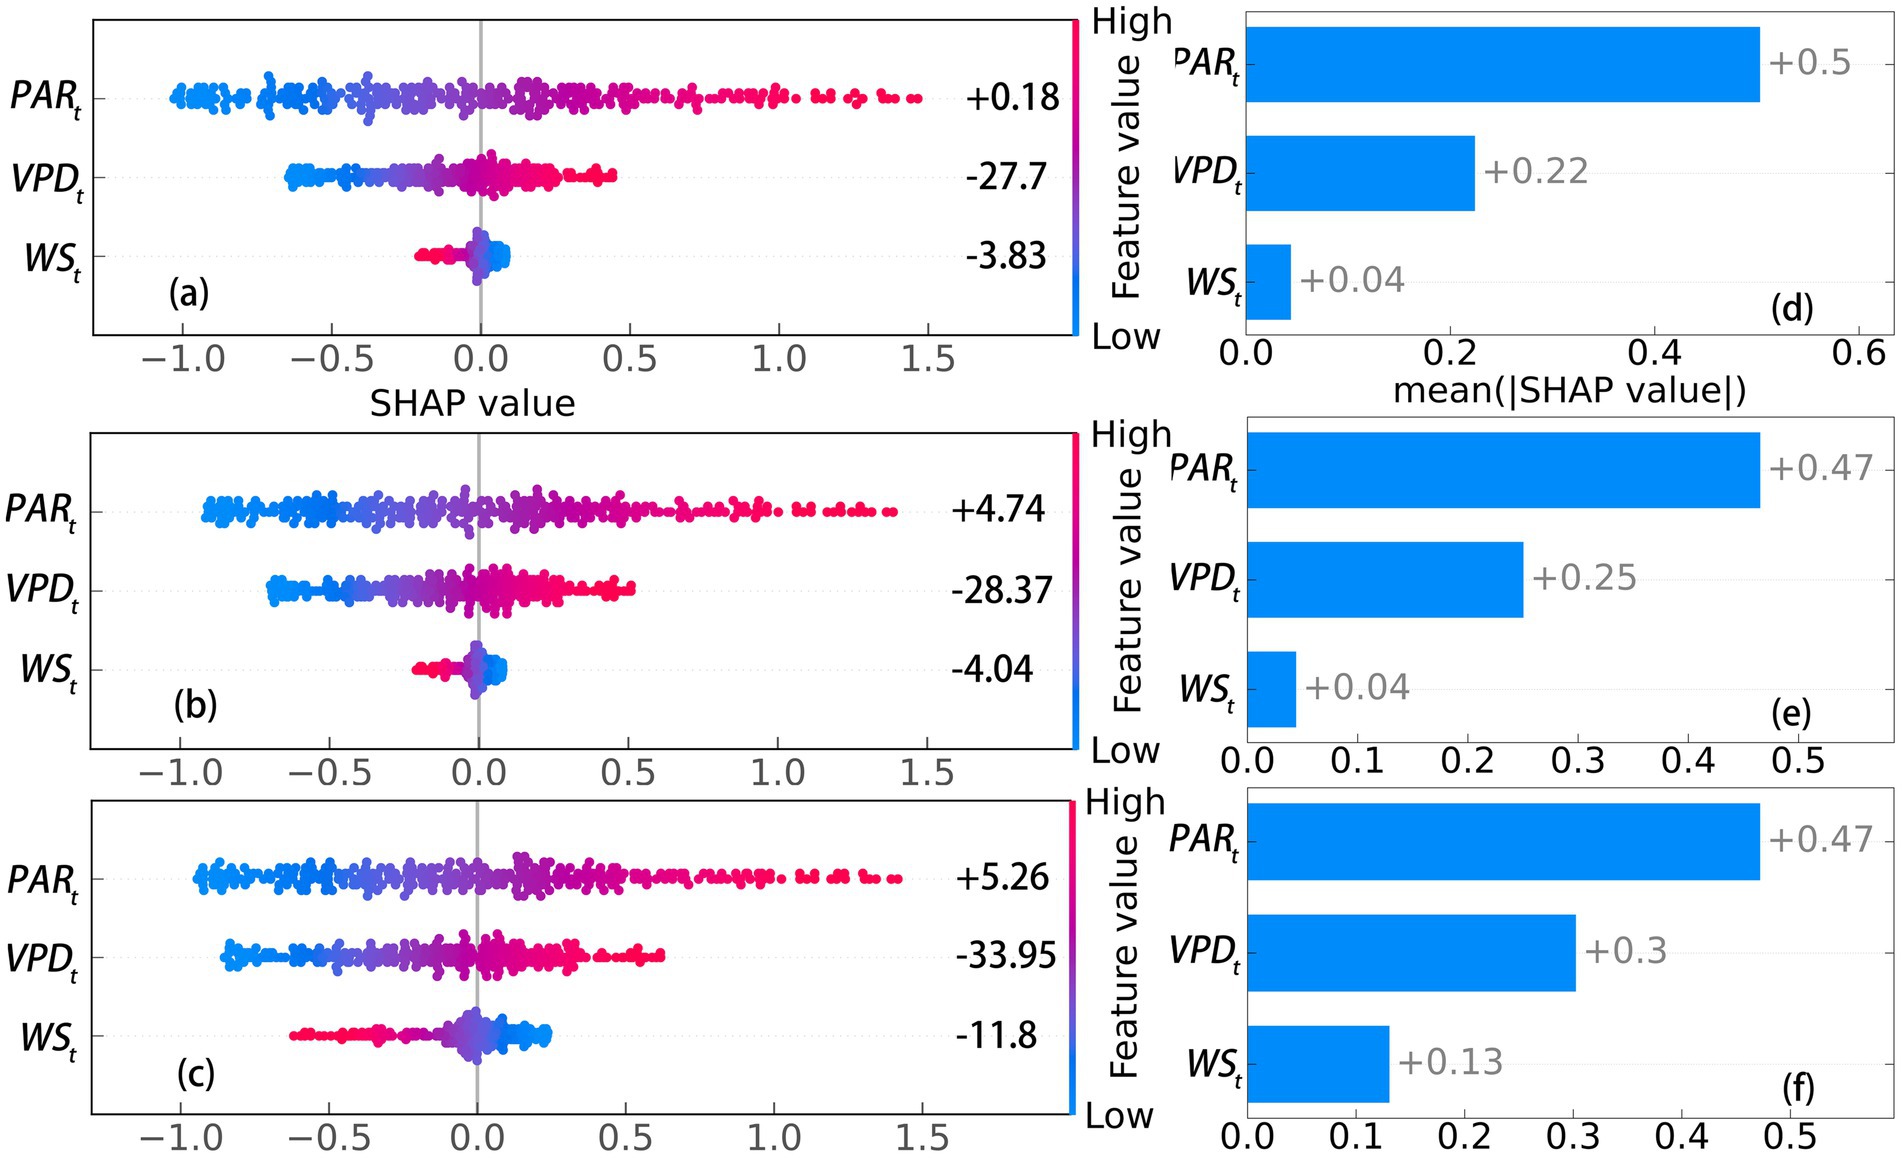
Figure 5. SHAP values of environmental factors affecting transpiration in Classes 1 to 3 at Level 2. (a-c) SHAP values for Class 1 to 3. (d-f) mean |SHAP values| for Class 1 to 3.
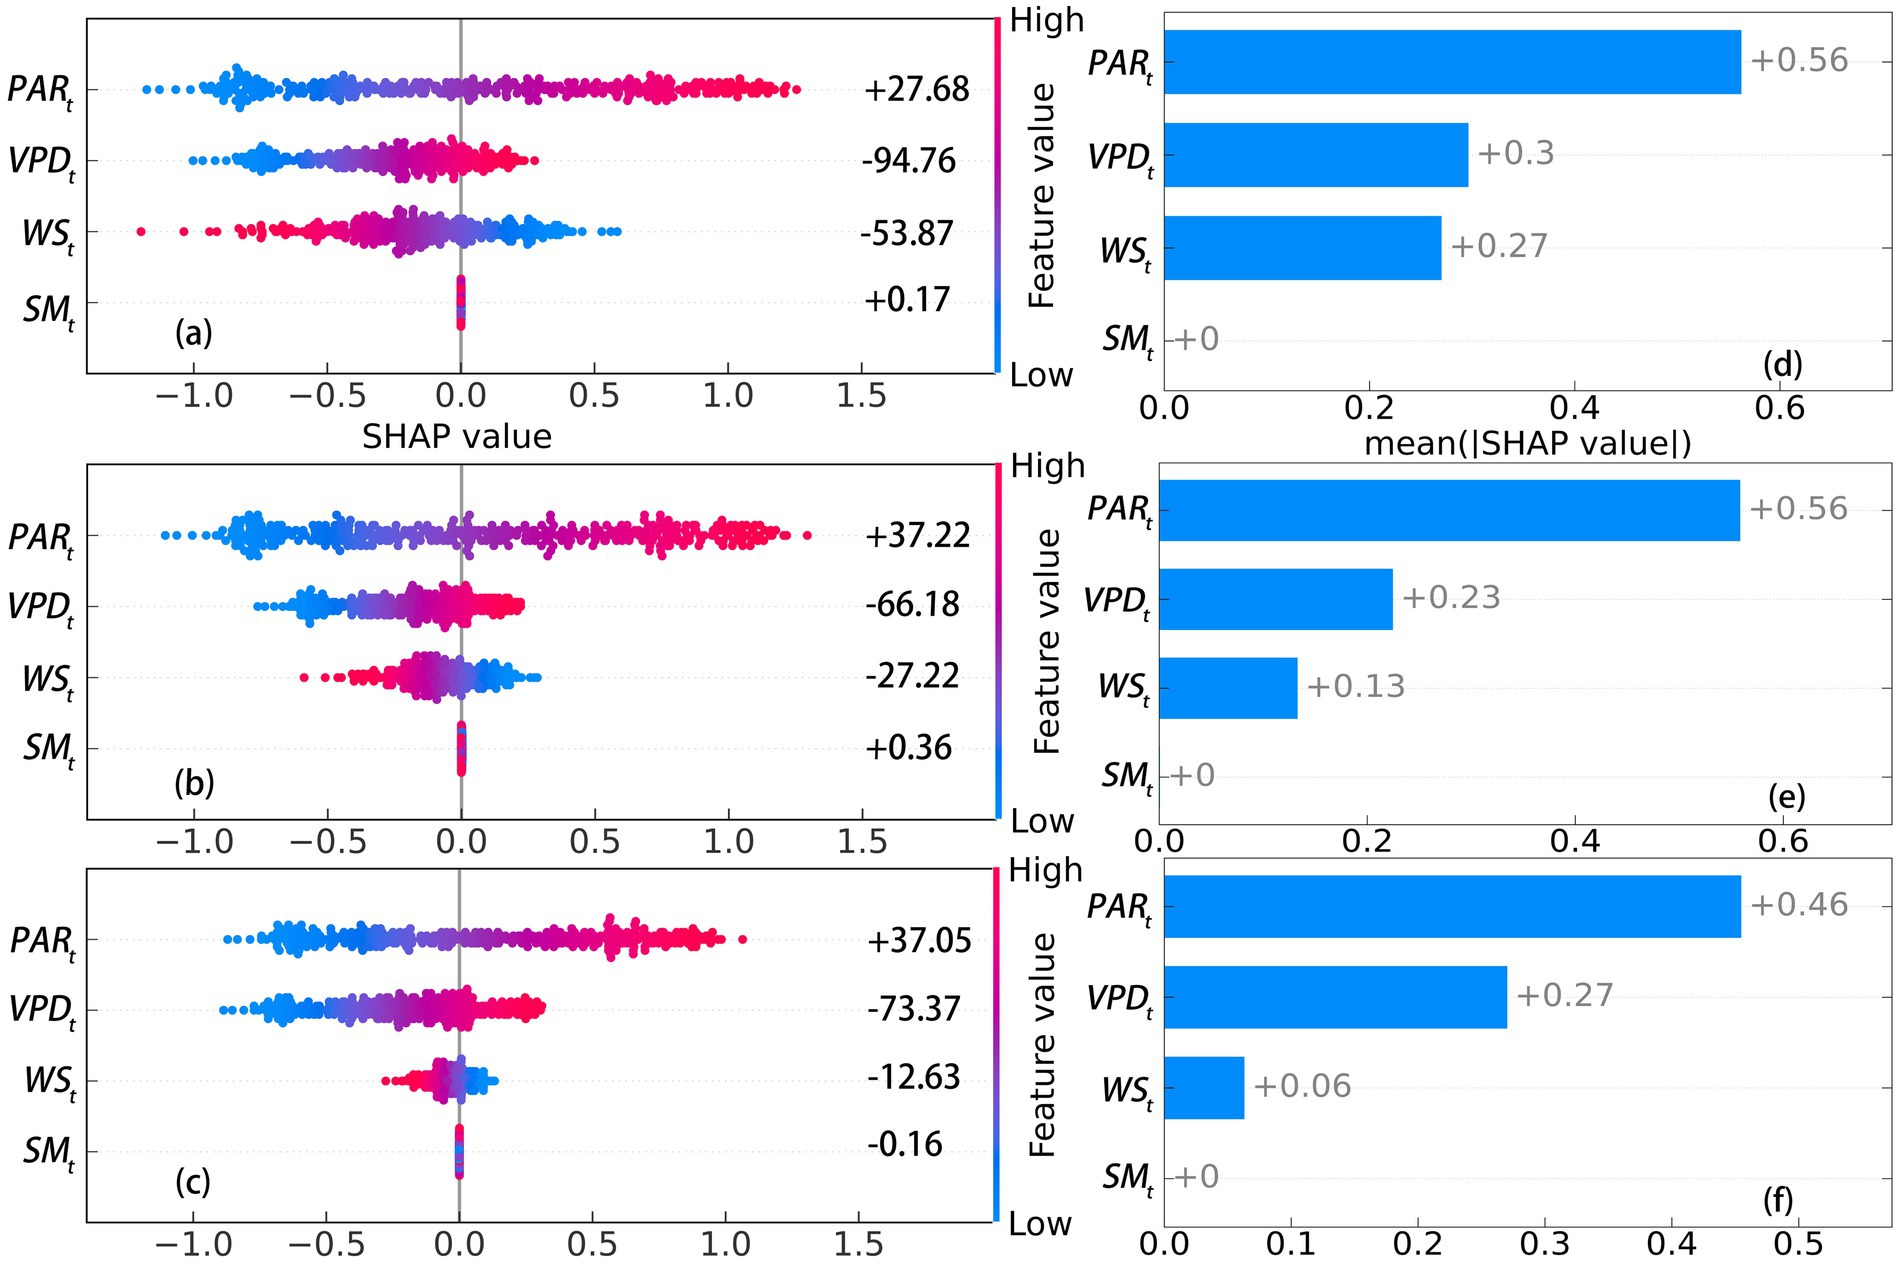
Figure 6. SHAP values of environmental factors affecting transpiration in Classes 1 to 3 at Level 3. (a-c) SHAP values for Class 1 to 3. (d-f) mean |SHAP values| for Class 1 to 3.
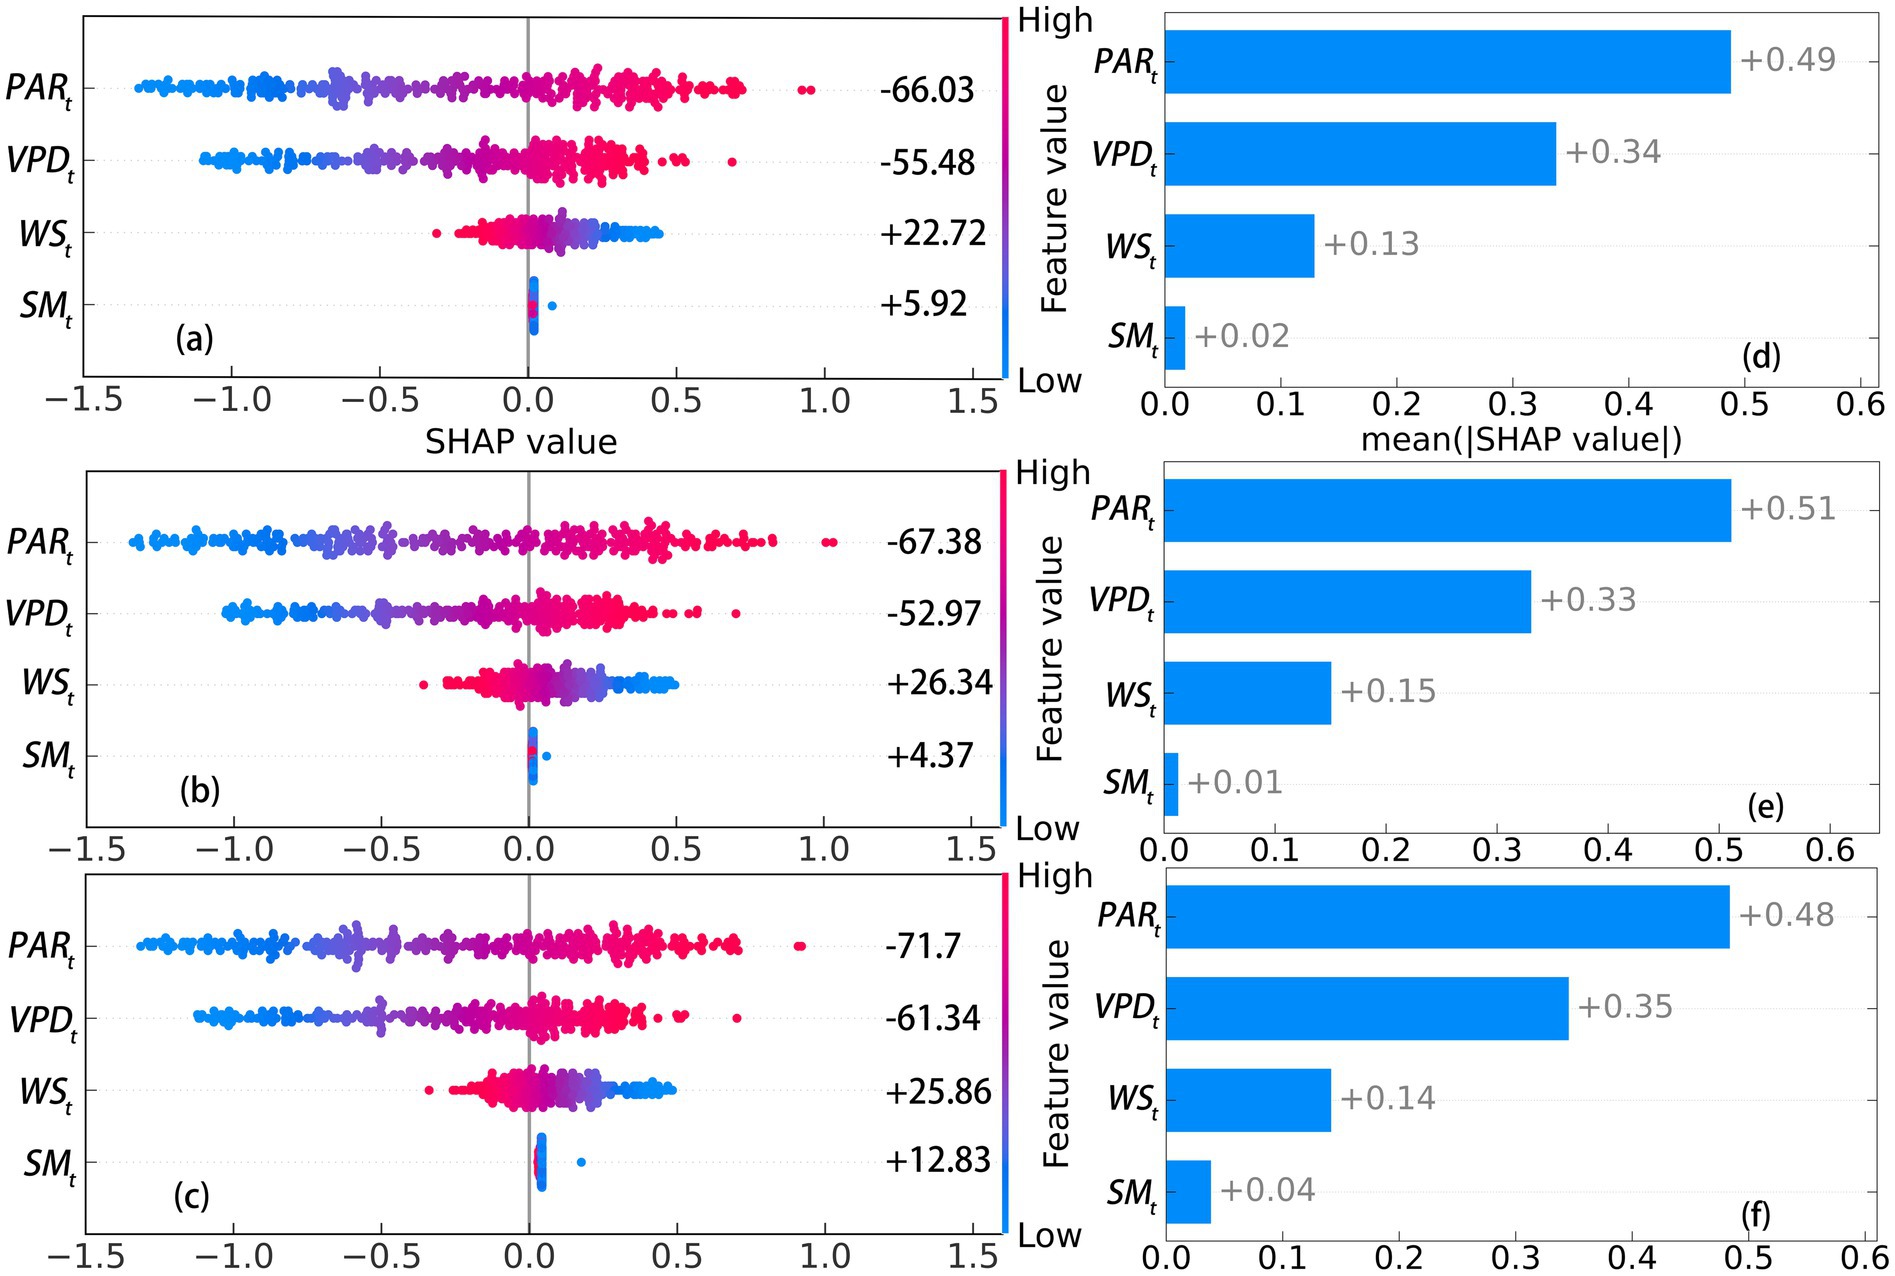
Figure 7. SHAP values of environmental factors affecting transpiration in Classes 1 to 3 at Level 4. (a-c) SHAP values for Class 1 to 3. (d-f) mean |SHAP values| for Class 1 to 3.
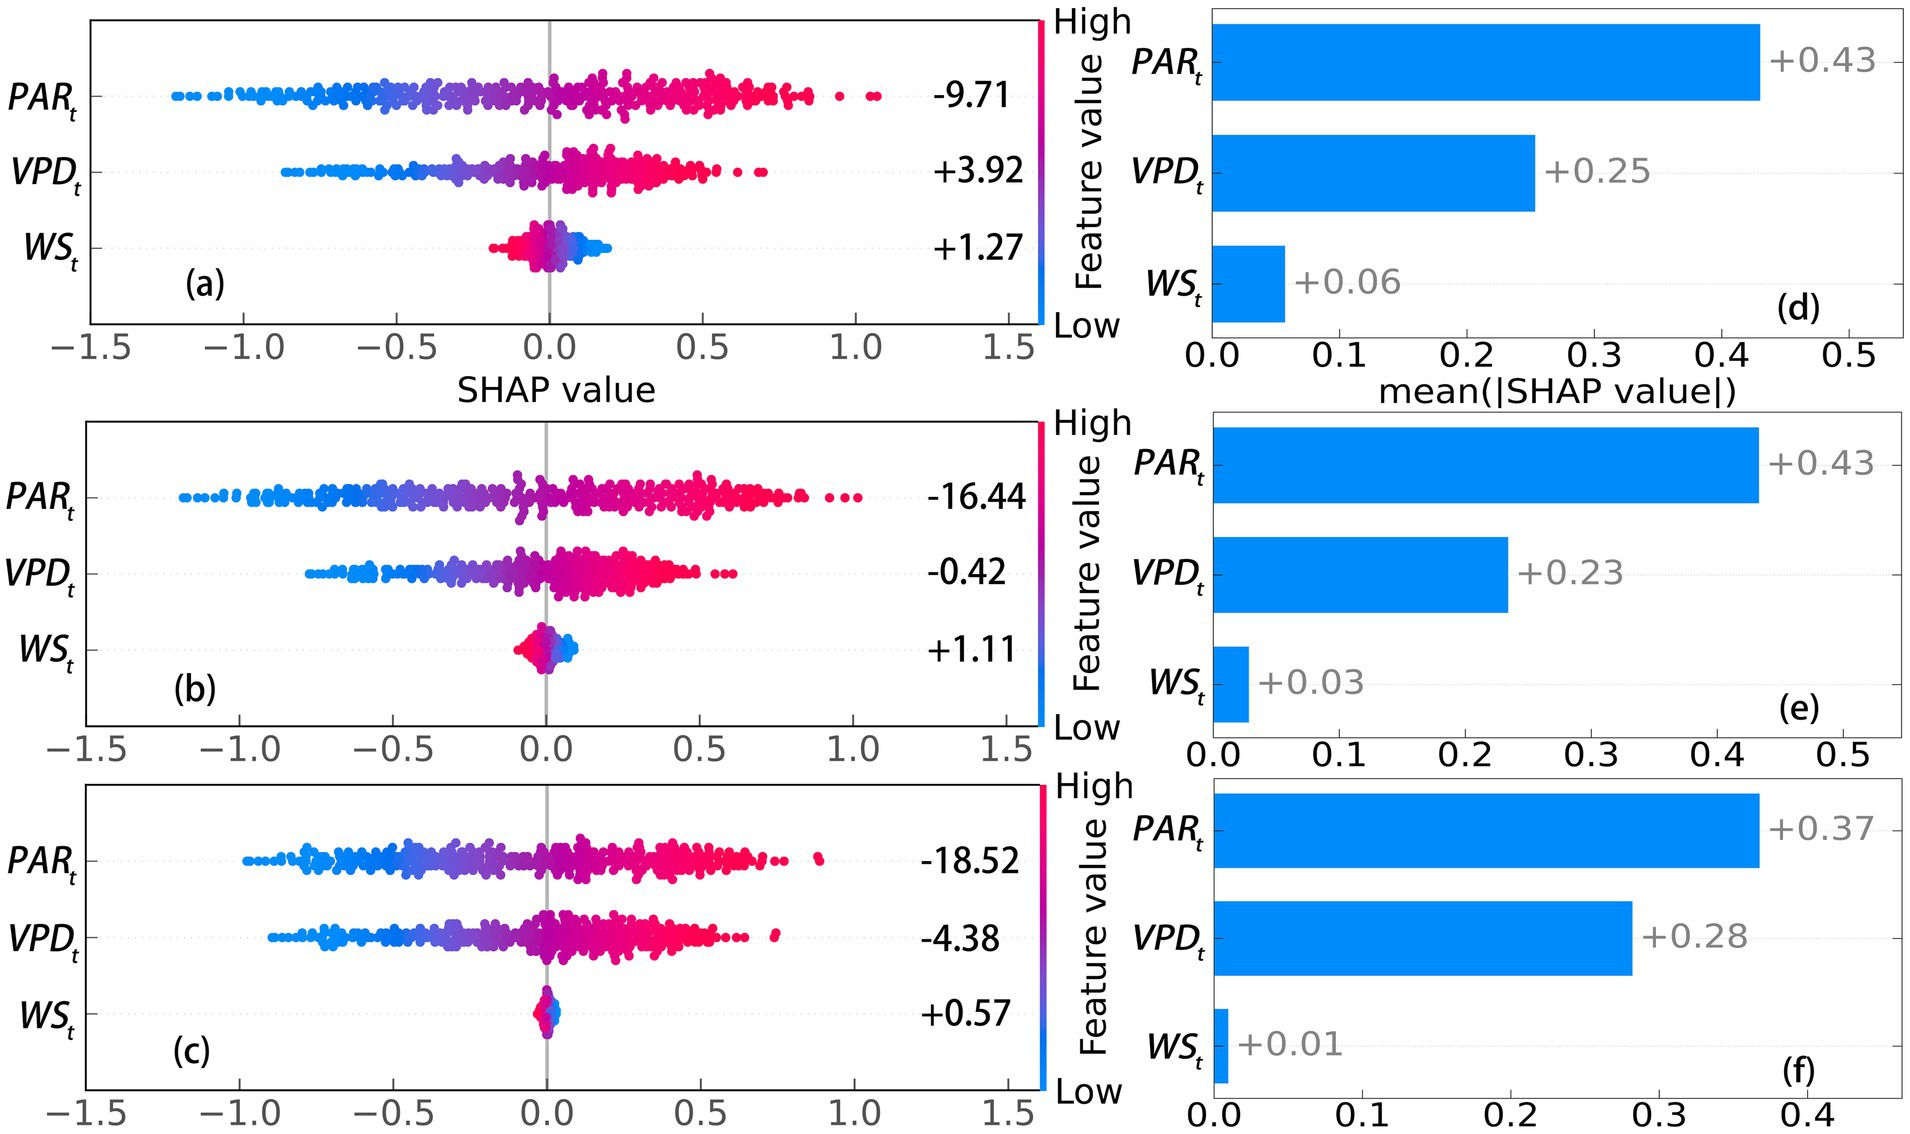
Figure 8. SHAP values of environmental factors affecting transpiration in Classes1 to 3 at Level 5. (a-c) SHAP values for Class 1 to 3. (d-f) mean |SHAP values| for Class 1 to 3.

Table 4. Mann–Whitney U test results for the mean |SHAP| values of all factors across three classes at Level 1–5.

Table 5. Mann–Whitney U test for the accumulated SHAP values of all factors across three classes at Level 1–5.
Interaction of environmental factors
External environmental factors not only affect the transpiration of trees individually but also regulate transpiration through complex interactions. For example, high , and high generally increase transpiration. However, under conditions of low or increased , trees may respond to these factors by closing their stomata, thereby limiting transpiration. The synergistic or antagonistic interactions among these factors depend on specific environmental conditions, plant species, and forest types. From Supplementary Figures 1, 4, 6, it is evident that (at Levels 1, 3 and 4), and (at Levels 1–5) did not significantly impact the influence of to across the three tree classes at Levels 1, 3 and 4, as they transitioned without trends with . This indicates that there is no interaction between and , and , or and concerning . In contrast, negatively influenced the effects of and the reduction of to the predicted (Supplementary Figures 2, 3) across all classes at Levels 1, 3 and 4, except for class 1 at Level 1 (Supplementary Figures 2a1, 3a1). Similarly, also negatively impacted the influence of to across all classes at Levels 1–5 (Supplementary Figure 5), except for Class 3 at Level 5 (Supplementary Figure 5e3).
Discussion
Several key factors, including , , , , , and , have been identified as major determinants of tree transpiration (e.g., Juhász et al., 2013; Shen et al., 2015; Wang et al., 2017; Wei et al., 2017; Xu and Yu, 2020; Chen et al., 2022). However, Ta, RH, and , which is derived from the first two, are often considered simultaneously in regression models, potentially leading to collinearity issues (e.g., Yu et al., 2009; Liu et al., 2017; Wei et al., 2017; Han et al., 2019). While some studies employ principle component analysis (PCA) to address collinearity, eliminating multicollinear factors can enhance the efficiency of deep learning (DL) models (O'Brien et al., 2004; Juice et al., 2016; Xu and Yu, 2020; Li et al., 2022). Fan et al. (2020) compared the three ML models and one DL model in estimating daily maize transpiration, finding that deep neural networks (DNN) outperformed the others, with support vector machines (SVM) being the next best. In contrast, this study utilized an SVM that accounts for autocorrelation to analyze the sensitivity of the whole-tree transpiration of S. superba is to environmental factors, particularly because DNNs performed poorly. Variables included were , , and , while Ta and RH were excluded. Additionally, monthly precipitation was considered a limiting factor for measuring drought.
Overall, and exhibited the highest sensitivity to when ≤300 mm (Levels 1–5), during which the SVR models were well-developed. Numerous studies have been conducted across different climate zones and ecosystems. Based on traditional regression analysis, the influence of on and transpiration is often greater than that of in tropical climate zones (e.g., Oguntunde and Oguntuase, 2007; Köhler et al., 2010; Huang et al., 2021). Conversely, in temperate climates, the impact of tends to be greater than that of (e.g., Huang et al., 2010; Yue et al., 2008; Zheng and Wang, 2015; Shen et al., 2015; Wei et al., 2017; Thomsen et al., 2020). Although this research was conducted in a subtropical climate zone, was found to be more responsive to than to , aligning with the findings of Wang et al. (2017). However, exhibited the opposite trend, except at Level 3, indicating that depressed trees are unable to tolerate water deficits in their leaves. This may be attributed to their relatively unstable CO2 assimilation and low biomass allocation due to shallow roots (Sabir et al., 2020; Zafar et al., 2019). The effects of on and transpiration were inconsistent due to substantial temporal variation (e.g., Tang et al., 2006; Chen et al., 2019; Chen et al., 2022), although significant effects were noted (e.g., Oguntunde and Oguntuase, 2007; Huang et al., 2010; Huang et al., 2015). There are primarily two different responses of transpiration to increases in , as noted by Laplace et al. (2013): linear responses (e.g., Juhász et al., 2013; Wang et al., 2017) and saturated responses (e.g., Li et al., 2022; Chen et al., 2024). Moreover, tends to affect the daytime more than nighttime (Han et al., 2019). In our study, was the third most sensitive factor affecting daytime of S. superba, exhibiting linear decreases. Additionally, it influences other factors. Komatsu et al. (2006) found that the promotion of to depends on <0.7 m·s−1. We observed that negatively influenced the overall promotion of to (Supplementary Figure 5). However, tree size did not significantly influence the responses of to , and (Table 4), despite the theoretical expectation that larger trees would have a greater impact due to their increased surface area in contact with the atmosphere. The discrepancy may be attributed to variations in the actual contact area, which could depend on other factors such as the vertical distribution of leaf area and transient differences caused by fluctuations in wind speed, rather than just plant height and leaf size. Similar to , most studies suggest that significantly affects and transpiration, except for those by Tang et al. (2006), Shen et al. (2015), and Ma et al. (2017). Our results supports the views although it showed the least sensitive to , which aligns with Huang et al. (2021). The finding that has a greater negative effect on in Class 1 compared to the positive effects observed in Class 2 and 3 at the same level (level 4) is inconsistent with the observation that larger trees with deeper roots are less sensitive to depletion in (Dawson, 1996). This inconsistency may arise because trees benefit from more effective roots in the upper moist soil layer (Wei et al., 2017; Ochoa and Abdallah, 2023). Additionally, influenced the promotion of and the demotion of in relation to (Supplementary Figures 3, 5). However, it has no effect on the increase of to , nor do , (Supplementary Figures 1, 4, 6), even during Level 1 of the worst drought. In other words, affected independently, while the others did not. Across different levels (1–5), the total contributions of all four factors to also do not vary with tree size (Table 5). One possible cause could be that the drought was not severe enough, as our study site is located in a humid region of China. In contrast, a decoupling occurs between and environmental factors when exceeds 300 mm. This decoupling may lead to an abnormal transpiration rate, resulting in the formation and accumulation of bubbles in the xylem ducts, which affects water transport and can cause cavitation in the xylem. Consequently, even during high rainfall months, if a tree has previously experienced drought stress, its transpiration rate may remain abnormal, leading to continued water stress. Additionally, some studies indicate that this abnormality is significantly related to the obstruction of stomatal behavior caused by rainfall (Smith and McClean, 1989; Meinzer et al., 1995; Meinzer et al., 1997; Lu et al., 2016). Therefore, it is essential to pay closer attention to the impact of immediate rainfall on transpiration and its relationship with environmental factors. Given the low sensitivity of on in S. superba, we recommend mitigating the transpiration rate imbalance caused by rainfall thresholds by incorporating other shallow-rooted tree species.
Conclusion
This study demonstrates the application of Machine Learning (ML) in assessing tree water use concerning drought sensitivity analysis, revealing the threshold effect of monthly rainfall on the coupling of environmental factors in relation to transpiration. Five SVR models, which accounted for autocorrelation in daily transpiration of S. superba at five drought levels, revealed that daily transpiration is sensitive to all four environmental factors when ≤300 mm, in the following order: > > > . The mean total contributions to were ranked as follows: > > > . Additionally, this sensitivity and total contributions did not vary with tree size. However, when >300 mm, daily transpiration becomes insensitive to all environmental factors.
Data availability statement
The data analyzed in this study is subject to the following licenses/restrictions: The data that support the findings of this study are available on request from the corresponding author. Requests to access these datasets should be directed to Xiaowei Zhao, eHd6ZXZlckAxNjMuY29t.
Author contributions
XZ: Conceptualization, Formal analysis, Funding acquisition, Investigation, Methodology, Writing – original draft, Writing – review & editing. LZ: Data curation, Investigation, Project administration, Resources, Supervision, Writing – review & editing.
Funding
The author(s) declare that financial support was received for the research and/or publication of this article. This study was financially supported by the scientific Research Foundation for Ph.D, Shangluo University (23SKY010).
Conflict of interest
The authors declare that the research was conducted in the absence of any commercial or financial relationships that could be construed as a potential conflict of interest.
Generative AI statement
The authors declare that no Gen AI was used in the creation of this manuscript.
Publisher’s note
All claims expressed in this article are solely those of the authors and do not necessarily represent those of their affiliated organizations, or those of the publisher, the editors and the reviewers. Any product that may be evaluated in this article, or claim that may be made by its manufacturer, is not guaranteed or endorsed by the publisher.
Supplementary material
The Supplementary material for this article can be found online at: https://www.frontiersin.org/articles/10.3389/ffgc.2025.1572414/full#supplementary-material
Footnotes
References
Anderegg, W., Kane, J., and Anderegg, L. (2013). Consequences of widespread tree mortality triggered by drought and temperature stress. Nat. Clim. Chang. 3, 30–36. doi: 10.1038/nclimate1635
Andrade, J. L., Meinzer, F. C., Goldstein, G., Holbrook, N. M., Cavelier, J., Jackson, P., et al. (1998). Regulation of water flux through trunks, branches, and leaves in trees of a lowland tropical forest. Oecologia 115, 463–471. doi: 10.1007/s004420050542
Brunet, J., Inouye, D. W., Rankin, E. E. W., and Giannini, T. C. (2024). Global change aggravates drought, with consequences for plant reproduction. Ann. Bot. 135, 89–104. doi: 10.1093/aob/mcae186
Carvalho, D. R. A., Torre, S., Kraniotis, D., Almeida, D. P. F., Heuvelink, E., and Carvalho, S. M. P. (2015). Elevated air movement enhances stomatal sensitivity to abscisic acid in leaves developed at high relative air humidity. Front. Plant Sci. 6:383. doi: 10.3389/fpls.2015.00383
Chen, S. N., Chen, Z. S. N., Xu, H., Kong, Z., Xu, Z. B., Liu, Q. Q., et al. (2022). Biophysical regulations of transpiration and water use strategy in a mature Chinese pine (Pinus tabulaeformis) forest in a semiarid urban environment. Hydrol. Process. 36:e14485. doi: 10.1002/hyp.14485
Chen, L., Huang, J. G., Dawson, A., Zhai, L., Stadt, K. J., Comeau, P. G., et al. (2018). Contributions of insects and droughts to growth decline of trembling aspen mixed boreal forest of western Canada. Glob. Chang. Biol. 24, 655–667. doi: 10.1111/gcb.13855
Chen, S. N., Wei, W., and Huang, Y. (2024). Biophysical controls on canopy transpiration of Pinus tabulaeformis under different soil moisture conditions in the loess plateau of China. J. Hydrol. 631:130799. doi: 10.1016/j.jhydrol.2024.130799
Chen, X., Zhao, P., Hu, Y., Ouyang, L., Zhu, L., and Ni, G. (2019). Canopy transpiration and its cooling effect of three urban tree species in a sub-tropical city-Guangzhou, China. Urban For. Urban Gree. 43:126368. doi: 10.1016/j.ufug.2019.126368
da Silva, E. C., Albuquerque, M. B., Neto, A. D., and Junior, C. D. (2013). “Drought and its consequences to plants–from individual to ecosystem” in Responses of organisms to water stress. ed. S. Akinci (Rijeka, HR: INTECH d.o.o), 18–37.
Dawson, T. E. (1996). Determining water use by trees and forests from isotopic, energy balance and transpiration analyses: the roles of tree size and hydraulic lift. Tree Physiol. 16, 263–272. doi: 10.1093/treephys/16.1-2.263
Fan, J., Zheng, J., Wu, L., and Zhang, F. (2020). Estimation of daily maize transpiration using support vector machines; extreme gradient boosting; artificial and deep neural networks models. Agr. Water Manage. 245:106547. doi: 10.1016/j.agwat.2020.106547
Fricke, W. (2017). Water transport and energy. Plant Cell Environ. 406, 977–994. doi: 10.1111/pce.12848
Granier, A. (1985). Une nouvelle methode pour la measure du flux de seve brute dans le tronc des arbres. Ann. Forest Sci. 42, 193–200. doi: 10.1051/forest:19850204
Granier, A. (1987). Evaluation of transpiration in a Douglas-fir stand by means of sap flow measurements. Tree Physiol. 3, 309–320. doi: 10.1093/treephys/3.4.309
Han, C., Chen, N., Zhang, C., Liu, Y., Khan, S., Lu, K., et al. (2019). Sap flow and responses to meteorological about the Larix principis-rupprechtii plantation in Gansu Xinlong mountain, northwestern China. For. Ecol. Manag. 451:117519. doi: 10.1016/j.foreco.2019.117519
Holwerda, F., Bruijnzeel, L. A., Scatena, F. N., Vugts, H. F., and Meesters, A. G. C. A. (2012). Wet canopy evaporation from a Puerto Rican lower montane rain forest: the importance of realistically estimated aerodynamic conductance. J. Hydrol. 414-415, 1–15. doi: 10.1016/j.jhydrol.2011.07.033
Huang, K., Wang, Q., and Otieno, D. (2021). Responses of sap flux densities of different plant functional types to environmental variables are similar in both dry and wet seasons in a subtropical mixed Forest. Forests 12:1007. doi: 10.3390/f12081007
Huang, L., Zhang, Z. S., and Li, X. R. (2010). Sap flow of Artemisia ordosica and the influence of environmental factors in a revegetated desert area: Tengger Desert. China. Hydrol. Process 24, 1248–1253. doi: 10.1002/hyp.7584
Huang, J., Zhou, Y., Yin, L., Wenninger, J., Zhang, J., Hou, G., et al. (2015). Climatic controls on sap flow dynamics and used water sources of Salix psammophila in a semi-arid environment innorthwest China. Environ. Earth Sci. 73, 289–301. doi: 10.1007/s12665-014-3505-1
Jarvis, P. G. (1976). The interpretation of the variations in leaf water potential and stomatal conductance found in canopies in the field. Philos Trans. R. Soc. London B. Biol. Sci. 273, 593–610. doi: 10.1098/rstb.1976.0035
Jiao, L., Lu, N., Fang, W. W., Li, Z. S., Wang, J., and Jin, Z. (2019). Determining the independent impact of soil water on forest: a case study of a black locust plantation in the loess plateau, China. J. Hydrol. 572, 671–681. doi: 10.1016/j.jhydrol.2019.03.045
Juhász, Á., Sepsi, P., Nagy, Z., Tőkei, L., and Hrotkó, K. (2013). Water consumption of sweet cherry trees estimated by sap flow measurement. Sci. Hortic.-Amsterdam 164, 41–49. doi: 10.1016/j.scienta.2013.08.022
Juice, S. M., Templer, P. H., Phillips, N. G., Ellison, A. M., and Pelini, S. L. (2016). Ecosystem warming increases sap flow rates of northern red oak trees. Ecosphere 7:e01221. doi: 10.1002/ecs2.1221
Köhler, M., Schwendenmann, L., and Hölscher, D. (2010). Throughfall reduction in a cacao agroforest: tree water use and soil water budgeting. Agric. For. Meteorol. 150, 1079–1089. doi: 10.1016/j.agrformet.2010.04.005
Komatsu, H., Kang, Y., Kume, T., Yoshifuji, N., and Hotta, N. (2006). Transpiration from a Cryptomeria japonica plantation, part 2: responses of canopy conductance to meteorological factors. Hydrological Processes, 20, 1321–1334. doi: 10.1002/hyp.6094
Kono, Y., Ishida, A., Saiki, S. T., Yoshimura, K., Dannoura, M., Yazaki, K., et al. (2019). Initial hydraulic failure followed by late-stage carbon starvation leads to drought-induced death in the tree Trema orientalis. Commun. Biol. 2:8. doi: 10.1038/s42003-018-0256-7
Kume, A. (2017). Importance of the green color, absorption gradient, and spectral absorption of chloroplasts for the radiative energy balance of leaves. J. Plant Res. 130, 501–514. doi: 10.1007/s10265-017-0910-z
Laplace, S., Kume, T., Komatsu, H., and Chu, C.-R. (2013). Wind speed response of sap flow in five subtropical trees based on wind tunnel experiments. BJECC 3, 160–171. doi: 10.9734/BJECC/2013/3842
Li, S., Fang, L., Hegelund, J. N., and Liu, F. (2021). Elevated CO(2) modulates plant hydraulic conductance through regulation of PIPs under progressive soil drying in tomato plants. Front. Plant Sci. 12:666066. doi: 10.3389/fpls.2021.666066
Li, Y., Ye, J., Xu, D., Zhou, G., and Feng, H. (2022). Prediction of sap flow with historical environmental factors based on deep learning technology. Comput. Electron. Agr. 202:107400. doi: 10.1016/j.compag.2022.107400
Liu, X. Z., Kang, S. Z., and Li, F. S. (2009). Simulation of artificial neural network model for trunk sap flow of Pyrus pyrifolia and its comparison with multiple-linear regression. Agr. Water Manage. 96, 939–945. doi: 10.1016/j.agwat.2009.01.003
Liu, X., Zhang, B., Zhuang, J., Han, C., Zhai, L., Zhao, W., et al. (2017). The relationship between sap flow density and environmental factors in the Yangtze River Delta region of China. Forests 8:74. doi: 10.3390/f8030074
Lu, Y., Duursma, R. A., and Medlyn, B. E. (2016). Optimal stomatal behaviour under stochastic rainfall. J. Theor. Biol. 394, 160–171. doi: 10.1016/j.jtbi.2016.01.003
Ma, C., Luo, Y., Shao, M., Li, X., Sun, L., and Jia, X. (2017). Environmental controls on sap flow in black locust forest in loess plateau, China. Sci. Rep. 7:13160. doi: 10.1038/s41598-017-13532-8
Mastropietro, A., Feldmann, C., and Bajorath, J. (2023). Calculation of exact Shapley values for explaining support vector machine models using the radial basis function kernel. Sci. Rep. 13:19561. doi: 10.1038/s41598-023-46930-2
McDowell, N., Pockman, W. T., Allen, C. D., Breshears, D. D., Cobb, N., Kolb, T., et al. (2008). Mechanisms of plant survival and mortality during drought: why do some plants survive while others succumb to drought? New Phytol. 178, 719–739. doi: 10.1111/j.1469-8137.2008.02436.x
Mei, T. T., Wang, C. K., Zhao, P., Cai, X. A., Liu, X. J., Zhu, L. W., et al. (2010a). Dynamics of trunk sap flux density of Schima superba. Scientia Silvae Sinicae 46, 41–47. (in Chinese). doi: 10.11707/j.1001-7488.20100107
Mei, T. T., Zhao, P., Wang, Q., Cai, X. A., Yu, M. H., Zhu, L. W., et al. (2010b). Effects of tree diameter at breast height and soil moisture on transpiration of Schima superba. Chin. J. Appl. Ecol. 21, 2457–2464. (in Chinese). doi: 10.3724/SP.J.1231.2010.06753
Meinzer, F. C. (2003). Functional convergence in plant response to the environment. Oecologia 134, 1–11. doi: 10.1007/s00442-002-1088-0
Meinzer, F. C., Andrade, J. L., Goldstein, G., Holbrook, N. M., Cavelier, J., and Jackson, P. (1997). Control of transpiration from the upper canopy of a tropical forest: the role of stomatal, boundary layer and hydraulic architecture components. Plant Cell Environ. 20, 1242–1252. doi: 10.1046/j.1365-3040.1997.d01-26.x
Meinzer, F. C., Goldstein, G., and Andrade, J. L. (2001). Regulation of water flux through tropical forest canopy trees: do universal rules apply? Tree Physiol. 21, 19–26. doi: 10.1093/treephys/21.1.19
Meinzer, F. C., Goldstein, G., Jackson, P., Holbrook, N. M., Gutiérrez, M. V., and Cavelier, J. (1995). Environmental and physiological regulation of transpiration in tropical forest gap species: the influence of boundary layer and hydraulic properties. Oecologia 101, 514–522. doi: 10.1007/BF00329432
Monteith, J., and Mike, H. (1990). Principles of environmental physics. London: Edward Asner publishers.
Moriasi, D., Arnold, J., Van Liew, M., Bingner, R., Harmel, R., and Veith, T. (2007). Model evaluation guidelines for systematic quantification of accuracy in watershed simulations. Int. J. Agr. Biol. Eng. 50, 885–900. doi: 10.13031/2013.23153
O'Brien, J. J., Oberbauer, S. F., and Clark, D. B. (2004). Whole tree xylem sap flow responses to multiple environmental variables in a wet tropical forest. Plant Cell Environ. 27, 551–567. doi: 10.1111/j.1365-3040.2003.01160.x
Ochoa, C. G., and Abdallah, M. A. B. (2023). The seasonal variability and environmental factors influencing the transpiration of Western Juniper (Juniperus occidentalis) saplings. Hydro. 10:232. doi: 10.3390/hydrology10120232
Oguntunde, P. G., and Oguntuase, A. M. (2007). Influence of environmental factors on the sap flux density of mango trees under rain-fed cropping systems in West Africa. Int. J. Plant Prod. 1, 179–188. doi: 10.22069/ijpp.2012.535
Sabir, M. A., Rasheed, F., Zafar, Z., Khan, I., Nawaz, M. F., Ul Haq, I., et al. (2020). A consistent CO2 assimilation rate and an enhanced root development drives the tolerance mechanism in Ziziphus jujuba under soil water deficit. Arid Land Res. Manag. 34, 392–404. doi: 10.1080/15324982.2020.1748140
Saha, S., Kundu, B., Paul, G. C., and Pradhan, B. (2023). Proposing an ensemble machine learning based drought vulnerability index using M5P, dagging, random sub-space and rotation forest models. Stoch Environ Res Risk Assess 37, 2513–2540. doi: 10.1007/s00477-023-02403-6
Shen, Q., Gao, G., Fu, B., and Lü, Y. (2015). Sap flow and water use sources of shelter-belt trees in an arid inland river basin of Northwest China. Ecohydrology 8, 1446–1458. doi: 10.1002/eco.1593
Smith, W. K., and McClean, T. M. (1989). Adaptive relationship between leaf water repellency, stomatal distribution, and gas exchange. Am. J. Bot. 76, 465–469. doi: 10.1002/j.1537-2197.1989.tb11335.x
Smola, A. J., and Schölkopf, B. (2004). A tutorial on support vector regression. Stat. Comput. 14, 199–222. doi: 10.1023/B:STCO.0000035301.49549.88
Tang, J., Bolstad, P. V., Ewers, B. E., Desai, A. R., Davis, K. J., and Carey, E. V. (2006). Sap flux–upscaled canopy transpiration, stomatal conductance, and water use efficiency in an old growth forest in the Great Lakes region of the United States. J. Geophys. Res. Biogeosci. 111, 1–12. doi: 10.1029/2005JG000083
Thomsen, S., Reisdorff, C., Gröngröft, A., Jensen, K., and Eschenbach, A. (2020). Responsiveness of mature oak trees (Quercus robur L.) to soil water dynamics and meteorological constraints in urban environments. Urban Ecosyst. 23, 173–186. doi: 10.1007/s11252-019-00908-z
Tu, J., Wei, X. H., Huang, B. B., Fan, H. B., Jian, M. F., and Li, W. (2019). Improvement of sap flow estimation by including phenological index and time-lag effect in back-propagation neural network models. Agric. For. Meteorol. 276-277:107608. doi: 10.1016/j.agrformet.2019.06.007
Uexkull, N., Croicu, M., Fjelde, H., and Buhaug, H. (2016). Civil conflict sensitivity to growing-season drought. Proc. Natl. Acad. Sci. USA 113, 12391–12396. doi: 10.1073/pnas.1607542113
Wang, X., Liu, J., Sun, Y., Li, K., and Zhang, C. (2017). Sap flow characteristics of three afforestation species during the wet and dry seasons in a dry-hot valley in Southwest China. J. For. Res. 28, 51–62. doi: 10.1007/s11676-016-0276-4
Wei, X., Li, B., Guo, C., Wang, Y., He, J., Liu, S., et al. (2017). Identification of sap flow driving factors of jujube plantation in semi-arid areas in Northwest China. Int. J. Agric. Biol. Eng. 10, 172–183. doi: 10.3965/j.ijabe.20171002.2140
Whitley, R., Medlyn, B., Zeppel, M., Macinnis-Ng, C., and Eamus, D. (2009). Comparing the penman—Monteith equation and a modified Jarvis—Stewart model with an artificial neural network to estimate stand-scale transpiration and canopy conductance. J. Hydrol. 373, 256–266. doi: 10.1016/j.jhydrol.2009.04.036
Wullschleger, S. D., Meinzer, F. C., and Vertessy, R. A. (1998). A review of whole-plant water use studies in trees. Tree Physiol. 18, 499–512. doi: 10.1093/treephys/18.8-9.499
Xu, S. Q., and Yu, Z. B. (2020). Environmental control on transpiration: a case study of a desert ecosystem in Northwest China. Water 12:1211. doi: 10.3390/w12041211
Xu, S. Q., Yu, Z. B., Ji, X. B., and Sudicky, E. A. (2017). Comparing three models to estimate transpiration of desert shrubs. J. Hydrol. 550, 603–615. doi: 10.1016/j.jhydrol.2017.05.027
Yu, Z. H., Chen, Y. M., and Du, S. (2009). The sapflow dynamics of Platycladus orientalis in the semi-arid loess plateau region. Acta Ecol. Sin. 29, 3970–3976. (in Chinese). doi: 10.3321/j.issn:1000-0933.2009.07.061
Yue, G., Zhao, H., Zhang, T., Zhao, X., Li, N., and Drake, S. (2008). Evaluation of water use of Caragana microphylla with the stem heat-balance method in Horqin Sandy land, Inner Mongolia, China. Agr. Forest Meteorol. 148, 1668–1678. doi: 10.1016/j.agrformet.2008.05.019
Zafar, Z., Rasheed, F., Abdullah, M., Salam, M. M. A., and Mohsin, M. (2019). Effects of water deficit on growth and physiology of young Conocarpus erectus L. and Ficus benjamina L. saplings. Bangladesh J. Bot. 48, 1215–1221. doi: 10.3329/bjb.v48i4.49078
Zhang, Q., Han, L. Y., Lin, J. J., and Cheng, Q. Y. (2018). North–south differences in Chinese agricultural losses due to climate-change-influenced droughts. Theor. Appl. Climatol. 131, 719–732. doi: 10.1007/s00704-016-2000-x
Zhang, H., Loaiciga, H. A., and Sauter, T. A. (2024). Novel fusion-based methodology for drought forecasting. Remote Sens. 16:828. doi: 10.3390/rs16050828
Zhao, X. W., Ouyang, L., Zhao, P., and Zhang, C. F. (2018). Effects of size and microclimate on whole-tree water use and hydraulic regulation in Schima superba trees. PeerJ 6:e5164. doi: 10.7717/peerj.5164
Zheng, C., and Wang, Q. (2015). Seasonal and annual variation in transpiration of a dominant desert species, Haloxylon ammodendron, in Central Asia up-scaled from sap flow measurement. Ecohydrology 8, 948–960. doi: 10.1002/eco.1547
Keywords: transpiration, white noise, SHAP values, support vector regression, time series
Citation: Zhao X and Zhu L (2025) Sensitivity of transpiration to influencing factors at varying drought levels in Schima superba. Front. For. Glob. Change. 8:1572414. doi: 10.3389/ffgc.2025.1572414
Edited by:
Jiquan Chen, Michigan State University, United StatesReviewed by:
Hang Xu, Beijing Forestry University, ChinaLixin Wang, Indiana University Indianapolis, United States
Copyright © 2025 Zhao and Zhu. This is an open-access article distributed under the terms of the Creative Commons Attribution License (CC BY). The use, distribution or reproduction in other forums is permitted, provided the original author(s) and the copyright owner(s) are credited and that the original publication in this journal is cited, in accordance with accepted academic practice. No use, distribution or reproduction is permitted which does not comply with these terms.
*Correspondence: Xiaowei Zhao, eHd6ZXZlckAxNjMuY29t
 Xiaowei Zhao
 Liwei Zhu2