 Naomi D. Willis1
 Amanda J. Lloyd2Long Xie1Martina Stiegler1Kathleen Tailliart2Isabel Garcia-Perez3
 Edward S. Chambers3
 Manfred Beckmann2
 John Draper2John C. Mathers1*
- 1Human Nutrition Research Centre, Population Health Sciences Institute, Newcastle University, Newcastle-upon-Tyne, United Kingdom
- 2Institute of Biological, Environmental and Rural Sciences, Aberystwyth University, Aberystwyth, United Kingdom
- 3Nutrition and Dietetic Research Group, Division of Diabetes, Endocrinology and Metabolism, Department of Medicine, Imperial College London, London, United Kingdom
Poor dietary choices are major risk factors for obesity and non-communicable diseases, which places an increasing burden on healthcare systems worldwide. To monitor the effectiveness of healthy eating guidelines and strategies, there is a need for objective measures of dietary intake in community settings. Metabolites derived from specific foods present in urine samples can provide objective biomarkers of food intake (BFIs). Whilst the majority of biomarker discovery/validation studies have investigated potential biomarkers for single foods only, this study considered the whole diet by using menus that delivered a wide range of foods in meals that emulated conventional UK eating patterns. Fifty-one healthy participants (range 19–77 years; 57% female) followed a uniquely designed, randomized controlled dietary intervention, and provided spot urine samples suitable for discovery of BFIs within a real-world context. Free-living participants prepared and consumed all foods and drinks in their own homes and were asked to follow the protocols for meal consumption and home urine sample collection. This study also assessed the robustness, and impact on data quality, of a minimally invasive urine collection protocol. Overall the study design was well-accepted by participants and concluded successfully without any drop outs. Compliance for urine collection, adherence to menu plans, and observance of recommended meal timings, was shown to be very high. Metabolome analysis using mass spectrometry coupled with data mining demonstrated that the study protocol was well-suited for BFI discovery and validation. Novel, putative biomarkers for an extended range of foods were identified including legumes, curry, strongly-heated products, and artificially sweetened, low calorie beverages. In conclusion, aspects of this study design would help to overcome several current challenges in the development of BFI technology. One specific attribute was the examination of BFI generalizability across related food groups and across different preparations and cooking methods of foods. Furthermore, the collection of urine samples at multiple time points helped to determine which spot sample was optimal for identification and validation of BFIs in free-living individuals. A further valuable design feature centered on the comprehensiveness of the menu design which allowed the testing of biomarker specificity within a biobank of urine samples.
Introduction
The amount and pattern of foods and beverages consumed influence gene expression (1) and are major determinants of multiple health outcomes (2). Despite this centrality in the atiology of health and disease, the estimation of habitual dietary intake remains difficult (3). Conventional tools based on dietary self-report are tedious and time-consuming for both study participants and researchers. Dietary misreporting is common and substantial (4) and is exacerbated in those who are overweight or obese (5). Whilst the development of digital tools to assist with dietary recording may reduce the workload for respondents and researchers (6), use of such tools does not eliminate the subjectivity and biases inherent in approaches based on self-report. To improve measurements of dietary intake, there is a need to develop strategies for the objective identification, validation and deployment of suitable biomarkers (7).
Biomarkers of food intake (BFIs) assessed in body fluids or easily-accessible tissues offer potential alternative, objective routes to estimating dietary exposure (8). Measurement of BFIs (9, 10) could overcome some of the limitations of traditional dietary assessment methodologies by providing additional objective estimates of food exposure (11). Such biomarkers are of two main types: (i) those biomarkers which attempt to estimate a major class of nutrients e.g., urinary nitrogen excretion as an index of dietary protein consumption (12) and (ii) biomarkers which attempt to estimate intake of specific foods or food constituents (13). Most foods contain large numbers of characteristic metabolites many of which are cataloged in comprehensive databases of food composition, e.g., FoodB (developed by the University of Alberta, Canada: www.foodb.ca) and of selected food components, e.g., Phenol Explorer (developed by INRA: www.phenol-explorer.eu). However, when foods are consumed, they undergo metabolic transformation during digestion and absorption by enterocytes and colonocytes, by bacteria within the gut lumen and by Phase 1 and Phase 2 enzymes within the liver. Therefore, although the patterns of metabolites present in blood or urine reflect what has been consumed, the specific metabolites in such body fluids may differ substantially from those ingested (14).
We, and others, have applied metabolomics approaches to blood, saliva and urine in human studies to discover novel BFIs (8, 15–22). We have focused on urine as the body fluid of choice because of the ease of collection and the fact that, in contrast with blood, it provides an integrated estimate of exposure over several hours and because of technical advantages in sample preparation for metabolomics assay (8). This has led to the identification of a substantial number of putative biomarkers of individual foods (23) and to potential biomarkers of the overall healthfulness of the diet (24). Consensus guidelines for the critical assessment of candidate BFIs have been proposed recently (10). Although valuable, these guidelines focused on qualifying the utility of individual BFIs to monitor exposure to specific foods/food groups. Food intervention studies to determine the impact of individual dietary components on health form a large component of nutrition research but equally important is the need for approaches to assess overall dietary exposure in epidemiological studies and clinical trials (24). Whilst these discoveries and developments are encouraging, several challenges remain, associated particularly with the deployment of BFI technology in real world settings (Table 1).
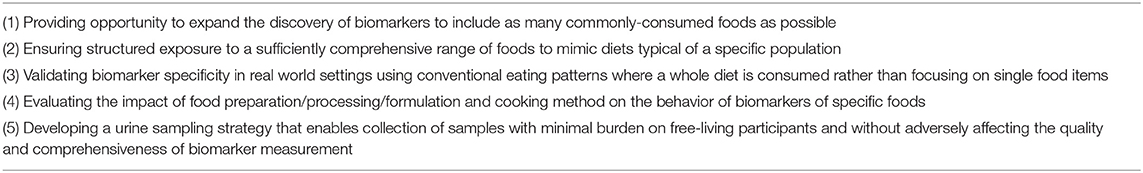
Table 1. Challenges associated with the design of a food intervention study to develop and assess deployment of BFI technology to monitor overall dietary exposure.
The MAIN (Metabolomics at Aberystwyth, Imperial and Newcastle) Study was designed to address these challenges by investigating biomarkers of food intake under conditions in which study participants consumed well-characterized foods within conventional diets with respect to meal design, cooking and eating patterns and collected urine samples at home without changing their usual behavior. This provided an opportunity to expand biomarker coverage to include a more comprehensive range of foods and beverages that are highly consumed in the UK and considered important for the UK government healthy eating policy (25). Our primary aim was to develop protocols which could be applied in large-scale epidemiological studies, clinical trials and in public health surveys. We focused on approaches that would be acceptable to the public, easy to follow and to adhere to, and which would be of modest cost. In this paper, we report the detailed design and protocol of the MAIN Study conducted at Newcastle University (MAIN Study Newcastle) as well as baseline characteristics of participants recruited to the study. Elsewhere we have reported the validation of the urine sampling methodology for free-living study participants showing it was non-intrusive, imposed low participant burden, and delivered samples with high quality metabolome content assessed using metabolite fingerprinting (26, 27). Here, we include a summary of novel biomarkers discovered using samples from the MAIN Study with the aim of extending the BFI coverage to a wider range of commonly consumed foods.
Materials and Methods
Ethics Approval and Consent to Participate
The studies involving human participants were approved by East Midlands—Nottingham 1 National Research Ethics Committee (14/EM/0040) following Proportionate Review. Caldicott approval for storage of data and data protection was granted by Newcastle-upon-Tyne Hospitals NHS Foundation Trust [6896(3109)]. The trial was adopted into the UK Clinical Research Network (CRN) Portfolio (16037) and was registered with International Standard Randomized Controlled Trial Number (ISRCTN), 88921234.
A study information sheet was given to all potential participants in advance of their first visit to the research unit. The participants provided written informed consent to participate in each study, taken by an appropriately trained researcher. All procedures performed in studies involving human participants were in accordance with the ethical standards of the institutional and/or national research committee and with the 1964 Helsinki declaration and its later amendments or comparable ethical standards.
Participant Recruitment
Participants were recruited using the inclusion criteria in Supplementary Table 1 through poster and leaflet campaigns around Newcastle University campus and in local public buildings e.g., libraries. In addition, invitation letters were sent to potential participants who had registered their interest with Newcastle University in being contacted about upcoming nutrition-related studies. An advertisement for the study was also placed in a local newspaper. Some participants were recruited by word of mouth.
Based on data from our earlier studies (28), we aimed for a sample size of 15 participants for Study 1 (which incorporated experimental period 1 menu plans) and 30 participants for Study 2 (which incorporated experimental period 2 menu plans)—this allowed for a 20% drop out. To minimize the risk that current disease or medications used for their management altered metabolism and, therefore, compromised the normal behavior of food-related biomarkers detected in urine, we implemented an a priori exclusion list (Supplementary Table 1). For similar reasons, we excluded potential participants who reported that they had had a cholecystectomy or who undertook a high level of exercise such as a professional athlete or body builder. Vegetarian recruits had to be willing to eat meat and fish during the studies.
Intervention Design and Randomisation
The MAIN Study Newcastle was built around six daily menu plans, delivered in two separate, 3-day experimental periods. Menu plans 1–3 constituted experimental period 1; menu plans 4–6 constituted experimental period 2. Menu plans were designed to emulate real world conditions and to reflect the whole diet by including many commonly-eaten foods in the context of a typical UK diet. All foods and drinks were provided to free-living individuals who prepared and consumed the meals in their own homes/places of work and were responsible for collecting urine samples while carrying out their normal daily activities.
Experimental period 1 menus were based largely on foods for which a significant amount of metabolite-based biomarker research has been published. The menus permitted the provision of 4–5 target foods each day, providing opportunity for biomarker validation as described in Lloyd et al. (27). On the first experimental day, participants consumed test foods for which there were some previously published urinary metabolite biomarkers while, on the two subsequent experimental days, they consumed foods for which putative biomarkers have been proposed but for which further validation and/or discovery is necessary. This first experimental period allowed the refinement of a spot urine sampling protocol for use in real world settings. Participants collected a range of post-prandial spot urines, which were compared for chemical richness and evaluated for the presence of known and putative dietary biomarkers. The overarching aims of this part of the study were to: (i) identify the urine collection times which provided the most data-rich spot urine for accurate capture of biomarker behavior relating to recent dietary intake and (ii) develop acceptable, non-onerous and easy-to-implement urine sampling protocols for the future identification and validation of novel biomarkers of foods included within the menus [see Lloyd et al. (27) and Wilson et al. (29) for further detail].
To assess whether use of a standardized evening meal [as employed in our earlier studies (30)] was advantageous for “normalizing” urines prior to biomarker validation and discovery, participants followed these menus in the same order on 2 separate weeks. Participants were randomized to either a standardized evening meal (chicken casserole ready meal and chocolate éclair) or a low polyphenol evening meal of their choice, to be eaten immediately before the experimental period. Participants were provided with a guide to high polyphenol foods/drinks that they should not eat/avoid and a list of low polyphenol foods/drinks which they should select from during the “Pre” day (see Figure 1). A cross-over design was employed so that all participants underwent both dietary interventions i.e., standardized evening meal and own choice low polyphenol evening meal.
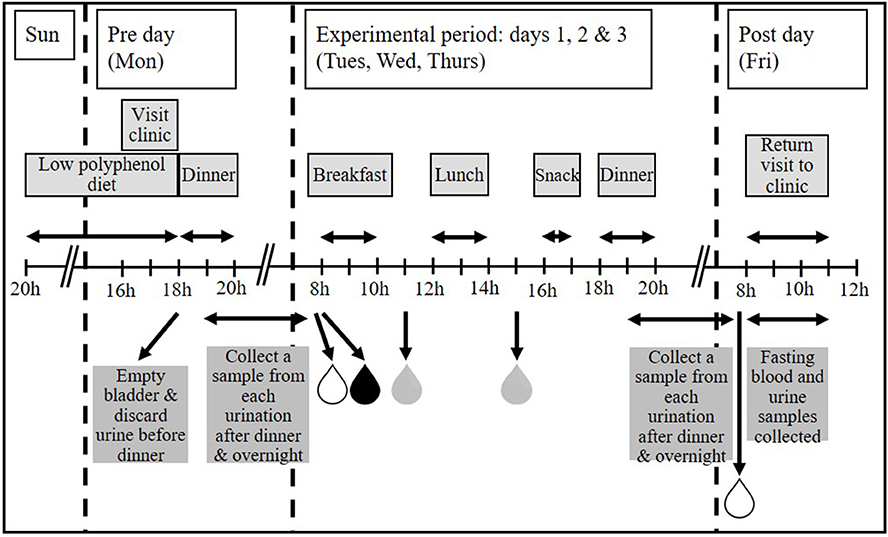
Figure 1. The MAIN Study timeline. Participants were asked to follow a low polyphenol diet prior to starting the experimental period. Where applicable, dinner was provided on the “Pre” day (Monday). All foods and drinks for 3 consecutive experimental days (Tuesday, Wednesday, and Thursday) were provided. Participants collected first morning void (FMV), fasting urines and spot urines post-breakfast and post-lunch each day during the experimental period, and a FMV and fasting urine on the “Post” day. Any urination between finishing dinner and providing the FMV the following day was also collected. A fasting blood sample was taken on the “Post” day only. Figure adapted from Lloyd et al. (27).
Experimental period 2 menu plans were designed to identify novel biomarkers of food intake and to investigate whether the putative urinary biomarkers for specific foods were influenced by food preparation, processing, quality, formulation, complexity, and cooking method. Menus were created to deliver foods for which there were few, uncertain or no published biomarkers. In addition, we expanded the range of food formulations investigated in experimental period 1. For example, red and white grapes were included in the following forms: whole grapes, raisins (dried), wine (fermented), grape juice (pasteurized/heat-treated/concentrated), sparkling grape juice (carbonated drink), and a fruit smoothie (complex beverage). Whole grains were delivered across both experimental periods in the form of rye bread (with and without a sourdough starter, toasted and untoasted), wholemeal bread (toasted and untoasted), wholegrain breakfast cereal (Weetabix®), porridge oats (boiled/microwaved with milk) and wholemeal pasta (extruded). Participants consumed a range of commonly eaten foods in three different daily menu plans, which were presented in a different order in each of three experimental weeks. This design facilitated the search for novel biomarkers of specific foods, but also provided the potential to characterize the kinetics of biomarker appearance and decay and to investigate the longevity of biomarker signals in urine.
Each daily menu plan was designed to emulate conventional UK eating patterns with a breakfast, lunch, afternoon snack and dinner. All foods and drinks for the whole intervention were provided to participants in appropriate portion sizes and with cooking instructions, where necessary. Participants were encouraged to consume these items to the exclusion of any other foods or beverages, but had the freedom to eat or not the meals and to interpret the cooking instructions as they wished. During each experimental week, the allocated menu plans were followed from Tuesday to Thursday, as shown in Figure 1. Experimental period 1 menu plans were eaten in the same order on 2 consecutive weeks (Study 1); experimental period 2 menu plans were eaten in pre-determined orders over a 3-week period (Study 2). In each experimental week, the “Pre” day was the day before starting the experimental period and was always a Monday and included a pre-determined evening meal (Dinner). The “Post” day was the day following completion of the experimental period when the last biological samples were collected and was always a Friday. Participants visited the Clinical Aging Research Unit, Newcastle University on these 2 days only. This design minimized the number of trips the participants had to make to the University and also enabled participants to take a break from the studies at weekends, so reducing the burden of compliance.
During the “Pre” day, participants were asked to restrict, as far as possible, their polyphenol intake. In practical terms, this meant reducing their intake of brightly colored fruits and vegetables, chocolate, tea, herbal teas and coffee. Participants were asked to abstain from alcohol and stop taking any dietary supplements for the duration of the studies. In Study 1, dinner on the “Pre” day was either a standardized evening meal or a low polyphenol meal of the participant's choice whilst in Study 2 it consisted of one of three meals designed to capture biomarkers of relatively unhealthy food choices, particularly poorer-quality meats and breaded and battered foods.
Menu plans were developed using Public Health England policy advice from The Eatwell Plate which has been revised as The Eatwell Guide (25) and information on the eating habits of the British population which were collected and collated in the National Diet and Nutrition Survey (NDNS), years 1–3 (31). The process of menu plan design has been described in detail in a recent publication (27). Briefly, this involved analysis of each food grouping described in the Eatwell Plate (e.g., fruit & vegetables) and investigating the disaggregated food groups that contribute to that food grouping in the NDNS (e.g., fresh & canned fruit; fruit juice; dried fruit etc.). We then identified the most commonly eaten foods within each disaggregated food group and incorporated as many as possible of the most commonly consumed foods into the menu plans using the most commonly reported method of preparation (e.g., raw/boiled/with or without skin). To assess biomarker robustness, multiple forms of similar foods using different processing methods and formulations were delivered as discrete meal components and incorporated within complex meals, and using different cooking methods. Foods and portion sizes were compatible with normal eating behavior and were provided according to conventional UK daily meal patterns using commercially available foods. We used average (medium) portions of each food as determined by the Food Standards Agency “Food Portion Sizes” Guide (32). Exact amounts of each food provided has been described elsewhere (26, 27). An example daily menu plan from experimental period 2 is shown in Supplementary Table 2.
To identify the easiest to collect and most informative spot urine sample, participants were asked to collect several spot urine samples each day. These included their first morning void (FMV) before breakfast; a fasting sample, defined as a sample collected after the FMV but before breakfast, following an overnight fast of at least 12 h; a sample collected any time between finishing breakfast and eating lunch and a sample collected any time between finishing lunch and eating their afternoon snack. Each urination between dinner and the FMV the following day was also collected. To reduce variation in timing of urine sample collection, participants were encouraged to consume meals within a 2 h time slot (breakfast, lunch and dinner) or 30 min time slot (afternoon snack) as illustrated in Figure 1. However, the participants were free to ignore this advice and to provide a urine sample at the time most convenient for them.
Participants were encouraged to keep hydrated and to drink water ad libitum. To help maintain good hydration, participants were given eight 500 ml bottles of water per experimental week, one to be drunk with/after each dinner, one to be drunk during each experimental day and one to be drunk on the morning of the “Post” day, prior to venipuncture.
Participants in Study 1 were randomized (random.org) at enrolment to one of two dinner options on the “Pre” day. In Study 2, participants were randomized to one of 12 3 × 3 Latin squares (3 daily menu plans × 3 experimental weeks) at enrolment. The order in which these participants consumed the three less healthy dinners on the “Pre” day in each of the three experimental weeks was randomized independently.
Compliance
Dietary compliance was assessed by participant self-report. They were asked to record how much of each food/drink item they ate. If some food was uneaten, the participant recorded the amount eaten as 75, 50, 25% or 0, as appropriate. Dietary substitutions, intrusions and protocol deviations were also recorded. Participants recorded if they substituted any foods or drinks of their own choosing for those provided by the research team, ate or drank any additional items or prepared any of the meals differently from that instructed.
A 1-day food diary was used to record all foods and drinks consumed from 8pm on the evening before and throughout the “Pre” day. This was used to check participant compliance with the low polyphenol diet prior to commencement of the experimental period each week.
To monitor compliance with both the urine collection protocol and suggested meal times, participants completed a Urine sample collection record and a Meal time record—the latter asked specifically at what time they finished eating each meal. This acted as a check on the accuracy of the FMV and fasting urine samples collected. In addition, this information allowed calculation of the time interval between meal consumption and subsequent urine collections.
Study Measures
Information on participant socio-demographics (age, sex, smoking status, and alcohol consumption), medical history, current medications, and use of dietary supplements was collected at enrolment.
In Study 1, weight, height and waist circumference were measured on “Pre” and “Post” days of each experimental week. In Study 2, height and waist circumference were recorded in week 1 only, whilst weight was recorded weekly, pre- and post- the experimental period. All anthropometric measurements were made at the research unit by the same researcher.
Body weight was measured to the nearest 0.1 kg using a Tanita body composition analyzer (TBF-300 MA; Tanita Corporation, Tokyo, Japan); height was measured to the nearest 0.1 cm using a Leicester portable height measure (Chasmors Ltd, London, UK). Waist circumference (at the point equidistant between the costal margin and the iliac crest) was measured to the nearest 0.1 cm using a non-stretch tape measure over bare skin, whenever possible. Waist circumference measurements were taken in duplicate, or repeated until two measurements agreed within 1 cm. Participants were asked to wear lightweight clothing and removed their shoes for all measurements.
Habitual dietary intake was assessed at the beginning of each study using a locally adapted version of the validated food frequency questionnaire (FFQ) used in the European Prospective Investigation into Cancer and Nutrition (EPIC) (33).
To monitor their physical activity (PA), each week participants were asked to complete the International Physical Activity Questionnaire (IPAQ) short form (34).
Blood and Urine Sample Collection
Participants collected urine samples at suggested times (Figure 1) in a calibrated plastic jug and recorded the date, time and total volume of collection. A 20 ml aliquot from each urination was retained and the rest discarded. If not at home, participants kept urine samples in a cool bag containing a frozen cool block, otherwise they stored them in a refrigerator before returning them to the research team at the end of each experimental week. It has been reported that no major changes in urinary metabolite fingerprints occur when samples are stored in tubes held at +4°C for up to 72 h (35). We have shown recently that the metabolome of spot urine samples collected, stored and transported as described in this manuscript is stable with negligible microbial growth at 4°C and, specifically, that inclusion of preservatives has no impact on data quality (36). For long-term storage, urine samples were divided into 10 × 1 ml aliquots [2 ml screw-cap microtubes (Starstedt, Germany)] which were free from plasticisers (in house tests; data not shown)] and 1 × 5–10 ml aliquot (25 ml Universal tubes; Starstedt) and stored at −80°C.
Whole blood, serum and plasma were archived at −80°C for future lipidomic analysis and associated metabolite fingerprinting. Venipuncture was performed on the “Post” day of each week after a minimum 12 h overnight fast. After filling, blood tubes were inverted several times, kept flat on ice and processed within 2 h. Before processing, the height of the blood in each tube was recorded to assess filling. Plasma was separated from anti-coagulated blood collected in 1 × EDTA and 2 × lithium/heparin Vacutainer® blood collection tubes (Becton Dickinson, Oxford, UK) by centrifugation at 3,100 × g for 5 min at 4°C in a Jouan CR3i centrifuge (Saint-Herblain, France). Plasma was stored at −80°C in 1 ml aliquots in plasticiser-free microtubes as described above. Serum was separated from coagulated blood collected in 2 × gel Vacutainer® tubes at least 30 min after collection, aliquoted and stored as for plasma. One tube of unprocessed whole blood, collected in an EDTA-coated tube, was also stored at −80°C.
A summary of the time points at which key data, measurements and biological samples were collected is given in Table 2 (Study 2) and Supplementary Table 3 (Study 1).
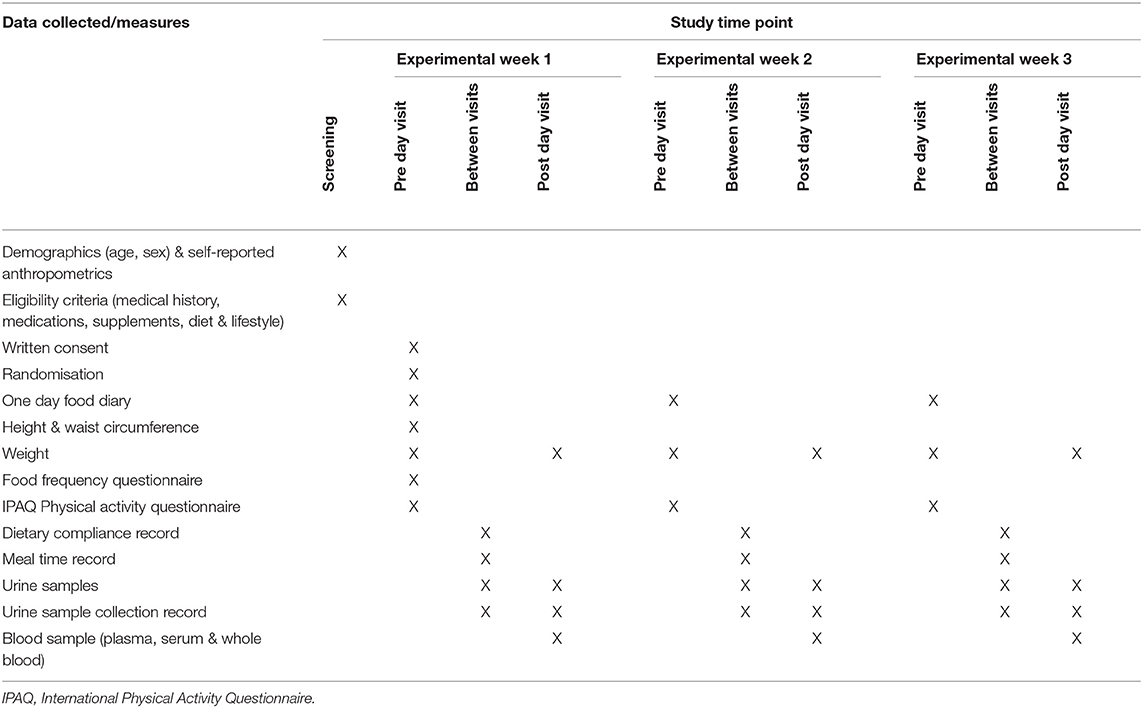
Table 2. Summary of data and biological samples collected during Study 2.
Metabolomic Analysis
The metabolomics methods implemented for biomarker discovery have been published elsewhere (26, 27). All urine samples were normalized by refractive index prior to analysis to ensure all MS measurements were made within a similar dynamic range. Essentially, urine samples were analysed by non-targeted metabolite fingerprinting using high resolution (HR) flow infusion electrospray (FIE) ionization mass spectrometry (MS), acquired on an Exactive Orbitrap (ThermoFinnigan, San Jose, CA) mass spectrometer coupled to an Accela (ThermoFinnigan) ultra-performance liquid chromatography system. Supervised Random Forest (RF) classification was implemented to investigate the presence of distinctive urine composition changes following consumption of specific meals. A combination of accuracy, margins of classification and area under the ROC (Receiver Operator Characteristic) curve (AUC) were used to evaluate the performance of classification models (37). To reveal potential explanatory signals responsible for discriminating between baseline and post-prandial urine samples, a combination of RF, AUC and Student's t-test was employed for feature selection (37).
The methodology used for biomarker identification has been described in detail elsewhere (26, 27). For metabolite signal annotation, accurate m/z values were extracted for high-ranked explanatory signals and queried using MZedDB, an interactive accurate mass annotation tool (38). Ultra High Performance Liquid Chromatography-High Resolution MS (UHPLC-HRMS) and Tandem mass spectrometry (MSn) allowed further structural identification of putative biomarkers as previously described (39). Refractive index adjusted urine samples were diluted with 100% MeOH (1:1, v:v) and centrifuged at 1,400 × g for 5 mins at 4°C. Samples were analysed on an Orbitrap Fusion Tribrid mass spectrometer (Thermo Scientific, Waltham, MA) coupled to a Dionex Ultimate 3000 Ultra High Performance Liquid Chromatography (UHPLC) system (Thermo Scientific). Chromatographic separation was performed on a reverse phase (RP) Hypersil Gold 1.9 μm, 2.1 × 150 mm column (Thermo Scientific) using 0.1% formic acid in H2O (mobile phase A) and 0.1% formic acid in MeOH (mobile phase B) at a flow rate of 0.6 ml/min and column oven temperature at 60°C. Each sample (5 μl) was analysed by following a gradient after 0.5 min isocratic A to 40 % B in 3.5 min and subsequently to 100% in 5 min. The column was washed with 100% B for 2.5 min and re-equilibrated for 2.5 min. Data were acquired in two runs using respective positive and negative ESI mode. Each experiment consisted of a full scan [110–1,100 m/z at 120,000 resolution and MS2 scans (ddMS2 OT HCD event, stepped Higher-energy collision energies of 45, 60, 75%) and 15,000 Orbitrap mass resolution] within a 1 s cycle time using selected targeted mass properties for either positive or negative ionization mode between 1 and 12 min runtime. The maximum injection time was 22 ms and the Automatic Gain Control (AGC) target of 1 × 10⁴ was set to be exceeded if there is parallelisable time. The spray voltage was 3.5 kV for positive and 2.5 kV for negative ionization modes. The temperatures of the ion transfer capillary and vaporiser were, respectively, 342° and 258°C with sheath and auxiliary gas set at 45 and 13 arbitrary units, respectively. The data were acquired using Thermo Scientific Xcalibur version 4.2.28.14.
Metabolites were annotated to Metabolomics Standards Initiative (MSI) level 1 (40) by matching masses, MSn and retention times with authentic standards or with the respective aglycone (if the biotransformation product was unavailable). MSI level 2 structural assignment was achieved by putatively matching signal behavior with that of authentic standards reported in the literature (based upon physicochemical properties, retention times and spectral similarity) or fragmentation pattern alignment with data in public/commercial spectral libraries [Lipid Maps, HMDB, Metlin, and Massbank (41–44)]. MSI level 3 structural identification indicated a putatively characterized compound class.
Results
Recruitment
As shown in Figure 2, 150 people expressed an interest, or were invited to participate, in the studies over a 10 month period: 40 people for entry into Study 1 and 116 people for entry into Study 2 (six people took part in both studies). Personal details, self-reported anthropometrics, medical history and lifestyle information (smoking, alcohol consumption, dietary supplementation) were provided by 70% people (n = 105). More than 70% of those invited to participate in Study 1 had taken part in earlier nutrition research studies at Newcastle University and six were subsequently recruited. A further nine participants learned about the study through word of mouth. The majority (85%) of those who expressed an interest in Study 2 and were screened for eligibility (69%) had learned about it through local community and internal university advertising and contributed 66% of enrolled participants. The remaining participants had either taken part in Study 1 (17%) or heard about the study through word of mouth (17%). The desired sample size (n = 15) was met in Study 1 and the target recruitment (n = 30) was exceeded by 20% in Study 2.
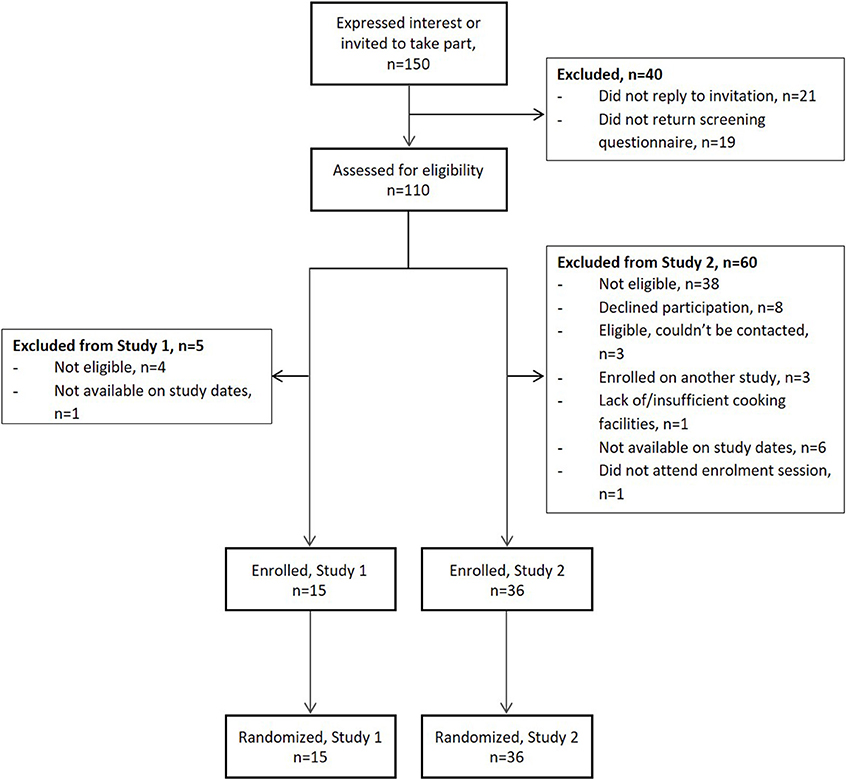
Figure 2. Flow of participants during recruitment to the MAIN Study. Study 1 preceded Study 2; six participants took part in both studies.
Baseline Characteristics of Participants
Participants aged 19–77 years (mean 46 years), of whom 57% were female, took part in the studies (Table 3). The participants were generally healthy: arthritis, previous cancer and hypertension were the most commonly reported medical history. Smokers were excluded from the study and while 78% participants were alcohol consumers, weekly consumption (median 4.5 units) was well below the recommended maximum levels. Mean BMI (24.1) was within the normal range but almost 20% of participants had central obesity. Twenty-five percent of participants reported taking dietary supplements with fish oils/cod liver oil being the most commonly consumed supplement. Self-reported physical activity levels were relatively high−59% of participants were categorized as highly physically active according to the IPAQ guidelines (45). Self-reported sitting time, measured by the IPAQ, was also high with participants reporting, on average, 6 h sitting time/day. This exceeds the 4 h sitting time/day cut-off point considered a proxy for sedentary behavior detrimental to health (46).
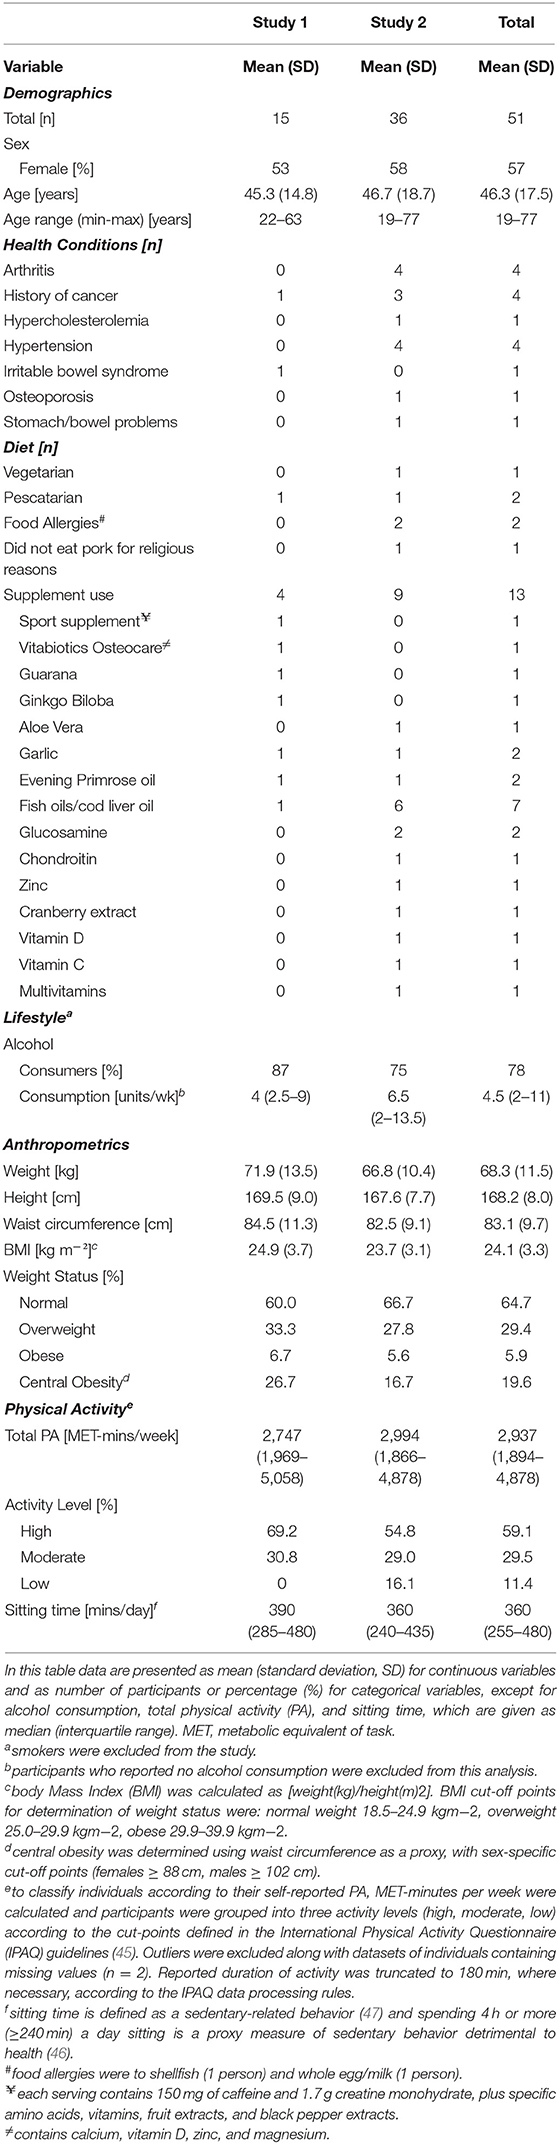
Table 3. Characteristics of the MAIN Study participants at baseline.
Participant characteristics were similar in both studies but those recruited to Study 2 were slightly older (mean 1.4 years) and had a lower BMI. They were less likely to report consuming alcohol, although weekly consumption amongst those who did was higher (based on self-reported weekly alcohol intake). Ten percent more participants were categorized as having central obesity in Study 1 than in Study 2.
Validation of Study Design for Discovery of Novel Biomarkers of Dietary Exposure
In recent publications, we have reported that dietary exposure biomarker discovery was possible within the context of the present comprehensive food intervention mimicking a typical UK diet in free-living individuals with minimal intrusion on normal daily activities (26, 27). Validation of the overall MAIN Study Newcastle design for efficient biomarker discovery was assessed initially by confirming the presence of expected BFIs in urine samples collected during and following experimental day 1 in Study 1 (26). Biomarker performance was further tested using different food formulations and processing methods with several types of meat, wholegrains, fruit and vegetables (26). Additionally it was shown that the urine sampling methodology for free-living study participants was non-intrusive and delivered samples with high quality metabolome content using metabolite fingerprinting (27).
Against this background, we now demonstrate that the MAIN Study Newcastle design, coupled with metabolomic techniques, made possible the discovery of new BFIs for use in monitoring dietary intake in free-living individuals eating conventional diets. As an example, the schematic of the dietary exposure biomarker discovery strategy using BFIs of legumes is shown in Figure 3. Participants were exposed to an evening meal (Figure 3A) containing a typically consumed legume (garden peas). Random Forest modeling of metabolite fingerprints representing urines collected at bed-time following this meal and FMV urine samples acquired earlier in the day showed that the urine samples had very distinctive compositions (Figure 3B). Feature selection identified several metabolite signals that were strongly explanatory of compositional differences between these two urine classes. Further analysis of urine composition after consumption of a range of legumes (beans, soy and peanuts) in other MAIN Study Newcastle menu plans revealed several explanatory metabolites in common, including m/z 204.98143. Detailed structural analysis indicated that this particular compound is pyrogallol sulpate (Figure 3C). The large relative increase in the pyrogallol sulpate signal after consumption of peas in shown in Figure 3D.
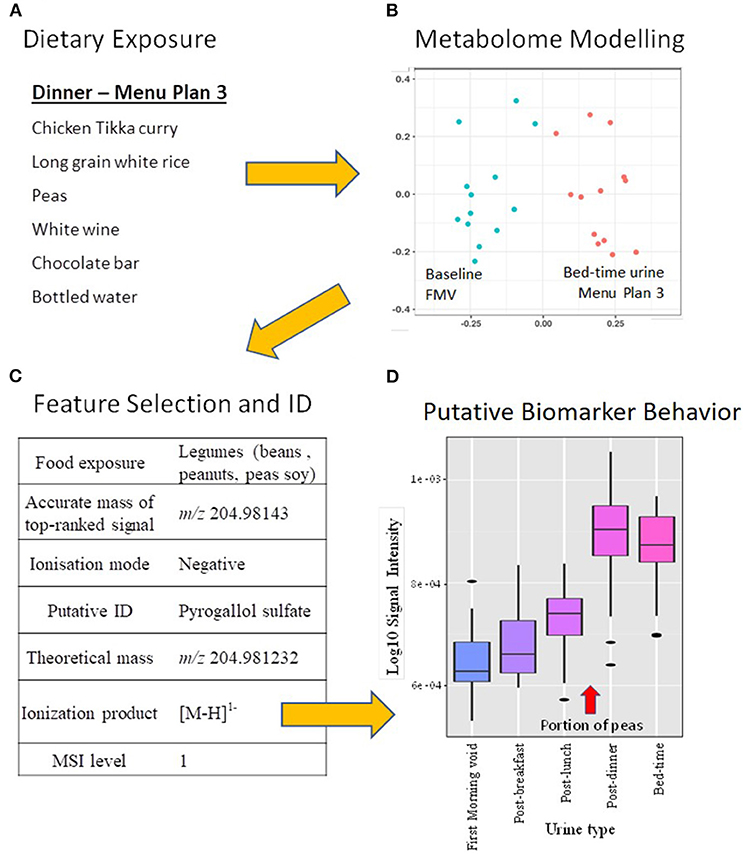
Figure 3. Schematic of the dietary exposure biomarker discovery strategy within the context of a comprehensive food intervention mimicking a typical UK diet in free-living individuals. (A) Meal items consumed at Dinner time on Menu plan 3 [details in Lloyd et al. (27)]; (B) Multi-dimensional scaling (MDS) of Random Forest (RF) proximity values of the FIE-HRMS urinary fingerprint data of first morning void and bed-time urines from the same day that Menu plan 3 was consumed; (C) Annotation of a metabolite signal highly explanatory of legume exposure on several experimental days when legumes were included on the menu; (D) Box-plots showing the association between pea consumption and the relative intensity of the pyrogallol sulfate signal [M-H]1− in urine samples taken throughout the day that Menu plan 3 was eaten.
Following an identical rationale, a selection of potential biomarkers of an extended range of foods is summarized in Table 4. In addition to pyrogallol sulfate, pyrogallol glucuronide and trigonelline emerged as generic biomarkers of legume consumption (beans, peanuts, peas and soy). Eugenol glucuronide and eugenol sulfate were elevated in urine after consumption of curry and are potential biomarkers of this food group. The metabolite, 2-furoylglycine, appeared discriminatory for high temperature baked foods (e.g., pies) and toasted grain products (e.g., toasted bread). We identified furaneol (sulfate and glucuronide) and mesifurane after the consumption of strawberries and tomato products. Higher concentrations of Maillard reaction intermediates 2,4-dihydroxy-2,5-dimethyl-3(2H)-furanone (acetylformoine) in both its sulfate and glucuronide forms and norfuraneol sulfate (4-hydroxy-5-methyl-3(2H)-furanone) were observed in urine following consumption of both high temperature-baked and toasted grain products as well as strawberries, berries and tomato. After the consumption of a low-calorie beverage, urinary concentration of the sweetener acesulfame potassium was elevated for up to 12 h (Table 4).
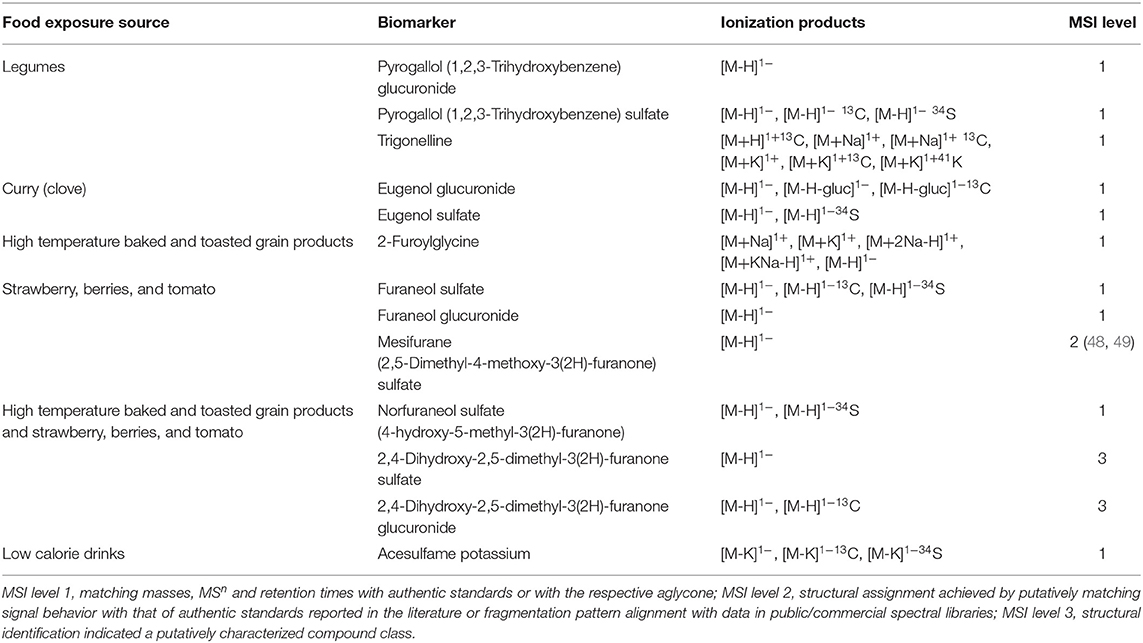
Table 4. Discovery of novel biomarkers for foods where biomarkers have yet to be discovered in relation to UK Public health policies.
Discussion
Success of Free-Living Study Design
Our aim was to design and implement a prolonged dietary intervention study which would allow the collection of urine samples for biomarker studies in a home or work environment. Study recruitment achieved (Study 1) or surpassed (Study 2) original expectations with 51 healthy adults consuming specific foods and beverages, provided in toto by the research team. Apart from a visit to the research unit to pick up food at the beginning, and to deliver urine samples at the end, of each experimental week, participants were free-living and had the freedom to eat or not the meals and to interpret the cooking instructions as they wished. A combination of no drop outs and high compliance rates with regard to meal consumption (> 80%), suggests that this food intervention strategy was highly acceptable to participants [see Lloyd et al. (27) for details on compliance].
Participants collected urine samples within pre-specified time frames each day and fasting blood samples were collected in the morning of the final (“Post”) day of each experimental week. This aspect of the study was designed to be as minimally intrusive as possible to investigate the potential for such urine collections to be incorporated into future larger-scale epidemiological studies and surveys. Data associated with urine collection has been described in a recent publication (27) and indicated that the most successful urine type collected within this cohort was the FMV and the post-dinner spot sample (both at 99% compliance). The fasting sample was the least successfully collected sample. Evidence that the urine sampling methodology imposed low burden on participants and delivered samples with high quality metabolome content has been published (27). From a metabolomics perspective, the overall experimental design was validated by confirming the presence of known BFIs in urine samples after exposure to menu plan 1 (26).
Discovery of Novel Exposure Biomarkers
For BFIs to have utility in assessing dietary intake as a whole, it is essential that the dietary exposure biomarker panel is as comprehensive as possible. To date, the focus on BFI discovery has centered largely on healthy foods of high public health significance (50, 51) rather than more unhealthy foods containing high levels of fat, sugar and salt (52–54). We used our intervention design in a free-living population to aid the discovery of novel biomarkers to help complete coverage of the UK Eatwell Guide (25) whilst aiming to monitor comprehensively both the whole diet and the range of cooking methods used in populations.
UK government policy recommends the consumption of more beans and pulses and less red and processed meat (25). However, there is very limited data on potential urinary biomarkers for non-meat protein-rich foods, such as beans, lentils, and other pulses (55, 56). Here we propose pyrogallol sulfate and glucuronide as potential markers of overall legume consumption (beans, peanuts, peas, soy). Additionally, trigonelline, despite being well-documented as a coffee (57) and pea consumption biomarker (58), and most recently, a novel candidate marker for soy (59), is, in fact, a general legume BFI. However, whilst potential BFIs for legumes, these markers are not exclusive to pulses. Pyrogallol is present in low quantities in beer (60), cocoa and coffee and is excreted as a sulfate after green tea and nut consumption (61, 62). These findings illustrate the need to utilize urine samples from a comprehensive food intervention to investigate specificity to individual foods or food groups. If the dietary source(s) of trigonelline needed to be identified further, then the relative contribution of coffee and soy consumption could be estimated using additional discriminatory biomarkers such as caffeine and daidzein sulfate, respectively (57, 63). These biomarkers could be added to a panel of BFIs to monitor protein-rich food intake, together with anserine and TMAO (Trimethylamine-N-oxide) to indicate poultry and fish intake and carnitine and carnosine to indicate red meat consumption (16, 64).
It still remains challenging to assess the overall “quality” of meat products that are consumed since processed meat products have very variable levels of striated muscle content (19, 65). However, it is possible that BFIs of meal components strongly associated with generally unhealthy diet patterns (66) such as a deep fried-potato (22) or mechanically recovered meat could be highly informative (19, 65). These issues will need to be addressed in the future to provide a comprehensive panel of biomarkers that can characterize and quantify eating habits in toto.
Concentrations of eugenol glucuronide and eugenol sulfate in urine increased after the consumption of curry possibly because clove (a common component of curry) is rich in eugenol (67). Having biomarkers that provide information about the cooking and processing methods used with foods would be an important addition to biomarkers that reflect the raw ingredients of the dish/meal because different cooking methods can change the quality and therefore healthiness of a food. Obtaining this level of information can be difficult using self-reported dietary assessment instruments, especially widely-used food frequency questionnaires. To date, a few such biomarkers of high-temperature cooked meats have been described (68). In the present study, the marker 2-furoylglycine appeared discriminatory for thermally treated foods including pies, grains and toasted wheat products (e.g., toasted bread). This marker has been described as an acute coffee consumption biomarker (69) which results from furan metabolites that arise through roasting of coffee beans via the Maillard reaction. Our metabolomics approach identified several other thermally treated/heated food Maillard products—furanones—including 2,4-dihydroxy-2,5-dimethyl-3-furanone sulfate and glucuronide and norfuraneol sulfate, which have been detected as aglycones in bread crust and popcorn, respectively (70, 71), but not reported previously in urine samples. 2,4-dihydroxy-2,5-dimethyl-3-furanone sulfate and glucuronide have been reported as markers for the intake of deep-fried potatoes, but, due to their presence in other foods, these compounds are not likely to be specific (22). Although furanones are formed by the Maillard reaction during the thermal treatment of food, they can also be biosynthesized by plants, microorganisms, and insects [as reviewed by Slaughter (72)]. Other metabolites structurally identical to Maillard products, including furaneol and its methyl-ether derivative mesifurane, are well-documented natural aroma components in fruits such as pineapple, raspberry, mango, grapefruit, tomato, and strawberry (73) and the glucuronide and sulfate of these compounds have been reported in urine after strawberry consumption (48, 74). In the current study, we confirmed this observation and suggest that furaneol glucuronide and sulfate, and mesifurane sulfate, are generic biomarkers of berry and tomato consumption (Table 4). Assessment of the relative concentrations of some of these chemicals and strawberry/berry/tomato specific compounds {i.e., pelargonidin [strawberry], hydroxyphenylvalerolactone [procyanidin-rich food (75)] and lycopene in plasma for tomato (76)}, could provide rich information on cooking methods and could, potentially, distinguish between berry fruit and tomato consumption.
Foods high in added sugar are not needed in the diet and should only be consumed in very small amounts (25). Urinary sucrose has previously been shown to be a marker of acute sugar exposure (53) and appeared discriminatory of the consumption of high sugar products, such as sweetened breakfast cereals, in the present study (26). Many food manufacturers are now substituting sugars in traditionally sugar-sweetened beverages with low-calorie sweeteners, to help combat risks associated with high sugar intake (77). The urinary concentration of the sweetener acesulfame potassium was elevated after the consumption of a low-calorie beverage and remained so for up to 12 h after consumption (Table 4). This low-calorie sweetener is a known component of the chosen beverage and, in addition to other commonly consumed sweeteners, is a potential biomarker of recent low-calorie beverage intake (78).
Strengths and Limitations of Study Design
The MAIN Study Newcastle is one of the largest food interventions reported to date using metabolomics approaches to discover new, and to help validate existing, biomarkers of foods frequently consumed in the UK. A key objective was to design an efficient and acceptable intervention strategy that would expose study participants to foods encountered commonly in the UK diet. We established a successful food exposure strategy using information on consumption frequencies, food groupings and eating habits from the UK NDNS data (31) together with Public Health England policy advice (25) using standard portion sizes (32). We demonstrated that it is possible to design menus that mimic major features of a typical UK diet and are suitable for short-term randomized controlled dietary interventions “experimental periods” lasting only 3 days. Importantly each experimental period contained menu plans organized to emulate conventional UK eating patterns with a breakfast, lunch, afternoon snack and dinner that differed each day. This intervention strategy may be of value for the design of future studies of BFI discovery and validation in other populations globally. This design differs from many other reported biomarker discovery studies that utilized either single meals/ingredients in isolation (15, 30, 79, 80) or repeated menus (81) or depended on supplementation of the habitual diet (82, 83). Additionally, the overall menu design ensured that participants were exposed to several formulations of individual foods. In other work within the MAIN project, we have demonstrated the value of spot urines for assessing dietary intake (29). The present protocol required all study participants to store 20 ml urine samples in their home fridges for up to 5 days before transporting them to the research unit at the end of each experimental week. We have checked that urine samples collected at home and stored at 4°C are stable and not subject to microbial degradation (36). When outside the home, small cool bags were supplied for temporary urine storage. All urine spot samples were collected with success rates exceeding 90% showing that this approach to urine sampling for biomarker studies is highly acceptable. Additionally, the collection of multiple spot urines allowed us to investigate systematically the utility of home collected spot urine samples taken at various times in the diurnal feeding and fasting cycle for BFI discovery [see Lloyd et al. (27)]. Based on these observations we suggest that the protocols used in the MAIN study have overcome many of the design challenges summarized in Table 1.
From a biomarker discovery perspective, an important finding from Study 1 was that the consumption of a standardized evening meal prior to the experimental period had little impact on the ability to discover BFIs [see Lloyd et al. (26)]. This finding simplified the design of the wider food intervention in Study 2 and reduced the burden on the study participants by requiring only a limit on the consumption of polyphenol-rich foods prior to each experimental period. Furthermore, the characteristics of the MAIN study participants (Table 3) in respect of sex, age, adiposity, physical activity and general health indicate that BFIs discovered in this study are likely to be generalizable to the wider population. Importantly, in the MAIN Study Newcastle, all foods and beverages were prepared and consumed by free-living participants in their own homes rather than in a controlled clinical facility (24). This strategy ensured that metabolomic analyses were undertaken within the context of normal eating behaviors and in real world meal patterns, rather than following consumption of discrete items in isolation. In addition, this study design took into account the inherent variability associated with unsupervised individuals preparing meals and eating them in their own homes and collecting urine samples within flexible time ranges. Importantly, the comprehensiveness of this food intervention provides opportunity to examine the specificity of putative biomarkers in relation to exposure to a wide range of foods within the same biobank of samples.
Although the MAIN study had great value for the discovery of putative BFIs, some sources of variability were not considered. For example, the study employed relatively healthy individuals and we excluded those with current disease or disease treatment which might have altered the metabolism of ingested foods. As a consequence, future studies should explore the robustness of biomarkers of food intake in population groups with poorer health, particularly those who are taking prescribed medications that affect the P450 enzyme consortium or the gut microbiome. Our cohort of participants included one individual with irritable bowel syndrome (IBS)—contrary to the study inclusion criteria—but it seems unlikely that this would have had a major effect on the overall findings. Similarly, our cohort included three participants who were slightly obese (BMI 32.2–33.0 kg/m2) and, again, it is unlikely that this infringement of the exclusion criteria will have affected the findings. It is possible also that participant genotype will alter the pattern of metabolites produced from a given food constituent and so for this reason further work should investigate the impact of common variants in the genes encoding Phase 1 and Phase 2 enzyme systems, an example being the P450 consortium (14), on urinary BFIs. It should be noted that several of the putative BFI reported here are biotransformation products (sulfates and glucuronides) that could be identified to the level of the aglycone only (i.e., pyrogallol, eugenol, furaneol), because chemical standards for the biotransformed products are not available commercially at a reasonable cost.
Future Work
In previous publications, we have shown that when using a combination of non-targeted metabolite profiles and targeted BFIs for assessment of dietary patterns, spot samples are suitable replacements for 24-h urine samples (29). The collection of multiple spot urine samples throughout the day using a home urine sample collection method will enable us to determine which samples (e.g., FMV or bed-time) or combinations thereof, and how many samples, are optimal for assessment of eating behavior using BFIs. It is anticipated that multiple, well-spaced spot samples collected over several weeks would be able to capture biomarker data accurately, reflecting habitual exposure to a wide range of food groups in a similar way to that achieved using multiple 24 h recall methods. The ultimate aim of our studies is to deploy a comprehensive BFI panel to aid in monitoring habitual dietary exposure in clinical trials or population surveys at a range of scales. With this aim in mind, we have developed methodology for urine collection using vacuum transfer technology which is suitable for routine use and may provide a scalable, cost-effective means to collect urine samples and to assess dietary intake in large-scale epidemiological studies and in public health surveys (36).
Data Availability Statement
The raw data supporting the conclusions of this article will be made available by the authors, without undue reservation.
Ethics Statement
The studies involving human participants were reviewed and a favorable ethical opinion was obtained following Proportionate Review by the East Midlands—Nottingham 1 National Research Ethics Committee (14/EM/0040). Caldicott approval for storage of data and data protection was granted by Newcastle-upon-Tyne Hospitals NHS Foundation Trust [6896(3109)]. The trial was adopted into the UK Clinical Research Network (CRN) Portfolio (16037) and was registered with International Standard Randomized Controlled Trials Number (ISRCTN), 88921234. A study information sheet was given to all potential participants in advance of their first visit to the research center. Written informed consent was obtained prior to participation from each eligible individual, for each study, by an appropriately trained researcher. All procedures performed in studies involving human participants were in accordance with the ethical standards of the institutional and/or national research committee and with the 1964 Helsinki declaration and its later amendments or comparable ethical standards. Trial registration: ISRCTN, ISRCTN88921234. Registered 3rd April 2014—retrospectively registered, http://www.isrctn.com/ISRCTN88921234. The patients/participants provided their written informed consent to participate in this study.
Author Contributions
JD, JM, and MB conceived the study. JM, JD, NW, AL, and MB designed the study and menu plans. NW and LX undertook participant recruitment, developed participant handling protocols, ran the intervention study, supervised support staff, collected all biological samples, and refined sampling methodology. IG-P and EC coordinated project input from Imperial College London. NW and MS analysed and interpreted the data with respect to study design, participant recruitment and characteristics and participant and sample handling, and produced the tables and figures. KT and MB analysed the urine samples. AL analysed and interpreted the metabolomics data and produced the tables and figures. NW, AL, JD, and JM wrote the manuscript. JM and JD coordinated the project and supervised the research teams in Newcastle and Aberystwyth Universities, respectively. All authors read and approved the final manuscript.
Funding
This study was funded by the Medical Research Council (MRC), Grant No. MR/J010308/1.
Conflict of Interest
The authors declare that the research was conducted in the absence of any commercial or financial relationships that could be construed as a potential conflict of interest.
Acknowledgments
The authors thank the study participants for their commitment and the Clinical Aging Research Unit, Newcastle University for participant support.
Supplementary Material
The Supplementary Material for this article can be found online at: https://www.frontiersin.org/articles/10.3389/fnut.2020.561010/full#supplementary-material
Abbreviations
AGC, Automatic gain control; AUC, area under the Receiver Operator Characteristic curve; BFI, biomarker of food intake; BMI, Body Mass Index; CRN, Clinical Research Network; EPIC, European Prospective Investigation into Cancer and Nutrition; FFQ, food frequency questionnaire; FIE-HRMS, flow infusion electrospray ionization—high resolution mass spectrometry; FMV, first morning void; HCD, Higher-energy collision dissociation; IPAQ, International Physical Activity Questionnaire; ISRCTN, International Standard Randomized Controlled Trial Number; MAIN, Metabolomics at Aberystwyth, Imperial and Newcastle; MDS, Multi-dimensional scaling; MRC, Medical Research Council; MS, mass spectrometry; MSI, Metabolomics Standards Initiative; MSn, Tandem mass spectrometry; NDNS, National Diet and Nutrition Survey; PA, physical activity; RF, Random Forest; ROC, Receiver Operator Characteristic; SD, Standard deviation; TMAO, Trimethylamine-N-oxide; UHPLC-HRMS, Ultra High Performance Liquid Chromatography-High Resolution MS.
References
1. Kolehmainen M, Ulven SM, Paananen J, de Mello V, Schwab U, Carlberg C, et al. Healthy nordic diet downregulates the expression of genes involved in inflammation in subcutaneous adipose tissue in individuals with features of the metabolic syndrome. Am J Clin Nutr. (2015) 101:228–39. doi: 10.3945/ajcn.114.092783
2. Murray CJ, Richards MA, Newton JN, Fenton KA, Anderson HR, Atkinson C, et al. UK health performance: findings of the global burden of disease study 2010. Lancet. (2013) 381:997–1020. doi: 10.1016/S0140-6736(13)60355-4
3. Penn L, Boeing H, Boushey CJ, Dragsted LO, Kaput J, Scalbert A, et al. Assessment of dietary intake: NuGO symposium report. Genes Nutr. (2010) 5:205–13. doi: 10.1007/s12263-010-0175-9
4. Poslusna K, Ruprich J, de Vries JHM, Jakubikova M, van't Veer. P. Misreporting of energy micronutrient intake estimated by food records 24 hour recalls, control adjustment methods in practice. Br J Nutr. (2009) 101(Suppl. 2):S73–85. doi: 10.1017/S0007114509990602
5. Jessri M, Lou WY, L'Abbé MR. Evaluation of different methods to handle misreporting in obesity research: evidence from the Canadian national nutrition survey. Br J Nutr. (2016) 115:147–59. doi: 10.1017/S0007114515004237
6. Stumbo PJ. New technology in dietary assessment: a review of digital methods in improving food record accuracy. Proc Nutr Soc. (2013) 72:70–6. doi: 10.1017/S0029665112002911
7. Dragsted LO, Gao Q, Praticò G, Manach C, Wishart DS, Scalbert A, et al. Dietary and health biomarkers—time for an update. Genes Nutr. (2017) 12:24. doi: 10.1186/s12263-017-0578-y
8. Beckmann M, Lloyd AJ, Haldar S, Favé G, Seal CJ, Brandt K, et al. Dietary exposure biomarker-lead discovery based on metabolomics analysis of urine samples. Proc Nutr Soc. (2013) 72:352–61. doi: 10.1017/S0029665113001237
9. Gao Q, Praticò G, Scalbert A, Vergères G, Kolehmainen M, Manach C, et al. A scheme for a flexible classification of dietary and health biomarkers. Genes Nutr. (2017) 12:34. doi: 10.1186/s12263-017-0587-x
10. Dragsted LO, Gao Q, Scalbert A, Vergères G, Kolehmainen M, Manach C, et al. Validation of biomarkers of food intake-critical assessment of candidate biomarkers. Genes Nutr. (2018) 13:14. doi: 10.1186/s12263-018-0603-9
11. Brouwer-Brolsma EM, Brennan L, Drevon CA, van Kranen H, Manach C, Dragsted LO, et al. Combining traditional dietary assessment methods with novel metabolomics techniques: present efforts by the food biomarker alliance. Proc Nutr Soc. (2017) 76:619–27. doi: 10.1017/S0029665117003949
12. Bingham SA, Cummings JH. Urine nitrogen as an independent validatory measure of dietary intake: a study of nitrogen balance in individuals consuming their normal diet. Am J Clin Nutr. (1985) 42:1276–89. doi: 10.1093/ajcn/42.6.1276
13. Spencer JP, Abd El Mohsen MM, Minihane AM, Mathers JC. Biomarkers of the intake of dietary polyphenols: strengths, limitations and application in nutrition research. Br J Nutr. (2008) 99:12–22. doi: 10.1017/S0007114507798938
14. Sim SC, Ingelman-Sundberg M. Update on allele nomenclature for human cytochromes P450 and the human cytochrome P450 allele (CYP-allele) nomenclature Database. Methods Mol Biol. (2013) 987:251–9. doi: 10.1007/978-1-62703-321-3_21
15. Lloyd AJ, Beckmann M, Favé G, Mathers JC, Draper J. Proline betaine and its biotransformation products in fasting urine samples are potential biomarkers of habitual citrus fruit consumption. Br J Nutr. (2011) 106:812–24. doi: 10.1017/S0007114511001164
16. Lloyd AJ, Fave G, Beckmann M, Lin W, Tailliart K, Xie L, et al. Use of mass spectrometry fingerprinting to identify urinary metabolites after consumption of specific foods. Am J Clin Nutr. (2011) 94:981–91. doi: 10.3945/ajcn.111.017921
17. Ulaszewska M, Vázquez-Manjarrez N, Garcia-Aloy M, Llorach R, Mattivi F, Dragsted LO, et al. Food intake biomarkers for apple, pear, stone fruit. Genes Nutr. (2018) 13:29. doi: 10.1186/s12263-018-0620-8
18. Cuparencu C, Praticó G, Hemeryck LY, Sri Harsha PSC, Noerman S, Rombouts C, et al. Biomarkers of meat and seafood intake: an extensive literature review. Genes Nutr. (2019) 14:35. doi: 10.1186/s12263-019-0656-4
19. Cuparencu C, Rinnan Å, Dragsted LO. Combined markers to assess meat intake—human metabolomic studies of discovery and validation. Mol Nutr Food Res. (2019) 63:1900106. doi: 10.1002/mnfr.201900106
20. Landberg R, Hanhineva K, Tuohy K, Garcia-Aloy M, Biskup I, Llorach R, et al. Biomarkers of cereal food intake. Genes Nutr. (2019) 14:28. doi: 10.1186/s12263-019-0651-9
21. Brouwer-Brolsma EM, Brandl B, Buso MEC, Skurk T, Manach C. Food intake biomarkers for green leafy vegetables, bulb vegetables, and stem vegetables: a review. Genes Nutr. (2020) 15:7. doi: 10.1186/s12263-020-00667-z
22. Zhou X, Ulaszewska MM, Cuparencu C, de Gobba C, Vázquez-Manjarrez N, Gürdeniz G, et al. Urine metabolome profiling reveals imprints of food heating processes after dietary intervention with differently cooked potatoes. J Agric Food Chem. (2020) 68:6122–31. doi: 10.1021/acs.jafc.0c01136
23. Scalbert A, Brennan L, Manach C, Andres-Lacueva C, Dragsted LO, Draper J, et al. The food metabolome: a window over dietary exposure. Am J Clin Nutr. (2014) 99:1286–308. doi: 10.3945/ajcn.113.076133
24. Garcia-Perez I, Posma JM, Gibson R, Chambers ES, Hansen TH, Vestergaard H, et al. Objective assessment of dietary patterns by use of metabolic phenotyping: a randomized, controlled, crossover trial. Lancet Diabetes Endocrinol. (2017) 5:184–95. doi: 10.1016/S2213-8587(16)30419-3
25. Public Health England. The Eatwell Guide. (2016). Retrieved from: https://www.gov.uk/government/publications/the-eatwell-guide (accessed February 28, 2017).
26. Lloyd AJ, Willis ND, Wilson T, Zubair H, Chambers E, Garcia-Perez I, et al. Addressing the pitfalls when designing intervention studies to discover and validate biomarkers of habitual dietary intake. Metabolomics. (2019) 15:72. doi: 10.1007/s11306-019-1532-3
27. Lloyd AJ, Willis ND, Wilson T, Zubair H, Xie L, Chambers E, et al. Developing a food exposure and urine sampling strategy for dietary exposure biomarker validation in free-living individuals. Mol Nutr Food Res. (2019) 63:1900062. doi: 10.1002/mnfr.201900062
28. Lloyd AJ, Beckmann M, Haldar S, Seal C, Brandt K, Draper J. Data-driven strategy for the discovery of potential urinary biomarkers of habitual dietary exposure. Am J Clin Nutr. (2013) 97:377–89. doi: 10.3945/ajcn.112.048033
29. Wilson T, Garcia-Perez I, Posma JM, Lloyd AJ, Chambers ES, Tailliart K, et al. Spot and cumulative urine samples are suitable replacements for 24-h urine collections for objective measures of dietary exposure in adults using metabolite biomarkers. J Nutr. (2019) 149:1692–700. doi: 10.1093/jn/nxz138
30. Favé G, Beckmann M, Lloyd AJ, Zhou S, Harold G, Lin W, et al. Development and validation of a standardized protocol to monitor human dietary exposure by metabolite fingerprinting of urine samples. Metabolomics. (2011) 7:469–84. doi: 10.1007/s11306-011-0289-0
31. Department of Health. National Diet and Nutrition Survey: Headline Results from Years 1, 2 and 3 (combined) of the Rolling Programme 2008/09 – 2010/11 (2012).
33. Bingham SA, Gill C, Welch A, Cassidy A, Runswick SA, Oakes S, et al. Validation of dietary assessment methods in the UK arm of EPIC using weighed records, 24-hour urinary nitrogen potassium serum vitamin C carotenoids as biomarkers. Int J Epidemiol. (1997) 26(Suppl. 1):S137–51. doi: 10.1093/ije/26.suppl_1.S137
34. Craig CL, Marshall AL, Sjostrom M, Bauman AE, Booth BE, Ainsworth BE, et al. International physical activity questionnaire: 12-country reliability and validity. Med Sci Sports Exerc. (2003) 35:1381–95. doi: 10.1249/01.MSS.0000078924.61453.FB
35. Roux A, Thévenot EA, Seguin F, Olivier MF, Junot C. Impact of collection conditions on the metabolite content of human urine samples as analyzed by liquid chromatography coupled to mass spectrometry and nuclear magnetic resonance spectroscopy. Metabolomics. (2015) 11:1095–105. doi: 10.1007/s11306-014-0764-5
36. Lloyd AJ, Wilson T, Willis ND, Lyons L, Phillips H, Janssen HG, et al. Developing community-based urine sampling methods to deploy biomarker technology for assessment of dietary exposure. Public Health Nutr. (2020) 1–12. doi: 10.1017/S136898002000097X
37. Enot DP, Lin W, Beckmann M, Parker D, Overy DP, Draper J. Preprocessing, classification modeling and feature selection using flow injection electrospray mass spectrometry metabolite fingerprint data. Nat Protoc. (2008) 3:446–70. doi: 10.1038/nprot.2007.511
38. Draper J, Enot DP, Parker D, Beckmann M, Snowdon S, Lin W, et al. Metabolite signal identification in accurate mass metabolomics data with MZedDB, an interactive m/z annotation tool utilising predicted ionization behavior 'rules'. BMC Bioinformatics. (2009) 10:227. doi: 10.1186/1471-2105-10-227
39. Lloyd AJ, Beckmann M, Wilson T, Tailliart K, Allaway D, Draper J. Ultra high performance liquid chromatography–high resolution mass spectrometry plasma lipidomics can distinguish between canine breeds despite uncontrolled environmental variability and non-standardized diets. Metabolomics. (2017) 13:15. doi: 10.1007/s11306-016-1152-0
40. Sumner LW, Amberg A, Barrett D, Beale MH, Beger R, Daykin CA, et al. Proposed minimum reporting standards for chemical analysis chemical analysis working group (CAWG) metabolomics standards initiative (MSI). Metabolomics. (2007) 3:211–21. doi: 10.1007/s11306-007-0082-2
41. Sud M, Fahy E, Cotter D, Brown A, Dennis EA, Glass CK, et al. LMSD: LIPID MAPS structure database. Nucleic Acids Res. (2007) 35:D527–32. doi: 10.1093/nar/gkl838
42. Sana TR, Roark JC, Li X, Waddell K, Fischer SM. Molecular formula and METLIN personal metabolite database matching applied to the identification of compounds generated by LC/TOF-MS. J Biomol Tech. (2008) 19:258–66.
43. Wishart DS, Knox C, Guo AC, Eisner R, Young N, Gautam B, et al. HMDB: a knowledgebase for the human metabolome. Nucleic Acids Res. (2009) 37:D603–10. doi: 10.1093/nar/gkn810
44. Horai H, Arita M, Kanaya S, Nihei Y, Ikeda T, Suwa K, et al. MassBank: a public repository for sharing mass spectral data for life sciences. J Mass Spectrom. (2010) 45:703–14. doi: 10.1002/jms.1777
45. IPAQ Group. Guidelines for Data Processing and Analysis of the International Physical Activity Questionnaire (IPAQ) - Short and Long Forms. (2005) Available online at: http://www.ipaq.ki.se/ (accessed February 28, 2017).
46. Hallal PC, Andersen LB, Bull FC, Guthold R, Haskell W, Ekelund U, et al. Global physical activity levels: surveillance progress, pitfalls, and prospects. Lancet. (2012) 380:247–57. doi: 10.1016/S0140-6736(12)60646-1
47. Pate RR, O'Neill JR, Lobelo F. The evolving definition of “sedentary”. Exerc Sport Sci Rev. (2008) 36:173–8. doi: 10.1097/JES.0b013e3181877d1a
48. Cuparencu CS, Andersen MBS, Gürdeniz G, Schou SS, Mortensen MW, Raben A, et al. Identification of urinary biomarkers after consumption of sea buckthorn and strawberry, by untargeted LC–MS metabolomics: a meal study in adult men. Metabolomics. (2016) 12:31. doi: 10.1007/s11306-015-0934-0
49. Andersen MB, Rinnan Å, Manach C, Poulsen SK, Pujos-Guillot E, Larsen TM, et al. Untargeted metabolomics as a screening tool for estimating compliance to a dietary pattern. J Proteome Res. (2014) 13:1405–18. doi: 10.1021/pr400964s
50. Rechner AR, Kuhnle G, Bremner P, Hubbard GP, Moore KP, Rice-Evans CA. The metabolic fate of dietary polyphenols in humans. Free Radic Biol Med. (2002) 33:220–35. doi: 10.1016/S0891-5849(02)00877-8
51. Krupp D, Doberstein N, Shi L, Remer T. Hippuric acid in 24-hour urine collections is a potential biomarker for fruit and vegetable consumption in healthy children and adolescents. J Nutr. (2012) 142:1314–20. doi: 10.3945/jn.112.159319
52. Llorach R, Urpi-Sarda M, Jauregui O, Monagas M, Andres-Lacueva C. An LC-MS-based metabolomics approach for exploring urinary metabolome modifications after cocoa consumption. J Proteome Res. (2009) 8:5060–8. doi: 10.1021/pr900470a
53. Beckmann M, Joosen AM, Clarke MM, Mugridge O, Frost G, Engel B, et al. Changes in the human plasma and urinary metabolome associated with acute dietary exposure to sucrose and the identification of potential biomarkers of sucrose intake. Mol Nutr Food Res. (2016) 60:444–57. doi: 10.1002/mnfr.201500495
54. Arab L. Biomarkers of fat and fatty acid intake. J Nutr. (2003) 133:925S−32S. doi: 10.1093/jn/133.3.925S
55. Sri Harsha PSC, Wahab RA, Garcia-Aloy M, Madrid-Gambin F, Estruel-Amades S, Watzl B., et al. Biomarkers of legume intake in human intervention and observational studies: a systematic review. Genes Nutr. (2018) 13:25. doi: 10.1186/s12263-018-0616-4
56. Garcia-Aloy M, Ulaszewska M, Franceschi P, Estruel-Amades S, Weinert CH, Tor-Roca A, et al. Discovery of intake biomarkers of lentils, chickpeas, and white beans by untargeted LC–MS metabolomics in serum and urine. Mol Nutr Food Res. (2020) 64:1901137. doi: 10.1002/mnfr.201901137
57. Rothwell JA, Fillâtre Y, Martin JF, Lyan B, Pujos-Guillot E, Fezeu L, et al. New biomarkers of coffee consumption identified by the non-targeted metabolomic profiling of cohort study subjects. PLoS ONE. (2014) 9:e93474. doi: 10.1371/journal.pone.0093474
58. Posma JM, Garcia-Perez I, Heaton JC, Burdisso P, Mathers JC, Draper J, et al. Integrated analytical and statistical two-dimensional spectroscopy strategy for metabolite identification: application to dietary biomarkers. Anal Chem. (2017) 89:3300–9. doi: 10.1021/acs.analchem.6b03324
59. Münger LH, Trimigno A, Picone G, Freiburghaus C, Pimentel G, Burton KJ, et al. Identification of urinary food intake biomarkers for milk, cheese, and soy-based drink by untargeted GC-MS and NMR in healthy humans. J Proteome Res. (2017) 16:3321–35. doi: 10.1021/acs.jproteome.7b00319
60. Lang R, Mueller C, Hofmann T. Development of a stable isotope dilution analysis with liquid chromatography–tandem mass spectrometry detection for the quantitative analysis of di- and trihydroxybenzenes in foods and model systems. J Agric Food Chem. (2006) 54:5755–62. doi: 10.1021/jf061118n
61. Tulipani S, Llorach R, Jáuregui O, López-Uriarte P, Garcia-Aloy M, Bullo M, et al. Metabolomics unveils urinary changes in subjects with metabolic syndrome following 12-week nut consumption. J Proteome Res. (2011) 10:5047–58. doi: 10.1021/pr200514h
62. van der Hooft JJ, de Vos RC, Mihaleva V, Bino RJ, Ridder L, de Roo N, et al. Structural elucidation and quantification of phenolic conjugates present in human urine after tea intake. Anal Chem. (2012) 84:7263–71. doi: 10.1021/ac3017339
63. Shelnutt SR, Cimino CO, Wiggins PA, Badger TM. Urinary pharmacokinetics of the glucuronide and sulfate conjugates of genistein and daidzein. Cancer Epidemiol Biomarkers Prev. (2000) 9:413–9.
64. Dragsted LO. Biomarkers of meat intake and the application of nutrigenomics. Meat Sci. (2010) 84:301–7. doi: 10.1016/j.meatsci.2009.08.028
65. Wedekind R, Keski-Rahkonen P, Robinot N, Viallon V, Ferrari P, Engel E, et al. Syringol metabolites as new biomarkers for smoked meat intake. Am J Clin Nutr. (2019) 110:1424–33. doi: 10.1093/ajcn/nqz222
66. O'Sullivan A, Gibney MJ, Brennan L. Dietary intake patterns are reflected in metabolomic profiles: potential role in dietary assessment studies. Am J Clin Nutr. (2011) 93:314–21. doi: 10.3945/ajcn.110.000950
67. Shan B, Cai YZ, Sun M, Corke H. Antioxidant capacity of 26 spice extracts and characterization of their phenolic constituents. J Agric Food Chem. (2005) 53:7749–59. doi: 10.1021/jf051513y
68. Gibis M. Heterocyclic aromatic amines in cooked meat products: causes, formation, occurrence, risk assessment. Compr Rev Food Sci Food Saf. (2016) 15:269–302. doi: 10.1111/1541-4337.12186
69. Heinzmann SS, Holmes E, Kochhar S, Nicholson JK. Schmitt-Kopplin P. 2-furoylglycine as a candidate biomarker of coffee consumption. J Agric Food Chem. (2015) 63:8615–21. doi: 10.1021/acs.jafc.5b03040
70. Schieberle P. Formation of furaneol in heat-processed foods. Flavor Precurs Am Chem Soc. (1992) 490:164–74. doi: 10.1021/bk-1992-0490.ch012
71. Buttery RG, Ling LC, Stern DJ. Studies on popcorn aroma and flavor volatiles. J Agric Food Chem. (1997) 45:837–43. doi: 10.1021/jf9604807
72. Slaughter JC. The naturally occurring furanones: formation and function from pheromone to food. Biol Rev. (1999) 74:259–76. doi: 10.1017/S0006323199005332
73. Sanz C, Olias JM, Perez AG. Aroma biochemistry of fruits vegetables. In: Tomás-Barberán FA, Robins RJ. editors. Phytochemistry of Fruit Vegetables. Oxford: Clarendon Press (1997). p. 125–55.
74. Roscher R, Koch H, Herderich M, Schreier P, Schwab W. Identification of 2,5-dimethyl-4-hydroxy-3[2H]-furanone β-d-glucuronide as the major metabolite of a strawberry flavour constituent in humans. Food Chem Toxicol. (1997) 35:777–82. doi: 10.1016/S0278-6915(97)00055-0
75. Appeldoorn MM, Vincken JP, Aura AM, Hollman PC, Gruppen H. Procyanidin dimers are metabolized by human microbiota with 2-(3,4-Dihydroxyphenyl)acetic acid and 5-(3,4-Dihydroxyphenyl)-γ-valerolactone as the major metabolites. J Agric Food Chem. (2009) 57:1084–92. doi: 10.1021/jf803059z
76. Hadley CW, Clinton SK, Schwartz SJ. The consumption of processed tomato products enhances plasma lycopene concentrations in association with a reduced lipoprotein sensitivity to oxidative damage. J Nutr. (2003) 133:727–32. doi: 10.1093/jn/133.3.727
78. Logue C, Dowey LRC, Strain JJ, Verhagen H, McClean S, Gallagher AM. Application of liquid chromatography–tandem mass spectrometry to determine urinary concentrations of five commonly used low-calorie sweeteners: a novel biomarker approach for assessing recent intakes? J Agric Food Chem. (2017) 65:4516–25. doi: 10.1021/acs.jafc.7b00404
79. Andersen MBS, Reinbach HC, Rinnan Å, Barri T, Mithril C, Dragsted LO. Discovery of exposure markers in urine for brassica-containing meals served with different protein sources by UPLC-qTOF-MS untargeted metabolomics. Metabolomics. (2013) 9:984–97. doi: 10.1007/s11306-013-0522-0
80. Gibbons H, McNulty BA, Nugent AP, Walton J, Flynn A, Gibney MJ, et al. A metabolomics approach to the identification of biomarkers of sugar-sweetened beverage intake. Am J Clin Nutr. (2015) 101:471–7. doi: 10.3945/ajcn.114.095604
81. Garcia-Perez I, Posma JM, Chambers ES, Nicholson JK, C Mathers J, Beckmann M, et al. An analytical pipeline for quantitative characterization of dietary intake: application to assess grape intake. J Agric Food Chem. (2016) 64:2423–31. doi: 10.1021/acs.jafc.5b05878
82. Martínez-González MÁ, Corella D, Salas-Salvadó JP, Ros E, Covas MI, Fiol MS, et al. Cohort profile: design and methods of the PREDIMED study. Int J Epidemiol. (2012) 41:377–85. doi: 10.1093/ije/dyq250
83. Huey L, Bitok E, Kazzi N, Sirirat R, Tabrizi SH, Ros E, et al. Dietary compliance of walnut or no walnut intake in a 1-year randomized intervention trial among free-living elderly in the Walnuts and healthy aging study (WAHA). FASEB J. (2016) 30(Suppl. 1):1157.10–1157.10. doi: 10.1096/fasebj.30.1_supplement.1157.10
Keywords: dietary intake, metabolomics, free-living participants, biomarkers, radomized control trial
Citation: Willis ND, Lloyd AJ, Xie L, Stiegler M, Tailliart K, Garcia-Perez I, Chambers ES, Beckmann M, Draper J and Mathers JC (2020) Design and Characterisation of a Randomized Food Intervention That Mimics Exposure to a Typical UK Diet to Provide Urine Samples for Identification and Validation of Metabolite Biomarkers of Food Intake. Front. Nutr. 7:561010. doi: 10.3389/fnut.2020.561010
Received: 11 May 2020; Accepted: 07 September 2020;
Published: 21 October 2020.
Edited by:
Weimin Ye, Karolinska Institutet (KI), SwedenReviewed by:
Thea Magrone, University of Bari Aldo Moro, ItalyTiziano Verri, University of Salento, Italy
Copyright © 2020 Willis, Lloyd, Xie, Stiegler, Tailliart, Garcia-Perez, Chambers, Beckmann, Draper and Mathers. This is an open-access article distributed under the terms of the Creative Commons Attribution License (CC BY). The use, distribution or reproduction in other forums is permitted, provided the original author(s) and the copyright owner(s) are credited and that the original publication in this journal is cited, in accordance with accepted academic practice. No use, distribution or reproduction is permitted which does not comply with these terms.
*Correspondence: John C. Mathers, am9obi5tYXRoZXJzQG5ld2Nhc3RsZS5hYy51aw==