Abstract
Introduction: Preclinical studies suggest that brassica vegetable diets decrease cancer risk, but epidemiological studies show varied effects, resulting in uncertainty about any health impact of brassicas. Factors controlling absorption of glucosinolate metabolites may relate to inconsistent results. We reported previously that subjects with BMI > 26 kg/m2 (HiBMI), given cooked broccoli plus raw daikon radish (as a source of plant myrosinase) daily for 17 days, had lower glucosinolate metabolite absorption than subjects given a single broccoli meal. This difference was not seen in subjects with BMI < 26 kg/m2 (LoBMI). Our objective in this current study was to determine whether a similar response occurred when cooked broccoli was consumed without a source of plant myrosinase.
Methods: In a randomized crossover study (n = 18), subjects consumed no broccoli for 16 days or the same diet with 200 g of cooked broccoli daily for 15 days and 100 g of broccoli on day 16. On day 17, all subjects consumed 200 g of cooked broccoli. Plasma and urine were collected for 24 h and analyzed for glucosinolate metabolites by LC-MS.
Results: There was no effect of diet alone or interaction of diet with BMI. However, absorption doubled in HiBMI subjects (AUC 219%, plasma mass of metabolites 202% compared to values for LoBMI subjects) and time to peak plasma metabolite values and 24-h urinary metabolites also increased, to 127 and 177% of LoBMI values, respectively.
Conclusion: BMI impacts absorption and metabolism of glucosinolates from cooked broccoli, and this association must be further elucidated for more efficacious dietary recommendations.
Clinical Trial Registration: This trial was registered at clinicaltrials.gov (NCT03013465).
Introduction
Multiple epidemiological studies have linked consumption of brassica vegetables with reduced risk for cancers including bladder, breast, colorectal, prostate, lung, and stomach cancers (1–6). Yet other such studies have found no effect of brassica intake on cancer risk (7–10). Preclinical studies have been more consistent in finding that components of brassica vegetables have anti-cancer activity (11–15). This activity has been linked to secondary metabolites called glucosinolates. Hydrolysis of glucosinolates to bioactive isothiocyanates (ITCs), indoles, and other products is supported by myrosinase, which is endogenous to brassica plants, and by microbiota in mammalian digestive tracts.
There are numerous mechanisms by which ITCs have been shown to modulate cancer risk including inhibition of cell proliferation, induction of apoptosis, cell cycle arrest, and inhibition of histone deacetylases (16). In addition, Phase II detoxification enzymes, including the glutathione S-transferases (GSTs) and uridine diphosphate glucuronosyl transferases are upregulated by the action of ITCs on the nuclear factor (erythroid-derived 2)-like 2 (Nrf2) pathway. Phase II metabolism acts to conjugate xenobiotic and metabolic intermediates with sulfates, glucuronides, glutathione, or amino acids to facilitate the excretion of the conjugated molecules in urine or bile. The influence of ITCs on these biochemical pathways supports the anti-cancer health benefits of brassica vegetables and the importance of understanding how to harness these health benefits with efficacious dietary approaches.
The inconsistency of epidemiological evidence supporting the efficacy of consumption of brassica vegetables in reducing cancer risk may lie partly in the variability of absorption and metabolism of glucosinolates between and within the populations studied. Several factors may impact the absorption and metabolism of ITCs in humans. For example, there is considerable variability in glucosinolate content and myrosinase activity of brassica vegetables due to growing conditions and cultivar differences (17, 18), thereby impacting the dose of ITCs provided by the consumption of these vegetables. The ways in which brassica vegetables are prepared and cooked also affect the availability of ITCs for absorption, as the heat of cooking denatures endogenous plant myrosinase and thereby decreases ITC production from glucosinolates (19, 20). The metabolism of absorbed ITCs may be influenced by interindividual differences in glutathione S-transferase μ1 (GSTM1) and glutathione S-transferase θ1 (GSTT1) such that null versions of these genes would result in a prolonged presence of ITCs in circulation after intake of brassica vegetables (21, 22). Gut microbiota that express myrosinase-like hydrolyzing activity also may play a role in differential absorption and metabolism of ITCs by interindividual differences in the hydrolysis of glucosinolates, as evidenced by higher ex vivo glucoraphanin degradation by feces of high urinary ITC excreters compared to low excreters (23). Furthermore, the composition of the gut microbiota itself can be modified by the consumption of brassica vegetables (24), suggesting the possibility that frequent consumption of a diet that regularly includes brassicas may impact gut metabolism and subsequent absorption of ITCs.
We previously reported that BMI influenced the plasma ITC and metabolite response and urinary excretion after daily consumption of cooked broccoli served with raw daikon radish (25). Further, we found that repeated intake of broccoli lowered plasma metabolite and urinary excretion levels relative to levels following a single broccoli meal, but only in individuals with BMI > 26 kg/m2 (HiBMI). In that study, the conversion of broccoli glucosinolates to ITCs would have been catalyzed by both endogenous radish myrosinase and gut microbial myrosinase-like activity; myrosinase in commercially frozen broccoli is denatured by blanching (20). It is not known whether the observed interaction of BMI with daily feeding is facilitated by a process that depends on conversion of glucosinolates to ITCs by plant myrosinase, which was provided by the radish in that study, or if the interaction effect occurs even without the presence of plant myrosinase. Therefore, our objective was to conduct a clinical trial to investigate how daily consumption of cooked broccoli without supplementary plant myrosinase affects glucosinolate metabolism and absorption, and metabolism of resulting ITCs, including whether BMI influences plasma and/or urine metabolite response. We focused on metabolites arising from glucoraphanin, the predominant glucosinolate in broccoli, and its reduced analog, glucoerucin.
Materials and Methods
Subjects
Healthy adults were recruited from the Washington, DC area to participate in this study at the Beltsville Human Nutrition Research Center (BHNRC) in Beltsville, MD, USA. Subjects were recruited from January 2017 to March 2017. Potential subjects were screened for general health by routine blood and urine screening and health history questionnaire. Applicants were excluded if they met any of the following criteria: (1) pregnant, lactating, or intending to become pregnant during the study period; (2) known allergy or intolerance to Brassica vegetables; (3) colonoscopy during 3 weeks prior to start of study; (4) use of probiotics during 3 weeks prior to start of study; (5) history of bariatric surgery or nutrient malabsorption disease (such as celiac disease) or other metabolic disorders requiring special diet recommendations; (6) use of tobacco products; (7) Crohn's disease or diverticulitis; (8) suspected or known strictures, fistulas or physiological/mechanical gastrointestinal obstruction; (9) type 2 diabetes requiring the use of diabetes pills, insulin, or non-insulin shots; (10) use of blood-thinning medications such as warfarin or anisindione; (12) self-report of alcohol or substance abuse within the past 12 months and/or current acute treatment or rehabilitation program for these problems. Potential subjects were genotyped for GSTM1 and GSTT1 since GST genotype can affect ITC clearance. Genotype analyses were conducted at the Bionomics Research and Technology Center of the Environmental and Occupational Health Sciences Research Institute (Piscataway, NJ) using a previously described method (26). The recruitment and enrollment data are presented in Figure 1. One subject was excluded from data analyses due to taking antibiotics during the study. Characteristics of subjects who completed the study are reported in Table 1. All subjects were GSTT1-present. Histograms of the distributions of subjects by age and BMI are presented in Supplementary Figures 1, 2 (Supporting Information), respectively. This study was conducted according to the guidelines laid down in the Declaration of Helsinki, and all procedures involving human subjects were approved by Chesapeake IRB (Columbia, MD, USA). Written informed consent was obtained from all subjects. This trial was registered at clinicaltrials.gov (NCT03013465).
Figure 1
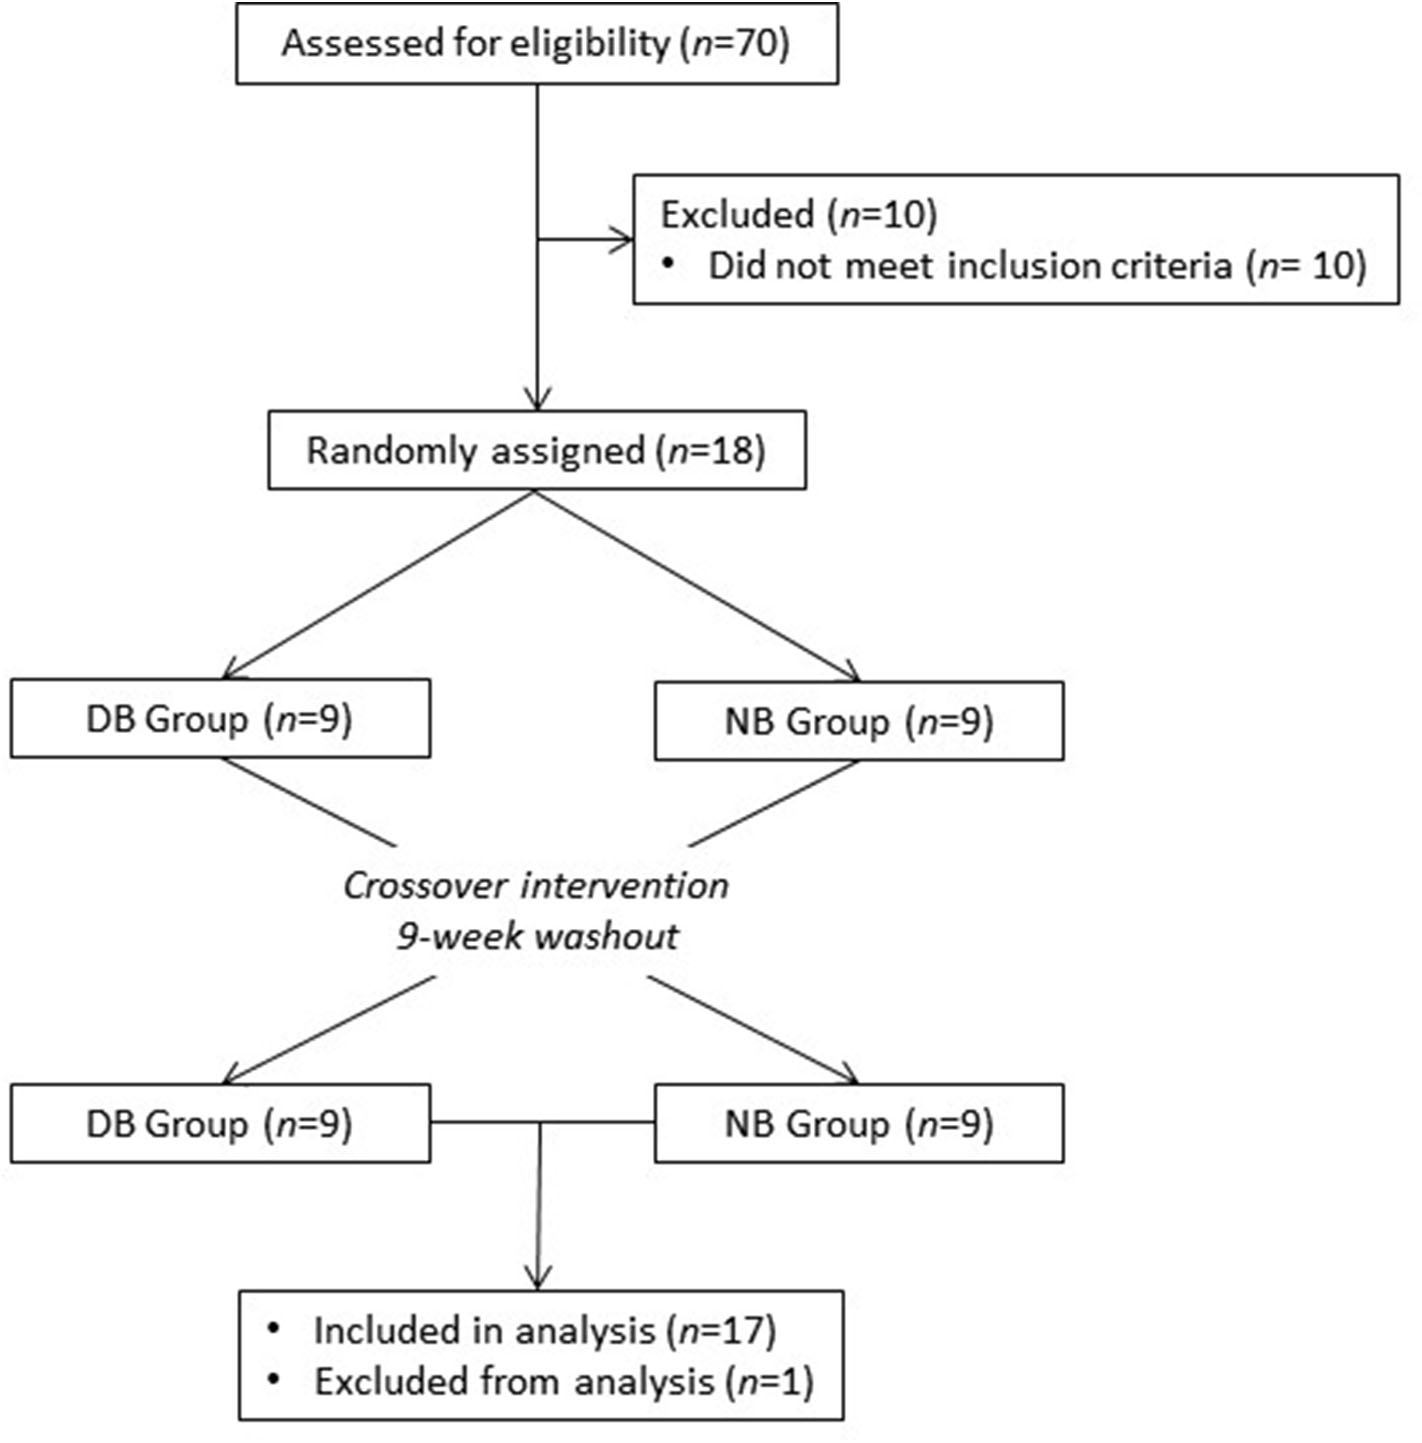
Recruitment and enrollment of subjects. One subject was excluded from analysis due to taking antibiotics during the study.
Table 1
| Group | n | Age (years) | BMI (kg/m2) | GSTM1 (present/null) |
|---|---|---|---|---|
| LoBMI (BMI < 26 kg/m 2 ) | 8 | 55.3 ± 11.1 | 23.3 ± 2.7 | 3,5 |
| Female | 5 | 53.2 ± 13.0 | 23.2 ± 3.2 | 2,3 |
| Male | 3 | 58.7 ± 8.1 | 23.4 ± 2.1 | 1,2 |
| HiBMI (BMI > 26 kg/m 2 ) | 9 | 53.4 ± 7.7 | 30.1 ± 2.6 | 5,4 |
| Female | 3 | 57.7 ± 3.1 | 29.9 ± 0.7 | 1,2 |
| Male | 6 | 51.3 ± 8.7 | 30.2 ± 3.3 | 4,2 |
| Combined | 17 | 54.3 ± 9.2 | 26.9 ± 4.3 | 8,9 |
GSTM1, glutathione S-transferase μ 1.
One subject was excluded due to taking antibiotics during the study and is not included in this table.
Mean ± SD.
All subjects were GSTT1-present.
Broccoli
Commercially blanched and frozen broccoli used in the study was procured in a single shipment prior to the start of the study. Upon arrival, broccoli was thoroughly mixed, measured into 100-g portions, and stored at −80°C until used. Glucosinolates were measured according to a previously published method (27). Two hundred grams of broccoli provided 147.6 μmol of glucoraphanin and 3.6 μmol of glucoerucin (Table 2). Fiber content was determined by the method of Prosky et al. (28).
Table 2
| Base diet | Broccoli (200 g) | |
|---|---|---|
| (2,000 kcal, 8,368 kJ) | ||
| Protein (g) | 78.3 | 5.8 |
| Carbohydrate (g) | 263.8 | 10.1 |
| Fat (g) | 70.2 | 0.2 |
| Fiber (g) | 18.5 | 5.4 |
| Glucoraphanin (μmol) | 0 | 147.6 |
| Glucoerucin (μmol) | 0 | 3.6 |
Mean daily macronutrients, fiber, glucoraphanin, and glucoerucin provided by base diet (based on 2,000 kcal) and broccolia.
The objective of this study was to evaluate the metabolism of glucoraphanin and its reduced analog, glucoerucin. Other glucosinolates present in the broccoli (200 g) were as follows: glucobrassicin, 64.7μmol;1-methoxyglucobrassicin, 25.6 μmol; 4-hydroxyglucobrassicin, 16.2 μmol; 4-methoxyglucobrassicin, 9.1 μmol.
Experimental Design and Treatments
This study was a randomized, crossover design consisting of two 18-day periods separated by a 9-week washout. Power was calculated using data from our previous study (25) for the treatment × BMI interaction at hour 2, the point of maximal plasma mass of metabolites. Treatment differences of plasma mass of metabolites were calculated by comparing values at BMI = 20 kg/m2 to the treatment differences at BMI = 35 kg/m2. Based on these calculations, 16 subjects were determined to provide a statistically significant difference (α = 0.05) with power (1-β) = 95%. We enrolled 18 subjects to allow for the possibility of two drop-outs during the study, which is consistent with previous studies. Subjects consumed either a basal diet with no brassica vegetables (NB) or a daily broccoli diet (DB) for 16 days. The NB diet consisted of typical American foods providing 15.7% energy from protein, 31.6% from fat, and 52.7% from carbohydrates (Table 2). Foods were scaled in 836 kJ (200 kcal) increments to meet individual energy requirements and to maintain subject weights. One hundred grams of broccoli were consumed at breakfast and 100 g were consumed at dinner. The DB diet consisted of the basal diet plus 200 g of broccoli daily. One hundred grams portions of broccoli consumed at BHNRC were thawed at 4°C and heated in a 1,200-W microwave oven (NE-1258R; Panasonic) for 30 s, stirred, and then heated an additional 30 s, resulting in a stem core temperature of 77 ± 9°C (n = 5, data not shown). For broccoli consumed at home on weekends, subjects were instructed to heat 100-g portions for 30 s, stir, and repeat the cycle until the broccoli was hot but not browned or burned. On day 16 (the day preceding the pharmacokinetic challenge), subjects on the DB diet consumed 100 g of broccoli at breakfast and none at dinner. This was to minimize any carryover of metabolites to day 17, when the pharmacokinetic test was conducted. On day 17, all subjects consumed 200 g of broccoli, a 100-g roll, and 10 g of margarine for breakfast. The broccoli was heated for 60 s, stirred, and then heated an additional 60 s, resulting in a stem core temperature of 79 ± 5°C (n = 3, data not shown). Each subject received each dietary treatment and was randomly allocated to one of two groups using stratified randomization to balance BMI, GSTM1 genotype, sex, and age. The allocation sequence was concealed from the principal investigator (C.S.C.) and was assigned dietary treatment order by the study coordinator. Laboratory analysts were blinded to the treatment allocation whereas subjects could not be blinded to whether they consumed daily broccoli.
Subjects were instructed to eat all foods and only foods provided by the BHNRC excepting coffee, tea, and diet soda. Breakfast and dinner were consumed at BHNRC on weekdays, and lunches and weekend meals were packed out in coolers. Coffee and tea intake were limited to 2 cups/d and diet soda was not limited. Subjects were provided a list of common brassica foods and asked to abstain from these foods and vitamin and mineral supplements beginning 3 weeks before the study and ending upon the final day of the study. No adverse effects were observed. All subjects completed the study but the data from one subject were not included in the analysis because the subject took antibiotics during the study.
Sample Collection and Analysis
During the pharmacokinetic test initiated on day 17, blood and urine were collected for 24 h. Blood was collected immediately before the broccoli test meal, hourly from hours 1 to 14, and at hour 24. Blood was collected into EDTA-coated vacutainers and centrifuged at 2,000 g for 10 min. 1.5-ml aliquots of plasma were transferred to cryovials, snap-frozen in liquid N2, and stored at −80°C until analysis. Urine was collected beginning before the broccoli test meal and during the periods 0–2, 2–4, 4–6, 6–8, 8–10, 10–12, 12–14, and 14–24 h after the test meal. From 14 to 24 h, subjects collected all urine into a 3 L collection container containing 2 g of ascorbic acid, which was dispensed in 1.5 mL aliquots into cryovials with no additional acidification, and stored at −80°C. Urine collected from 0 to 14 h was aliquoted in volumes of 1.5 ml to cryovials containing 0.25 mL of 0.7% ascorbic acid and stored at −80°C.
Analysis of Sulforaphane and Conjugates of Sulforaphane and Erucin in Plasma and Urine
The analysis of sulforaphane (SF) and conjugates of SF and erucin (ER) in plasma and urine were performed as previously described (25). Briefly, 0.5-mL aliquots of plasma were combined with 50 μL of 100-μM N-acetyl (N-butylthiocarbamoyl)-L-cysteine as an internal standard and 50 μL of trifluoracetic acid. Following centrifugation at 16,000 g for 10 min and 4°C, the supernatant was filtered with a 0.2-μm nylon spin filter at 10,000 g for 5 min at 4°C in preparation for analysis by LC-MS. 0.5-mL aliquots of thawed urine were combined with 25 μL of N-acetyl (N-butylthiocarbamoyl)-L-cysteine, centrifuged at 10,000 g for 5 min and 4°C, combined with 4.5 mL of 10-mM ammonium acetate buffer (pH 4.0), and vortex-mixed for analysis.
Analysis of plasma and urine samples was done as described previously (25) using ultra high pressure liquid chromatography (Agilent Zorbax SB-Aq column; 2.1 × 100 mm, 1.8 μm) and an Agilent 6490 triple quadrupole mass spectrometer. Selected reaction monitoring was used for the following collision induced dissociation (CID) transitions: SF (m/z 178–114), SF-glutathione (SF-GSH, m/z 485–136), SF-cysteineglycine (SF-CG, m/z 356–136), SF-cysteine (SF-C, m/z 299–136), SF-N-acetylcysteine (SF-NAC, m/z 341–178), ER-glutathione (ER-GSH, m/z 469–179), ER-cysteineglycine (ER-CG, m/z 340–179), ER-cysteine (ER-C, m/z 283–103), ER-N-acetylcysteine (ER-NAC, m/z 325–164), and N-acetyl (N-butylthiocarbamoyl)-L-cysteine (m/z 279–122). External standard curves were produced using standards synthesized and purified by previously reported methods (29, 30), and used to quantify metabolites in plasma and urine.
Statistics
Previously developed statistical procedures were applied to the data in this study (25). Levels of metabolites were adjusted for estimated plasma volumes (31, 32) and are reported as plasma mass of metabolites (μmol). Urinary excretion rates (μmol/h) of metabolites were calculated as the ratio of metabolite concentration to the duration of urine collection. Plasma AUC was calculated using the linear trapezoidal method. The maximum plasma mass of metabolites (Mmax) and time to reach this maximum (Tmax) were determined by visual inspection of each time point curve. The elimination rate constant (k) was estimated from non-linear exponential decay curves fit to the elimination phase of plasma mass-time curves. ANOVA was performed using the GLIMMIX procedure in SAS (ver. 9.4; SAS Institute). For the 24-h urinary accumulation of the metabolites ERC, SF-C, ER-NAC, SF-NAC, and SF (expressed as proportions relative to the 24-h sum of metabolites) and for k, whose observed values were continuously distributed across a fixed-interval [i.e., (a, b) for any a < b] range, ANOVA models used a Beta distribution with a logit function to link inferences to the original scale of the observed data values. For AUC values of individual metabolites, ANOVA models used a negative binomial distribution with log link and offset loge(AUC) to obtain estimates as a proportion of the AUC of the sum of metabolites. For all other variables, observed values were continuously distributed like time values across a positive range (0, ∞). ANOVA models used a Gamma distribution with a log function to link inferences to the original scale of the observed data values. Plots of models' residuals were examined to verify goodness of fit. Models that analyzed plasma and urinary metabolites responses with time included the following effects in the model: subject, period, sequence, hour, diet, BMI, GSTM1 genotype, sex, diet × hour, diet × BMI, and diet × BMI × hour. All other models excluded the hour terms. Subject was modeled as a random effect and other effects were modeled as fixed effects. To graph the responses by BMI, the data were separated into two groups: one of BMI < 26.2 kg/m2 (LoBMI, n = 8) and the other of BMI > 26.2 kg/m2 (HiBMI, n = 9). After one subject was excluded from analysis due to taking antibiotics, it was not possible to divide by median the remaining 17 subjects into two groups with equal numbers of subjects. Therefore, we chose to use the median from the previous study (26.2 kg/m2, subsequently referred to as BMI of 26 kg/m2) rather than the median of this current study (26.4 kg/m2). All significance tests were conducted on the model's logit or log scale and reported on the original scale as least squares means with 95% CI.
Results
Glucoraphanin comprised 98% of the sum of glucoraphanin and glucoerucin provided by broccoli (Table 2). SF, SF-GSH, SF-CG, SF-C, SF-NAC, ER-GSH, ER-CG, ER-C, and ER-NAC were measured in plasma, and SF, SF-C, SF-NAC, ER-C, and ER-NAC were measured in urine. The proportional appearance of these metabolites in plasma and urine are presented as percentages of total plasma AUC (over 24 h) and total urinary accumulation (24 h), respectively (Figure 2, NB diet); absolute totals are given in Table 3. Results from the DB diet were similar and are presented in Supplementary Figure 3 (Supporting Information). SF and SF metabolites comprised 41 and 45% of total metabolites in plasma for the NB and DB diets, respectively, and comprised 53 and 56% of total metabolites in 24-h urine for the NB and DB diets, respectively. Specifically, the predominant metabolite in plasma was ER-CG (50% of total), followed by SF-CG (14%), SF (13%), ER-C (7%), SF-GSH (6%), SF-NAC (5%), SF-C, and ER-NAC (each 2%), and ER-GSH (<1%). In urine, the predominant metabolites were ER-NAC (39% of total) and SF-NAC (38%), followed by SF-C (11%), ER-C (7%), and SF (4%).
Figure 2
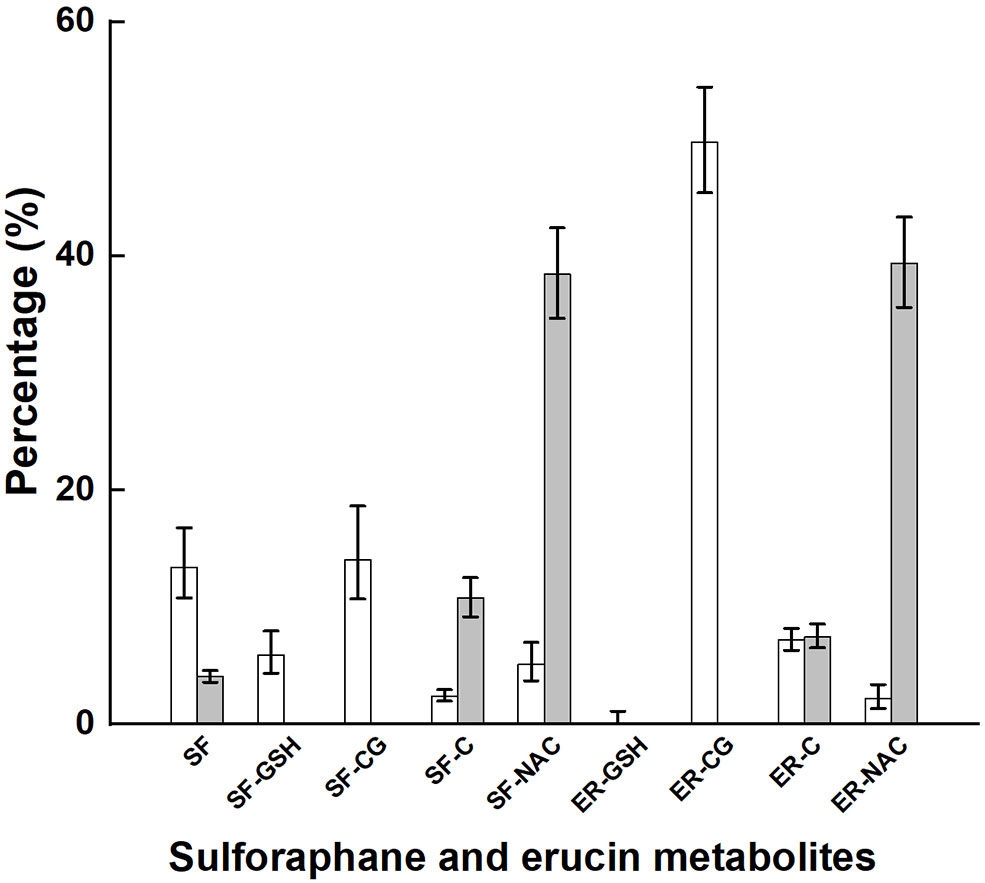
Plasma AUC and urinary accumulation over 24 h of metabolites of glucoraphanin and glucoerucin expressed as the percentage of total AUC and total urinary accumulation, respectively, of subjects who had consumed the control diet. Values are least squares means and 95% confidence intervals. SF, sulforaphane; SF-GSH, sulforaphane-glutathione; SF-CG, sulforaphane-cysteineglycine, SF-C, sulforaphane-cysteine; SF-NAC, sulforaphane-N-acetylcysteine; ER-GSH, erucin-glutathione; ER-CG, erucin-cysteineglycine; ER, erucin-cysteine; ER-NAC, erucin-N-acetylcysteine. □, percentage plasma AUC; ■, percentage urinary accumulation.
Table 3
| Plasma total metabolites | Urinary total | |||||||||
|---|---|---|---|---|---|---|---|---|---|---|
| AUC (μmol·h) | M max (μmol) | T max (h) | k (h −1 ) | Metabolites in 24 h (μmol) | ||||||
| Mean | 95% CI | Mean | 95% CI | Mean | 95% CI | Mean | 95% CI | Mean | 95% CI | |
| Overall means | ||||||||||
| NB diet | 4.7 | 3.5, 6.2 | 0.74 | 0.54, 1.00 | 5.3 | 4.7, 6.0 | 0.26# | 0.22, 0.30 | 16.3 | 12.4, 21.5 |
| DB diet | 4.5 | 3.4, 5.7 | 0.69 | 0.50, 0.94 | 5.7 | 5.1, 6.4 | 0.21 | 0.18, 0.25 | 18.1 | 13.7, 23.7 |
| LoBMI | ||||||||||
| Overall | 3.1** | 2.1, 4.4 | 0.50* | 0.33, 0.76 | 4.9* | 4.2, 5.7 | 0.23 | 0.19, 0.29 | 12.9 | 8.8, 18.7 |
| NB diet | 3.4 | 2.2, 5.0 | 0.56 | 0.36, 0.89 | 4.5 | 3.7, 5.4 | 0.27 | 0.21, 0.33 | 13.2 | 8.6, 19.8 |
| DB diet | 2.8 | 1.9, 4.2 | 0.44 | 0.28, 0.70 | 5.3 | 4.4, 6.3 | 0.21 | 0.16, 0.26 | 12.6 | 8.2, 19.0 |
| HiBMI | ||||||||||
| Overall | 6.8 | 4.8, 9.8 | 1.01 | 0.67, 1.52 | 6.2 | 5.4, 7.2 | 0.24 | 0.19, 0.28 | 22.8 | 16.0, 32.4 |
| NB diet | 6.5 | 4.4, 9.8 | 0.96 | 0.62, 1.49 | 6.3 | 5.3, 7.5 | 0.25 | 0.20, 0.31 | 20.2 | 13.7, 29.7 |
| DB diet | 7.1 | 4.8, 10.5 | 1.07 | 0.69, 1.65 | 6.1 | 5.2, 7.3 | 0.22 | 0.18, 0.28 | 25.7 | 17.5, 37.6 |
| Significance ( p ) a | ||||||||||
| Diet | 0.644 | 0.551 | 0.311 | 0.039 | 0.360 | |||||
| BMI | 0.006 | 0.025 | 0.028 | 0.965 | 0.036 | |||||
| Diet x BMI | 0.213 | 0.144 | 0.149 | 0.387 | 0.195 | |||||
Pharmacokinetic data following consumption of a meal of 200 g of broccoli preceded by 16 days of a control diet with no broccoli or the same control diet with daily consumption of 200 g of broccoli.
Least squares means and 95% confidence intervals; LoBMI (BMI < 26 kg/m2, n = 8) and HiBMI (BMI > 26 kg/m2, n = 9).
NB, control diet; DB, control diet with daily consumption of 200 g of broccoli; AUC, area under curve; Mmax, maximal plasma mass of metabolites; Tmax, time of maximal plasma mass of metabolites; k, elimination rate constant; Urinary total metabolites, total accumulation of urinary metabolites over 24 h.
Unadjusted p-values associated with F-tests from (n = 17) crossover ANOVA model effects: diet, BMI, and diet x BMI; error term df=15.
Mean value of this pharmacokinetic parameter was significantly different for LoBMI compared to HiBMI, regardless of diet (p < 0.05), determined by ANOVA model linear contrasts.
Mean value of this pharmacokinetic parameter was significantly different for LoBMI compared to HiBMI, regardless of diet (p < 0.01), determined by ANOVA model linear contrasts.
Mean value for NB diet was different from that for DB diet, p < 0.05.
Of the 151.2 μmol of glucoraphanin and glucoerucin provided in the broccoli test meal, 16.3 μmol (10.8%) and 18.1 μmol (12.0%) were recovered as metabolites in 24-h urine for the NB and DB diets, respectively (p = 0.360) (Table 3). Although there was no diet effect, there was a significant BMI effect such that for urine from LoBMI subjects, 12.9 μmol (8.5%) of the 151.2 μmol of glucoraphanin and glucoerucin were recovered as urinary metabolites whereas urine from HiBMI subjects contained 22.8 μmol (15.1%) of the glucoraphanin and glucoerucin (p = 0.036). Whereas, the BMI effect was significant, the diet × BMI interaction for urinary total metabolites in 24 h was non-significant (p = 0.195).
There was no diet effect or significant interaction of diet × BMI in plasma for AUC, Mmax, or Tmax (Table 3). However, as for urinary metabolites, there was a significant main effect of BMI for AUC, Mmax, and Tmax, and a diet effect for k. AUC was 3.1 and 6.8 μmol·h for LoBMI and HiBMI, respectively (p = 0.006). Mmax was 0.5 and 1.01 μmol for LoBMI and HiBMI, respectively (p = 0.025). Although less divergent, Tmax also differed by BMI. For LoBMI, Tmax = 4.9 h and for HiBMI, Tmax = 6.2 h (p = 0.028). Plots of plasma mass of metabolites vs. time (up to 24 h) are presented in Figure 3A (plasma mass of metabolites by diet for LoBMI), Figure 3B (plasma mass of metabolites by diet for HiBMI), and Figure 3C (plasma mass of metabolites by BMI with NB and DB diets combined). The effect of BMI on plasma mass of metabolites over time was non-significant (p = 0.079). However, the plasma mass curves are not inconsistent with Table 3 where AUC and Mmax for LoBMI were lower than those for HiBMI. Notably, the Tmax values observable in Figure 3C appear to be similar for LoBMI and HiBMI, in contrast to Table 3 where Tmax is lower for LoBMI compared to Tmax for HiBMI. This likely occurred because the Tmax in Table 3 was determined using each individual response curve and the shapes of these curves among individuals varied. Because the Tmax in Table 3 is the least squares mean of directly determined Tmax values of individual subjects, it represents Tmax independently of curve shape.
Figure 3
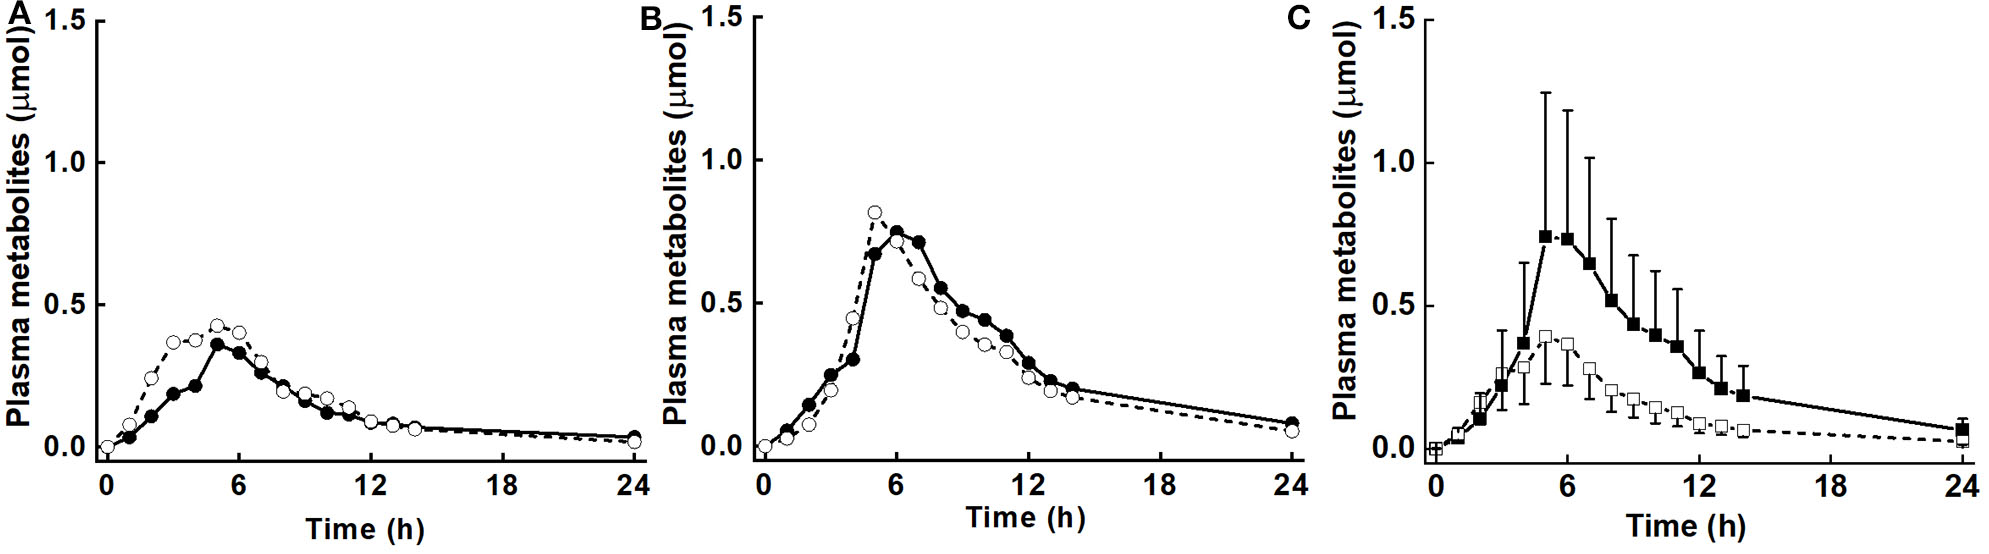
Plasma mass (μmol) of metabolites (sum of sulforaphane, sulforaphane-glutathione, sulforaphane-cysteineglycine, sulforaphane-cysteine, sulforaphane-N-acetylcysteine, erucin-glutathione, erucin-cysteineglycine, erucin-cysteine, and erucin-N-acetylcysteine) with time for control and broccoli diets. (A) LoBMI, BMI < 26 kg/m2 (n = 8), (B) HiBMI, BMI > 26 kg/m2 (n = 9), and (C) each BMI group with combined data from the control and broccoli diets (n = 17). Values are least squares means. Because the response curves within (A,B) are similar and error bars were overlain and obscured the response curves, the error bars are not shown. p = 0.147 for diet × BMI interaction as determined by ANOVA model linear contrasts. For (C), upper 95% confidence limits are shown above largest mean at a given time and lower 95% confidence limits are shown below smallest mean at a given time. p = 0.079 for main effect of BMI. •, daily broccoli diet; °, control diet; ■, HiBMI, BMI > 26 kg/m2; □, LoBMI, BMI < 26 kg/m2.
Urinary excretion rates during the collection time periods are shown in Figure 4. As with the plasma response over time, diet did not affect urinary excretion rates nor the interaction of diet with BMI, while the main effect of BMI was close to significance (p = 0.072).
Figure 4
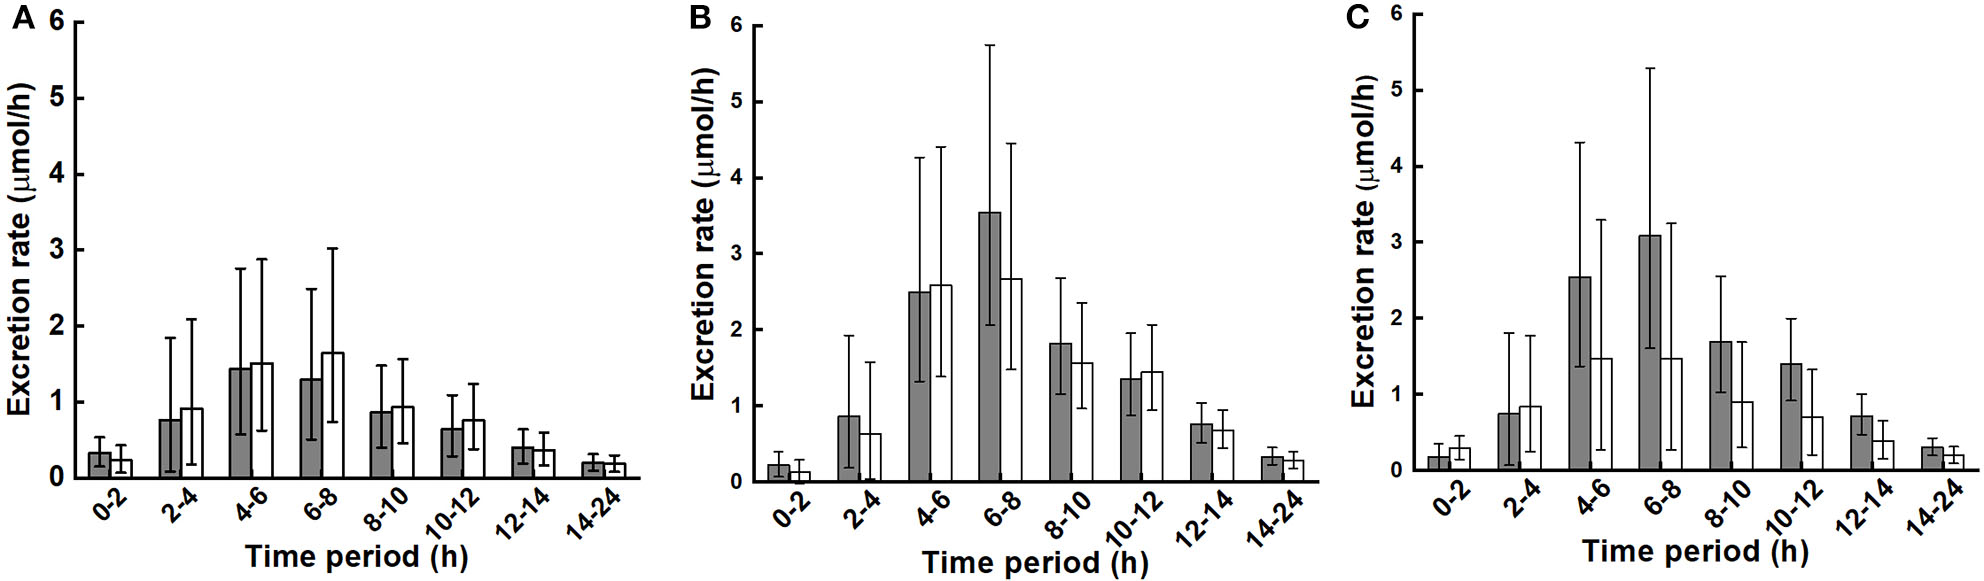
Urinary excretion rate of metabolites (sum of sulforaphane, sulforaphane-glutathione, sulforaphane-cysteineglycine, sulforaphane-cysteine, sulforaphane-N-acetylcysteine, erucin-glutathione, erucin-cysteineglycine, erucin-cysteine, and erucin-N-acetylcysteine) during collection periods for control and broccoli diets. (A) LoBMI, BMI < 26 kg/m2 (n = 8), (B) HiBMI, BMI > 26 kg/m2 (n = 9), and (C) each BMI group with combined data from the control and broccoli diets (n = 17). Values are least squares means and 95% confidence intervals. p = 0.072 for main effect of BMI as determined by ANOVA model linear contrasts. p = 0.655 for diet × BMI interaction. For (A,B): ■, daily broccoli diet; □, control diet. For (C): ■, HiBMI, BMI > 26 kg/m2; □, BMI < 26 kg/m2.
Discussion
Results indicate that in comparison to consuming a brassica-free control diet for 16 days, consuming cooked broccoli daily for 16 days prior to the broccoli test meal did not influence glucosinolate metabolism or ITC absorption and metabolism, regardless of BMI. In contrast, there was a pronounced effect of BMI on absorption and metabolism, unrelated to frequency of broccoli intake. Appearance of glucosinolate metabolites in plasma and urine was greatly increased in the HiBMI group compared to the LoBMI group. Specifically, both plasma glucosinolate metabolite AUC and Mmax doubled in subjects with BMI > 26 kg m−2 (HiBMI, 30.1 ± 2.6 kg/m2, mean ± SD) compared to metabolite values from subjects with BMI < 26 kg/m2 (LoBMI, 23.3 ± 2.7 kg/m2, mean ± SD), even given that the number of subjects was small (n = 17; Table 3). Time to maximum plasma levels of metabolites, Tmax, and the 24-h accumulation of total urinary metabolites were also greater (127 and 177%, respectively) in subjects with HiBMI compared to values from subjects with LoBMI (Table 3). Furthermore, Tmax values indicate that the peak of plasma metabolites was delayed 1.3 h in subjects with a high BMI compared to subjects with a low BMI. The impact of BMI on glucosinolate metabolism and absorption may be a confounding factor in clinical trials evaluating the health impact of broccoli feeding.
In our earlier report, we determined that AUC was 10.9 and 10.0 μmol·h for the NB and DB diets, respectively, after the broccoli + daikon radish test meal (25). In contrast, AUC in this current study was far lower, with 4.7 and 4.5 μmol·h for the NB and DB diets, respectively, despite the higher dose of glucoraphanin (148 μmol in this study compared to 98 μmol in the earlier study). The lower plasma response following a higher dose is a reflection of the importance of plant myrosinase for conversion of glucoraphanin to ITC. Expectedly, given that some hydrolysis can occur in the stomach or small intestine in the presence of plant myrosinase (in the first study) but not in the absence of plant myrosinase, Tmax in the earlier study was 2.1 (NB diet) and 2.3 h (DB diet) whereas in the current study, Tmax was 5.3 (NB diet) and 5.7 h (DB diet), about 3 h longer. Decreased and delayed absorption of ITCs and ITC metabolites after the consumption of cooked broccoli or boiled broccoli sprouts has been previously reported (33). In a study comparing fresh and steamed broccoli of equivalent glucosinolate levels, AUC following steamed broccoli was 42% lower than that following fresh broccoli and Tmax was delayed from 2.1 h (fresh broccoli) to 6 h after consuming steamed broccoli (34). Others also have reported that consuming cooked broccoli results in decreased 24-h accumulation of urinary metabolites compared to fresh broccoli (35). Thus, our data are in agreement with others, that in the absence of plant myrosinase, glucosinolate metabolism and absorption is less and slower, but does occur.
We considered whether the reason for enhanced absorption and excretion in subjects with a higher BMI could be related to a prolonged gut transit time: if, for example, a longer transit time allowed for prolonged contact time with enterocytes. The later Tmax for plasma from those with a HiBMI is consistent with a longer transit time but does not confirm it. However, contrary to this hypothesis, in studies using test meals to establish normal values in healthy individuals, gastric emptying and small-bowel transit times were found to be unrelated to BMI. In a multi-center study, scintigraphy was used to assess gastric emptying of a 99Tc-labeled low fat meal, which found that 50% gastric retention occurred around 1.5 h, with no effect of BMI (36). In a large retrospective study (n = 619) using video capsule endoscopy, small-bowel transit time was not associated with BMI (37). Nonetheless, the later Tmax for the HiBMI group may indicate slower transit time for this group of individuals, and these results may reflect a transit time issue rather than a BMI issue. Further studies will be needed to identify the mechanism.
The plasma response curves for the LoBMI and HiBMI groups track closely from 0 to 5 h, and then diverge, with plasma levels rising at a higher rate in those with a high BMI compared to those with a lower BMI (Figure 3C). We propose that this difference in plasma levels reflects a difference in response of the colon and associated microbiota to the broccoli glucosinolates. Glucosinolates can be metabolized by gut microbial species including Citrobacter WYE1 and Enterobacter cloacae KS50 (38) and differences in fecal bacterial composition are thought to produce differences in the excretion of glucoraphanin metabolites (23). Furthermore, microbial composition is known to vary between lean and obese individuals, particularly with regard to the ratio of Firmicutes to Bacteroidetes (39, 40). To the best of our knowledge, it has not been established whether gut content of myrosinase-expressing bacteria varies with BMI. When active myrosinase is included in glucosinolate-rich meals as in our earlier study (25) and in that of Fahey et al. (41), ITCs and ITC metabolites are rapidly produced and then absorbed in the upper digestive tract. Neither study reported a main effect of BMI. Those results are not contrary to the notion that the BMI association observed in the current study was related to the lower digestive tract, and particularly to gut bacteria-mediated glucosinolate metabolism and absorption in the region of the colon.
Besides possible BMI-related differences in communities of myrosinase-expressing bacteria, there may be differences in microbial activities that direct glucosinolate metabolism toward the generation of non-bioactive nitriles at the expense of ITCs. In cell culture, Lactobacillus plantarum KW30 and Lactococcus lactis subsp. lactis KF147 converted glucoiberin and glucoraphanin to iberverin nitrile, erucin nitrile, and sulforaphane nitrile (42). A second pathway of nitrile formation may involve the desulfation of glucosinolates by bacteria with sulfatase activity (43) followed by the metabolism of desulfoglucosinolates to nitriles as has been observed in fermentation cultures of E. coli VL8, L. agilis R16, and E. casseliflavus (44). Additionally, the presence of Fe2+ is known to favor nitrile formation whereas Mg2+ increases ITC production (44). The lower levels of plasma metabolites and urinary accumulation of ITC metabolites in subjects with LoBMI may have occurred in response to higher nitrile-generating activity of gut microbiota. However, because subjects consumed a controlled diet, it is unlikely that there were differences in concentrations of Fe2 or Mg2+ ions that influenced glucosinolate hydrolysis. We did not measure nitrile content.
The strengths of this study include the randomized, crossover study design, the use of controlled feeding, the measurement of metabolites of glucoraphanin and glucoerucin, and the use of multiple collection points during the 24 h following the test meal. Also, there were limitations to the study. The unconjugated isothiocyanate erucin was not measured because it could not be reliably measured on our analytical system (25) and knowledge of erucin in plasma and/or urine may have provided more insight into glucoraphanin and glucoerucin metabolism. However, conjugated erucin metabolites were measured. Another limitation was that there was a small energy and fiber difference between the NB and DB diets due to the addition of broccoli to the DB diet. Two hundred grams of broccoli daily provided 264 kJ d−1 (62 kcal d−1). We previously calculated that this would add about 0.15 kg to subject body weight over 16 d, which for an 80-kg subject, is 0.2% of the body weight and probably is insignificant (25). The additional 5.4 g/d of fiber could have impacted the composition of the microbiome, but as there was no influence of diet on metabolite levels, this was not likely responsible for the different responses by BMI. Finally, we chose to study the predominant glucosinolate in broccoli, glucoraphanin, and glucoerucin with which it interconverts. The association of BMI with indole glucosinolate metabolites was not studied, but may be worthy of future investigation.
In conclusion, daily consumption of cooked broccoli without supplementary plant myrosinase did not affect plasma or urinary metabolite levels of glucoraphanin and glucoerucin measured following a cooked broccoli test meal consumed at the end of the adaption period. However, subjects with HiBMI had elevated levels of plasma and urinary metabolites and a delayed maximal plasma metabolite peak compared to those with LoBMI. This BMI-associated response was not related to daily broccoli consumption, as we observed in an earlier study in which supplementary plant myrosinase was provided with the broccoli. It is possible that gut transit time and/or differences in gut microbiota played a role in this population. The association of BMI with differential absorption and metabolism of ITCs warrants further investigation to ultimately provide more efficacious dietary guidance for optimal health.
Statements
Data availability statement
The raw data supporting the conclusions of this article will be made available by the authors, without undue reservation.
Ethics statement
The studies involving human participants were reviewed and approved by Chesapeake IRB, MD, USA. The patients/participants provided their written informed consent to participate in this study.
Author contributions
CC, JN, EJ, BV, HS, and SR designed the research. CC and JN conducted the research. BV conducted the statistical analyses. CC drafted the article. All authors edited and approved the article.
Funding
This work was supported by the USDA (JN, 8040-5100-059-00D) and the National Cancer Institute (ACN16003-001-00000).
Acknowledgments
The authors thank Dawn J. Harrison and Meredith A. Capuco for conducting the analytical analyses. The mention of trade names or commercial products in this publication is solely for the purpose of providing specific information and does not imply recommendation or endorsement by the USDA. USDA is an equal opportunity provider and employer.
Conflict of interest
The authors declare that the research was conducted in the absence of any commercial or financial relationships that could be construed as a potential conflict of interest.
Supplementary material
The Supplementary Material for this article can be found online at: https://www.frontiersin.org/articles/10.3389/fnut.2020.575092/full#supplementary-material
- DB
daily broccoli
- ER
erucin
- ER-C
erucin-cysteine
- ER-CG
erucin-cysteineglycine
- ER-GSH
erucin-glutathione
- ER-NAC
erucin-N-acetylcysteine
- GST
glutathione S-transferase
- GSTM1
glutathione S-transferase μ 1
- GSTT1
glutathione S-transferase θ 1
- ITC
isothiocyanate
- LSmean
least squares mean
- NB
no broccoli
- SF
sulforaphane
- SF-C
sulforaphane-cysteine
- SF-CG
sulforaphane-cysteineglycine
- SF-GSH
sulforaphane-glutathione
- SF-NAC
sulforaphane-N-acetylcysteine
- ER-C
erucin-cysteine
- ER-CG
erucin-cysteineglycine
- ER-GSH
erucin-glutathione
- ER-NAC
erucin-N-acetylcysteine.
Abbreviations
References
1.
Wu QJ Yang Y Wang J Han LH Xiang YB . Cruciferous vegetable consumption and gastric cancer risk: a meta-analysis of epidemiological studies. Cancer Sci. (2013) 104:1067–73. 10.1111/cas.12195
2.
Liu B Mao Q Cao M Xie L . Cruciferous vegetables intake and risk of prostate cancer: A meta-analysis. Int J Urol. (2012) 19:134–41. 10.1111/j.1442-2042.2011.02906.x
3.
Mori N Shimazu T Sasazuki S Nozue M Mutoh M Sawada N et al . Cruciferous vegetable intake is inversely associated with lung cancer risk among current nonsmoking men in the Japan public health center (JPHC) study. J Nutr. (2017) 147:841–9. 10.3945/jn.117.247494
4.
Abbaoui B Lucas CR Riedl KM Clinton SK Mortazavi A . Cruciferous vegetables, isothiocyanates, and bladder cancer prevention. Mol Nutr Food Res. (2018) 62:e1800079. 10.1002/mnfr.201800079
5.
Morrison MEW Joseph JM McCann SE Tang L Almohanna HM Moysich B et al . Cruciferous vegetable consumption and stomach cancer: a case-control study. Nutr Cancer. (2020) 72:52–61. 10.1080/01635581.2019.1615100
6.
Farvid MS Chen WY Rosner BA Tamimi RM Willett WC Eliassen H et al . Fruit and vegetable consumption and breast cancer incidence: repeated measures over 30 years of follow-up. Int J Cancer. (2019) 144:1496–510. 10.1002/ijc.31653
7.
Xu C Zeng XT Liu TZ Zhang C Yang ZH Li S et al . Fruits and vegetables intake and risk of bladder cancer: a PRISMA-compliant systematic review and dose-response meta-analysis of prospective cohort studies. Medicine. (2015) 94:e759. 10.1097/MD.0000000000000759
8.
Mori N Sawada N Shimazu T Yamaji T Goto A Takachi R et al . Cruciferous vegetable intake and colorectal cancer risk: Japan public health center-based prospective study. Eur J Cancer Prev. (2019) 28:420–7. 10.1097/CEJ.0000000000000491
9.
Petimar J Wilson KM Wu K Wang M Albanes D van Den Brandt PA et al . A pooled analysis of 15 prospective cohort studies on the association between fruit, vegetable, and mature bean consumption and risk of prostate cancer. Cancer Epidemiol Biomarkers Prev. (2017) 26:1276–87. 10.1158/1055-9965.EPI-16-1006
10.
He J Gu Y Zhang S . Consumption of vegetables and fruits and breast cancer survival: A systematic review and meta-analysis. Sci Rep. (2017) 7:599. 10.1038/s41598-017-00635-5
11.
Zhang Y Talalay P Cho CG Posner GH . A major inducer of anticarcinogenic protective enzymes from broccoli: isolation and elucidation of structure. Proc Natl Acad Sci USA. (1992) 89:2399–403. 10.1073/pnas.89.6.2399
12.
Tang L Zhang Y . Dietary isothiocyanates inhibit the growth of human bladder carcinoma cells. J Nutr. (2004) 134:2004–10. 10.1093/jn/134.8.2004
13.
Bhattacharya A Li Y Wade KL Paonessa JD Fahey JW Zhang Y et al . Allyl isothiocyanate-rich mustard seed powder inhibits bladder cancer growth and muscle invasion. Carcinogenesis. (2010) 31:2105–10. 10.1093/carcin/bgq202
14.
Chen YJ Wallig MA Jeffery EH . Dietary broccoli lessens development of fatty liver and liver cancer in mice given diethylnitrosamine and fed a western or control diet. J Nutr. (2016) 146:542–50. 10.3945/jn.115.228148
15.
Melchini A Traka MH Catania S Miceli N Taviano MF Maimone P et al . Antiproliferative activity of the dietary isothiocyanate erucin, a bioactive compound from cruciferous vegetables, on human prostate cancer cells. Nutr Cancer. (2013) 65:132–8. 10.1080/01635581.2013.741747
16.
dos Santos P.W.D.S. Machado ART de Grandis RA Ribeiro DL Tuttis K et al . Transcriptome and DNA methylation changes modulated by sulforaphane induce cell cycle arrest, apoptosis, DNA damage, and suppression of proliferation in human liver cancer cells. Food Chem Toxicol. (2020) 136:111047. 10.1016/j.fct.2019.111047
17.
Charron CS Saxton AM Sams CE . Relationship of climate and genotype to seasonal variation in the glucosinolate-myrosinase system. II. Myrosinase activity in ten cultivars of Brassica oleracea grown in fall and spring seasons. J Sci Food Agric. (2005) 85:682–90. 10.1002/jsfa.2031
18.
Charron CS Saxton AM Sams CE . Relationship of climate and genotype to seasonal variation in the glucosinolate-myrosinase system. I. Glucosinolate content in ten cultivars of Brassica oleracea grown in fall and spring seasons. J Sci Food Agric. (2005) 85:671–81. 10.1002/jsfa.1880
19.
Wang GC Farnham M Jeffery EH . Impact of thermal processing on sulforaphane yield from Broccoli (Brassica oleracea L. ssp. italica). J Agric Food Chem. (2012) 60:6743–8. 10.1021/jf2050284
20.
Dosz EB Jeffery EH . Commercially produced frozen broccoli lacks the ability to form sulforaphane. J Funct Foods. (2013) 5:987–90. 10.1016/j.jff.2013.01.033
21.
Seow A Shi CY Chung FL Jiao D Hankin JH Lee HP et al . Urinary total isothiocyanate (ITC) in a population-based sample of middle-aged and older Chinese in Singapore: relationship with dietary total ITC and glutathione S-transferase M1/T1/P1 genotypes. Cancer Epidemiol Biomarkers Prev. (1998) 7:775–81.
22.
Gasper AV Al-janobi A Smith JA Bacon JR Fortun P Atherton C et al . Glutathione S-transferase M1 polymorphism and metabolism of sulforaphane from standard and high-glucosinolate broccoli. Am J Clin Nutr. (2005) 82:1283–91. 10.1093/ajcn/82.6.1283
23.
Li F Hullar MAJ Beresford SAA Lampe JW . Variation of glucoraphanin metabolism in vivo and ex vivo by human gut bacteria. Br J Nutr. (2011) 106:408–16. 10.1017/S0007114511000274
24.
Kaczmarek JL Liu X Charron CS Novotny JA Jeffery EH Seifried HE et al . Broccoli consumption affects the human gastrointestinal microbiota. J Nutr Biochem. (2019) 63:27–34. 10.1016/j.jnutbio.2018.09.015
25.
Charron CS Vinyard BT Ross SA Seifried HE Jeffery EH Novotny A et al . Absorption and metabolism of isothiocyanates formed from broccoli glucosinolates: effects of BMI and daily consumption in a randomised clinical trial. Br J Nutr. (2018) 120:1370–9. 10.1017/S0007114518002921
26.
Charron CS Clevidence BA Albaugh GA Kramer MH Vinyard BT Milner JA et al . Assessment of DNA damage and repair in adults consuming allyl isothiocyanate or Brassica vegetables. J Nutr Biochem. (2013) 24:894–902. 10.1016/j.jnutbio.2012.06.004
27.
Saha S Hollands W Teucher B Needs PW Narbad A Ortori CA et al . Isothiocyanate concentrations and interconversion of sulforaphane to erucin in human subjects after consumption of commercial frozen broccoli compared to fresh broccoli. Mol Nutr Food Res. (2012) 56:1906–16. 10.1002/mnfr.201200225
28.
Prosky L Asp NG Furda I DeVries JW Schweizer TF Harland F et al . Determination of total dietary fiber in food and food products: collaborative study. J Assoc Off Anal Chem. (1985) 68:677–9. 10.1093/jaoac/68.4.677
29.
Kassahun K Davis M Hu P Martin B Baillie T . Biotransformation of the naturally occurring isothiocyanate sulforaphane in the rat: identification of phase I metabolites and glutathione conjugates. Chem Res Toxicol. (1997) 10:1228–33. 10.1021/tx970080t
30.
Egner PA Kensler TW Chen J-G Gange SJ Groopman JD Friesen MD et al . Quantification of sulforaphane mercapturic acid pathway conjugates in human urine by high-performance liquid chromatography and isotope-dilution tandem mass spectrometry. Chem Res Toxicol. (2008) 21:1991–6. 10.1021/tx800210k
31.
Lemmens HJM Bernstein DP Brodsky JB . Estimating blood volume in obese and morbidly obese patients. Obes Surg. (2006) 16:773–6. 10.1381/096089206777346673
32.
Dill DB Costill DL . Calculation of percentage changes in volumes of blood, plasma, and red cells in dehydration. J Appl Physiol. (1974) 37:247–8. 10.1152/jappl.1974.37.2.247
33.
Fahey JW Holtzclaw WD Wehage SL Wade KL Stephenson KK Talalay P et al . Sulforaphane bioavailability from glucoraphanin-rich broccoli: control by active endogenous myrosinase. PLoS ONE. (2015) 10:e0140963. 10.1371/journal.pone.0140963
34.
Vermeulen M Klöpping-Ketelaars IWAA van den Berg R Vaes WHJ . Bioavailability and kinetics of sulforaphane in humans after consumption of cooked versus raw broccoli. J Agric Food Chem. (2008) 56:10505–9. 10.1021/jf801989e
35.
Conaway CC Getahun SM Liebes LL Pusateri DJ Topham DKW Botero-Omary M et al . Disposition of glucosinolates and sulforaphane in humans after ingestion of steamed and fresh broccoli. Nutr Cancer. (2000) 38:168–78. 10.1207/S15327914NC382_5
36.
Tougas G Eaker EY Abell TL Abrahamsson H Boivin M Chen J et al . Assessment of gastric emptying using a low fat meal: Establishment of international control values. Am J Gastroenterol. (2000) 95:1456–62. 10.1111/j.1572-0241.2000.02076.x
37.
Hsu AJ Wang L Cave D . Measuring small bowel transit time in obesity by video capsule endoscopy. Am J Gastroenterol. (2018) 113:S660. 10.14309/00000434-201810001-01152
38.
Narbad A Rossiter JT . Gut glucosinolate metabolism and isothiocyanate production. Mol Nutr Food Res. (2018) 62:e17000991. 10.1002/mnfr.201700991
39.
Castaner O Goday A Park YM Lee SH Magkos F Shiow SATE et al . The gut microbiome profile in obesity: a systematic review. Int J Endocrinol. (2018) 2018:4095789. 10.1155/2018/4095789
40.
Haro C Rangel-Zúñiga OA Alcalá-Díaz JF Gómez-Delgado F Pérez-Martínez P Delgado-Lista J et al . Intestinal microbiota is influenced by gender and body mass index. PLoS ONE. (2016) 11:e0154090. 10.1371/journal.pone.0154090
41.
Fahey JW Wade KL Stephenson KK Panjwani AA Liu H Cornblatt G et al . Bioavailability of sulforaphane following ingestion of glucoraphanin-rich broccoli sprout and seed extracts with active myrosinase: a pilot study of the effects of proton pump inhibitor administration. Nutrients. (2019) 11:1489. 10.3390/nu11071489
42.
Mullaney JA Kelly WJ McGhie TK Ansell J Heyes J.A . Lactic acid bacteria convert glucosinolates to nitriles efficiently yet differently from enterobacteriaceae. J Agric Food Chem. (2013) 61:3039–46. 10.1021/jf305442j
43.
Hanson SR Best MD Wong CH . Sulfatases: structure, mechanism, biological activity, inhibition, and synthetic utility. Angew Chemie Int Ed. (2004) 43:5736–63. 10.1002/anie.200300632
44.
Luang-In V Albaser AA Nueno-Palop C Bennett MH Narbad A Rossiter T et al . Glucosinolate and desulfo-glucosinolate metabolism by a selection of human gut bacteria. Curr Microbiol. (2016) 73:442–51. 10.1007/s00284-016-1079-8
Summary
Keywords
broccoli, glucosinolates, isothiocyanates, BMI, bioavailability
Citation
Charron CS, Vinyard BT, Jeffery EH, Ross SA, Seifried HE and Novotny JA (2020) BMI Is Associated With Increased Plasma and Urine Appearance of Glucosinolate Metabolites After Consumption of Cooked Broccoli. Front. Nutr. 7:575092. doi: 10.3389/fnut.2020.575092
Received
22 June 2020
Accepted
20 August 2020
Published
24 September 2020
Volume
7 - 2020
Edited by
Raul Zamora-Ros, Institut d'Investigacio Biomedica de Bellvitge (IDIBELL), Spain
Reviewed by
Diego A. Moreno, Consejo Superior de Investigaciones Científicas (CSIC), Spain; Tiziano Verri, University of Salento, Italy
Updates
Copyright
© 2020 Charron, Vinyard, Jeffery, Ross, Seifried and Novotny.
This is an open-access article distributed under the terms of the Creative Commons Attribution License (CC BY). The use, distribution or reproduction in other forums is permitted, provided the original author(s) and the copyright owner(s) are credited and that the original publication in this journal is cited, in accordance with accepted academic practice. No use, distribution or reproduction is permitted which does not comply with these terms.
*Correspondence: Janet A. Novotny Janet.Novotny@usda.gov
This article was submitted to Nutritional Epidemiology, a section of the journal Frontiers in Nutrition
Disclaimer
All claims expressed in this article are solely those of the authors and do not necessarily represent those of their affiliated organizations, or those of the publisher, the editors and the reviewers. Any product that may be evaluated in this article or claim that may be made by its manufacturer is not guaranteed or endorsed by the publisher.