 Hanieh Moshtaghian1,2*
 Karen E. Charlton1,2
 Jimmy Chun Yu Louie3
 Yasmine C. Probst1,2Paul Mitchell4
 Victoria M. Flood5,6
- 1School of Medicine, Faculty of Science, Medicine and Health, University of Wollongong, Wollongong, NSW, Australia
- 2Illawarra Health and Medical Research Institute, Wollongong, NSW, Australia
- 3School of Biological Sciences, Faculty of Science, The University of Hong Kong, Pokfulam, Hong Kong
- 4Center for Vision Research, Department of Ophthalmology and Westmead Millennium Institute, University of Sydney, Sydney, NSW, Australia
- 5Sydney School of Health Sciences, Faculty of Medicine and Health, University of Sydney, Sydney, NSW, Australia
- 6Westmead Hospital, Western Sydney Local Health District, Westmead, NSW, Australia
Background: The evidence regarding the association between added sugar (AS) intake and obesity remains inconsistent. The aim of this study was to investigate the association between changes in the percentage of energy intake from AS (EAS%) and changes in body weight in a cohort study of older Australians during 15 years of follow-up. In addition, associations were assessed according to whether EAS% intake was provided from beverage or non-beverage sources.
Methods: Data were analyzed from the participants of the Blue Mountains Eye Study Cohort. Dietary data were collected at baseline (1992–94) and three five-yearly intervals using a 145-item food frequency questionnaire. Participants' body weight was measured at each time point. Five-yearly changes in EAS% intake and body weight were calculated (n = 1,713 at baseline). A generalized estimating equation (GEE) model was used to examine the relationship between the overall five-yearly changes in EAS% intake and body weight, adjusted for dietary and lifestyle variables.
Results: In each time interval, the EAS% intake decreased by ~5% in the lowest quartile (Q1) and increased by ~5% in the highest quartile (Q4). The mean (SD) body weight change in Q1 and Q4 were 1.24 (8.10) kg and 1.57 (7.50) kg (first time interval), 0.08 (6.86) kg and −0.19 (5.63) kg (second time interval), and −1.22 (5.16) kg and −0.37 (5.47) kg (third time interval), respectively. In GEE analyses, the overall five-yearly change in EAS% intake was not significantly associated with body weight change (Ptrend = 0.837). Furthermore, no significant associations were observed between changes in EAS% intake from either beverage or non-beverage sources and changes in body weight (Ptrend for beverage sources = 0.621 and Ptrend for non-beverage sources = 0.626).
Conclusion: The findings of this older Australian cohort do not support the association between changes in EAS% intake and body weight, regardless of AS food sources (beverage or non-beverage).
Introduction
Obesity is a major public health issue in all age groups, including the elderly. Several physical and mental health complications (e.g., cardiovascular disease and depression) are associated with obesity in this population (1). Obesity has a negative impact on the overall quality of life and chronic disease-free life expectancy of older adults (2). Therefore, there is a global focus on the prevention of obesity to reduce the financial and psychosocial burden of the obesity-associated chronic diseases, particularly among the older sectors of the population (3–5). Of the multifactorial causes of obesity, diet is a modifiable risk factor and a target for many weight loss programs (6).
Diets high in energy-dense foods have been linked to obesity (7), and added sugar (AS) has been identified as a major component in many energy-dense foods (8). AS is defined as sugars and syrups added to foods during processing and preparation (9). Honey and concentrated fruit juices used as an ingredient in the multi-ingredient foods are also considered to be AS (10). This is similar to the World Health Organization free sugar definition where all monosaccharaides and disaccharides added to foods (by the manufacturer, cook, or consumer) and sugars naturally present in honey, syrups, fruit juices, and fruit juice concentrates are considered in the free sugar definition (11).
Several intervention studies have investigated the effect of AS intake on the weight gain or development of obesity. These studies accounted for individual types of sugars (e.g., fructose or glucose) or specific food sources of AS (i.e., sugar-sweetened beverages) (12–15), but did not consider the contribution of total AS intake. In addition, some studies were short-term (<1 month) (12, 13, 15), therefore, the generalization of the outcomes of these studies to the general population and everyday diets is limited. Conversely, cohort studies with longer follow-up periods have tended to focus on sugar-sweetened beverages as major sources of AS. In most cases, these studies have reported a positive association between the intake of these beverages and indicators of obesity (16, 17). Nevertheless, the association has not been confirmed in all studies nor across all age groups, including older adults (18, 19).
Few cohort studies have been conducted to investigate the association between baseline AS intake and change in body weight or body mass index (BMI) (19, 20). A longitudinal study that investigated the change in AS intake in children and adolescents reported no significant associations between AS intake, or AS intake from liquid or solid food sources, and BMI when the analysis was adjusted for total energy intake (21). This was contrary to findings from other cohort studies, in which increases in the intake of sugar sweetened beverages were associated with an increased BMI (22, 23). In addition to inconsistent findings for the liquid food sources of AS, results of studies on the association between other AS food sources (e.g., sweets, desserts, and other solid sources) and obesity indicators (24, 25) were also contradictory.
To our knowledge, the longitudinal association between change in AS intake and body weight change over time has not been investigated in adults, including older populations. The aim of the current study is, therefore, to investigate the associations between change in the percentage of energy intake from AS (EAS%) and body weight change in a longitudinal cohort of older Australians during 15 years of follow-up. In addition, associations were assessed according to whether EAS% intake was provided from beverage or non-beverage sources.
Methods
Study Population
This study is a secondary analysis of data from the Blue Mountains Eye Study (BMES) cohort. Details of the BMES have been described in detail elsewhere (26). Briefly, participants of the BMES were aged ≥49 years old at baseline and lived in two postcode areas within the Blue Mountains region, New South Wales, Australia. Baseline data collection (BMES 1) was conducted between 1992 and 1994 and subsequent data were collected every 5 years (BMES 2:1997–99, BMES 3:2002–04, and BMES 4:2007–09). The BMES has ethics approval from the Sydney West Area Health Services and the University of Sydney Human Research Ethics Committees. Written informed consent was obtained from all participants.
Dietary Data Collection
Dietary data were collected using a validated 145-item semi-quantitative food frequency questionnaire (FFQ) (27) and analyzed using corresponding food composition data from the Australian Nutrient Tables (NUTTAB) to assess nutrient intakes. NUTTAB 1990 was used for the BMES 1, NUTTAB 1995 for BMES 2 and 3 and NUTTAB 2010 for BMES 4, to align with the food supply at each follow up time-points. The NUTTAB databases contain the nutrient content of various foods, including total sugars, but do not contain AS values. Therefore, the AS content of FFQ food items was estimated for each NUTTAB using a stepwise method (28). In this 10-step systematic method, foods with zero total sugar and natural/unprocessed foods were considered to have zero AS. Foods containing 100% AS (i.e., no naturally occurring sugar), such as regular soft drinks, were considered to have an AS content equivalent to the total sugar content (28). The AS content of other foods was estimated from recipes, comparisons of the total sugar content of sweetened products with unsweetened varieties, analytical data for individual sugar types (i.e., lactose and maltose), adoption of values from other countries' AS databases or using food labels (28).
FFQ dietary intake data were cleaned for implausible energy and nutrient intakes (26). For example, FFQs with 12 blank questions or blank page(s) were excluded. Participants with implausible energy intakes of <2,500 kJ and >18,000 kJ or extreme AS intakes of more than the mean ± 4 Standard Deviation (SD) were also excluded. For this study, only participants who provided both dietary and body weight data at two consecutive time points (paired observations) were included in the analyses. These paired observations were provided by 1,713 participants in the first time interval (BMES 1–2), 1,209 participants in the second time interval (BMES 2–3) and 747 participants in the third time interval (BMES 3–4). Thus, the total number of paired observations were 3,669. Throughout this study, the beginning of each time interval is referred to as the “initial” time point.
Classification of Beverage vs. Non-beverage Added Sugar Sources
Food groups were developed (29) based on the 1995 Australian National Nutrition Survey (NNS1995) (30). For AS analyses, food groups were modified to represent AS food groups (31) and were then classified to beverage (liquid) or non-beverage (non-liquid: semi-solid/solid) categories. The beverage category included the sugar-sweetened beverages group and was formed based on the definition of sugar-sweetened beverages. According to this definition, water-based non-alcoholic beverages containing AS, including regular soft drinks, cordial, electrolyte and energy drinks, fruit, and vegetable drinks (excluding milk, 100% fruit juice, and artificially sweetened drinks) are considered sugar-sweetened beverages (32, 33). Thus, in this study, the beverage category included sugar-sweetened beverages (sweetened juices, cordial and soft drinks) and the non-beverage category included cereal products (breakfast cereals), cereal-based products and dishes (biscuits, cakes, buns and scones, pastries, and mixed dishes), dairy products and dishes (yogurt, custard, ice cream, and dairy-based desserts), sugar products and dishes (discretionary sugar, honey, jam, and syrup), confectionary (sweets and chocolate), savory sauces, meat (processed), and vegetables (processed/canned varieties).
Assessment of Body Weight and Covariates
For the BMES anthropometry assessments, participants' body weight (kg) was measured with electronic scales (without shoes or heavy clothes) (34, 35) at each time point. Since physical stature declines in aging populations (36), change in weight over time was used as an outcome rather than change in BMI. For assessing the covariates, information was collected about the participants' medical history and socio-demographic and lifestyle factors by trained interviewers at all BMES time points using extensive questionnaires (37, 38). Some of these questions were about participants' smoking status (i.e., never smoked, past smoker, or current smoker), and physical activity (39). Physical activity questions collected information regarding walking exercises and moderate-to-vigorous activities over the previous 2 weeks (39). Metabolic equivalents (METs) over 1 week were calculated based on participants' responses to the questions (39), using the International Physical Activity Questionnaire scoring protocol (40). This information was used in the current study to adjust data for smoking and physical activity.
Statistical Analyses
The changes in EAS% intake were reported as quartiles at each 5-year time interval (BMES 1–2, BMES 2–3, and BMES 3–4). The longitudinal associations between the overall 5-yearly changes in EAS% and changes in body weight during the 15 years of follow-up were investigated using a generalized estimating equation (GEE) model. The unstructured correlation matrix was selected for the GEE model to consider the within-individual correlations between the repeated observations for the same participant. In this longitudinal analysis, the first and last quartiles represented the largest decrease and the largest increase in EAS% intakes for each time interval, respectively. The change in EAS% intake was used as a continuous variable to assess P for trends.
The GEE analysis was adjusted for gender and the initial age of participants in each paired observation (Model 1). Further adjustments were made for the initial data for weight, diabetes status and EAS% intake, and both the initial and the changes in each time interval for the following variables: fiber intake, total energy intake, glycaemic index, physical activity, and smoking status (Model 2). Similar adjustment models were used for AS food source analyses by replacing EAS% intake variable with EAS% intakes from beverage and non-beverage sources. All analyses were performed in SPSS software (Version 21, SPSS Inc., Chicago, IL, USA) and statistical significance was set at P < 0.05.
Results
Participants Characteristics
The baseline characteristics of the BMES 1 participants are shown in Table 1. The mean age of BMES 1 participants was 63.8 years. The baseline mean EAS% intake was 9.40% (1.02% from beverage and 8.38% from non-beverage sources) and their mean BMI was 26.22 kg/m2. A higher proportion of the participants in the lowest quartile were smokers compared to those in other quartiles. Participants in quartile 1 had higher EAS% intakes and BMI compared to those in quartile 4. In addition, their EAS% intakes from beverage and non-beverage sources were higher than other participants. Baseline characteristics of BMES 1 participants who provided paired observations in BMES 2 vs. those without paired observations are presented in Supplementary Table 1. Participants with paired observations had a slightly lower EAS% intake compared to those without paired observations (9.40 vs. 10.14%), but their BMI was similar.
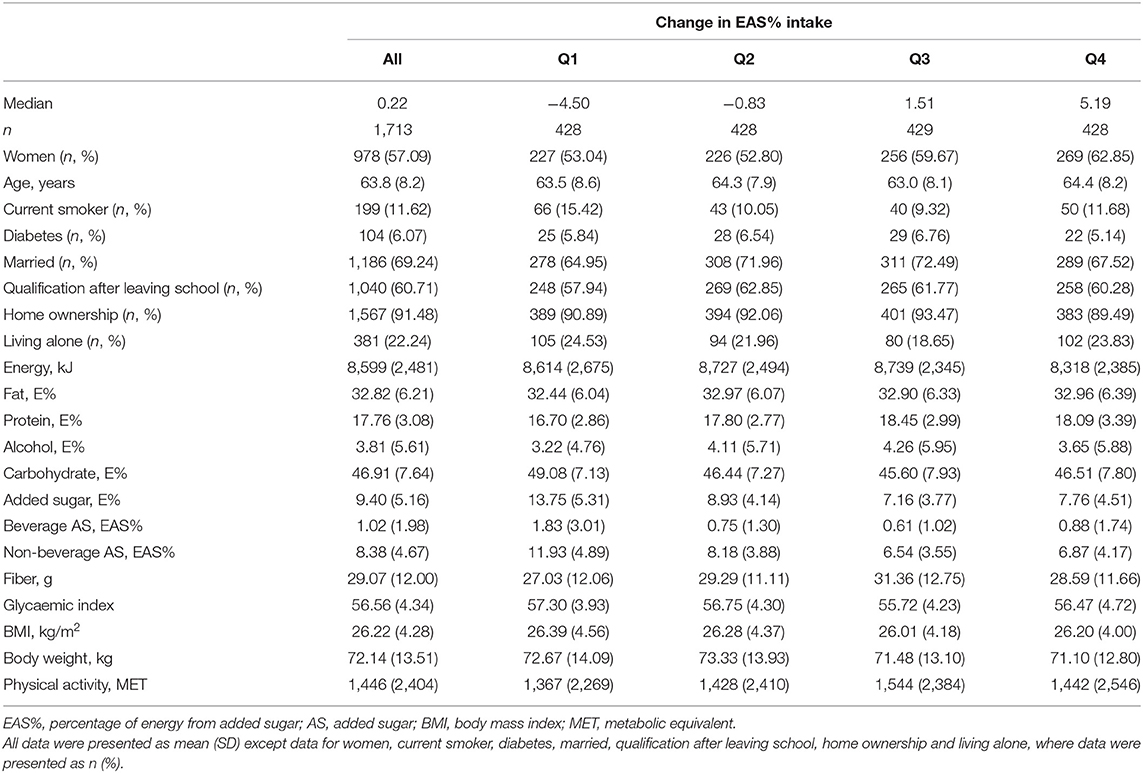
Table 1. Baseline characteristics of BMES participants according to quartiles of change in percentage of energy from added sugar (EAS%) intake during the first 5-year time interval (BMES 1–2).
Changes in Added Sugar and Weight in Each Time Interval
Change in dietary intake and weight across quartiles of changes in EAS% intake at the first, second and third time intervals are presented in Table 2. The EAS% intake at 5-year intervals decreased by ~5% in the lowest quartile and increased by ~5% in the highest quartile. The mean of change in energy intake was <200 kJ in the lowest quartiles and <75 kJ in the highest quartiles. The median change in AS intake for the largest decrease (−4.85%) was −26.39 g in the third time interval and for the largest increase (5.19%) was 26.59 g in the first time interval.
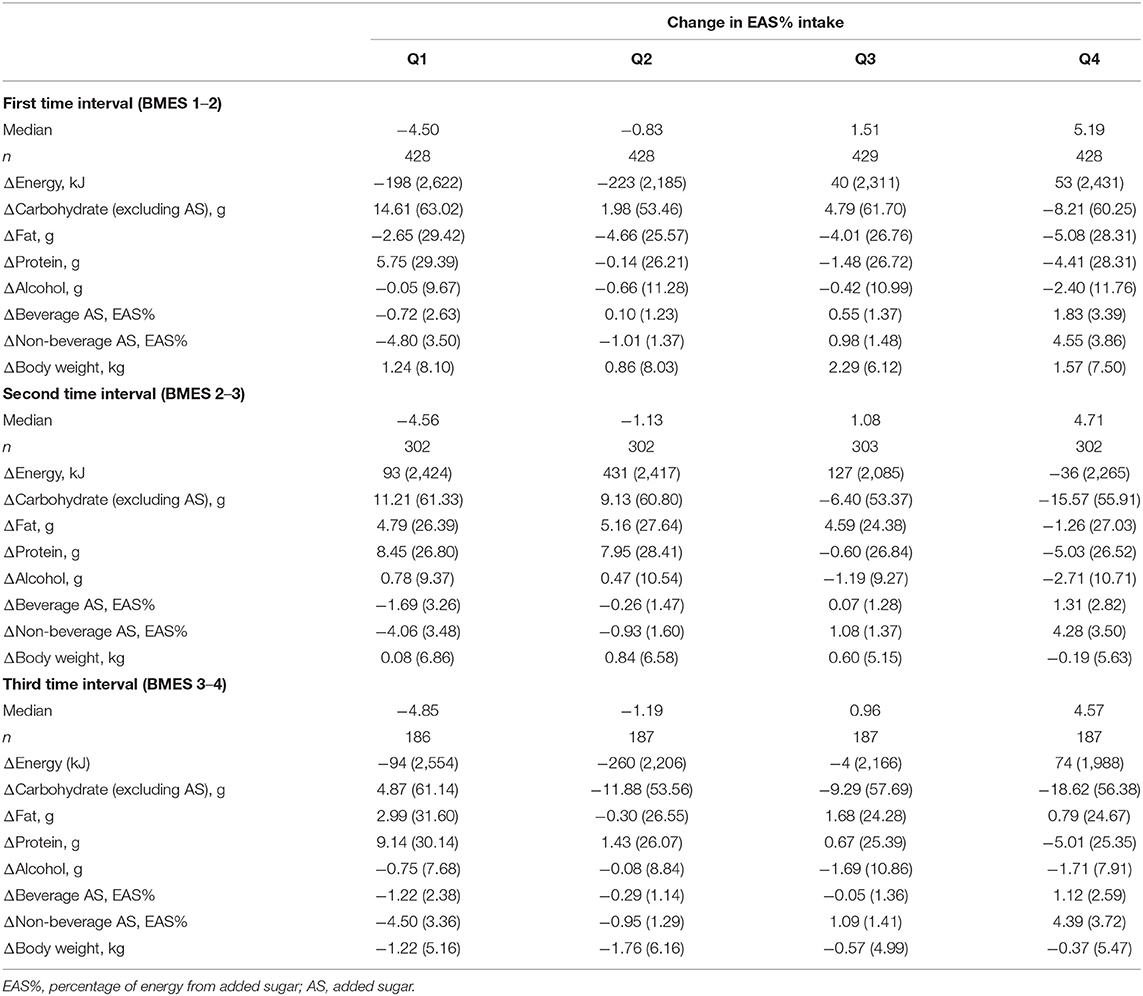
Table 2. Mean (SD) changes (Δ) in macronutrient intake and body weight according to quartiles of change in percentage of energy from added sugar (EAS%) during three 5-year time intervals in the BMES cohort.
In each time interval, participants in the lowest quartile who decreased their EAS% intake, increased their protein, other carbohydrates, fat or alcohol intakes; whereas participants in the highest quartile who increased their EAS% intakes decreased their protein, other carbohydrates, alcohol, or fat intakes. The weight gain occurred across all quartiles in the first and the second time intervals (except quartile 4 in the second time interval), and the mean body weight change in the lowest quartile was <1.3 kg and in the highest quartile was <1.6 kg. In the third time interval, those who increased their EAS% intake experienced less weight loss compared to those who decreased their intake, but weight loss occurred across all quartiles of change in EAS% intakes.
Changes in body weight across the quartiles of change in EAS% intake from beverage and non-beverage sources in each 5-year time interval are presented in Table 3. The largest increase in EAS% from beverage and non-beverage sources were 2.09 and 4.18% in the first time interval, respectively. The mean (SD) change in AS and energy intake for a 2.09% increase in EAS% from beverage sources were 15.92 (15.72) g and 224 (2,369) kJ, and for a 4.18% increase in EAS% from non-beverage sources were 24.10 (20.34) g and −35 (2,436) kJ, respectively (data not shown). For both AS sources, the mean of change in body weight in the first and fourth quartile was <1.8 kg. For EAS% intakes from non-beverage sources in the third time interval, those who had the highest increase in EAS% intake from non-beverage sources experienced less weight loss compared to those who decreased their EAS% intakes from these sources.
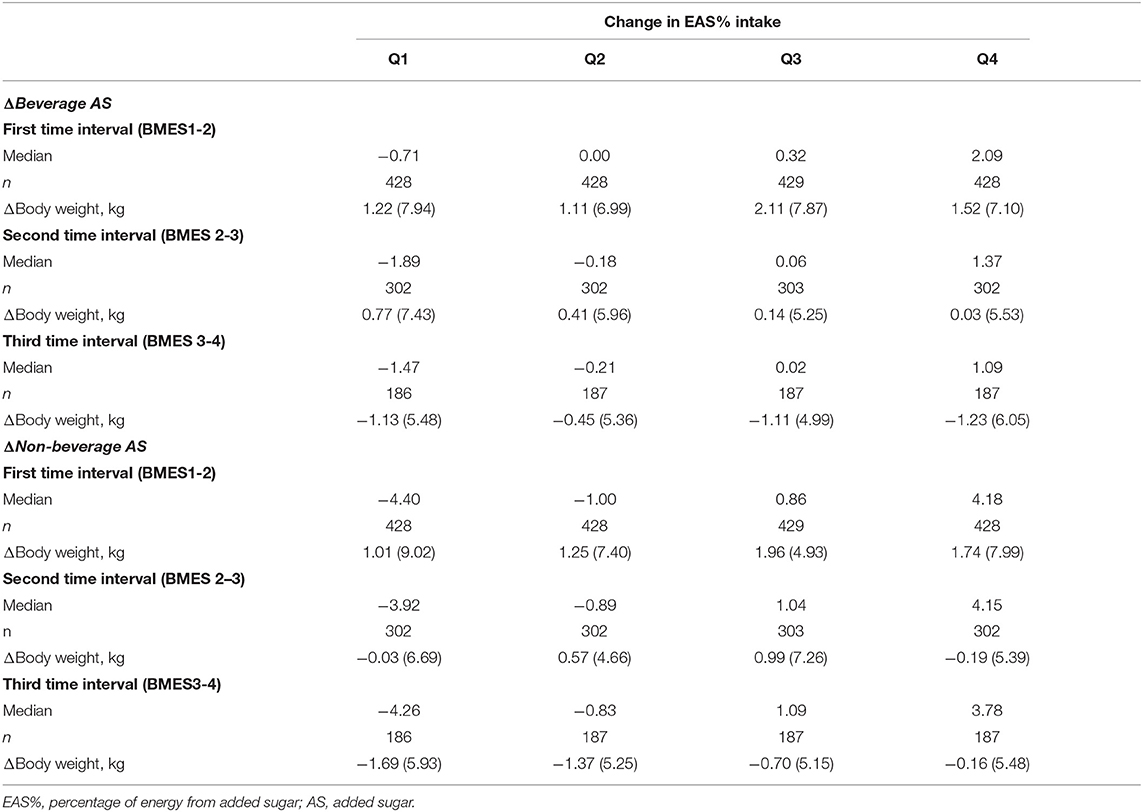
Table 3. Mean (SD) changes (Δ) in body weight according to quartiles of change in percentage of energy from added sugar (EAS%) from beverage and non-beverage sources during three 5-year time intervals in the BMES cohort.
Overall Changes in Added Sugar and Weight
The longitudinal analyses for the associations between the overall 5-yearly changes in EAS% intake and body weight during 15 years of follow-up are presented in Table 4. In both adjusted models, the association between change in EAS% intake and body weight change was not statistically significant (Model 1 Ptrend = 0.079; Model 2 Ptrend = 0.837). Similar results were observed for the association between changes in EAS% intake from either beverage or non-beverage sources and changes in body weight (Ptrend = 0.621 and Ptrend = 0.626, respectively). It is also worth noting that analyses in Model 2 were repeated by the exclusion of the initial and the changes in total energy intakes from the adjustment model and the results of these reanalyses provided similar findings.
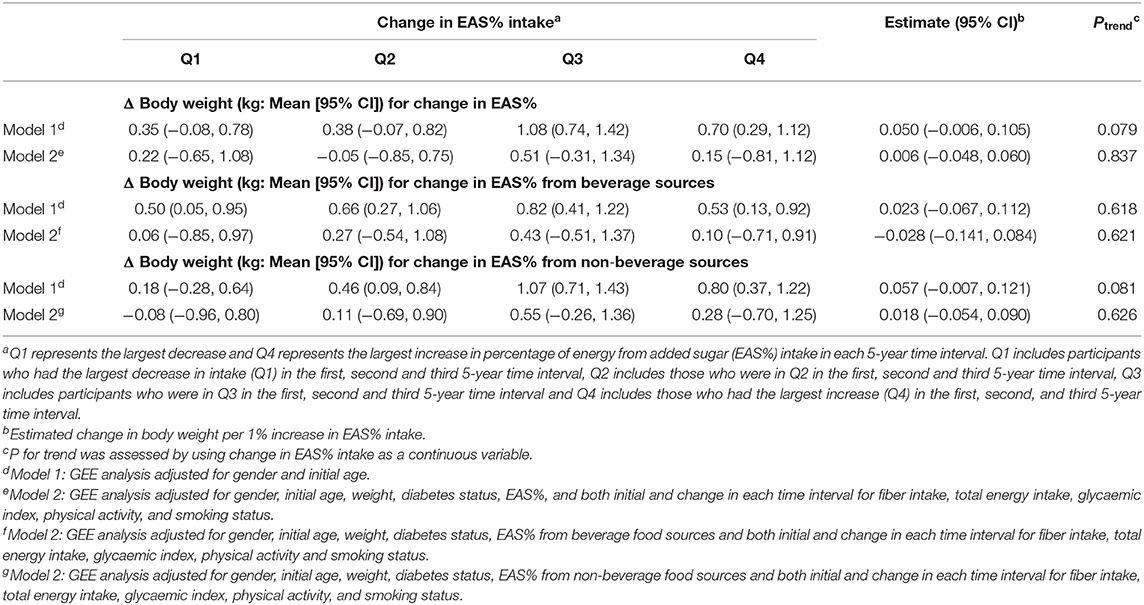
Table 4. The overall 5-yearly change (Δ) in body weight according to quartiles of change in energy from added sugar intake (EAS%) in the BMES cohort during 15 years of follow-up.
Discussion
The availability of cohort data provided an opportunity to explore the longitudinal associations between changes in EAS% intake, EAS% intake from both beverage and non-beverage sources and changes in weight over a 15-year period. In this prospective cohort, changes in EAS% intakes were not significantly associated with changes in body weight, regardless of whether the source of AS came from beverages or non-beverages.
Changes in the total energy intakes will result in body weight change (if energy expenditure remains unchanged). During all BMES time intervals, changes in the EAS% intakes were not accompanied by substantial changes in total energy intake (mostly <260 kJ across quartiles). By definition, changes in EAS% intakes were accompanied by compensatory changes in intakes of other macronutrient energy sources, such as fat, protein, alcohol, and other carbohydrates. The AS intake can result in weight gain if it contributes to excess energy intake; however, its isocaloric replacement by other macronutrient sources of energy may not result in weight change (6, 17).
Our results support the concept that when dietary changes are required, the focus should be on a range of macronutrients and overall energy intake, rather than one single nutrient. Recommendations for AS consumption suggest reduction from 10% energy to 5% energy (11, 41), however, this recommendation should consider the possibility that people may consume other macronutrient sources to compensate for the energy reduction. Our findings suggest that those who decreased their EAS% intake by 5% replaced this with increases in energy intake from other macronutrients, such as protein, fat, alcohol, and other carbohydrates. Of course, AS replacement by some nutrients, particularly protein, would provide other health benefits, such as the maintenance of muscle mass and strength (42) but replacement by alcohol may not be preferable.
A cohort study that used baseline AS intake and its food sources to investigate the association with weight gain over time reported different findings (20) compared to our study. High free sugar intake at baseline was associated with significant weight gain in Japanese men during 10 years of follow-up (20). Japanese participants in the highest quartile of free sugar intake had a weight gain of 0.20 kg over 10 years (20). Although the weight gain for the highest quartile of change in EAS% in our study was 0.15 kg, it was not statistically significant. It is worth mentioning that in both studies, this small weight gain over a long period of time may not be clinically significant.
The non-significant results for the association between AS intake and body weight in the BMES cohort is consistent with findings from studies on AS intake and BMI (19, 21). Lee et al. (21) found no significant association between changes in AS and BMI, but reported significant findings for increases in waist circumference (WC), and reported a significant positive association between AS from beverage sources and WC. The major sources of AS intake in the BMES population were non-beverage food sources (e.g., sugar, sweet spreads, and confectionary) (31). However, our non-significant findings for the association between changes in AS intake from non-beverage sources and body weight change in the BMES population is consistent with other studies on solid AS food sources and indicators of obesity (19, 23). It is worth mentioning that in the first 5-year time interval, BMES participants experienced weight gain across the quartiles of change in EAS% sources, however, in the third time interval there was an overall weight loss which could be due to the nature of the aging cohort and the expected body composition changes in the older stages of life (43).
Regarding the beverage AS food sources, most studies have focused on sugar-sweetened beverages. Several cohort studies reported that increased intake of sugar-sweetened beverages was associated with obesity indicators (e.g., weight gain and increases in BMI or WC) (22, 23, 44). AS provided by liquid food sources may play a more powerful role in the development of obesity than AS from solid food sources. This is because the consumption of liquid AS food sources appears to have a weaker satiety effect and may not result in compensation for energy intake to the same extent as solid AS food sources (45), leading to excess food consumption and resultant weight gain. There is also some evidence that carbon dioxide in carbonated beverages (i.e., soft drinks) increases the secretion of ghrelin, the hunger hormone, leading to hunger stimulation and, consequently, increased food intake and weight gain (46).
In contrast, our findings from older Australians did not support the association between AS intake from beverage sources and weight gain. This may be explained by the limited sugar-sweetened beverage intake and small changes (15.9 g) in the overall intake of these beverages among the BMES cohort of older people. Studies show that an increase in sugar-sweetened beverage intake by more than one drink per day (>40g AS or 600 kJ) is positively associated with indicators of obesity (22, 47). In a study conducted by Schulze et al. (22), frequent consumers of these beverages increased their total energy intake by 358 kcal (1,496 kJ) per day and had a weight gain of 4.7 kg over 4 years. However, in BMES participants, the increase in AS in the highest quartile of EAS% change from sugar-sweetened beverages (2%) was 15.9 g and the increase in total energy intake was 224 kJ. Similarly, a cohort of older Spanish adults also observed no significant association, likely due to the occasional intakes of sugar-sweetened beverages in this age group (18).
In BMES participants, the average BMI was <30 kg/m2 and the average EAS% was <10%. Therefore, our findings may not be generalizable to populations with high rates of obesity or those with high EAS% intake. Nonetheless, since both the BMI and EAS% intake of BMES participants are similar to national Australian older population (48), our findings may be generalizable to the older Australians. Our study has several strengths, which includes a long follow-up period and a relatively large sample size. However, despite the relatively large sample, we cannot rule out the possibility of lack of sufficient statistical power to detect the significant body weight change as this study was based on the secondary analysis of an existing cohort. Other advantages of this study include dietary assessment at each 5-year follow-up period, accompanied by measurement of body weight (i.e., not self-reported). Moreover, a consistent systematic method was used to estimate the AS content of foods in each time point.
We acknowledge that the possibility of recall bias and the over- or under-reporting of food intake (a limitation of most dietary assessment methods) cannot be ruled out. Nonetheless, implausible intakes were excluded from the dataset and changes in intake were investigated in the same participants during the 15 years, hence any over- or under-reporting may have had a minimal effect on the change in intake, and presumably any bias that may exist would have been consistent over time. Additionally, it is possible that the change in the EAS% categories reflects a statistical phenomenon of regression to the mean (49), noting that those people who reduced their EAS% intake the most (Q1) had the highest baseline EAS% intake (13.7%). This also could reflect they have scope to reduce their intake further than people with a more moderate level of baseline EAS% intake. Furthermore, although the analyses were adjusted for several covariates, the possibility of residual confounders cannot be excluded. However, as the analyses were adjusted for both initial and changes in energy intake over time, medical conditions which influence energy intake have generally been accounted for.
In conclusion, our results do not support the association between changes in EAS% intakes and body weight change in the cohort of older Australians during 15 years of follow-up. This result was similar for beverage and non-beverage AS food sources. Our findings suggest that population-level messages specifically targeted to address weight loss by reductions in AS may be less applicable to older Australians who already consume AS at moderate levels. The findings also provide insights into the importance of including multi-faceted population health messages for weight reduction, such as limiting fat (particularly saturated fat) and alcohol intake, along with any recommendations to reduce AS intake.
Data Availability Statement
The data analyzed in this study are not readily available because of ethical and privacy considerations. Requests to access the datasets should be directed to PM, cGF1bC5taXRjaGVsbEBzeWRuZXkuZWR1LmF1.
Ethics Statement
The studies involving human participants were reviewed and approved by the Sydney West Area Health Services Ethics Committee and the University of Sydney Human Research Ethics Committee. The participants provided their written informed consent to participate in this study.
Author Contributions
HM conducted the research, estimated added sugar values, analyzed the data, and drafted the manuscript. VF and PM were involved in the collection of original BMES data. All authors critically reviewed the manuscript and approved the final version submitted for publication.
Funding
The Blue Mountains Eye Study was supported by funding from the Australian National Health and Medical Research Council, Canberra, Australia. This secondary analysis was not supported by any funding.
Conflict of Interest
The authors declare that the research was conducted in the absence of any commercial or financial relationships that could be construed as a potential conflict of interest.
Acknowledgments
We would also like to thank Professor Marijka Batterham, Director of Statistical Consulting Center at the University of Wollongong and George Burlutsky, BMES statistician at Center for Vision Research, University of Sydney, for their statistical advice.
Supplementary Material
The Supplementary Material for this article can be found online at: https://www.frontiersin.org/articles/10.3389/fnut.2021.629815/full#supplementary-material
References
1. Han TS, Tajar A, Lean ME. Obesity and weight management in the elderly. Br Med Bull. (2011) 97:169–96. doi: 10.1093/bmb/ldr002
2. Stenholm S, Head J, Aalto V, Kivimaki M, Kawachi I, Zins M, et al. Body mass index as a predictor of healthy and disease-free life expectancy between ages 50 and 75: a multicohort study. Int J Obes. (2017) 41:769–75. doi: 10.1038/ijo.2017.29
3. Thompson D, Oster G, Brown JB, Nichols GA, Elmer PJ. Body mass index and future healthcare costs: A retrospective cohort study. Obes Res. (2001) 9:210–8. doi: 10.1038/oby.2001.23
4. Zamboni M, Mazzali G, Zoico E, Harris TB, Meigs JB, Di Francesco V, et al. Health consequences of obesity in the elderly: a review of four unresolved questions. Int J Obes Relat Metab Disord. (2005) 29:1011–29. doi: 10.1038/sj.ijo.0803005
5. Arterburn DE, Crane PK, Sullivan SD. The coming epidemic of obesity in elderly Americans. J Am Geriatr Soc. (2004) 52:1907–12. doi: 10.1111/j.1532-5415.2004.52517.x
6. Hill JO. Understanding and addressing the epidemic of obesity: an energy balance perspective. Endocr Rev. (2006) 27:750–61. doi: 10.1210/er.2006-0032
7. Prentice AM, Jebb SA. Fast foods, energy density and obesity: a possible mechanistic link. Obes Rev. (2003) 4:187–94. doi: 10.1046/j.1467-789X.2003.00117.x
8. Rangan AM, Schindeler S, Hector DJ, Gill TP, Webb KL. Consumption of /'extra/' foods by Australian adults: types, quantities and contribution to energy and nutrient intakes. Eur J Clin Nutr. (2008) 63:865–71. doi: 10.1038/ejcn.2008.51
9. Institute of Medicine. Dietary Reference Intakes for Energy, Carbohydrate, Fiber, Fat, Fatty Acids, Cholesterol, Protein, and Amino Acids. Washington, DC: National Academies Press (2005).
10. US Department of Health Human Services Food and Drug Administration. Food Labeling: Revision of the Nutrition and Supplement Facts Labels; Proposed Rule. (2014). Available online at: https://www.federalregister.gov/articles/2014/03/03/2014-04387/food-labeling-revision-of-the-nutrition-and-supplement-facts-labels
12. Reid M, Hammersley R, Duffy M. Effects of sucrose drinks on macronutrient intake, body weight, and mood state in overweight women over 4 weeks. Appetite. (2010) 55:130–6. doi: 10.1016/j.appet.2010.05.001
13. Reid M, Hammersley R, Hill AJ, Skidmore P. Long-term dietary compensation for added sugar: effects of supplementary sucrose drinks over a 4-week period. Br J Nutr. (2007) 97:193–203. doi: 10.1017/S0007114507252705
14. Stanhope KL, Schwarz JM, Keim NL, Griffen SC, Bremer AA, Graham JL, et al. Consuming fructose-sweetened, not glucose-sweetened, beverages increases visceral adiposity and lipids and decreases insulin sensitivity in overweight/obese humans. J Clin Invest. (2009) 119:1322–34. doi: 10.1172/JCI37385
15. Aeberli I, Gerber PA, Hochuli M, Kohler S, Haile SR, Gouni-Berthold I, et al. Low to moderate sugar-sweetened beverage consumption impairs glucose and lipid metabolism and promotes inflammation in healthy young men: a randomized controlled trial. Am J Clin Nutr. (2011) 94:479–85. doi: 10.3945/ajcn.111.013540
16. Hu FB, Malik VS. Sugar-sweetened beverages and risk of obesity and type 2 diabetes: epidemiologic evidence. Physiol Behav. (2010) 100:47–54. doi: 10.1016/j.physbeh.2010.01.036
17. Te Morenga L, Mallard S, Mann J. Dietary sugars and body weight: systematic review and meta-analyses of randomised controlled trials and cohort studies. BMJ. (2013) 346:e7492. doi: 10.1136/bmj.e7492
18. Ferreira-Pêgo C, Babio N, Bes-Rastrollo M, Corella D, Estruch R, Ros E, et al. Frequent consumption of sugar- and artificially sweetened beverages and natural and bottled fruit juices is associated with an increased risk of metabolic syndrome in a mediterranean population at high cardiovascular disease risk. J Nutr. (2016) 146:1528–36. doi: 10.3945/jn.116.230367
19. Wang J, Light K, Henderson M, O'Loughlin J, Mathieu M-E, Paradis G, et al. Consumption of added sugars from liquid but not solid sources predicts impaired glucose homeostasis and insulin resistance among youth at risk of obesity. J Nutr. (2014) 144:81–6. doi: 10.3945/jn.113.182519
20. Yamakawa M, Wada K, Koda S, Mizuta F, Uji T, Oba S, et al. High intake of free sugars, fructose, and sucrose is associated with weight gain in japanese men. J Nutr. (2019) 150:322–30. doi: 10.1093/jn/nxz227
21. Lee AK, Chowdhury R, Welsh JA. Sugars and adiposity: the long-term effects of consuming added and naturally occurring sugars in foods and in beverages. Obes Sci Pract. (2015) 1:41–9. doi: 10.1002/osp4.7
22. Schulze MB, Manson JE, Ludwig DS, Colditz GA, Stampfer MJ, Willett WC, et al. Sugar-sweetened beverages, weight gain, and incidence of type 2 diabetes in young and middle-aged women. JAMA. (2004) 292:927–34. doi: 10.1001/jama.292.8.927
23. Nissinen K, Mikkilä V, Männistö S, Lahti-Koski M, Räsänen L, Viikari J, et al. Sweets and sugar-sweetened soft drink intake in childhood in relation to adult BMI and overweight. The Cardiovascular Risk in Young Finns Study. Public Health Nutr. (2009) 12:2018–26. doi: 10.1017/S1368980009005849
24. Mozaffarian D, Hao T, Rimm EB, Willett WC, Hu FB. Changes in diet and lifestyle and long-term weight gain in women and men. N Engl J Med. (2011) 364:2392–404. doi: 10.1056/NEJMoa1014296
25. Hendriksen MA, Boer JM, Du H, Feskens EJ, van der A DL. No consistent association between consumption of energy-dense snack foods and annual weight and waist circumference changes in Dutch adults. Am J Clin Nutr. (2011) 94:19–25. doi: 10.3945/ajcn.111.014795
26. Flood VM, Smith W, Rochtchina E, Wang JJ, Mitchell P. Assembling a nutrient database for a large cohort study: the Blue Mountains Eye Study. Food Aust. (2008) 60:37–40. Available online at: https://ro.uow.edu.au/cgi/viewcontent.cgi?article=1355&context=hbspapers
27. Smith W, Mitchell P, Reay EM, Webb K, Harvey PWJ. Validity and reproducibility of a self-administered food frequency questionnaire in older people. Aust N Z J Public Health. (1998) 22:456–63. doi: 10.1111/j.1467-842X.1998.tb01414.x
28. Louie JCY, Moshtaghian H, Boylan S, Flood VM, Rangan AM, Barclay AW, et al. a systematic methodology to estimate added sugar content of foods. Eur J Clin Nutr. (2015) 69:154–61. doi: 10.1038/ejcn.2014.256
29. Flood VM, Burlutsky G, Webb KL, Wang JJ, Smith WT, Mitchell P. Food and nutrient consumption trends in older Australians: a 10-year cohort study. Eur J Clin Nutr. (2010) 64:603–13. doi: 10.1038/ejcn.2010.34
30. McLennan W, Podger A. National Nutrition Survey Nutrient Intakes and Physical Measurements. Canberra: Australian Bureau of Statistics (1998).
31. Moshtaghian H, Louie JCY, Charlton KE, Probst YC, Gopinath B, Mitchell P, et al. Trends in added sugar intake and food sources in a cohort of older Australians: 15 years of follow-up from the Blue Mountains Eye Study. J Hum Nutr Dietetics. (2017) 30:339–48. doi: 10.1111/jhn.12425
32. Clifton P, Chan L, Moss C, Miller M, Cobiac L. Beverage intake and obesity in Australian children. Nutr Metab. (2011) 8:87. doi: 10.1186/1743-7075-8-87
33. Brand-Miller JC, Barclay AW. Declining consumption of added sugars and sugar-sweetened beverages in Australia: a challenge for obesity prevention. Am J Clin Nutr. (2017) 105:854–63. doi: 10.3945/ajcn.116.145318
34. Younan C, Mitchell P, Cumming R, Rochtchina E, Panchapakesan J, Tumuluri K. Cardiovascular disease, vascular risk factors and the incidence of cataract and cataract surgery: the Blue Mountains Eye Study. Ophthalmic Epidemiol. (2003) 10:227. doi: 10.1076/opep.10.4.227.15905
35. Flood VM. Folate, Vitamine B12 and Homocysteine Status Among Older Australians, Dissertation, University of Sydney (2004).
36. Fernihough A, McGovern ME. Physical stature decline and the health status of the elderly population in England. Econ Hum Biol. (2015) 16:30–44. doi: 10.1016/j.ehb.2013.12.010
37. Chua B, Flood V, Rochtchina E, Wang JJ, Smith W, Mitchell P. Dietary fatty acids and the 5-year incidence of age-related maculopathy. Arch Ophthalmol. (2006) 124:981–6. doi: 10.1001/archopht.124.7.981
38. Townend BS, Townend ME, Flood V, Burlutsky G, Rochtchina E, Wang JJ, et al. Dietary macronutrient intake and five-year incident cataract: the Blue Mountains Eye Study. Am J Ophthalmol. (2007) 143:932–9.e1. doi: 10.1016/j.ajo.2007.03.006
39. Gopinath B, Liew G, Burlutsky G, Mitchell P. Physical activity and the 15-year incidence of age-related macular degeneration. Invest Ophthalmol Vis Sci. (2014) 55:7799–803. doi: 10.1167/iovs.14-15575
40. Craig CL, Marshall AL, Sjostrom M, Bauman AE, Booth ML, Ainsworth BE, et al. International physical activity questionnaire: 12-country reliability and validity. Med Sci Sports Exerc. (2003) 35:1381–95. doi: 10.1249/01.MSS.0000078924.61453.FB
41. Johnson RK, Appel LJ, Brands M, Howard BV, Lefevre M, Lustig RH, et al. Dietary sugars intake and cardiovascular health: a scientific statement From the American Heart Association. Circulation. (2009) 120:1011–20. doi: 10.1161/CIRCULATIONAHA.109.192627
42. Sahni S, Mangano KM, Hannan MT, Kiel DP, McLean RR. Higher protein intake is associated with higher lean mass and quadriceps muscle strength in adult men and women. J Nutr. (2015) 145:1569–75. doi: 10.3945/jn.114.204925
43. Santanasto AJ, Goodpaster BH, Kritchevsky SB, Miljkovic I, Satterfield S, Schwartz AV, et al. Body composition remodeling and mortality: the health aging and body composition study. J Gerontol Ser A Biol Sci Med Sci. (2017) 72:513–9. doi: 10.1093/gerona/glw163
44. Barrio-Lopez MT, Martinez-Gonzalez MA, Fernandez-Montero A, Beunza JJ, Zazpe I, Bes-Rastrollo M. Prospective study of changes in sugar-sweetened beverage consumption and the incidence of the metabolic syndrome and its components: the SUN cohort. Br J Nutr. (2013) 110:1722–31. doi: 10.1017/S0007114513000822
45. DiMeglio DP, Mattes RD. Liquid versus solid carbohydrate: effects on food intake and body weight. Int J Obes Relat Metab Disord. (2000) 24:794–800. doi: 10.1038/sj.ijo.0801229
46. Eweis DS, Abed F, Stiban J. Carbon dioxide in carbonated beverages induces ghrelin release and increased food consumption in male rats: implications on the onset of obesity. Obes Res Clin Pract. (2017) doi: 10.1016/j.orcp.2017.02.001
47. Palmer JR, Boggs DA, Krishnan S, Hu FB, Singer M, Rosenberg L. Sugar-sweetened beverages and incidence of type 2 diabetes mellitus in African American women. Arch Intern Med. (2008) 168:1487–92. doi: 10.1001/archinte.168.14.1487
48. Lei L, Rangan A, Flood VM, Louie JCY. Dietary intake and food sources of added sugar in the Australian population. Br J Nutr. (2016) 115:868–77. doi: 10.1017/S0007114515005255
Keywords: added sugar intake, added sugar food sources, body weight, Blue Mountains Eye Study, older adults, cohort study
Citation: Moshtaghian H, Charlton KE, Louie JCY, Probst YC, Mitchell P and Flood VM (2021) Changes in Added Sugar Intake and Body Weight in a Cohort of Older Australians: A Secondary Analysis of the Blue Mountains Eye Study. Front. Nutr. 8:629815. doi: 10.3389/fnut.2021.629815
Received: 16 November 2020; Accepted: 28 January 2021;
Published: 01 March 2021.
Edited by:
Anette E. Buyken, University of Paderborn, GermanyReviewed by:
Vegard Lysne, Haukeland University Hospital, NorwayAnestis Dougkas, Institut Paul Bocuse, France
Copyright © 2021 Moshtaghian, Charlton, Louie, Probst, Mitchell and Flood. This is an open-access article distributed under the terms of the Creative Commons Attribution License (CC BY). The use, distribution or reproduction in other forums is permitted, provided the original author(s) and the copyright owner(s) are credited and that the original publication in this journal is cited, in accordance with accepted academic practice. No use, distribution or reproduction is permitted which does not comply with these terms.
*Correspondence: Hanieh Moshtaghian, aG0zODlAdW93bWFpbC5lZHUuYXU=