Abstract
Introduction: Accumulating evidence had demonstrated that females had a higher risk of deep vein thrombosis (DVT) than males, but the mechanism was still unknown. Vitamin D was found to play an essential role in DVT, and gender may influence the serum vitamin D levels. This study aimed to explore whether vitamin D played a role in the gender difference in DVT.
Materials and Methods: A total of 444 patients with acute stroke were recruited, which were divided into the DVT group (n = 222) and the non-DVT group (n = 222). Serum vitamin D levels were measured after admission and were split into three categories, including deficiency (<50 nmol/L), insufficiency (52.5–72.5 nmol/L), and sufficiency (more than 75 nmol/L). Hierarchical regression analysis was adopted to analyze the relationship between gender and DVT, controlling the confounding factors.
Results: Females showed a higher proportion of DVT than males (60.7 vs. 42.5%, p < 0.001), and lower serum vitamin D levels than males (53.44 ± 16.45 vs. 69.43 ± 23.14, p < 0.001). Moreover, serum vitamin D levels were lower in the DVT group than in the non-DVT group (59.44 ± 19.61 vs. 66.24 ± 23.86, p < 0.001). Besides, the DVT group showed a lower proportion of vitamin D sufficiency than the non-DVT group (21.2 vs. 32.9%, p < 0.05). Hierarchical regression analysis showed that females had 2.083-fold (p < 0.001, unadjusted model) and 1.413-fold (p = 0.155, adjusted model) risk to develop DVT. In addition, the sufficiency status of vitamin D showed an independent protective effect on DVT (unadjusted model OR, 0.504, p = 0.004; adjusted model OR, 0.686, p = 0.011).
Conclusion: Females had a higher risk of DVT than males, and vitamin D may play an essential role in this relationship. Further studies are needed to explore whether vitamin D supplementation could reduce DVT risk in stroke patients, especially females.
Introduction
Venous thromboembolic disease (VTE), comprising deep vein thrombosis (DVT) and pulmonary embolism (PE) (1, 2), affects nearly 1 per 1,000 individuals annually (3, 4) and has become a significant issue that threatens public health in China (5). DVT was prevalent in stroke patients, occurring in nearly 80% of those who did not receive preventive treatments (6). Without any prevention, DVT would happen in 2 to 7 days after stroke onset (7, 8).
The risk of DVT has been found to vary by gender and age. Females under 50 years old had a decreased incidence, whereas over 65 years old had a higher incidence of DVT (4). Moreover, previous studies in stroke patients also found that females had a higher risk of DVT than males (9, 10). The mechanisms underlying the increased risk of DVT in females may be as follows: pregnancy (11), hormone replacement therapy (12), estrogen antagonist therapy (13) and the antiphospholipid antibody syndrome (14), hormone loss during menopause (15), oral contraceptives (OCPs) (16). However, most of these factors were not common among stroke patients in China due to the differences such as age, culture, race, and disease (17). Therefore, further studies were needed to identify why female stroke patients had a higher risk of DVT.
Vitamin D is a fat-soluble vitamin involved in calcium and phosphorus metabolism to maintain bone health (18). The deficiency of vitamin D is a worldwide health issue (19, 20). Low vitamin D levels may increase the risk of stroke (21) and lead to a worse prognosis of stroke patients (22). It was worth noting that vitamin D was also crucial in developing DVT in stroke patients, and a small sample study showed that vitamin D deficiency showed a 4.683-fold risk for DVT (23). While the sample size of this study was small (n = 180), larger sample size was needed further to identify the relationship between vitamin D and DVT. Besides, previous research had also shown that vitamin D deficiency was more common in elderly and middle-aged females (24, 25), which may be owing to the factors such as gender difference in dietary intakes (26), less sunlight exposure (27), and estrogen loss (28).
Considering the gender difference in DVT and vitamin D levels and the role of vitamin D in DVT, this study assumed that lower vitamin D levels might be why female stroke patients had a higher risk of DVT.
Materials and Methods
Study Design
This research was a cross-sectional design. Patients were screened from March 2015–May 2020 in the First Affiliated Hospital of Wenzhou Medical University. The following were the criteria for inclusion: (1) ages over 40; (2) within seven days of the stroke onset; (3) stroke (ischemic or intracranial hemorrhage) validated by computed tomography (CT) and magnetic resonance imaging (MRI). The following were the criteria for exclusion: (1) Patients with a history of DVT; (2) Patients taking vitamin D, calcium supplements; (3) Patients with active cancer or other serious medical diseases. (4) Patients taking estrogen, OCPs, estrogen antagonists, or anticoagulant therapy before admission. (5) pregnancy. (6) antiphospholipid antibody syndrome.
Ultimately, 222 patients with DVT were admitted, and 222 age-matched patients without DVT were also admitted. This study was agreed by the Medical Ethics Committee of First Affiliated Hospital of Wenzhou Medical University and abide by the Declaration of Helsinki's principles.
Data Collection
Data including demographic and clinical characteristics were collected. All blood samples were obtained between 6:00 and 8:00 a.m., after a night of fasting within 24 h of admission.
We selected serum 25-hydroxyvitamin D [25 (OH) D] as the indicator for vitamin D levels because it is the best indicator of its status (29). The fasting venous blood samples were obtained from patients within 24 h after admission and sent to the clinical laboratory within 4 h. The blood samples were centrifuged at 3,000 rpm for 10 min, and the supernatant was taken for further evaluation. The serum 25 (OH) D levels were measured by a competitive electrochemiluminescence protein binding assay (Cobas e602.Roche Diagnostics, Germany) in the lab of our hospital. The intraassay variation was between 7 and 10%, and the level over 75 nmol/l is considered vitamin D sufficiency in our hospital.
In the present study, vitamin D deficiency was specified as a 25 (OH) D of <20 ng/ml (50 nmol/L), insufficiency as 21–29 ng/ml (52.5–72.5 nmol/L), and sufficiency as more than 30 ng/ml (75 nmol/L) referred to the Endocrine Society's Practice Guidelines on vitamin D (30, 31).
Diagnostic Criteria for DVT
Patients were examined using color Doppler ultrasonography (HDI 5,000 system with a 3–7 MHz linear array transducer, Philips ATL, Bothell, WA, USA) within seven days after admission.
Statistical Analysis
Baseline demographic and clinical variables were compared between the groups. For a normal distribution test, the Kolmogorov-Smirnov test was used. The Mann-Whitney test was used for non-normally distributed variables, shown as the median (quartile). The normally distributed variables were represented by the mean and standard deviation (SD), analyzed by the student's t-test. Percentage and numbers were expressed for categorical variables and analyzed with chi-squared tests. The correlation analysis was conducted by the Pearson or Spearman rank analysis. Hierarchical regression analysis was further adopted to examine the relationship between gender and DVT, controlling the confounding factors. The confounding factors were categorized by accepted and validated classification criteria (such as WBC count, FIB, D-dimmer). Other variables such as PT, APTT were categorized according to the mean or median of the present values. SPSS 20.0 was used to conduct all analyses (IBM, SPSS, and Chicago, IL). Based on a two-sided test, p < 0.05 was regarded as statistically significant in all studies.
Results
Characteristics Between DVT and Non-DVT Groups
There was no statistical difference between the two groups regarding age, BMI, vital signs (except for body temperature), and stroke risk factors (all p > 0.05). In the DVT group, laboratory indicators including vitamin D levels, red blood cell (RBC), hemoglobin (HB), and Prothrombin Time (PT) were lower than the Non-DVT group (shown in Table 1, all p < 0.05). Padua score, the proportion of infection, fibrinogen (FIB), and D-dimmer levels were higher in the DVT group (shown in Table 1, all p < 0.05). Besides, RBC (r = 0.171, p < 0.001) and HB (r = 0.221, p < 0.001) were positively associated with vitamin D levels, other biochemistry markers such as WBC, PLT, PT, APTT, FIB, D-dimmer and EGFR were not related to vitamin D (all p > 0.05).
Table 1
| Characteristic | Total (N = 444) | Non-DVT group (N = 222) | DVT group (N = 222) | Statistic | P-value |
|---|---|---|---|---|---|
| Demographic characteristics | |||||
| Age (years), mean ± SD | 70.80 ± 9.54 | 70.46 ± 9.67 | 71.13 ± 9.42 | −0.736 | 0.462 |
| Females, n (%) | 183 (41.22) | 72 (32.43) | 111 (50.00) | 13.423 | <0.001*** |
| BMI (kg/m2), mean ± SD | 23.56 ± 2.53 | 23.49 ± 2.89 | 23.63 ± 2.12 | −0.578 | 0.564 |
| Vital signs | |||||
| Temperature (°C) | 37.05 ± 1.04 | 36.90 ± 1.36 | 37.20 ± 0.52 | −3.020 | 0.003* |
| Respiratory rate (breaths per min) | 20.00 (19.00, 20.00) | 20.00 (19.00, 20.00) | 20.00 (19.00, 20.00) | 2,4677.500 | 0.976 |
| Heart rate (beats per min) | 77.18 ± 14.73 | 76.26 ± 14.97 | 78.11 ± 14.46 | −1.326 | 0.186 |
| SBP (mmHg) | 156.10 ± 24.04 | 156.92 ± 23.01 | 155.28 ± 25.05 | 0.718 | 0.473 |
| DBP (mmHg) | 84.84 ± 14.00 | 85.68 ± 14.17 | 83.99 ± 13.81 | 1.275 | 0.203 |
| Risk factors for stroke, n(%) | |||||
| History of hypertension | 307 (69.14) | 152 (68.47) | 155 (69.82) | 0.042 | 0.837 |
| History of diabetes mellitus | 100 (22.52) | 47 (21.17) | 53 (23.87) | 0.323 | 0.570 |
| CAD | 44 (9.91) | 27 (12.16) | 17 (7.66) | 2.043 | 0.153 |
| Current smoking | 138 (31.08) | 74 (33.33) | 64 (28.83) | 0.852 | 0.356 |
| Current drinking | 121 (27.25) | 65 (29.28) | 56 (25.23) | 0.727 | 0.394 |
| Atrial fibrillation | 71 (15.99) | 37 (16.67) | 34 (15.32) | 0.067 | 0.796 |
| Laboratory results | |||||
| WBC (×109/L), mean ± SD | 7.88 ± 2.71 | 8.02 ± 2.86 | 7.74 ± 2.56 | 1.100 | 0.230 |
| RBC (×1012/L), mean ± SD | 4.37 ± 0.48 | 4.42 ± 0.49 | 4.33 ± 0.47 | 2.033 | 0.027* |
| HB (g/L), mean ± SD | 133.70 ± 15.14 | 135.94 ± 13.78 | 131.46 ± 16.11 | 3.150 | 0.002** |
| PLT (×109/L), mean ± SD | 218.04 ± 69.54 | 217.43 ± 69.17 | 218.65 ± 70.06 | −0.185 | 0.851 |
| PT(s), mean ± SD | 13.93 ± 1.43 | 14.06 ± 1.59 | 13.79 ± 1.23 | 2.006 | 0.046* |
| APTT(s), mean ± SD | 37.42 ± 4.73 | 37.67 ± 4.63 | 37.18 ± 4.83 | 1.099 | 0.273 |
| FIB(g/L), mean ± SD | 3.51 ± 1.17 | 3.33 ± 1.09 | 3.70 ± 1.22 | −3.335 | 0.001** |
| D-dimmer, median (IQR) | 1.72 (0.19–3.25) | 1.28 (0, 2.98) | 2.24 (0.54–3.94) | 19075 | 0.001** |
| EGFR (ml/ min/l.73m2), mean ± SD | 83.76 ± 16.90 | 83.76 ± 15.78 | 83.77 ± 17.98 | −0.099 | 0.921 |
| Vitamin D (nmol/L), mean ± SD | 62.84 ± 22.08 | 66.24 ± 23.86 | 59.44 ± 19.61 | 3.276 | 0.001** |
| Clinical characteristics | |||||
| Intracerebral hemorrhage (%) | 153 (34.46) | 80 (36.04) | 73 (32.88) | 0.359 | 0.485 |
| NIHSS score, median (IQR) | 5.00 (2.00, 10.00) | 5.00 (2.00, 10.00) | 6.00 (2.00, 10.00) | 23852.500 | 0.558 |
| Lower limb NIHSS score ≥ 2, median (%) | 211 (47.55) | 94 (42.30) | 117 (52.70) | 4.371 | 0.029* |
| NIHSS score at admission ≥ 11 | 92 (20.7) | 45 (20.30) | 47 (21.2) | 0.055 | 0.815 |
| Padua score, median (IQR) | 4.00 (4.00, 5.00) | 4.00 (3.25, 5.00) | 4.00 (4.00, 5.00) | 2,1498.000 | 0.015* |
| Infection (%) | 71 (16.00) | 45 (20.30) | 26 (11.70) | 6.052 | 0.014* |
Characteristics of all stroke patients.
DVT, deep vein thrombosis; BMI, body mass index; SBP, systolic pressure; DBP, diastolic pressure; CAD, Coronary Heart Disease; WBC, white blood cell count; RBC, red blood cell count; HB, hemoglobin value; PLT, platelet count; PT, Prothrombin Time; APTT, activated partial thromboplastin time; FIB, fibrinogen; EGFR, estimated glomerular filtration rate; NIHSS, National Institute of Health stroke scale; SD, standard deviation; IQR, interquartile.
p < 0.001,
p < 0.01,
p < 0.05.
Values were presented as the mean ± standard deviation (SD) or median (median± interquartile range, IQR) for continuous variables, and categorical variables were indicated as numbers (percentages). Student t-tests and Mann-Whitney U-tests were used according to data distribution. Chi-squared tests were used for categorical variables.
The DVT group showed a higher percentage of females than the non-DVT group [(50.00%) vs. (32.43%), p < 0.001] (shown in Table 1). Patients with vitamin D sufficiency in the DVT group were fewer than the non-DVT [(21.2%) vs. (32.9%), p < 0.05]. In contrast, the proportion of insufficiency [(45.5%) vs. (35.6%), p < 0.05] and deficiency [(33.3%) vs. (31.5%), p > 0.05] were higher in the DVT group (though deficiency group did not reach statistically significance) (shown in Table 4).
Correlation Between Vitamin D and Other Risk Factors
We analyzed the correlation between vitamin D and some thrombotic risk factors reported in stroke patients (17, 32). Vitamin D was not associated with age, BMI, Padua score, and D-dimmer (all p > 0.05). In contrast, there was a marginally significant association between vitamin D and National Institute of Health stroke scale (NIHSS) score at the admission (r = −0.095, p = 0.045) (Figure 1).
Figure 1
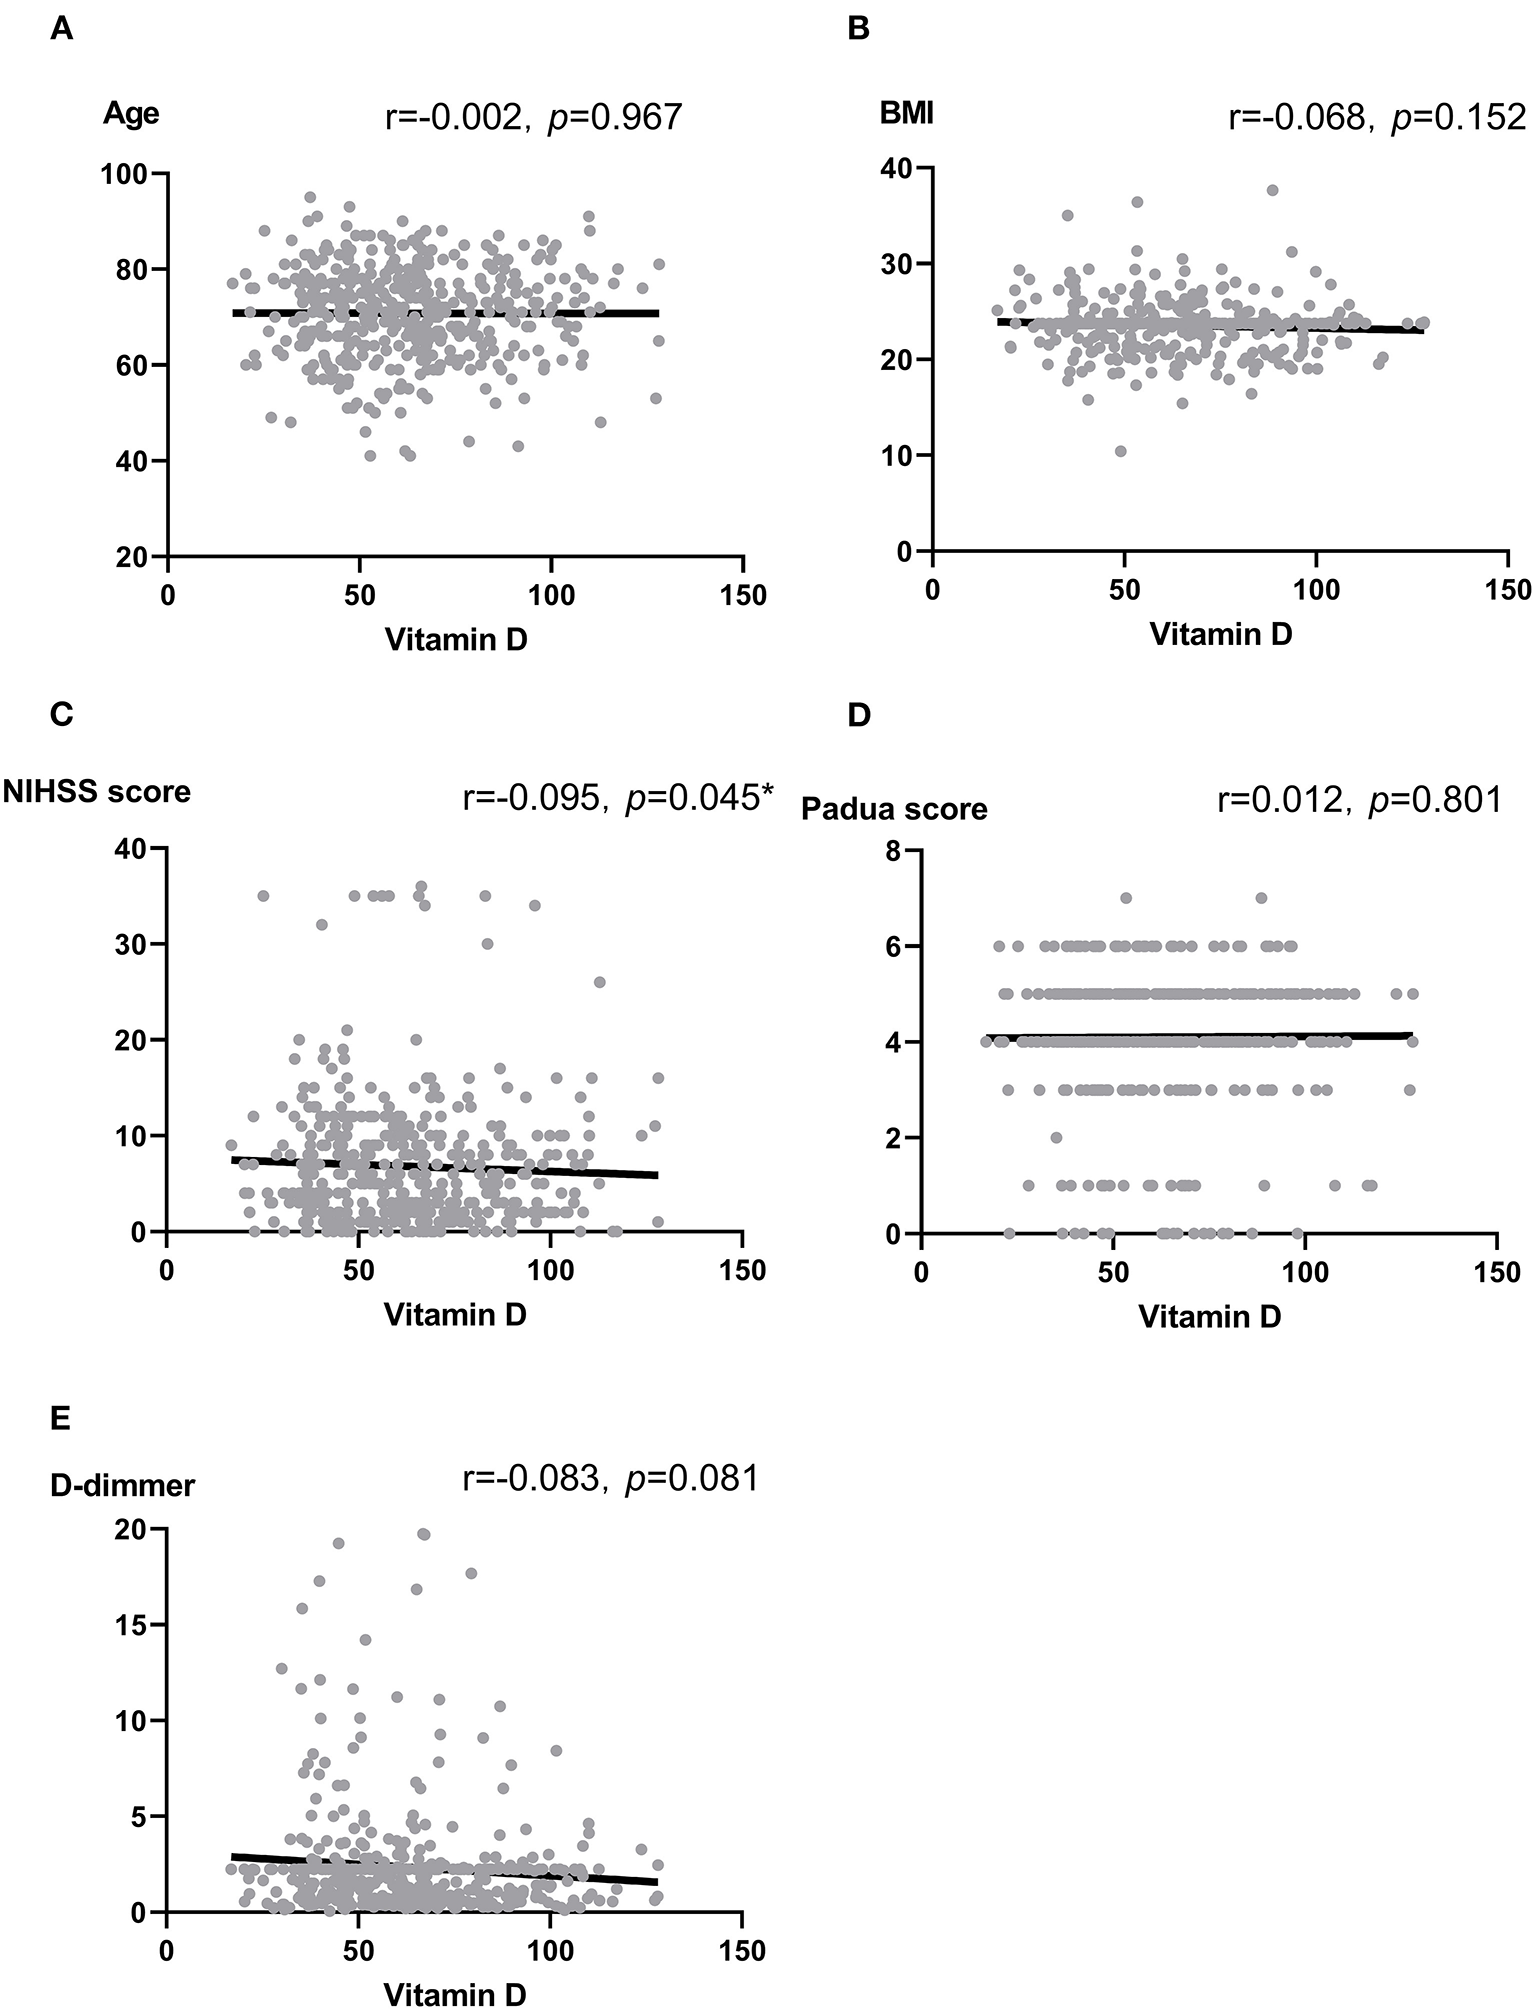
(A–E) Scatter plots: Association between vitamin D and Age (A), BMI (B), NIHSS score (C), Padua score (D) as well as D-dimmer (E). Note: r, correlation coefficient; BMI, body mass index; NIHSS, National Institute of Health stroke scale. Pearson correlation and Spearman analysis were used to evaluate the correlation according to the type of data. *p < 0.05.
Characteristics Between Male and Female
As was shown in Table 2, variables such as temperature and heart rate were higher in females (all p < 0.01). Moreover, blood biomarkers of the females, such as APTT levels, were lower while PLT and D-dimmer levels were higher than the males (all p < 0.05). The proportions of NIHSS score ≥11 and lower limb NIHSS score ≥2 were also higher among the females (p < 0.01) (Table 2). It was worth noting that females showed lower levels of vitamin D and a higher proportion of DVT than the males (all p < 0.001) (Table 2). Besides, females had a higher proportion of deficiency [(45.40%) vs. (23.40%), p < 0.05] and insufficiency of Vitamin D status [(45.40%) vs. (37.20%), p > 0.05] than males, and had a lower proportion of sufficiency [(9.30%) vs. (39.50), p < 0.05] (Figure 2; Table 2).
Table 2
| Characteristic | Total (N = 444) | Female group (N = 183) | Male group (N = 261) | Statistic | P-value |
|---|---|---|---|---|---|
| Demographic characteristics | |||||
| Age (years), mean ± SD | 70.80 ± 9.54 | 70.97 ± 8.93 | 70.67 ± 9.96 | 0.33 | 0.741 |
| BMI (kg/m2), mean ± SD | 23.56 ± 2.53 | 23.60 ± 2.48 | 23.53 ± 2.58 | 0.258 | 0.796 |
| Vital signs | |||||
| Temperature (°C) | 37.05 ± 1.04 | 37.20 ± 0.45 | 36.94 ± 1.29 | 2.956 | 0.003** |
| Respiratory rate (breaths per min) | 20.00 (19.00, 20.00) | 20.00 (19.00, 20.00) | 20.00 (19.00, 20.00) | 2,4715 | 0.471 |
| Heart rate (beats per min) | 77.18 ± 14.73 | 80.52 ± 15.43 | 74.84 ± 13.77 | 3.994 | <0.001*** |
| SBP (mmHg) | 156.10 ± 24.04 | 155.66 ± 24.99 | 156.41 ± 23.40 | −0.321 | 0.749 |
| DBP (mmHg) | 84.84 ± 14.00 | 83.97 ± 14.19 | 85.45 ± 13.86 | −1.093 | 0.275 |
| Risk factors for stroke, n(%) | |||||
| History of hypertension | 307 (69.14) | 129 (70.49) | 178 (68.20) | 0.168 | 0.681 |
| History of diabetes mellitus | 100 (22.52) | 43 (23.50) | 57 (21.84) | 0.088 | 0.767 |
| CAD | 44 (9.91) | 25 (13.66) | 19 (7.28) | 4.218 | 0.04 |
| Atrial fibrillation | 71 (15.99) | 36 (19.67) | 35 (13.41) | 2.691 | 0.101 |
| Laboratory results | |||||
| WBC (×109/L), mean ± SD | 7.88 ± 2.71 | 7.65 ± 2.61 | 8.04 ± 2.78 | −1.505 | 0.133 |
| PLT (×109/L), mean ± SD | 218.04 ± 69.54 | 232.11 ± 82.93 | 208.18 ± 56.47 | 3.391 | <0.001*** |
| PT(s), mean ± SD | 13.93 ± 1.43 | 13.86 ± 1.76 | 13.97 ± 1.13 | −0.746 | 0.456 |
| APTT(s), mean ± SD | 37.42 ± 4.73 | 36.51 ± 4.84 | 38.06 ± 4.55 | −3.404 | <0.001*** |
| FIB (g/L), mean ± SD | 3.51 ± 1.17 | 3.56 ± 1.04 | 3.48 ± 1.25 | 0.685 | 0.494 |
| D-dimmer (mg/L), median (IQR) | 1.72 (0.19,3.25) | 2.24 (0.46, 4.02) | 1.44 (0,3.06) | 20,809 | 0.02* |
| EGFR (ml/min/l.73m2), mean ± SD | 83.76 ± 16.90 | 84.95 ± 15.01 | 82.93 ± 18.08 | 1.279 | 0.202 |
| Vitamin D (nmol/L), mean ± SD | 62.84 ± 22.08 | 53.44 ± 16.45 | 69.43 ± 23.14 | −8.511 | <0.001*** |
| Vitamin D status | 54.049 | <0.001*** | |||
| Sufficiency, n (%) | 120 (27.00) | 17 (9.30) | 103 (39.50) | <0.05* | |
| Insufficiency, n (%) | 180 (40.50) | 83 (45.40) | 97 (37.20) | >0.05 | |
| Deficiency, n (%) | 144 (32.40) | 83 (45.40) | 61 (23.40) | <0.05* | |
| Clinical characteristics | |||||
| Intracerebral hemorrhage (%) | 153 (34.46) | 56 (30.60) | 97 (37.16) | 1.772 | 0.183 |
| NIHSS score, median (IQR) | 5.00 (2.00, 10.00) | 6.00 (2.00, 11.00) | 5.00 (2.00, 9.00) | 25,526 | 0.215 |
| Lower limb NIHSS score ≥ 2, median (%) | 211 (47.50) | 106 (40.60) | 105 (57.4) | 12.123 | <0.001*** |
| NIHSS score at admission ≥ 11 | 92 (20.7) | 49 (28.60) | 43 (16.50) | 6.949 | 0.008** |
| Padua score, median (IQR) | 4.00 (4.00, 5.00) | 4.00 (4.00, 5.00) | 4.00 (4.00, 5.00) | 25,804 | 0.129 |
| Infection (%) | 71 (16.00) | 32 (17.50) | 39 (14.90) | 0.518 | 0.472 |
| The proportion of IDDVT (%) | 222 (50.00) | 111 (60.70) | 111 (42.50) | 14.139 | <0.001*** |
Characteristics of the patients categorized by gender.
DVT, deep vein thrombosis; BMI, body mass index; CAD, Coronary Heart Disease; WBC, white blood cell count; RBC, red blood cell count; HB, hemoglobin value; PLT, platelet count; PT, Prothrombin Time; APTT, activated partial thromboplastin time; FIB, fibrinogen; EGFR, estimated glomerular filtration rate; NIHSS, National Institute of Health stroke scale; SD, standard deviation; IQR, interquartile.
p < 0.001,
p < 0.01,
p < 0.05.
Values were presented as the mean ± standard deviation (SD) or median (median± interquartile range, IQR) for continuous variables, and categorical variables were indicated as numbers (percentages). Student t-tests and Mann-Whitney U-tests were used according to data distribution. Chi-squared tests were used for categorical variables (Bonferroni correction was used if multiple comparisons).
Figure 2
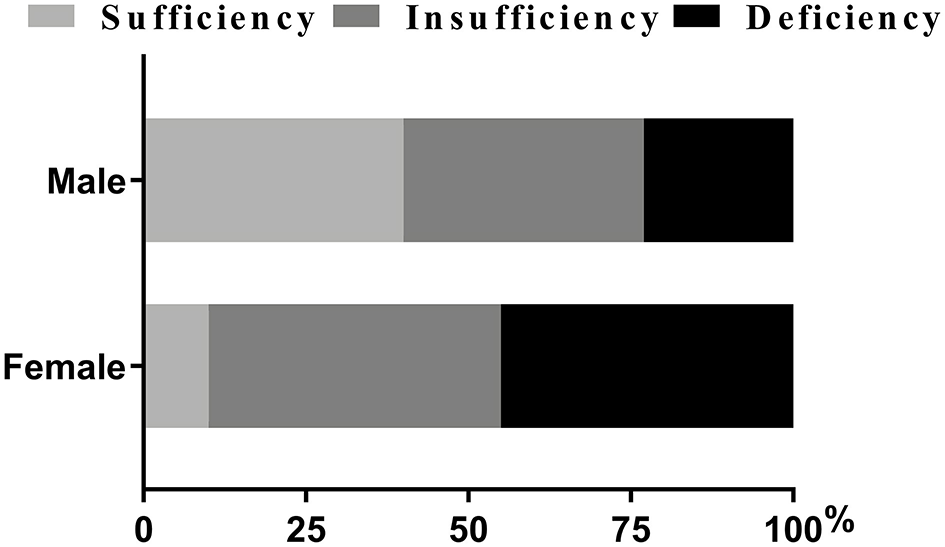
Percentage of patients with vitamin D status (%). Chi-squared tests and post hoc Bonferroni corrections for multiple comparisons were used for comparison between genders. Our data showed there were statistical differences in insufficiency and deficiency groups when categorized by genders.
Gender, Vitamin D and DVT
We used hierarchical regression analysis to examine the role of vitamin D in gender and DVT (Tables 3, 4). Firstly, univariate binary regression suggested that female gender, infection, lower limb NIHSS score, Padua score, HB, PT, FIB, D-dimmer, and vitamin D status was found to be correlated with the presence of DVT (all p < 0.05) (Table 4). Then, multivariate-adjusted regression was conducted. In Model 1–3 (Table 3), the association between gender and DVT remained significant after adjusting the confounding factors (all p < 0.05) (Table 3). However, when categorized vitamin D status was added in model 4, the association between gender and DVT became insignificant (p = 0.155). The established model was shown in Table 5. Moreover, we also examined the interaction effect of DVT and gender on vitamin D levels using Two-way ANOVA analysis. However, the interaction effect was insignificant (F = 1.430, p = 0.232).
Table 3
| OR (95%CI) | P-value | |
|---|---|---|
| Female | ||
| Unadjusted model | 2.083 (1.418–3.062) | <0.001*** |
| Model 1 | 2.069 (1.401–3.055) | <0.001*** |
| Model 2 | 2.055 (1.377–3.068) | <0.001** |
| Model 3 | 1.582 (1.010–2.479) | 0.045* |
| Model 4 | 1.413 (0.878–2.273) | 0.155 |
Binary logistic models to examine the effect of gender on DVT.
Take insufficiency of vitamin D group as the reference.
Model 1 included age ≥ 65 years, temperature ≥ 38°C, intracerebral hemorrhage, and infection.
Model 2 included model 1 and added NIHSS score at admission ≥ 11, Lower limb NIHSS score ≥ 2, BMI ≥ 25, and Padua score ≥ 4.
Model 3 included model 2 and added RBC (categorized), HB (categorized), PLT (categorized), PT (categorized), APTT (categorized), FIB (categorized) and D-dimmer (categorized).
Model 4 included model 3 and added vitamin D (categorized).
DVT, deep vein thrombosis; BMI, body mass index; CAD, Coronary Heart Disease; WBC, white blood cell count; RBC, red blood cell count; HB, hemoglobin value; PLT, platelet count; PT, Prothrombin Time; APTT, activated partial thromboplastin time; FIB, fibrinogen; EGFR, estimated glomerular filtration rate; NIHSS, National Institute of Health stroke scale; OR, odds ratios; CI, confidence intervals.
p < 0.001,
p < 0.01,
p < 0.05.
Table 4
| DVT patients | Non-DVT patients | Unadjusted model | Adjusted model 4 | |||
|---|---|---|---|---|---|---|
| (N = 222) | (N = 222) | OR (95% CI) | P | OR (95% CI) | P | |
| Age (years) | ||||||
| <65, n (%) | 54 (24.30) | 53 (23.90) | 1 (ref) | 1 (ref) | ||
| ≥65, n (%) | 168 (75.70) | 169 (76.10) | 0.976 (0.632–1.507) | 0.912 | 0.765(0.461–1.270) | 0.3 |
| Gender | ||||||
| Male, n (%) | 111 (50.00) | 150 (67.60)a | 1 (ref) | 1 (ref) | ||
| Female, n (%) | 111 (50.00) | 72 (32.43)a | 2.083 (1.418–3.062) | <0.001*** | 1.413 (0.878–2.273) | 0.155 |
| Body temperature (°C) | ||||||
| <38°C, n (%) | 209 (94.1) | 217 (97.7) | 1 (ref) | 1 (ref) | ||
| ≥38°C, n (%) | 13 (5.9) | 5 (2.3) | 2.700 (0.946–7.705) | 0.063 | 2.289 (0.723–7.252) | 0.159 |
| Stroke type | ||||||
| Ischemic stroke, n (%) | 149 (67.10) | 142 (64.00) | 1 (ref) | 1 (ref) | ||
| Intracerebral hemorrhage, n (%) | 73 (32.90) | 80 (36.00) | 0.870 (0.588–1.287) | 0.485 | 1.493 (0.805–2.768) | 0.203 |
| Infection | ||||||
| Yes, n (%) | 45 (20.30) | 26 (11.70)a | 1.917 (1.135–3.236) | 0.015* | 1.485 (0.807–2.736) | 0.204 |
| No, n (%) | 177 (79.70) | 196 (88.30)a | 1 (ref) | 1 (ref) | ||
| NIHSS score at admission | ||||||
| <11, n (%) | 175 (78.8) | 177 (79.70) | 1 (ref) | 1 (ref) | ||
| ≥11, n (%) | 47 (21.20) | 45 (20.30) | 1.056 (0.667–1.672) | 0.815 | 0.762 (0.433–1.343) | 0.347 |
| Lower limb NIHSS score | ||||||
| <2, n (%) | 105 (47.30) | 128 (57.70)a | 1 (ref) | 1 (ref) | ||
| ≥2, n (%) | 117 (57.70) | 94 (42.30)a | 1.517 (1.043–2.207) | 0.029* | 1.246 (0.782–1.984) | 0.355 |
| Padua score | ||||||
| <4, n (%) | 31 (14.00) | 56 (25.20)a | 1 (ref) | 1 (ref) | ||
| ≥4, n (%) | 191 (86.00) | 166 (74.80)a | 2.079 (1.279–3.378) | 0.003** | 2.704 (1.261–5.796) | 0.011* |
| RBC (×1012/L) | ||||||
| <4.375, n (%) | 124 (55.90) | 107 (48.20) | 1 (ref) | 1 (ref) | ||
| ≥4.375, n (%) | 98 (44.10) | 115 (51.80) | 0.735 (0.506–1.068) | 0.107 | 1.229 (0.686–2.202) | 0.488 |
| WBC (×109/L) | ||||||
| <10, n (%) | 190 (85.60) | 185 (83.30) | 1 (ref) | 1 (ref) | ||
| ≥10, n (%) | 32 (14.40) | 37 (16.70) | 0.842 (0.503–1.409) | 0.513 | 0.702 (0.385–1.281) | 0.249 |
| H.B. (g/L) | ||||||
| <135, n (%) | 103 (63.50) | 141 (46.50)a | 1 (ref) | 1 (ref) | ||
| ≥135, n (%) | 119 (53.60) | 81 (36.50)a | 0.497 (0.340–0.727) | <0.001*** | 0.598 (0.324–1.103) | 0.100 |
| PLT (×109/L) | ||||||
| <213, n (%) | 119 (53.60) | 124 (55.90) | 1 (ref) | 1 (ref) | ||
| ≥213, n (%) | 103 (46.40) | 98 (44.10) | 1.095 (0.75401.592) | 0.634 | 0.957 (0.628–1.458) | 0.837 |
| PT (s) | ||||||
| <13.750, n (%) | 124 (55.9) | 98 (44.1)a | 1 (ref) | 1 (ref) | ||
| ≥13.750, n (%) | 98 (44.1) | 124 (55.9)a | 0.657 (0.448–0.966) | 0.014* | 0.608 (0.389–0.951) | 0.029* |
| APTT(s) | ||||||
| <36.600, n (%) | 110 (49.5) | 106 (47.7) | 1 (ref) | 1 (ref) | ||
| ≥36.600, n (%) | 112 (50.5) | 116 (52.3) | 0.912 (0.625–1.329) | 0.631 | 0.926 (0.600–1.429) | 0.728 |
| FIB (g/L) | ||||||
| <4, n (%) | 143 (64.40) | 174 (78.40)a | 1 (ref) | 1 (ref) | ||
| ≥4, n (%) | 79 (35.6) | 48 (21.60)a | 0.001** | 1.670 (1.027–2.713) | 0.039* | |
| D–dimmer (mg/L) | ||||||
| <0.5, n (%) | 24 (10.80) | 51 (23.00)a | 1 (ref) | 1 (ref) | ||
| ≥ 0.5, n (%) | 198 (89.20) | 171 (77.00)a | 2.461 (1.453–4.166) | 0.001** | 2.241 (1.242–4.045) | 0.007** |
| Vitamin D status | 0.016* | 0.033* | ||||
| Sufficiency, n (%) | 47 (21.2) | 73 (32.9)a | 0.504 (0.315–0.806) | 0.004** | 0.507 (0.300–0.858) | 0.011* |
| Insufficiency, n (%) | 101 (45.5) | 79 (35.6)a | 1 (ref) | 1 (ref) | ||
| Deficiency, n (%) | 74 (33.3) | 70 (31.5) | 0.827 (0.533–1.284) | 0.397 | 0.686 (0.424–1.111) | 0.126 |
Stratified variables of stroke patients and binary logistic regression model testing predicting the value of variables with IDDVT.
indicates statistical difference between DVT and Non-DVT patients (Bonferroni correction was used if multiple comparisons).
DVT, deep vein thrombosis; WBC, white blood cell count; RBC, red blood cell count; HB, hemoglobin value; PLT, platelet count; PT, Prothrombin Time; APTT, activated partial thromboplastin time; FIB, fibrinogen; NIHSS, National Institute of Health stroke scale; OR, odds ratios; CI, confidence intervals.
p < 0.001,
p < 0.01,
p < 0.05.
Table 5
| Variables | β | OR (95% CI) | P-value |
|---|---|---|---|
| Padua score (≥4) | 1.001 | 2.704 (1.261–5.796) | 0.011* |
| PT (≥13.75 s) | −0.489 | 0.608 (0.389–0.951) | 0.029* |
| FIB (≥4 g/L) | 0.524 | 1.670 (1.027–2.713) | 0.039* |
| D-dimmer (≥0.5 mg/L) | 0.804 | 2.241 (1.242–4.045) | 0.007** |
| Vitamin D status | 0.033* | ||
| Sufficiency | −0.655 | 0.507 (0.300–0.858) | 0.011* |
| Insufficiency | Reference | 1 | Reference |
| Deficiency | −0.372 | 0.686 (0.424–1.111) | 0.126 |
Multivariate logistic model of DVT among stroke patients.
DVT, deep vein thrombosis; WBC, white blood cell count; RBC, red blood cell count; HB, hemoglobin value; PLT, platelet count; PT, Prothrombin Time; APTT, activated partial thromboplastin time; FIB, fibrinogen; NIHSS, National Institute of Health stroke scale; β, regression coefficient; OR, odds ratios; CI, confidence intervals.
p < 0.01,
p < 0.05.
Discussion
As far as we know, this was the first research to explore the three-way association among gender, vitamin D, and DVT. There were three main findings in this study. Firstly, females had lower vitamin D levels and a higher risk of DVT than males. Secondly, higher vitamin D levels were associated with a lower risk of DVT. Thirdly, vitamin D may act as a mediating role between gender and DVT.
Accumulating studies had found that elderly females had a higher risk of DVT than males (4), which was in line with our research. In general populations, risk factors such as pregnancy or estrogen antagonist therapy may account for the gender difference in DVT (14), but these factors were not common among elder stroke patients (17). The present study observed that vitamin D might play an essential role between gender and DVT.
Previous research has shown that vitamin D deficiency was more common in elderly, middle-aged, and perimenopausal females (24, 25, 33). According to a retrospective cohort study, as high as 43.9% of elderly females had vitamin D insufficiency (34). Decreased serum levels of vitamin D led to reduced calcium absorption and osteoporosis, which is prevalent among perimenopausal women (33). The previous study has reported the gender difference in dietary intakes of vitamin D. Women tended to intake less amount of vitamin D in wintertime and autumn in a nationwide nutritional survey (26). In an animal experiment, adult ovariectomized female rats had lower recovery levels of 1.25 (OH)2 D after 25 (OH) D administration than intact ovary rats, and beta-estradiol administration could restore this decline (28), indicating the critical role estrogen plays in vitamin D transformation. In China, females were more reluctant to be exposed to sunshine and participate in outdoor activities (35), which may be one of the primary causes of hypovitaminosis D. In addition, the gender difference in the amount of body fat may be another possible cause. A previous study demonstrated that vitamin D deficiency was associated with a higher percentage of fat mass in females (36). Given above, the following reasons may partially explain the high prevalence of vitamin D deficiency in elderly females: difference in dietary intake, estrogen deficiency, lower sunlight exposure, and the higher amount of fat in females.
This study also found that vitamin D played a protective role in DVT among stroke patients. The potential role of vitamin D in thrombolytic diseases has been reported formerly. The possible mechanism was that Vitamin D might exert an anti-inflammatory effect through IL-10 receptor expression induction and suppression of NF-κB activation (37, 38) and alleviate oxidative stress in endothelial cells (39) to reduce the chance of blood clots. Besides, it was also worth noting that vitamin D and its analogs may have antithrombotic properties (40, 41) and was reported to modulate coagulation pathways directly or indirectly (42). A pilot randomized clinical trial on DVT and PE patients with vitamin D deficiency found that warfarin's anticoagulation efficacy was enhanced after vitamin D supplement (43). Evidence from a cell study suggested that in monocytic cells, vitamin D inhibited coagulation by downregulating tissue factor (TF), upgrading thrombomodulin (TM), reducing the effects of tumor necrosis factor, and oxidized low-density lipoprotein to exert the antithrombotic activity (44). Other mechanisms of anticoagulation were as follows: modulation of plasminogen activator inhibitor-1 (PAI-1) and thrombospondin-1 expression in smooth cells (45), downregulation, and modulation of coagulation indicators (highly sensitivity c-reactive protein, tissue factor pathway inhibitor, and TNF-α) (46–48).
Hierarchical regression analysis to examine the role of vitamin D in gender and DVT indicated that females had a higher risk of DVT in the univariate model but tended to be more insignificant after multiple adjustments, especially when vitamin D was added. These results showed that vitamin D had a higher statistical power, which could also be interpreted that vitamin D might act as a mediating factor between DVT and the female gender. We speculated that elderly females had lower levels of vitamin D and thus were more likely to develop DVT after stroke. The underlying mechanism might be the decreased properties in anti-inflammation and anti-thromboembolism due to vitamin D insufficiency/deficiency.
Interestingly, our data did not show that vitamin D deficiency could promote DVT after stroke. Current research on the link between vitamin D and VTE has generated inconsistent results. Several studies found that there was no relationship between VTE and Vitamin D deficiency. One study examined the effect of categorized variables of vitamin D (<44 nmol/l or <30 nmol/l) and failed to show a significantly higher risk of VTE (49). Another prospective study over two decades of follow-up also concluded similar results (50). Whereas, other studies reported the lower levels of vitamin D were correlated with DVT or VTE (23, 51, 52), and a pooled HR estimate of 1.25 (95% CI 1.07–1.45) in a Meta-analysis was calculated (50). The inconsistency could be attributed to the difference in study design, race, sample size, latitude, season, criteria of vitamin D deficiency, and dietary habits. In this study, the undefined correlation between vitamin D deficiency and DVT might be due to the limited sample size and cross-sectional design. Further studies including a larger sample, prospective design, and more covariates (such as season) were needed to explore the relationship between vitamin D deficiency and DVT.
There were some limitations in this study. Firstly, as mentioned above, this cross-sectional study could not draw a causal relationship among gender, vitamin D, and DVT. Secondly, we did not record the fat mass and measured the estrogen levels, which may help us justify the relationship between vitamin D levels and elderly females. Thirdly, we only measured the vitamin D concentration once at admission, and we could not observe its fluctuations in stroke patients during hospitalization. Finally, we have not collected the dietary habits and duration of sunlight exposure of the patients daily, which may influence the vitamin D levels.
In conclusion, females had a higher risk of DVT than males among stroke patients, and vitamin D may play an essential role in this relationship. Further studies are needed to explore whether vitamin D supplementation could reduce DVT risk in stroke patients, especially females.
Publisher's Note
All claims expressed in this article are solely those of the authors and do not necessarily represent those of their affiliated organizations, or those of the publisher, the editors and the reviewers. Any product that may be evaluated in this article, or claim that may be made by its manufacturer, is not guaranteed or endorsed by the publisher.
Statements
Data availability statement
The raw data supporting the conclusions of this article will be made available by the authors, without undue reservation.
Ethics statement
The studies involving human participants were reviewed and approved by Medical Ethics Committee of First Affiliated Hospital of Wenzhou Medical University. Written informed consent for participation was not required for this study in accordance with the national legislation and the institutional requirements.
Author contributions
JT: conceptualization, methodology, and formal analysis. FL: data curation and writing—original draft preparation. YL: writing—reviewing and editing and supervision. All authors contributed to the article and approved the submitted version.
Acknowledgments
We felt grateful to all the stroke patients, radiologists, ultrasound doctors, laboratory physicians, nurses, and neurologists in this study, to make this work possible.
Conflict of interest
The authors declare that the research was conducted in the absence of any commercial or financial relationships that could be construed as a potential conflict of interest.
References
1.
PiazzaGGoldhaberSZ. Physician alerts to prevent venous thromboembolism. J Thromb Thrombol. (2010) 30:1–6. 10.1007/s11239-009-0404-5
2.
StevensSMDouketisJD. Deep vein thrombosis prophylaxis in hospitalized medical patients: current recommendations, general rates of implementation, and initiatives for improvement. Clin Chest Med. (2010) 31:675–89. 10.1016/j.ccm.2010.07.005
3.
HeitJASilversteinMDMohrDNPettersonTMLohseCMO'FalpageonWMet al. The epidemiology of venous thromboembolism in the community. Thromb Haemost. (2001) 86:452–63. 10.1055/s-0037-1616243
4.
SilversteinMDHeitJAMohrDNPettersonTMO'FallonWMMelton LJ3rd. Trends in the incidence of deep vein thrombosis and pulmonary embolism: a 25-year population-based study. Arch Intern Med. (1998) 158:585–93. 10.1001/archinte.158.6.585
5.
ZhangZLeiJShaoXDongFWangJWangDet al. Trends in hospitalization and in-hospital mortality from VTE, 2007 to 2016, in China. Chest. (2019) 155:342–53. 10.1016/j.chest.2018.10.040
6.
JohnstonKLiJLydenPHansonSFeasbyTAdamsRet al. Medical and neurological complications of ischemic stroke: experience from the RANTTAS trial. RANTTAS investigators. Stroke. (1998) 29:447–53. 10.1161/01.STR.29.2.447
7.
KellyJRuddALewisRCoshallCMoodyAHuntB. Venous thromboembolism after acute ischemic stroke: a prospective study using magnetic resonance direct thrombus imaging. Stroke. (2004) 35:2320–5. 10.1161/01.STR.0000140741.13279.4f
8.
BrandstaterMRothESiebensH. Venous thromboembolism in stroke: literature review and implications for clinical practice. Arch Phys Med Rehabil. (1992) 73:S379–91.
9.
HaSKimYHeoSChangDKimB. Prediction of deep vein thrombosis by ultrasonography and D-dimer in Asian patients with ischemic stroke. BMC Neurol. (2020) 20:257. 10.1186/s12883-020-01842-w
10.
ChengXZhangLXieNCMaYQLianYJ. High plasma levels of D-dimer are independently associated with a heightened risk of deep vein thrombosis in patients with intracerebral hemorrhage. Mol Neurobiol. (2016) 53:5671–8. 10.1007/s12035-015-9487-5
11.
AlsheefMAAlabbadAMAlbassamRAAlarfajRMZaidiARZAl-ArfajOet al. Pregnancy and venous thromboembolism: risk factors, trends, management, and mortality. Biomed Res Int. (2020) 2020:4071892. 10.1155/2020/4071892
12.
DouketisJDJulianJAKearonCAndersonDRCrowtherMABatesSMet al. Does the type of hormone replacement therapy influence the risk of deep vein thrombosis? A prospective case-control study. J Thromb Haemost. (2005) 3:943–8. 10.1111/j.1538-7836.2005.01268.x
13.
HernandezRKSørensenHTPedersenLJacobsenJLashTL. Tamoxifen treatment and risk of deep venous thrombosis and pulmonary embolism: a Danish population-based cohort study. Cancer. (2009) 115:4442–9. 10.1002/cncr.24508
14.
AndersonFSpencerF. Risk factors for venous thromboembolism. Circulation. (2003) 107:I9–16. 10.1161/01.CIR.0000078469.07362.E6
15.
BarcoSKlokFAMahéIMarchenaPJBallazARubioCMet al. Impact of sex, age, and risk factors for venous thromboembolism on the initial presentation of first isolated symptomatic acute deep vein thrombosis. Thromb Res. (2019) 173:166–71. 10.1016/j.thromres.2018.09.056
16.
SagarSStamatakisJDThomasDPKakkarVV. Oral contraceptives, antithrombin- III activity, and postoperative deep-vein thrombosis. Lancet. (1976) 1:509–11. 10.1016/S0140-6736(76)90296-8
17.
LiuLPZhengHGWangDZWangYLHussainMSunHXet al. Risk assessment of deep-vein thrombosis after acute stroke: a prospective study using clinical factors. CNS Neurosci Ther. (2014) 20:403–10. 10.1111/cns.12227
18.
DeLucaHF. Overview of general physiologic features and functions of vitamin D. Am J Clin Nutr. (2004) 80(Suppl. 6):1689s–96. 10.1093/ajcn/80.6.1689S
19.
FischerPThacherTPettiforJ. Pediatric vitamin D and calcium nutrition in developing countries. Rev Endoc Metab Dis. (2008) 9:181–92. 10.1007/s11154-008-9085-1
20.
JamesJStanleyBMichaelGRobertPHBruceWHAnneKet al. Recommendations abstracted from the American Geriatrics Society Consensus Statement on vitamin D for Prevention of Falls and Their Consequences. J Am Geriatr Soc. (2014) 62:147–52. 10.1111/jgs.12631
21.
WeiJZhuAJiJS. A comparison study of vitamin d deficiency among older adults in China and the United States. Sci Rep. (2019) 9:19713. 10.1038/s41598-019-56297-y
22.
DaubailBJacquinAGuillandJKhoumriCAboa-EbouléCGiroudMet al. Association between serum concentration of vitamin D and 1-year mortality in stroke patients. Cerebrov Dis. (2014) 37:364–7. 10.1159/000362534
23.
WuWXHeDR. Low vitamin d levels are associated with the development of deep venous thromboembolic events in patients with ischemic stroke. Clin Appl Thromb Hemost. (2018) 24(suppl. 9):69s–75. 10.1177/1076029618786574
24.
ZhenDLiuLGuanCZhaoNTangX. High prevalence of vitamin D deficiency among middle-aged and elderly individuals in northwestern China: its relationship to osteoporosis and lifestyle factors. Bone. (2015) 71:1–6. 10.1016/j.bone.2014.09.024
25.
YaoYFuSLiNHuFZhangHZhuQet al. Sex, residence and fish intake predict vitamin d status in Chinese centenarians. J Nutr Health Aging. (2019) 23:165–71. 10.1007/s12603-018-1126-1
26.
van der WielenRPLöwikMRvan den BergHde GrootLCHallerJMoreirasOet al. Serum vitamin D concentrations among elderly people in Europe. Lancet. (1995) 346:207–10. 10.1016/S0140-6736(95)91266-5
27.
BentliRTaskapanHToktaşHUlutasOOzkahramanAComertM. Significant independent predictors of vitamin d deficiency in inpatients and outpatients of a nephrology unit. Int J Endocrinol. (2013) 2013:237869. 10.1155/2013/237869
28.
AshSLGoldinBR. Effects of age and estrogen on renal vitamin D metabolism in the female rat. Am J Clin Nutr. (1988) 47:694–9. 10.1093/ajcn/47.4.694
29.
HolickM. Vitamin D status: measurement, interpretation, clinical application. Ann Epidemiol. (2009) 19:73–8. 10.1016/j.annepidem.2007.12.001
30.
HolickMF. The vitamin D deficiency pandemic: approaches for diagnosis, treatment and prevention. Rev Endocr Metab Disord. (2017) 18:153–65. 10.1007/s11154-017-9424-1
31.
HolickMFBinkleyNCBischoff-FerrariHAGordonCMHanleyDAHeaneyRPet al. Evaluation, treatment, and prevention of vitamin D deficiency: an Endocrine society clinical practice guideline. J Clin Endocrinol Metab. (2011) 96:1911–30. 10.1210/jc.2011-0385
32.
YiXLinJHanZZhouXWangXLinJ. The incidence of venous thromboembolism following stroke and its risk factors in eastern China. J Thromb Thrombol. (2012) 34:269–75. 10.1007/s11239-012-0720-z
33.
ZhouPHuJXiPZhangNYangBZhengJet al. Survey on the levels of 25-hydroxy vitamin D and bone metabolic markers and evaluation of their correlations with osteoporosis in perimenopausal woman in Xi'an region. PLoS ONE. (2017) 12:e0180366. 10.1371/journal.pone.0180366
34.
KamronrithisornTManonaiJVallibhakaraSSophonsritsukAVallibhakaraO. Effect of vitamin D supplement on vulvovaginal atrophy of the menopause. Nutrients. (2020) 12:1–11. 10.3390/nu12092876
35.
WangQZhuZLiuYTuXHeJ. Relationship between serum vitamin D levels and inflammatory markers in acute stroke patients. Brain Behav. (2018) 8:e00885. 10.1002/brb3.885
36.
MuscogiuriGBarreaLSommaCDLaudisioDSalzanoCPuglieseGet al. Sex differences of vitamin d status across bmi classes: an observational prospective cohort study. Nutrients. (2019) 11:1–12. 10.3390/nu11123034
37.
MichelGGailisAJarzebska-DeussenBMüschenAMirmohammadsadeghARuzickaT. 1,25-(OH)2-vitamin D3 and calcipotriol induce IL-10 receptor gene expression in human epidermal cells. Inflamm Res. (1997) 46:32–4. 10.1007/s000110050042
38.
SunJKongJDuanYSzetoFLiaoAMadaraJet al. Increased NF-kappaB activity in fibroblasts lacking the vitamin D receptor. Am J Physiol Endocrinol Metab. (2006) 291:E315–22. 10.1152/ajpendo.00590.2005
39.
MuscogiuriGAnnweilerCDuvalGKarrasSTirabassiGSalvioGet al. Vitamin D and cardiovascular disease: From atherosclerosis to myocardial infarction and stroke. Int J Cardiol. (2017) 230:577–84. 10.1016/j.ijcard.2016.12.053
40.
KoyamaTShibakuraMOhsawaMKamiyamaRHirosawaS. Anticoagulant effects of 1alpha,25-dihydroxyvitamin D3 on human myelogenous leukemia cells and monocytes. Blood. (1998) 92:160–7. 10.1182/blood.V92.1.160.413k16_160_167
41.
TargherGPichiriILippiG. Vitamin D, thrombosis, and hemostasis: more than skin deep. Semin Thromb Hemost. (2012) 38:114–24. 10.1055/s-0031-1300957
42.
SenguptaTMajumderRMajumderS. Role of vitamin D in treating COVID-19-associated coagulopathy: problems and perspectives. Mol Cell Biochem. (2021) 476:2421–27. 10.1007/s11010-021-04093-6
43.
HejaziMEModarresi-GhazaniFHamishehkarHMesgari-AbbasiMDoustiSEntezari-MalekiT. The effect of treatment of vitamin D deficiency on the level of P-selectin and hs-CRP in patients with thromboembolism: a pilot randomized clinical trial. J Clin Pharmacol. (2017) 57:40–7. 10.1002/jcph.774
44.
OhsawaMKoyamaTYamamotoKHirosawaSKameiSKamiyamaRet al. 1alpha,25-dihydroxyvitamin D(3) its potent synthetic analogs downregulate tissue factor upregulate thrombomodulin expression in monocytic cells. Circulation. (2000) 102:2867–72. 10.1161/01.CIR.102.23.2867
45.
Wu-WongJNakaneMMaJ. Vitamin D analogs modulate the expression of plasminogen activator inhibitor-1, thrombospondin-1 and thrombomodulin in human aortic smooth muscle cells. J Vasc Res. (2007) 44:11–8. 10.1159/000097812
46.
NgoDSverdlovAMcNeilJHorowitzJ. Does vitamin D modulate asymmetric dimethylarginine and C-reactive protein concentrations?Am J Med. (2010) 123:335–41. 10.1016/j.amjmed.2009.09.024
47.
ZittermannAFrischSBertholdHGöttingCKuhnJKleesiekKet al. Vitamin D supplementation enhances the beneficial effects of weight loss on cardiovascular disease risk markers. Am J Clin Nutr. (2009) 89:1321–7. 10.3945/ajcn.2008.27004
48.
TopalogluOArslanMKarakoseMUcanBGinisZCakirEet al. Is there any association between thrombosis and tissue factor pathway inhibitor levels in patients with vitamin D deficiency?Clin Appl Thromb Hemost. (2015) 21:428–33. 10.1177/1076029613509477
49.
BrodinELerstadGGrimnesGBrækkanSKVikABroxJet al. Serum levels of vitamin D are not associated with future risk of venous thromboembolism. The Tromsø Study. Thromb Haemost. (2013) 109:885–90. 10.1160/TH12-10-0728
50.
FolsomARRoetkerNSRosamondWDHeckbertSRBasuSCushmanMet al. Serum 25-hydroxyvitamin D and risk of venous thromboembolism: the atherosclerosis risk in communities (ARIC) study. J Thromb Haemost. (2014) 12:1455–60. 10.1111/jth.12665
51.
Brøndum-JacobsenPBennMTybjaerg-HansenANordestgaardBG. 25-Hydroxyvitamin D concentrations and risk of venous thromboembolism in the general population with 18,791 participants. J Thromb Haemost. (2013) 11:423–31. 10.1111/jth.12118
52.
WanJYuanJLiXBaoYHouYLiZet al. Association between serum vitamin D levels and venous thromboembolism (VTE): a systematic review and meta-analysis of observational studies. Complement Ther Med. (2020) 54:102579. 10.1016/j.ctim.2020.102579
Summary
Keywords
stroke, deep venous thrombosis, gender, vitamin D, seniors
Citation
Tao J, Lou F and Liu Y (2021) The Role of Vitamin D in the Relationship Between Gender and Deep Vein Thrombosis Among Stroke Patients. Front. Nutr. 8:755883. doi: 10.3389/fnut.2021.755883
Received
13 August 2021
Accepted
04 November 2021
Published
02 December 2021
Volume
8 - 2021
Edited by
Chafia Touil-Boukoffa, University of Science and Technology Houari Boumediene, Algeria
Reviewed by
Rachida Raache, University of Science and Technology Houari Boumediene, Algeria; Houda Belguendouz, University of Science and Technology Houari Boumediene, Algeria; Hanane Touil, Columbia University Irving Medical Center, United States
Updates
Copyright
© 2021 Tao, Lou and Liu.
This is an open-access article distributed under the terms of the Creative Commons Attribution License (CC BY). The use, distribution or reproduction in other forums is permitted, provided the original author(s) and the copyright owner(s) are credited and that the original publication in this journal is cited, in accordance with accepted academic practice. No use, distribution or reproduction is permitted which does not comply with these terms.
*Correspondence: Yuntao Liu 18267850815@163.com
†These authors have contributed equally to this work and share first authorship
This article was submitted to Nutritional Immunology, a section of the journal Frontiers in Nutrition
Disclaimer
All claims expressed in this article are solely those of the authors and do not necessarily represent those of their affiliated organizations, or those of the publisher, the editors and the reviewers. Any product that may be evaluated in this article or claim that may be made by its manufacturer is not guaranteed or endorsed by the publisher.