Abstract
Introduction:
Protein restriction during lactation can induce metabolic dysfunctions and has a huge impact on the offspring’s phenotype later in its life. We tested whether the effects of a maternal low-protein diet (LP) in rats can be transmitted to the F2 generation and increase their vulnerability to dietary insults in adulthood.
Methods:
Female Wistar rats (F0) were fed either a low-protein diet (LP; 4% protein) during the first 2 weeks of lactation or a normal-protein diet (NP; 23% protein). The female offspring (F1 generation) were maintained on a standard diet throughout the experiment. Once adulthood was reached, female F1 offspring from both groups (i.e., NP-F1 and LP-F1) were bred to proven males, outside the experiment, to produce the F2 generation. Male F2 offspring from both groups (NP-F2 and LP-F2 groups) received a standard diet until 60 days old, at which point they received either a normal fat (NF; 4.5% fat) or a high fat diet (HF; 35% fat) for 30 days.
Results:
At 90 days old, LPNF-F2 offspring had increased lipogenesis and fasting insulinemia compared to NPNF-F2, without alteration in insulin sensitivity. HF diet caused increased gluconeogenesis and displayed glucose intolerance in LPHF-F2 offspring compared to LPNF-F2 offspring. Additionally, the HF diet led to damage to lipid metabolism (such as steatosis grade 3), higher body weight, fat pad stores, and hepatic lipid content.
Discussion:
We concluded that an F0 maternal protein restricted diet during lactation can induce a transgenerational effect on glucose and liver metabolism in the F2 generation, making the offspring’s liver more vulnerable to nutritional injury later in life.
1. Introduction
A relationship between malnutrition and chronic diseases has been observed worldwide (1). Exponential evidence indicates that perinatal environmental factors, such as maternal malnutrition status, promote long-term effects on the metabolic phenotype of offspring (2, 3); this process is known as metabolic programming. Epidemiological and experimental studies suggest that early life nutritional programming is associated with a higher risk for the development of cardiometabolic syndrome (4–6); an impaired capacity to maintain energy balance is not only limited to exposed individuals but also subsequent generations, even though nutritional conditions are favorable (7).
According to the thrifty phenotype hypothesis, maternal malnutrition provokes metabolic adaptations in offspring that support further development and survival by altered intrauterine growth and an adjusted metabolic phenotype, with a reduced energy demand appropriate for poor nutritional conditions (8–11). However, even an adequate, or excessive postnatal food supply in later life may have negative consequences, mainly on glucose homeostasis (12) and hepatic lipid metabolism (13). This notion is supported by studies on perinatal nutrient restriction during critical periods of development.
Several reports have also focused on the effects of maternal malnutrition. For example, a low-protein diet suggests that the programmed metabolic dysregulation observed in different vulnerability windows may be associated with different biological mechanisms and have a great impact on the phenotype induced in the offspring (7, 14).
Lactation is a window of susceptibility due to the development and maturation of major organs and tissues, which determine the offspring’s metabolic phenotype (2, 15). Thus, exposure to undernutrition during this period can affect metabolism and pancreatic function. Our research group showed that a low-protein diet during lactation increased glycemia, even though offspring displayed higher peripheral insulin sensitivity and lower fasting insulinemia (15). Insulin is a major anabolic hormone involved in hepatic metabolism and dietary protein malnutrition can induce hepatic fat accumulation (16). Maternal low-protein diet effects have also been observed in several studies (17, 18) in the F2 (19, 20) and F3 generations (21, 22), contributing to the early life origin of the risk of chronic diseases.
While the investigation of the transgenerational effects of developmentally programmed traits is widening, very few studies have explored the potential for these traits to be transmitted with post-weaning diets other than adequate controls. In the present study, we assessed the transgenerational transmission of programmed phenotype outcomes on glucose homeostasis and lipidic hepatic metabolism through the maternal lineage and offspring vulnerability to a food insult later in life with a high-fat diet.
2. Materials and methods
2.1. Ethical approval
All experiments were conducted according to ARRIVE guidelines (23) and Brazilian Association for Animal Experimentation (COBEA) standards. The protocols were approved by the Ethics Committee in Animal Research of the State University of Maringá (n. 5409020520) and performed in the sectional animal facility of the Secretion Cell Biology Laboratory.
2.2. Dams
2.2.1. Experimental design and diets
After 1 week of acclimatization, female and male Wistar rats (70 and 80 days old, respectively) were mated at a ratio of three females to one male. The pregnant females were transferred to individual cages and fed a standard diet. Pregnant F0 females were used to compose the F1 group (Figure 1). At birth, the litter was standardized to eight pups per dam, with a 1:1 sex ratio, and F0 dams were fed either a normal-protein diet (NP; 23% protein; Nuvital; Curitiba/PR, Brazil; n = 12) or a low-protein diet (24) (LP; 4% protein; n = 12) during the first 14 days of lactation. At postnatal day 21, the F1 female offspring were weaned, housed in groups of four per cage, and fed a standard diet. The F1 male offspring were not evaluated in the present study.
FIGURE 1
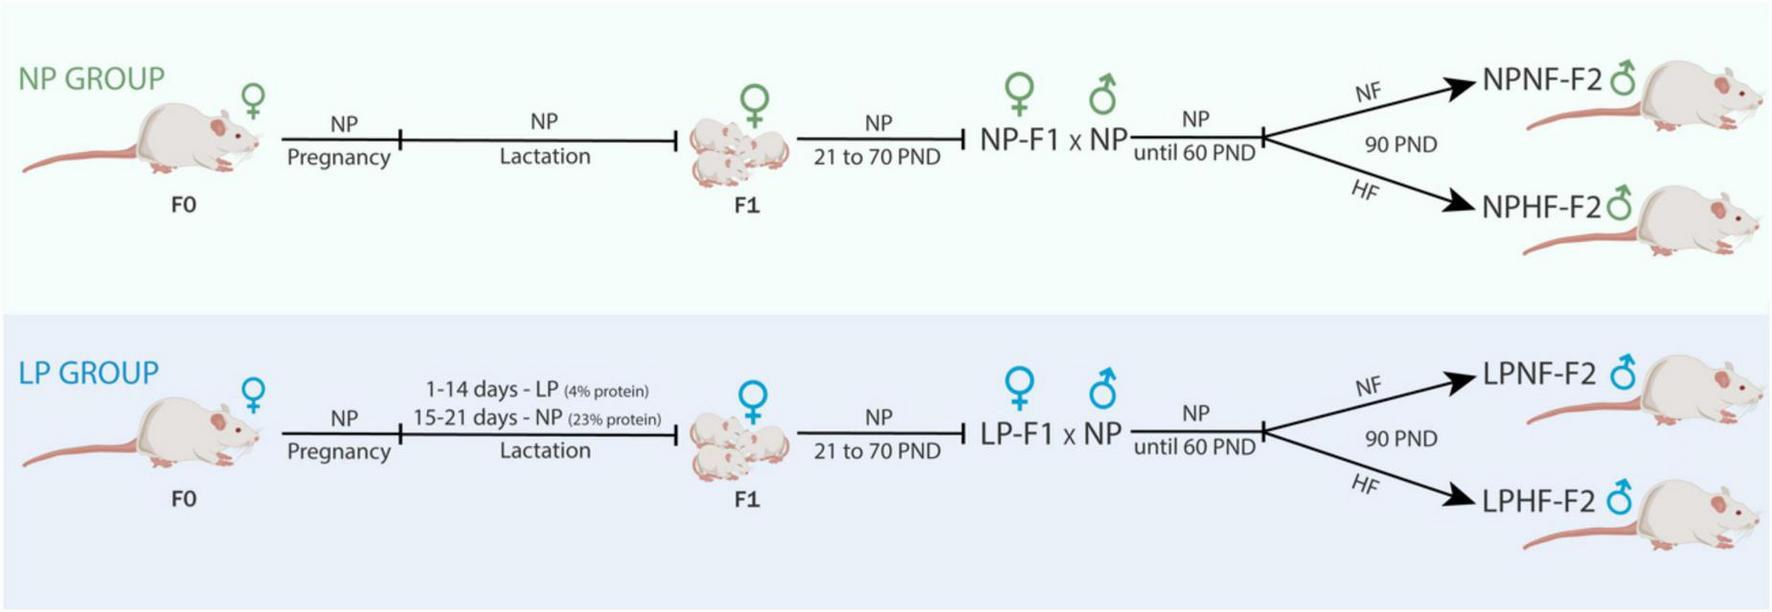
Experimental design. NP, normal-protein diet; LP, low-protein diet; NF, normal-fat diet; HF, high-fat diet; PND, post-natal day.
F1 female offspring (n = 1 per litter) were kept until 70 days old and mated to proven male rats outside the experiment to compose the NP-F2 and LP-F2 groups. F1 females were fed a standard diet throughout the experimental period. After birth, the litter was standardized to eight pups per dam, in a 1:1 sex ratio. After weaning, only male offspring (NP-F2 and LP-F2) were used in the experiments to avoid estrogen influences.
The experimental procedures were conducted at 90 days old. Throughout the experimental period, the animals were kept under controlled temperature (23 C ± 2°C) and photoperiod (7:00 a.m. to 7:00 p.m., daylight cycle) conditions. Animals received water and food ad libitum.
2.2.2. Fasting glycemia and oral glucose tolerance test during pregnancy
Glucose concentration was measured via the glucose oxidase method using a commercial kit (GoldAnalisa; Belo Horizonte, MG, Brazil) (25). On the 18th day of pregnancy (26), after a 6 h fast, blood samples were collected before gavage administration of glucose (1 g/kg of body weight, 0 min, n = 6−7) and 15, 30, 45, and 60 min afterward. Glucose response during the test was calculated using the area under the curve (AUC).
2.2.3. Intraperitoneal insulin tolerance test
On the 20th day of pregnancy, an ipITT was performed after a 6 h fast (n = 6−7). Dams received an injection of insulin (1 U/kg of body weight) and blood samples were collected as previously reported (27). Subsequently, the rate of glucose tissue uptake or rate constant for plasma glucose disappearance (Kitt) was calculated (28).
2.2.4. Biometric parameters and caloric intake during lactation
Body weight (BW) and food intake were measured daily during the suckling phase. Food intake (FI) was calculated as the difference between the amount of remaining diet (Df) and the amount presented previously (Di): [FI (g) = (Df – Di)]. Even though the energy values of the diets were the same, food intake was presented in calories (kcal/100 g of body weight). The AUC for food intake and feeding efficiency [food consumption (g)/body weight (g)] was calculated.
2.3. Offspring
2.3.1. Experimental design and diet
At 60 days old, a subset of male offspring from the NP-F2 and LP-F2 groups were fed a normal-fat diet (NF; 7% fat; Nuvital; Curitiba/PR, Brazil) or a high-fat diet (HF; 35% fat) (26) until they were 90 days old. The four experimental groups used were as follows: NPNF-F2, control offspring that were fed an NF diet; LPNF-F2, low-protein offspring that were fed an NF diet; NPHF-F2, control offspring that were fed an HF diet, and LPHF-F2, low-protein offspring that were fed an HF diet (n = 8 litter per group).
2.3.2. Body weight gain, caloric intake, feed efficiency, liver weight, and fat pad store measurements
Body weight (BW) and food intake were determined daily from birth to weaning. They were then examined weekly until they reached 90 days old. Food intake was calculated weekly. Considering that the energetic values of the diets were different, food intake was presented in calories. The AUC for food intake and feeding efficiency were calculated. At 90 days old, the rats were anesthetized with thiopental (45 mg/kg of body weight), weighed, decapitated, and laparotomized to remove their liver and retroperitoneal, perigonadal, and mesenteric fat pad stores. The weights of the fat pads and liver were expressed in relation to the BW of each animal (g/100 g of BW).
2.3.3. Intravenous glucose tolerance test
At 90 days old, a batch of animals (n = 10−12 rats from 3 to 4 litters per group) was subjected to a surgical procedure to perform ivGTT, as previously described (24). After a 12 h fast, blood samples were collected before the injection of glucose (1 g/kg of body weight, 0 min) and 5, 15, 30, and 45 min afterward. Glucose response during the test was calculated using the AUC.
2.3.4. Intraperitoneal insulin tolerance test
Another batch of animals (n = 10−12 rats from 3 to 4 litters per group) was cannulated, and ipITT was performed after a 6 h fast. They received an injection of insulin (1 U/kg of body weight), and blood samples were collected, as previously reported (29). Subsequently, the rate of glucose tissue uptake or the rate constant for plasma glucose disappearance (Kitt) was calculated (28).
2.3.5. Blood glucose levels and lipid profile
Glucose concentration was measured by the glucose oxidase method using a commercial kit (GoldAnalisa; Belo Horizonte, MG, Brazil) (25). Triglycerides (TG), total cholesterol, and high-density lipoprotein cholesterol (HDL-C) levels were measured in plasma samples using a colorimetric method and commercial kits (GoldAnalisa; Belo Horizonte, MG, Brazil). Low-density lipoprotein cholesterol (LDL-C) and very-low-density LDL cholesterol (VLDL-C) values were calculated using the Friedewald formula (30).
2.3.6. Hepatic levels of cholesterol and triglycerides
Left-lobe hepatic samples of approximately 100 mg were removed (n = 5−10 rats from 5 to 10 litters per group) to determine total lipids using the Folch method (31). The extract was evaporated and then diluted in isopropanol. Cholesterol and TG contents were measured using a commercial kit, in accordance with the manufacturer’s instructions (GoldAnalisa; Belo Horizonte, MG, Brazil).
2.3.7. Pancreas, liver, and retroperitoneal fat histology
Pancreas, liver, and retroperitoneal fat samples (n = 5−6 rats from 5 to 6 litters per group) were removed and fixed in 4% paraformaldehyde for 24 h. Subsequently, the samples were dehydrated in an alcohol-increasing series of concentrations. After diaphanization in xylene, the samples were embedded in histological paraffin. Slices of 5-μm thickness were prepared for staining with hematoxylin and eosin (H&E). In the pancreas and fat slices, islets (40 per animal, 40 × magnification) and retroperitoneal fat (20 per animal, 20 × magnification) photomicrographs were randomly acquired using an Olympus DP71 camera coupled to an Olympus BX40 epifluorescence microscope (Olympus, Tokyo, Japan). ImageJ for Windows (Open Source) was used for analysis. Liver slices (30 fields per animal, 20 × magnification) were examined under a light microscope. These values were classified as previously described for the magnitude of steatosis (32). Thus, steatosis was graded as follows: 0 (none to 5% of hepatocytes affected), 1 (>5%−33% affected), 2 (>33%−66% affected), and 3 (>66% affected). The predominant distribution pattern of steatosis was graded as follows: 0 (zone 3), 1 (zone 1), 2 (azonal), or 3 (panacinar).
2.3.8. RNA isolation and real-time quantitative RT-qPCR
Liver samples were collected and stored in liquid nitrogen at −80°C pending total RNA extraction. RNA was isolated from 100 mg frozen tissue using TrizolTM reagent (Thermo Fisher Scientific, Waltham, MA, United States). The RNA concentration was measured using a spectrophotometer at a wavelength of 260 nm (NanoDrop ND 1000 NanoDrop Technologies, Wilmington, DE, United States). cDNA was synthesized using Platus Transcriber RNaseH cDNA First Strand kit (Sinapse Inc., BR), and quantitation of the tissue expression of selected genes was done by quantitative PCR in the Rotor-Gene® Q (Qiagen) with “HOT FirePol® EvaGreen® qPCR Supermix” (Solis BioDyne, EE). The glyceraldehyde 3 phosphate dehydrogenase (GADPH) gene was utilized as a reference gene. The 2–ΔCT method (33) was used for the relative quantification analysis, and data were expressed as an arbitrary unit (AU). Primers for phosphoenolpyruvate carboxykinase (PEPCK) and fatty acid synthase (FASN) are listed in the Supplementary material.
2.4. Statistical analysis
The results were normalized and presented as the mean ± standard error (S.E.M.). Statistical analysis was performed using Student’s t-test or two-way analysis of variance, followed by Tukey’s post hoc test. p < 0.05 was considered statistically significant for the effects of low-protein diet-fed dams (LP), a high-fat diet-fed offspring (HF), or interaction (I) of factors. Analyses were conducted using GraphPad Prism version 6.01 for iOS (GraphPad Software, Inc., San Diego, CA, United States).
3. Results
3.1. Dams
3.1.1. Body weight, food intake, and glucose homeostasis during pregnancy
During the oGTT, as observed by the AUC, LP-F1 dams showed mild glucose intolerance (Figure 2D; +10.21%; p < 0.05) and fasting hyperglycemia (Figure 2F; +17.02%; p < 0.01), without differences in insulin sensitivity, as demonstrated by Kitt (Figure 2E).
FIGURE 2
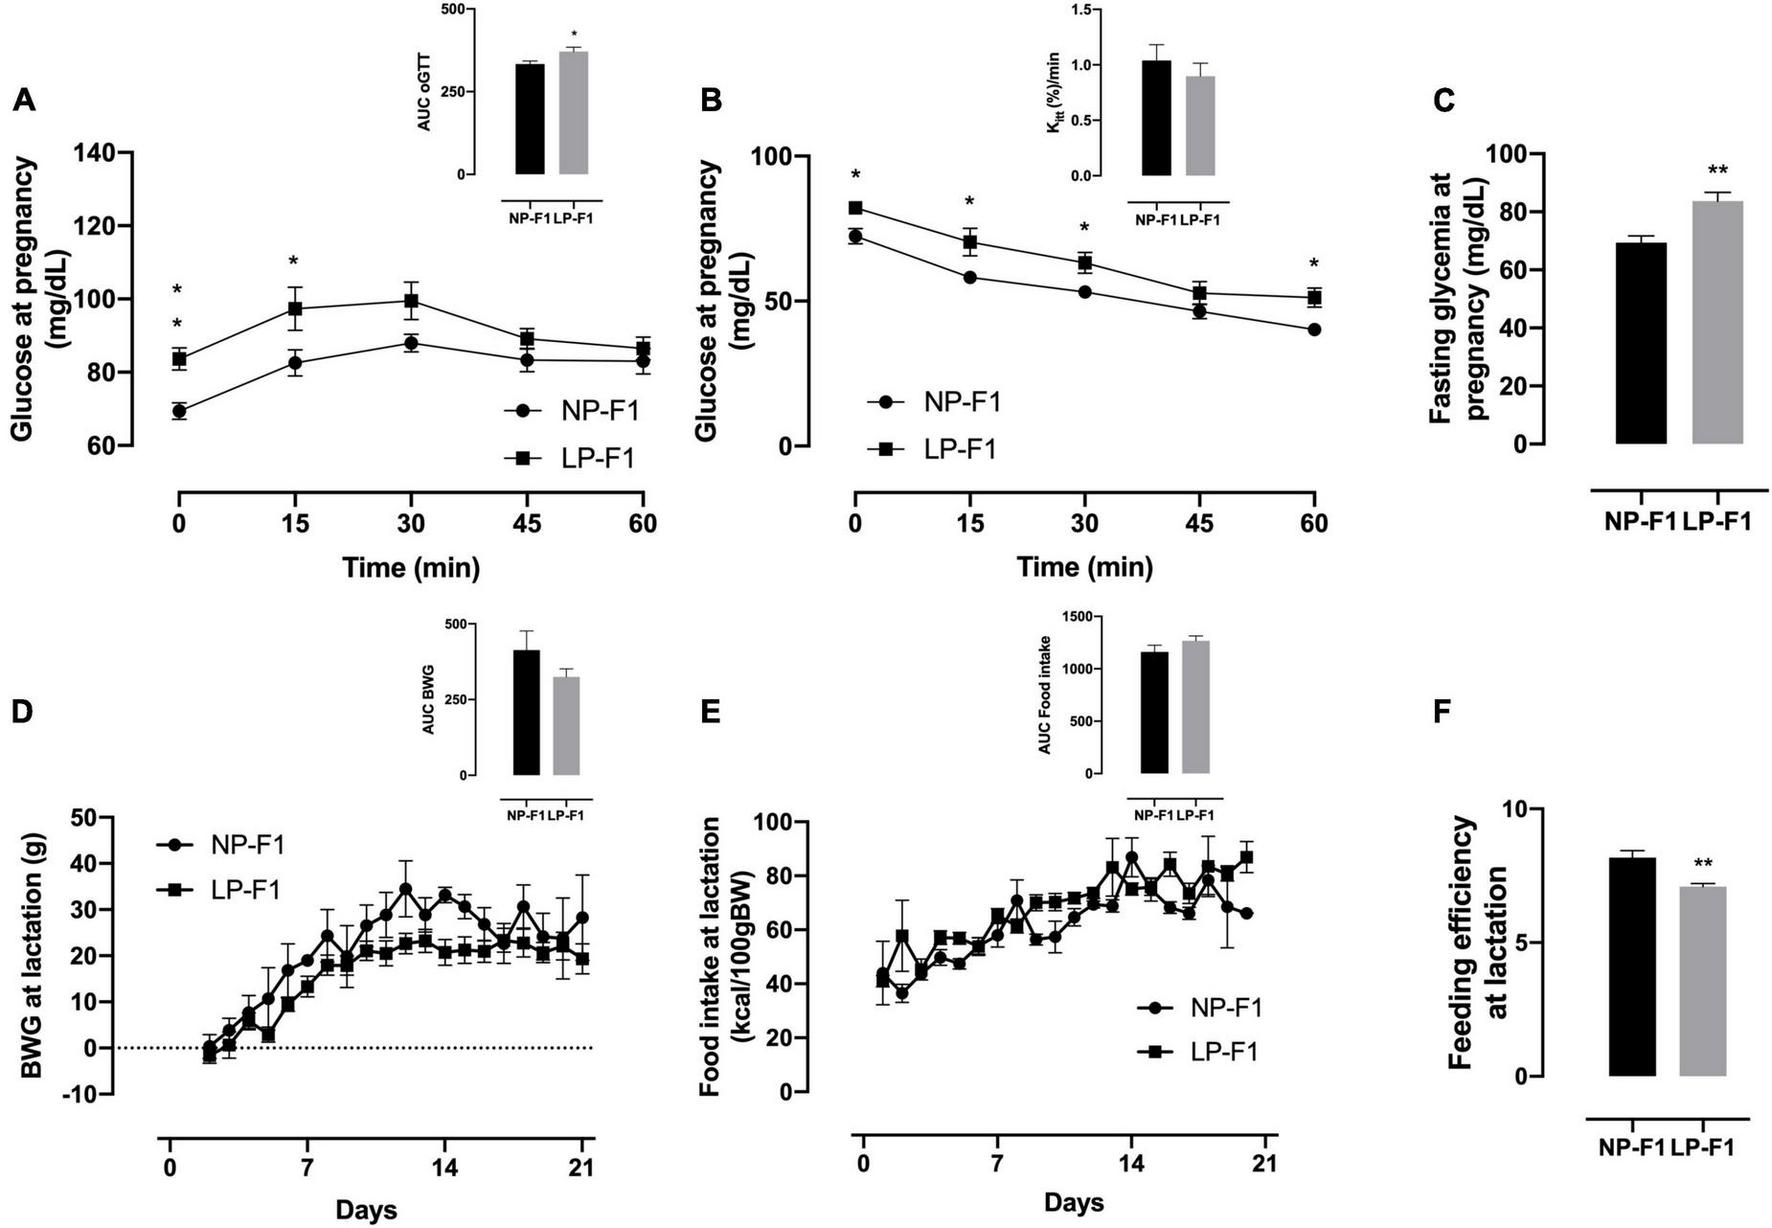
Dams’ biometric parameters and glucose homeostasis analysis. Plasma glucose during oral glucose tolerance test (A), insulin tolerance test and Kitt(B), and fasting glycemia (C), during pregnancy; body weight gain (D), food intake (E), and feeding efficiency (F) during lactation. The data are expressed as the means ± S.E.M. and were obtained from 6 to 12 dams (from 6 to 12 different litter). The inset represents the AUC. *p < 0.05, **p < 0.01 for Student’s t-test. NP-F1, female rats of dams fed a normal-protein diet during lactation; LP-F1, female rats of dams fed a low-protein diet during lactation.
As shown in Figure 2, protein restriction during lactation did not modify BW gain or food intake in dams (Figures 2A, B). However, LP-F1 dams showed a 13.24% decrease in feed efficiency (Figure 2C) during lactation (p < 0.01).
3.2. Offspring
3.2.1. Biometric parameters and food intake
Protein restriction caused pup weight at birth to be lower by 23.7% in LP-F2 offspring (Figure 3A; P < 0.0001) compared to the NP-F2 offspring. Metabolic programming showed no change in BW gain between offspring groups during the suckling phase (Figure 3B) or until postnatal day 60 (PND) (Figure 3C). However, LP-F2 offspring had increased food intake (Figure 3E; +24.5%; p < 0.05) and feed efficiency (Figure 3D; +14.54%; p < 0.0001) when compared with the control offspring.
FIGURE 3
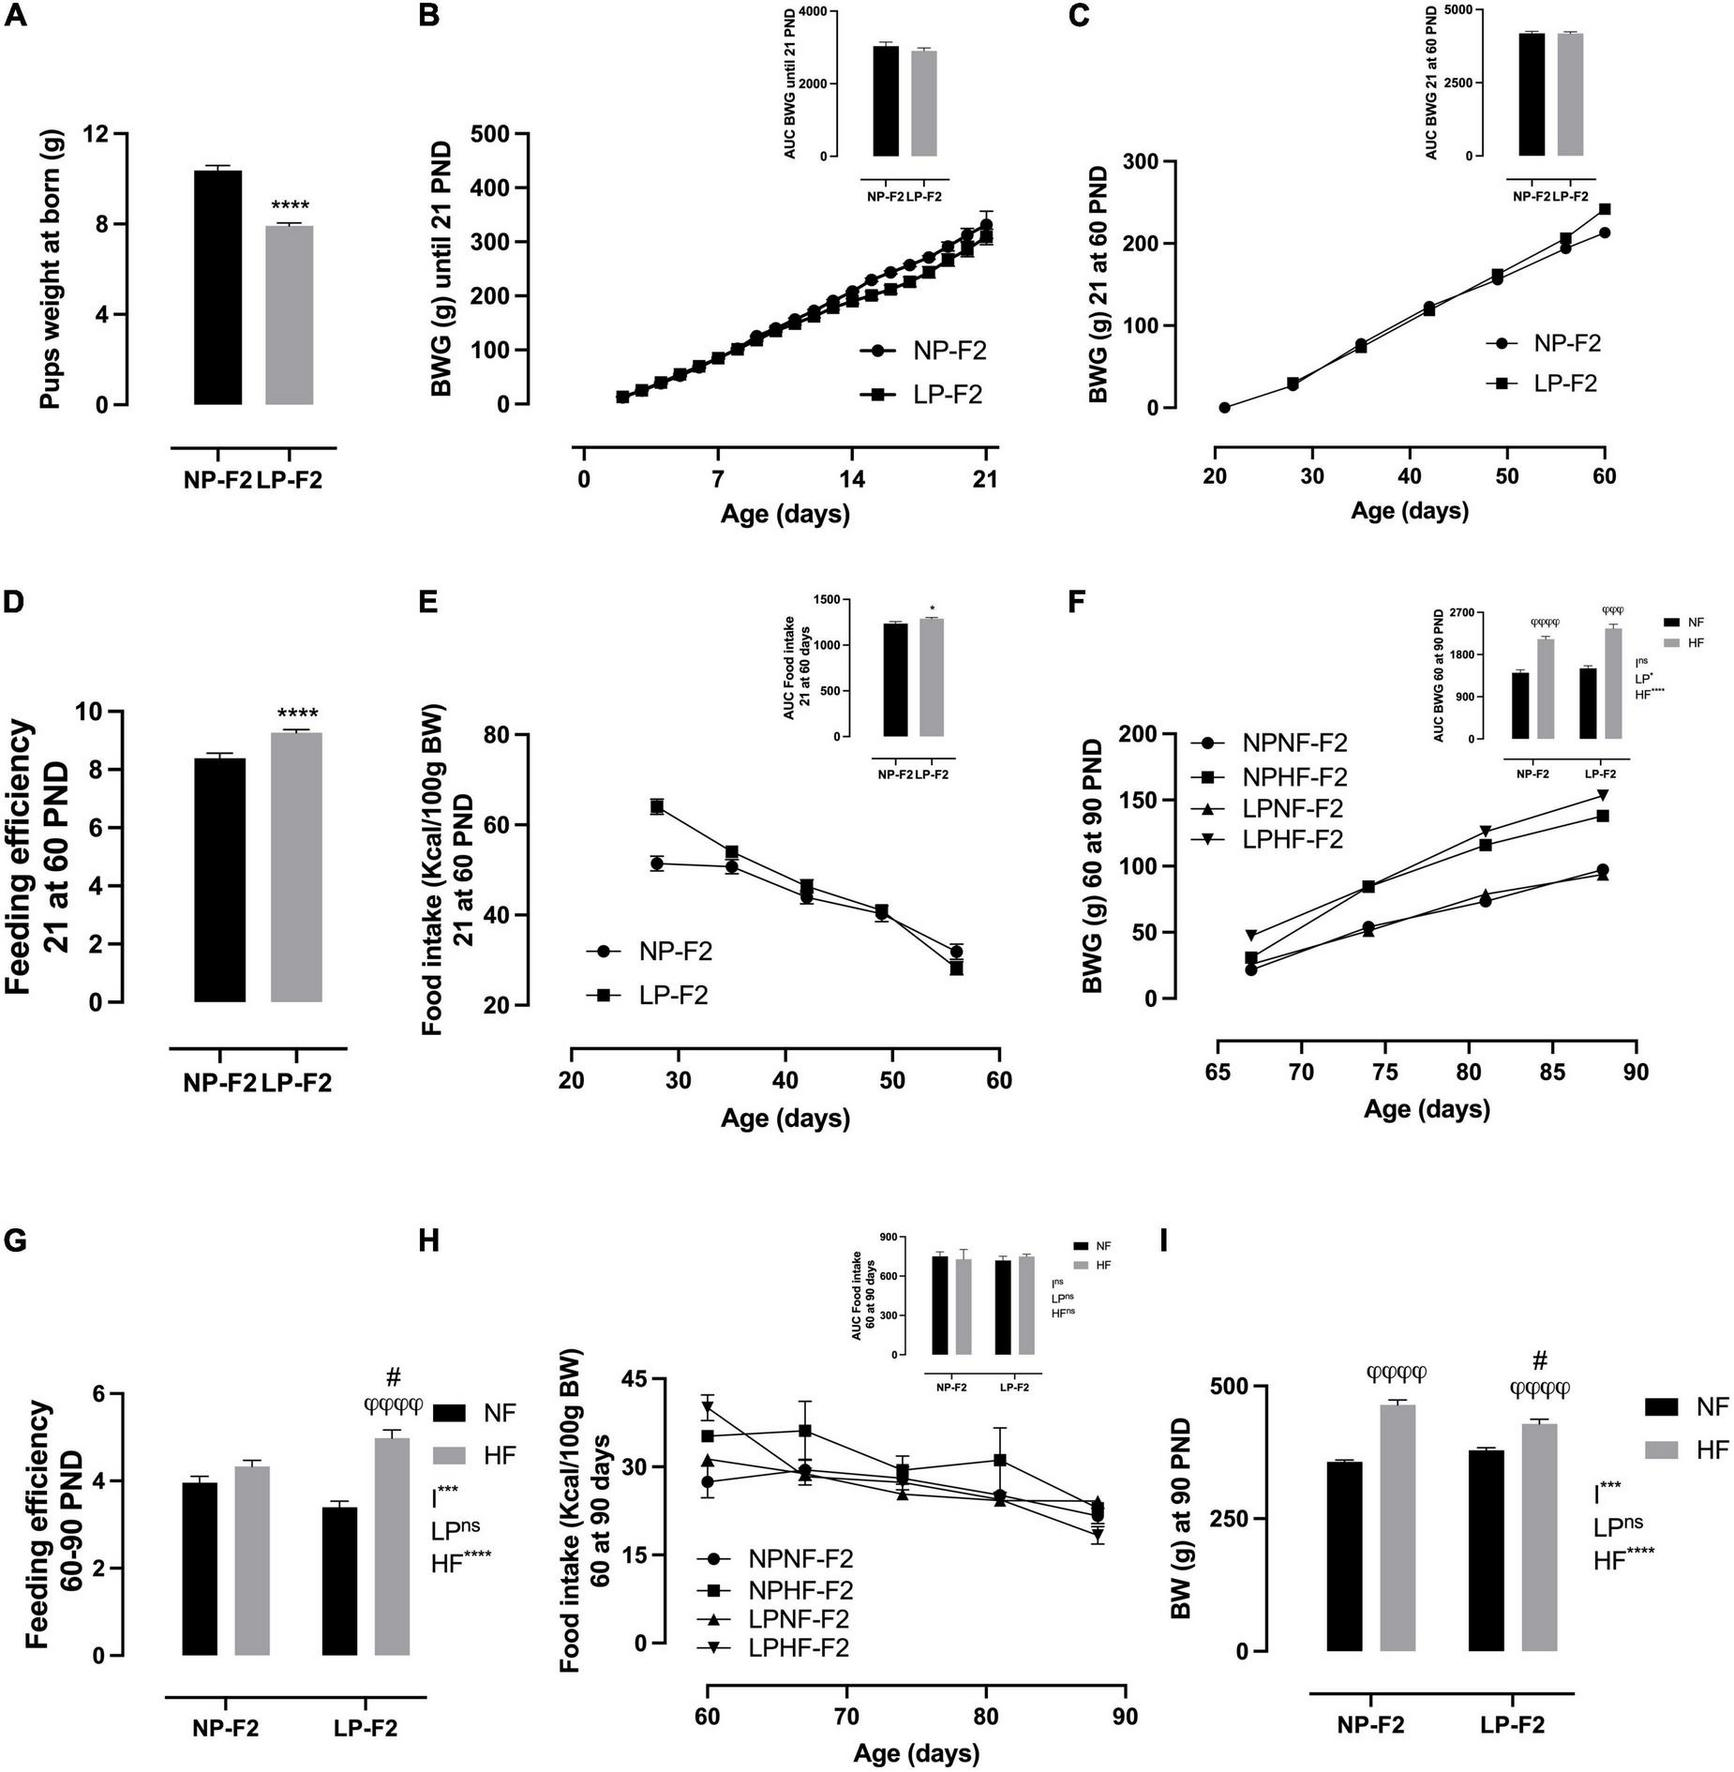
Offspring’s biometric parameters, caloric intake, and feeding efficiency. Litter weight at born (A), body weight gain during lactation (B), body weight gain from 21 to 60 PND (C), feeding efficiency from 21 to 60 PND (D), food intake from 21 to 60 PND (E), body weight gain from 60 to 90 PND (F), feeding efficiency from 60 to 90 PND (G), food intake from 60 to 90 PND (H), and body weight at 90 PND (I). The data are expressed as the means ± S.E.M. and were obtained from 12 to 15 rats of each group (from 4 to 5 different litters). The inset represents the AUC. *p < 0.05, ****p < 0.0001 for Student’s t-test. #p < 0.05, ##p < 0.01, ###p < 0.001, ####p < 0.0001 to NP-F2 vs. LP-F2 in the same conditions; φp < 0.05, φφp < 0.01, φφφp < 0.001, φφφφp < 0.0001 to NF vs. HF in the same group for the probability based on the Tukey’s post hoc analysis. LP, low-protein diet factor; HF, high-fat diet factor; and I, interaction between LP and HF factors. *p < 0.05, ***p < 0.001, ****p < 0.0001, and ns, no significant difference, based on two-way analysis of variance.
Figure 3F shows that there was no difference in BW gain between LPNF-F2 and NPNF-F2 offspring in adulthood. However, exposure to an HF diet resulted in an increase of 33.68% (p < 0.0001) and 36.18% (p < 0.001) in body weight gain in NPHF-F2 and LPHF-F2 offspring, respectively. No other differences were observed between the NPHF-F2 and LPHF-F2 offspring. Food intake did not differ between groups (Figure 3H). Additionally, feeding efficiency did not differ between the NPNF-F2 and LPNF-F2 offspring. However, the LPHF-F2 group showed an increase of 31.83% (p < 0.0001) and 13.07% (p < 0.05) in feeding efficiency compared to the LPNF-F2 and NPHF-F2 groups, respectively (Figure 3G), with interactions between factors.
As shown in Figure 3I, at PND90, there was no difference in bin BW between the NPNF-F2 and LPNF-F2 offspring. The NPHF-F2 group had a 23.14% increase in BW compared with the NPNF-F2 group (p < 0.0001). Additionally, the LPHF-F2 group has an 11.58% increase in BW compared to the LPNF-F2 group (p < 0.0001). Among the groups that received the HF diet, the LPHF-F2 group had a 7.7% decrease in body weight (P < 0.05), with interactions between factors.
3.2.2. Biochemical parameters and lipid profile
As shown in Table 1, fasting glycemia was 15.39% lower in LPNF-F2 offspring than in NPNF-F2 offspring (p < 0.05). Offering an HF diet, the NPHF-F2 offspring showed a 13.27% increase in fasting glycemia (p < 0.05). However, no difference was observed between LPHF-F2 compared with LPNF-F2 offspring. Nevertheless, the LPHF-F2 offspring showed lower fasting glucose (16.89%) than the NPHF-F2 offspring (p < 0.01), with interactions between factors.
TABLE 1
| Parameters | NPNF-F2 | NPHF-F2 | LPNF-F2 | LPHF-F2 | LP | HF | I |
| Fasting glycemia (mg/dl) | 94.7 ± 3.0 | 109.2 ± 5.5φ | 80.2 ± 2.7# | 90.8 ± 3.4## | ns | **** | ** |
| Fasting insulinemia (ìU/ml) | 153.6 ± 18 | 160.6 ± 5.5 | 234.9 ± 7.2### | 253.9 ± 8.8### | ns | **** | ns |
| Total cholesterol (mg/dl) | 87.6 ± 3.8 | 123.1 ± 4.0φφφ | 88.7 ± 1.4 | 101.5 ± 3.9## | ** | * | **** |
| Triglycerides (mg/dl) | 66.1 ± 2.4 | 82.8 ± 6.4 | 71.6 ± 4.4 | 90.7 ± 5.5φ | ns | ns | ** |
| HDL-C (mg/dl) | 51.9 ± 5.1 | 68.6 ± 2.4φ | 26.7 ± 2.4#### | 38.9 ± 2.6####φ | ns | **** | *** |
| LDL-C (mg/dl) | 21.2 ± 1.5 | 30.7 ± 1.6 | 38.5 ± 1.6### | 53.4 ± 3.1####φ | ns | **** | **** |
| VLDL-C (mg/dl) | 13.9 ± 0.6 | 18.1 ± 1.2 | 14.3 ± 0.9 | 18.1 ± 1.1φ | ns | ns | *** |
Effect of high fat (HF) consumption on biochemical parameters at PND90 of adult F2 offspring from F1 dams programmed by protein restriction on lactation.
All data are expressed as the mean ± S.E.M. and were obtained from 10 to 12 rats of each group (from 10 to 12 different litters). NPNF-F2, offspring of the dam (F1) born from NP dam (F0) then received NF during adulthood; NPHF-F2, offspring of the dam (F1) born from NP dam (F0) then received HF during adulthood; LPNF-F2, offspring of the dam (F1) born from LP dam (F0) then received NF during adulthood; LPHF-F2, offspring of the dam (F1) born from LP dam (F0) then received HF during adulthood. #p < 0.05, ##p < 0.01, ###p < 0.001, and ####p < 0.0001 to NP-F2 vs. LP-F2 in the same conditions; φp < 0.05 and φφφp < 0.001 to NF vs. HF in the same group for the probability based on the Tukey’s post hoc analysis. LP, low-protein diet factor; HF, high-fat diet factor; and I, interaction between LP and HF factors. *p < 0.05, **p < 0.01, ***p < 0.001, ****p < 0.0001, and ns, no significant difference, based on two-way analysis of variance.
Fasting insulinemia was 34.6% higher in the LPNF-F2 offspring compared with NPNF-F2 (p < 0.001). The NPHF-F2 and LPHF-F2 offspring showed no differences compared to their counterparts. However, LPHF-F2 displayed an increase of 36.75% in fasting insulinemia compared with NPHF-F2 (p < 0.001).
Regarding total cholesterol levels, there was no difference between the LPNF-F2 compared with NPNF-F2 offspring. However, as expected, NPHF-F2 offspring had significantly higher total cholesterol levels than NPNF-F2 offspring (+28%; p < 0.001). In contrast, HF diet intake showed no statistical difference in total cholesterol between the LPHF-F2 and LPNF-F2 offspring. Interestingly, LPHF-F2 showed lower cholesterol levels than NPHF-F2 (−17.5%; p < 0.01), with interactions between factors.
Triglyceride levels did not differ between the LPNF-F2 and NPNF-F2 groups. Additionally, an HF diet did not increase TG levels in NPHF-F2 offspring compared to NPNF-F2 or LPHF-F2 offspring. However, the LPHF-F2 offspring showed an increase of 21.07% in plasma TG levels compared to the LPNF-F2 offspring (p < 0.05), with interactions between factors.
The LPNF-F2 group showed a 48.61% decrease in HDL-C levels compared to the NPNF-F2 group (p < 0.0001). As expected, HDL-C levels in the LPHF-F2 group were decreased by 43.29% compared to the NPHF-F2 group (p < 0.0001). In addition, an HF diet increased HDL-C levels by 24.41% and 31.50% in the NPHF-F2 and LPHF-F2 groups (p < 0.05), respectively, compared to their counterparts, with interactions between factors.
In plasma LDL-C levels, the LPNF-F2 group had levels increased by 44.81% compared with the NPNF-F2 group (p < 0.001). Moreover, NPHF-F2 offspring showed a tendency to have increased LDL-C levels compared to NPNF-F2 offspring (p = 0.0944). The LPHF-F2 offspring showed an increase of 27.93% and 42.52% compared with LPNF-F2 (p < 0.05) and NPHF-F2 offspring (p < 0.0001), respectively, with interactions between factors.
Very-low-density LDL cholesterol levels did not differ between the LPNF-F2 and NPNF-F2 offspring. Curiously, the NPHF-F1 offspring were not significantly different from the NPNF-F2 or LPHF-F2 offspring in terms of VLDL-C levels. However, the LPHF-F2 group showed an increase of 21.07% in VLDL-C levels compared to the LPNF-F2 group (p < 0.05), with interactions between factors.
3.2.3. Glucose homeostasis during the glucose and insulin tolerance test
During the ivGTT, as observed by the AUC, the LPNF-F2 group showed no difference in glycemia or peripheral insulin sensitivity compared with the NPNF-F2 group (Figure 4A), as demonstrated by Kitt (Figure 4B). As expected, the HF diet resulted in glucose intolerance (Figure 4A; +28.44%; p < 0.001) and insulin resistance (Figure 4B; −40.48%; p < 0.05) in NPHF-F2 offspring compared with NPNF-F2 offspring. However, no differences were observed between the LP-HF-F2 and LP-NF-F2 offspring in glucose levels and kITT. Although the LPHF-F2 offspring showed significantly lower glucose concentrations during the test than the NPHF-F2 offspring (Figure 4A; −30.36%; p < 0.01), no difference was observed in insulin sensitivity (Figure 4B). Glucose tolerance tests showed interactions between the factors.
FIGURE 4
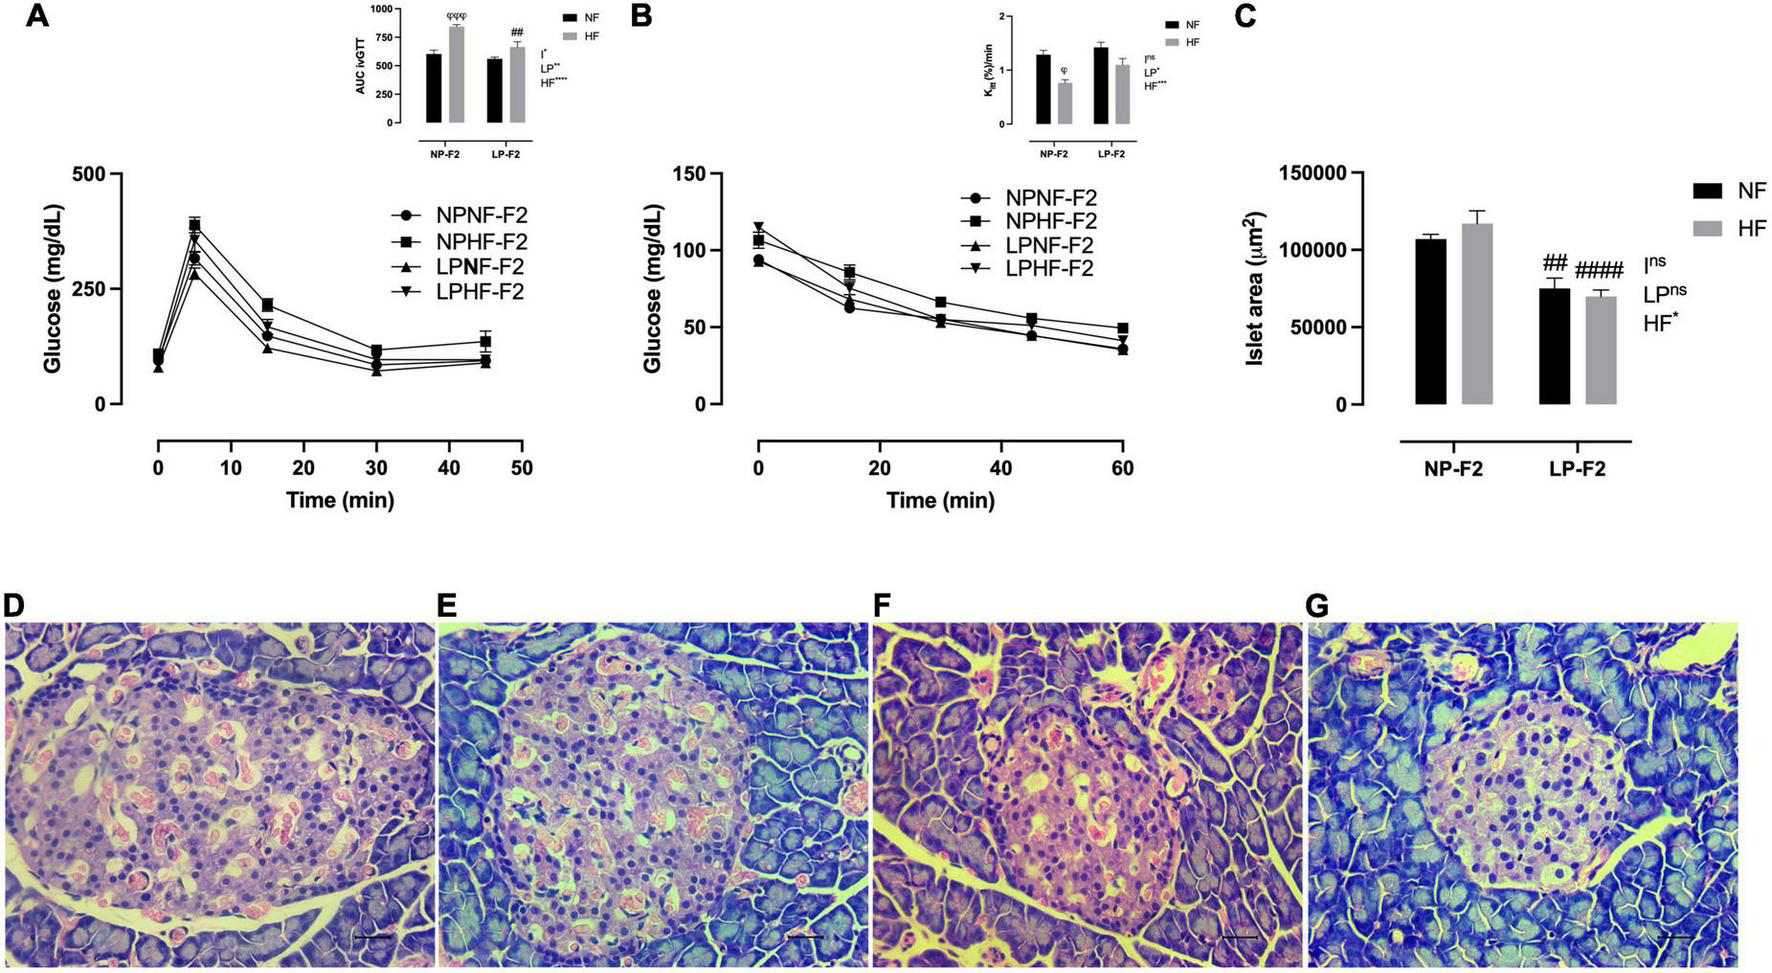
Glucose homeostasis and pancreas morphometry at 90 days old. Plasma glucose during intravenous glucose tolerance test (ivGTT) (A), insulin tolerance test and Kitt(B), islet area (C), NPNF-F2 islet (D), NPHF-F2 islet (E), LPNF-F2 islet (F), and LPHF-F2 islet (G). The data are expressed as the means ± S.E.M. and were obtained from 6 to 12 rats of each group (from 3 to 6 different litters). ##p < 0.01 and ####p < 0.0001 to NP-F2 vs. LP-F2 in the same conditions; φp < 0.05, φφφp < 0.001 to NF vs. HF in the same group for the probability based on Tukey’s post hoc analysis. LP, low-protein diet factor; HF, high-fat diet factor; I, interaction between LP and HF factors. *p < 0.05, **p < 0.01, ***p < 0.001, ****p < 0.0001, and ns, no significant difference, based on two-way analysis of variance.
3.2.4. Pancreatic islet morphometry
Optical analysis showed that pancreatic islet architecture was not altered in the offspring. However, the islet area was lower in the LPNF-F2 (Figure 4F) offspring than in the NPNF-F2 offspring (Figures 4C, D; −29.75%; p < 0.01). The LPHF-F2 (Figure 4G) and NPHF-F2 (Figure 4E) offspring showed no difference in islet area compared to their counterparts. However, this parameter was decreased by 40.38% in the LPHF-F2 group compared to that in the NPHF-F2 group (Figure 4C; P < 0.0001).
3.3. Fat pad store composition and morphometry
As shown in Figures 5A(C, no difference was observed in fat pad stores between the LPNF-F2 and NPNF-F2 offspring. As expected, the NPHF-F2 offspring had a higher retroperitoneal (Figure 5A; +63.30%; p < 0.001), perigonadal (Figure 5B; +63.19%; p < 0.0001), and mesenteric fat pad (Figure 5C; +61.98%; p < 0.0001) than the NPNF-F2 offspring. Similarly, the white adipose tissue (WAT) mass was higher in the LPHF-F2 offspring than in the LPNF-F2 offspring, with an increase of 48.84% (p < 0.0001), 47.63% (p < 0.0001), and 52.64% (p < 0.0001) for retroperitoneal, perigonadal, and mesenteric fat pad, respectively. While retroperitoneal fat stores were not different, the LPHF-F2 offspring had lower perigonadal (Figure 5B; −18.48%; p < 0.01) and mesenteric fat stores (Figure 5C; 25.68%; p < 0.001) compared with the NPHF-F2 offspring, with interactions between factors in all fat pad stores.
FIGURE 5
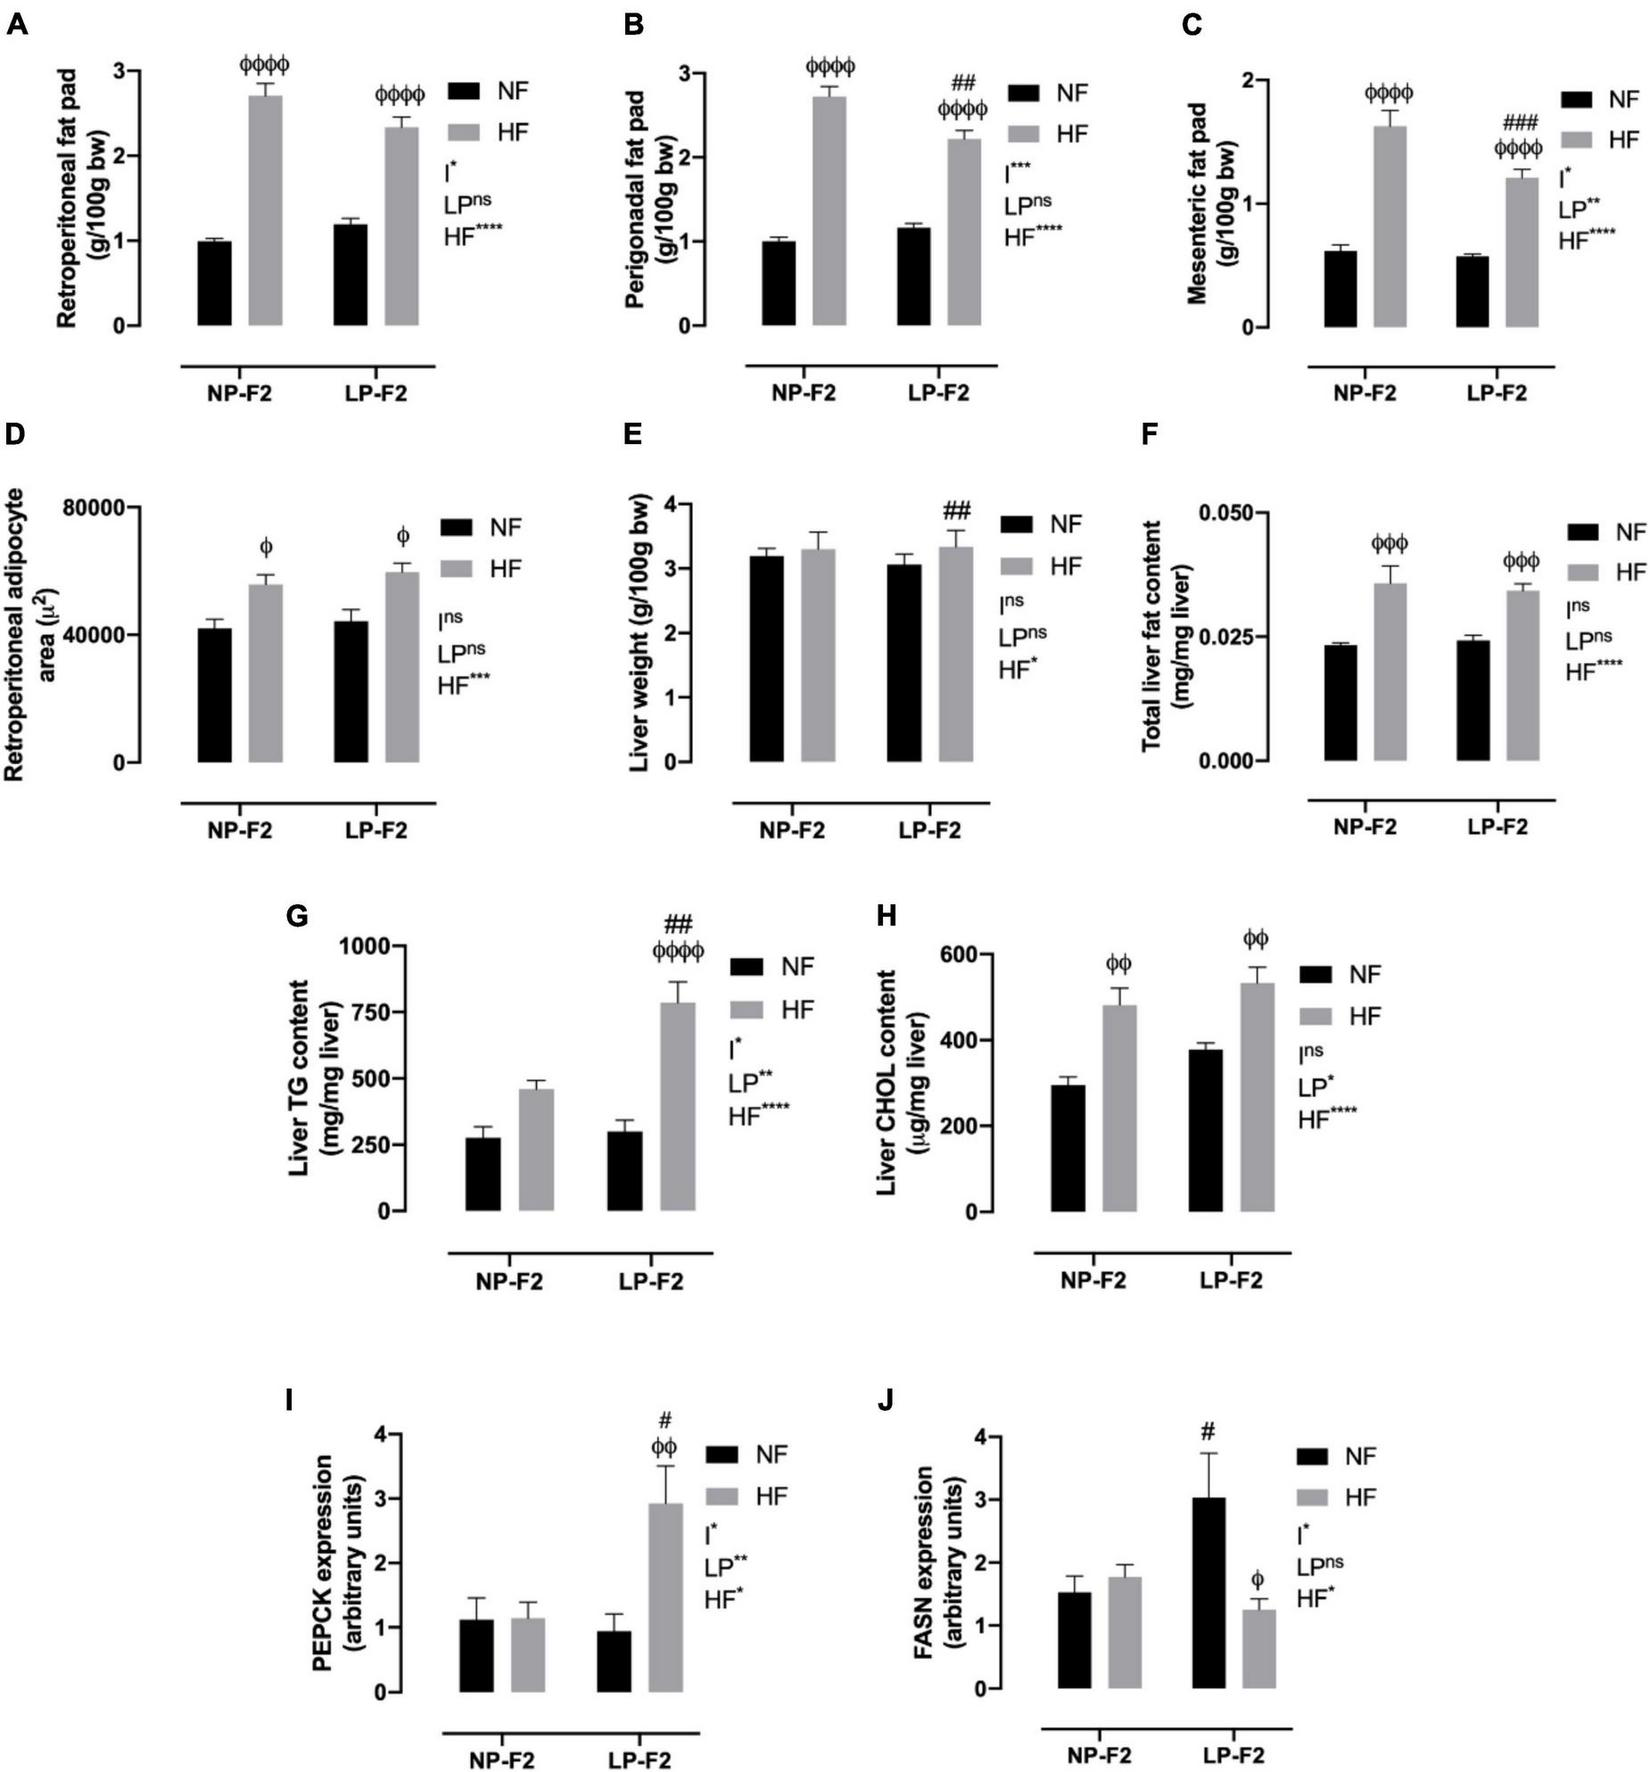
Fat pad store and hepatic profile at 90 days old. Retroperitoneal (A), perigonadal (B), mesenteric fat pad store (C), retroperitoneal adipocyte area (D), liver weight (E), total liver fat content (F), liver triglycerides content (G), liver cholesterol content (H), PEPCK (I) and FASN expression (J). The data are expressed as the mean ± S.E.M. and were obtained from 8 to 12 rats of each group (from 3 to 4 different litters). #p < 0.05, ##p < 0.01, ###p < 0.001, ####p < 0.0001 to NP-F2 vs. LP-F2 in the same conditions; φp < 0.05, φφp < 0.01, φφφp < 0.001, φφφφp < 0.0001 to NF vs. HF in the same group for the probability based on the Tukey’s post hoc analysis. LP, low-protein diet factor; HF, high-fat diet factor; and I, interaction between LP and HF factors. *p < 0.05, **p < 0.01, ***p < 0.001, ****p < 0.0001, and ns, no significant difference, based on two-way analysis of variance.
Regarding the morphometric analysis of retroperitoneal fat, no differences were observed between the LPNF-F2 and NPNF-F2 offspring. However, the NPHF-F2 and LPHF-F2 groups showed increases of 24.67% and 25.74%, respectively, in the retroperitoneal adipocyte area, compared to their counterparts (Figure 5D; P < 0.05). No differences were observed between the LPHF-F2 and NPHF-F2 groups.
3.4. Hepatic morphofunction and lipid profile
As shown in Figure 5E, the LPNF-F2 group did not show a difference in liver weight compared with the NPNF-F2 group. Thus, an HF diet did not induce any difference in liver weight in the NP-F2 offspring. However, the LPHF-F2 group showed an increase of 8.18% in liver weight compared with the LPNF-F2 group. No difference was observed in liver weight between the LPHF-F2 and NPHF-F2 offspring.
Regarding total liver fat content, no difference was observed between the NPNF-F2 and LPNF-F2 offspring. However, the HF diet increased liver fat content by 36.11% and 29.41% in the NPHF-F2 and LPHF-F2 offspring, respectively, compared with their counterparts (Figure 5F; P < 0.001). No difference was observed in the LPHF-F2 offspring compared to the NPHF-F2 offspring.
Liver TG content was similar between the LPNF-F2 and NPNF-F2 offspring. Curiously, an HF diet did not induce a difference in liver TG content in the NPHF-F2 offspring compared with the NPNF-F2 offspring (Figure 5G). However, liver TG content in the LPHF-F2 offspring increased by 138.17% (p < 0.0001) and 158.40% (p < 0.01) compared with the LPNF-F2 and NPHF-F2 offspring, respectively, with interactions between factors.
The same pattern of results as for total liver fat content was observed for liver cholesterol content (Figure 5H). No statistical difference was observed between the LPNF-F2 and NPNF-F2 offspring or between the LPHF-F2 and NPHF-F2 offspring. However, a HF diet increased liver cholesterol content by 38.72% and 29.08% (p < 0.01) in the NPHF-F2 and LPHF-F2 groups, respectively, compared with their counterparts.
The livers of the LPNF-F2 (Figure 6B) and NPNF-F2 (Figure 6A) offspring exhibited a brown-reddish color with no optical evidence of hepatic lipid alteration. Microscopical observation of the hepatocytes showed that they were arranged in rows, delimited by connective tissue containing sinusoids capillaries. As shown in Table 2, NPNF-F2 hepatocytes had a homogeneous cytoplasm without fat vacuoles (score 0; Figure 6A), while the nucleus displayed a central position. LPNF-F2 histopathological analyses showed that 80% of the samples displayed mild steatosis (score 1; Figure 6B) in zone 1.
FIGURE 6
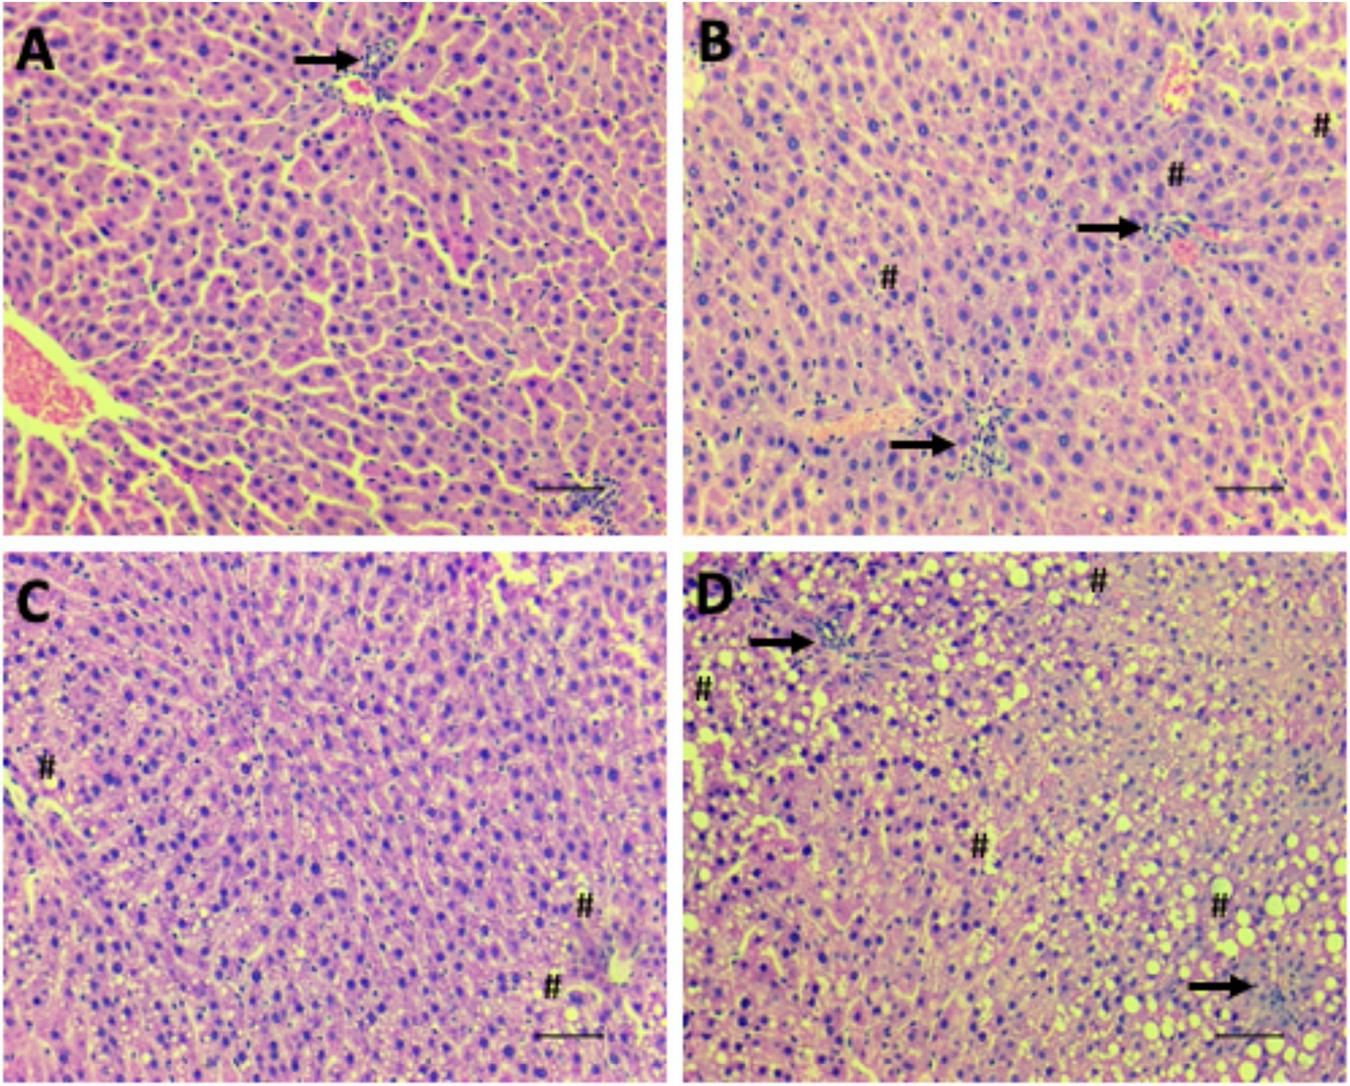
Hepatic steatosis. Representative images of microscopical analyses of steatosis grade 0 (none to 5% of hepatocytes affected) (A; NPNF-F2), grade 1 (>5%–33% affected) (B; LPNF-F2), grade 2 (>33%–66% affected) (C; NPHF-F2) and grade 3 (>66% affected) (D; LPHF-F2). Hematoxylin and Eosin-stained sections. Hash, examples of macrovesicular steatosis, in all hepatocytes, fat inclusions displaced nucleus to the periphery; Arrow, cluster of inflammatory cells. Magnification: 200×. Scale bar = 50μm.
TABLE 2
| % RESPONSES IN CATEGORY | ||||||
| ITEM | Score | NPNF-F2 (n = 5) | NPHF-F2 (n = 6) | LPNF-F2 (n = 5) | LPHF-F2 (n = 5) | |
| STEATOSIS | ||||||
| <5% | 0 | 100% | 0% | 20% | 0% | |
| 5%−33% | 1 | 0% | 0% | 80% | 0% | |
| >33%−66% | 2 | 0% | 33,33% | 0% | 20% | |
| >66% | 3 | 0% | 66,67% | 0% | 80% | |
| LOCATION | ||||||
| Zone 3 | 0 | 0% | 0% | 0% | 0% | |
| Zone 1 | 1 | 0% | 50% | 100% | 0% | |
| Azonal | 2 | 0% | 50% | 0% | 40% | |
| Panacinar | 3 | 0% | 0% | 0% | 60% | |
Effect of HF consumption on hepatic steatosis of adult F2 offspring from dams programmed by protein restriction during lactation.
All data were obtained from 5 to 6 rats of each group (from 5 to 6 different litters). NPNF-F2, offspring of the dam (F1) born from NP dam (F0) then received NF during adulthood; NPHF-F2, offspring of the dam (F1) born from NP dam (F0) then received HF during adulthood; LPNF-F2, offspring of the dam (F1) born from LP dam (F0) then received NF during adulthood; LPHF-F2, offspring of the dam (F1) born from LP dam (F0) then received HF during adulthood.
The livers of the HF-fed offspring presented a yellowish aspect, which macroscopically characterizes hepatic steatosis (Table 2). This was confirmed via histopathological analyses, which showed that the hepatocytes of the NPHF-F2 (Figure 6C) and LPHF-F2 (Figure 6D) offspring exhibited displacement of the nucleus to the cell periphery and the presence of large cytosolic fat vacuoles. These analyses demonstrated that 66.67% of the NPHF-F2 offspring displayed severe macrovesicular steatosis (score 3) distributed in zone 1 (50%) or without a distribution pattern (azonal; 50%). In the LPHF-F2 offspring, a HF diet increased severe macrovesicular steatosis (80%; score 3; Figure 6D) evenly distributed throughout the hepatic tissue (panacinar; 60%).
3.5. Liver PEPCK and FASN expression
As shown in Figure 5I, phosphoenolpyruvate carboxykinase (PEPCK) displayed no difference between the LPNF-F2 and NPNF-F2 offspring. Additionally, an HF diet did not induce a difference in PEPCK expression between the NPHF-F2 and NPNF-F2 offspring. However, the LPHF-F2 group showed an increase of 139.10% and 132.17% in PEPCK expression compared with the NPHF-F2 (p < 0.05) and LPNF-F2 (p < 0.01) groups, respectively, with interactions between factors.
Fatty acid synthase (FASN) was increased by 49.79% in the LPNF-F2 group compared to the NPNF-F2 group (p < 0.05) (Figure 5J). Moreover, the NPNF-F2 and NPHF-F2 groups showed no difference in this parameter. FASN expression in the LPHF-F2 group was decreased by 58.75% compared with the LPNF-F2 group (p < 0.05). No statistical difference was observed between the LPHF-F2 and NPHF-F2 offspring, with interactions between the factors.
4. Discussion
In this study, we evaluated the transgenerational transmission of the programmed phenotype by LP in the first 14 days of lactation through the maternal lineage to adult male F2 offspring and their susceptibility to damage induced by an HF diet later in life. First, we observed that LP alters glucose homeostasis in LPNF-F2 (second generation) offspring, resulting in lower fasting glycemia and islet area. Insulin sensitivity was not altered. However, insulin levels were higher. In addition, we showed lipid hepatic alterations with increased lipogenesis and grade 1 steatosis, verifying the transgenerational effects of the grandmother’s low-protein diet-fed. After an HF diet was offered during adulthood, we show for the first time that the LPHF-F2 offspring are more susceptible to hepatic damage that the NPHF-F2 offspring. They also showed decreased total cholesterol, HDL-C, and fat pad stores. Furthermore, the hepatic tissue is completely compromised by intracellular fat vesicles. These outcomes corroborate Barker’s hypothesis that metabolic programming during critical developmental periods results in altered postnatal metabolism, leaving future generations (such as the F2 generation) more susceptible to diseases (9–11).
The hypothalamus is a well-regulated brain center and an important structure in the control of energy balance (34). The expression of neuropeptides involved in the control of eating behavior is altered in male rats with undernutrition through an increase in the expression of orexigenic hypothalamic peptides, with a concomitant decrease in anorexigenic peptides (35). This results in an increase in caloric intake and a decrease in fat pad stores in adult life (15). In female adult rats, exposure to a low-protein diet during critical periods of development can affect feeding behaviors (36) by causing malformation of the hypothalamus, which remains in adult life (37). However, body weight gain and caloric intake were not altered in F1 dams that were fed a low-protein diet during the suckling phase. In the LP, the removed protein is replaced with carbohydrates to maintain the energy content of the diet. Consumption of these diets can reduce food intake by increasing serotonin production (38).
Several studies have shown that the nutritional status of the dams during critical developmental periods is essential for pups’ normal growth and development (26, 38, 39). Maternal milk is considered a better feeding source for newborns (40), and malnutrition during the suckling phase can negatively affect offspring growth, metabolism, and organ development (15, 26). In addition, offspring health is directly influenced by the intrauterine milieu (41). Here, we show for the first time that LP female offspring F1 displayed fasting hyperglycemia and glucose intolerance during pregnancy. Pregnancy is considered a diabetogenic situation per se. Maternal hyperglycemia and diabetes can compromise the food supply and induce adaptations in pancreatic fetal development due to glucose transportation through the placenta (41). Pregnant dams with gestational diabetes mellitus produce offspring with normal or low birth weights (39), which show impaired glucose tolerance during adulthood. This diabetogenic effect can be transmitted to the next generation of individuals (41).
Nevertheless, perinatal undernutrition determines a preference for an HF diet and increases dopaminergic action (42), which indicates the vulnerability of pathways that regulate food intake. However, an increase in HF intake was previously not observed in male offspring LP-F1 (15) and LP-F2 programmed during the suckling phase. An HF diet increased feeding efficiency in the LPHF-F2 offspring compared to the NPHF-F2 offspring, demonstrating catch-up growth. This could indicate a higher risk of obesity and related disorders (43).
An HF diet is directly associated with obesity, dyslipidemia, insulin resistance, and glucose intolerance (15, 38). Indeed, our research group previously showed that these parameters were higher in NPHF-F1 adult rats than in LPHF-F1 rats (15). Here, we show for the first time that LPHF-F2 offspring displayed similar results compared to LPHF-F1 male offspring; thus showing non-genomic phenotype transmission by epigenetic mechanisms from the maternal lineage.
Maternal glucose intolerance can harm lipid metabolism and promote fat accumulation in offspring due to the upregulation of Insr, Lpl, Pparg, and Adipoq mRNA. Adipocyte hypertrophy is associated with an increase in IL-6 levels, which disrupts insulin signaling (39). The LPHF-F2 group showed high-fat pad gain and an altered lipid profile with a smaller magnitude than the NPHF-F2 group. This transgenerational transmission can contribute to the worldwide pandemic of obesity and type 2 diabetes.
Alterations in lipid profiles have been observed in children with Kwashiorkor syndrome, a deficit in calories and protein. Patients with Kwashiorkor show lower serum TG, and TG accumulation on hepatocytes, due to decreased VLDL-C synthesis. Lower VLDL-C secretion occurs because of a severe protein deficiency. A block in the release of hepatic triglycerides is the major mechanism of fatty liver disease in Kwashiorkor syndrome (44). The LP used in this study had a very low protein content (4%). The restriction of some nutrients in the maternal diet leads to changes in the lipid profile of the offspring (45), such as HDL-C and LDL-C. This is significant as increased LDL-C levels are an important hallmark of cardiovascular disease (46).
A high carbohydrate content in the diet can be associated with decreased HDL-C levels (47). Similarly, LPNF-F2 and LPHF-F2 adult offspring also had lower HDL-C levels, although LP-F1 dams were fed a normal protein diet throughout the experimental period. This profile modification may be due to changes in the expression of the transcription factors that regulate lipolysis and lipogenesis. Suppression of these transcription factors has been shown in rats fed protein restriction during the perinatal period (48), which presented with increased serum TG levels. Triglycerides are the main storage form of energy in adipocytes and hepatocytes in humans and rats. Their release from their stores must be regulated to avoid their toxic potential (49). The liver is an important site for storing excess free fatty acids and is released to control energy homeostasis. TG release occurs in the VLDL-C form by re-esterification at the endoplasmic reticulum with a requirement for apoB and microsomal triglyceride transfer protein (MTP) in the hepatic acinus pericentral zone. Lower VLDL-C secretion leads to the accumulation of TG in hepatocytes, resulting in hepatic steatosis (48).
Hepatic steatosis is characterized by lipid accumulation in hepatocytes, leading to inflammation and the potential progression to liver failure and cirrhosis (50). Even LPHF-F2 offspring had an increase in VLDL-C compared to LPNF-F2 offspring, which is not enough for TG transportation from the liver to the peripheral tissues. Hormonal and dietary factors also affect VLDL-C levels (51). For the first time, we show that protein restriction during the suckling phase had a harmful transgenerational effect on liver tissue when an HF diet was offered. In this study, the LPHF-F2 group displayed higher hepatic TG levels, liver weight, and steatosis grade (score 3) than the NPHF-F2 group.
Fatty acid synthase is one of the major genes responsible for lipid homeostasis and de novo lipogenesis and is controlled by hormones and nutritional status. After a meal, blood glucose and insulin levels increase and stimulate de novo lipogenesis (52). FASN mRNA expression was higher in the LPNF-F2 offspring, suggesting a compensatory mechanism for energy homeostasis maintenance with low-grade steatosis (score 1). Similarly, a restricted diet during pregnancy increased hepatic FASN mRNA expression in the F0 generation, with a trend in the F1 generation. The increase in FASN mRNA levels correlated with lower HDL-C content in the female progeny (45). Transgenerational studies have shown that LP can affect the hepatic transcriptional profile of thousands of genes until the F3 generation (53). In addition, restricted calorie intake during the preconception or gestational period impairs lipid metabolism, altering FASN mRNA levels in the adult offspring (54). The increase in hepatic TG concentrations during HF feeding is almost entirely driven by uptake and esterification of plasma FFA, without expressive liver contribution. Diets with long-chain fatty acids significantly inhibit de novo lipogenesis (55), which could explain low FASN expression in the LPHF-F2 group.
The liver consists of distinct zones with phenotypic heterogeneity, depending on their acinus or lobular localization. Enzymes involved in fatty acid metabolism can exhibit flexibility according to their physiological needs. TG accumulates in hepatocytes starting in the pericentral areas and advancing to the intermediate and periportal areas (56). For the first time, we demonstrated that LPNF-F2 shows steatosis grade 1, with a zone 1 predominant distribution. However, the HF diet increased steatosis to grade 3, with a full distribution of lipids in the liver tissue (panacinar distribution). These results imply that F0 maternal LP could induce a transgenerational effect on liver metabolism and be susceptible to non-alcoholic fatty liver disease in the F2 generation. Liver lipid metabolism is essential to neutralize the impact of FFA-mediated lipotoxicity in peripheral tissues and pancreatic beta cells (56).
The pancreas is the major organ involved in the maintenance of glucose metabolism. Early LP during pregnancy impairs pancreatic beta cell development due to glucose dependence for beta cell maturation, resulting in altered structure and function (14). At the end of gestation, the fetus can control its own glucose levels owing to the adaptation of insulin production and insulin action (26, 41). Studies have shown that poor carbohydrate supply during lactation can change islet structure (37) and stimulate the involution of the pancreas, which is more pronounced in litters from diabetic dams (41). The offspring of hyperglycemic dams display glucose intolerance in adulthood (26). In adulthood, pancreatic mass is normalized (41). In this study, we demonstrated the transgenerational effect of a low-protein diet on glucose homeostasis. The LPNF-F2 group was associated with hypoglycemia and hyperinsulinemia compared to the NPNF-F2 group. Additionally, the LPHF-F2 group showed lower glucose intolerance and hyperinsulinemia than the NPHF-F2 group, insulin sensitivity was not altered, and the islet area was lower. These structural alterations may be compensatory mechanisms to maintain glucose homeostasis early in life (57).
The liver is the only organ that produces and exports glucose. Liver glucose production is dependent on the PEPCK enzyme, one of the main regulators of the gluconeogenic pathway. PEPCK is activated only after birth and catalyzes oxaloacetate decarboxylation to produce phosphoenolpyruvate in the presence of GTP, which is essential for the gluconeogenesis pathway (58). Nutritional status is the primary target of PEPCK regulation. Lipid accumulation is highly associated with higher PEPCK transcription in Zucker genetically fatty rats (59). In LPHF-F2, PEPCK expression increased. This induction may contribute to gluconeogenesis, which can be associated with glucose intolerance and hyperinsulinemia observed in the LPHF-F2 offspring.
5. Conclusion
F0 maternal protein-restricted diet during lactation could induce a transgenerational effect on glucose and hepatic metabolism in the F2 generation, making liver offspring more vulnerable to nutritional injury later in life. Some studies show that some results are divergent in the F3 compared to the other generations, due to the direct impact of diet restriction on the development of ovum in F2 females, which did not happen in our study. If dietary restriction changes ovum formation, it could have major translational impacts. However, further studies are required to understand the transgenerational mechanisms of a low-protein diet.
Statements
Data availability statement
The original contributions presented in this study are included in the article/Supplementary material, further inquiries can be directed to the corresponding author.
Ethics statement
The animal study was reviewed and approved by the Ethics Committee in Animal Research of the State University of Maringá (no. 5409020520).
Author contributions
RV did the conceptualization, performed the methodology, carried out the formal analysis, investigated the data, and wrote the original draft of the manuscript. IM, CM, RC, CZ, AH, WH, TS, and NL investigated the data. TB and JC carried out the resources and supervised the data. AM and PM carried out the resources, supervised the data, and wrote, reviewed, and edited the manuscript. All authors contributed to the article and approved the submitted version.
Funding
This present study was financially supported by the Brazilian Research Agencies: Coordenação de Aperfeiçoamento de Pessoal de Nível Superior (CAPES), Conselho Nacional de Desenvolvimento Científico e Tecnológico (CNPq), and Programa de Indução a Projetos Científicos PROIND/LAB-ICETI.
Acknowledgments
The authors thank Maristela Gabriel.
Conflict of interest
The authors declare that the research was conducted in the absence of any commercial or financial relationships that could be construed as a potential conflict of interest.
Publisher’s note
All claims expressed in this article are solely those of the authors and do not necessarily represent those of their affiliated organizations, or those of the publisher, the editors and the reviewers. Any product that may be evaluated in this article, or claim that may be made by its manufacturer, is not guaranteed or endorsed by the publisher.
Supplementary material
The Supplementary Material for this article can be found online at: https://www.frontiersin.org/articles/10.3389/fnut.2022.1062116/full#supplementary-material
References
1.
da Silva Lippo B Batista T de Rezende L Cappelli A Camargo R Branco R et al Low-protein diet disrupts the crosstalk between the PKA and PKC signaling pathways in isolated pancreatic islets. J Nutr Biochem. (2015) 26:556–62. 10.1016/j.jnutbio.2014.12.010
2.
Cissé O Fajardy I Delahaye F Dickes A Montel V Moitrot E et al Effect of diet in females (F1) from prenatally undernourished mothers on metabolism and liver function in the F2 progeny is sex-specific. Eur J Nutr. (2019) 58:2411–23. 10.1007/s00394-018-1794-y
3.
Guzmán-Quevedo O da Silva Aragão R Pérez García G Matos R de Sa Braga Oliveira A de Castro R et al Impaired hypothalamic mTOR activation in the adult rat offspring born to mothers fed a low-protein diet. PLoS One. (2013) 8:e74990. 10.1371/journal.pone.0074990
4.
Santana D Ferreira D Braz G Sousa S Silva T Gomes D et al Maternal protein restriction in two successive generations impairs mitochondrial electron coupling in the progeny’s brainstem of wistar rats from both sexes. Front Neurosci. (2019) 13:203. 10.3389/fnins.2019.00203
5.
Siddique K Guzman G Gattineni J Baum M . Effect of postnatal maternal protein intake on prenatal programming of hypertension.Reprod Sci. (2014) 21:1499–507. 10.1177/1933719114530186
6.
Watkins A Sinclair K Watkins A . Paternal low protein diet affects adult offspring cardiovascular and metabolic function in mice.Am J Physiol Heart Circ Physiol. (2014) 306:1444–52. 10.1152/ajpheart.00981.2013.-Although
7.
Tarry-Adkins J Aiken C Ashmore T Ozanne S . Insulin-signalling dysregulation and inflammation is programmed trans-generationally in a female rat model of poor maternal nutrition.Sci Rep. (2018) 8:4014. 10.1038/s41598-018-22383-w
8.
Palou M Priego T Sánchez J Torrens J Palou A Picó C . Moderate caloric restriction in lactating rats protects offspring against obesity and insulin resistance in later life.Endocrinology. (2010) 151:1030–41. 10.1210/en.2009-0934
9.
Qasem R Yablonski E Li J Tang H Pontiggia L D’mello A . Elucidation of thrifty features in adult rats exposed to protein restriction during gestation and lactation.Physiol Behav. (2012) 105:1182–93. 10.1016/j.physbeh.2011.12.010
10.
Barker D . The origins of the developmental origins theory.J Intern Med. (2007) 261:412–7. 10.1111/j.1365-2796.2007.01809.x
11.
Hales C Barker D . The thrifty phenotype hypothesis.Br Med Bull. (2001) 60:5–20. 10.1093/bmb/60.1.5
12.
Döring F Lüersen K Schmelzer C Hennig S Lang I Görs S et al Influence of maternal low protein diet during pregnancy on hepatic gene expression signature in juvenile female porcine offspring. Mol Nutr Food Res. (2013) 57:277–90. 10.1002/mnfr.201200315
13.
Wang H Bianca Xu G Hernández-Saavedra D Chen H Pan Y . Low-protein diet during gestation and lactation increases hepatic lipid accumulation through autophagy and histone deacetylase.Am J Physiol Endocrinol Metab. (2020) 319:11–25. 10.1152/ajpendo.00263.2019.-The
14.
Rodríguez-Trejo A Guadalupe Ortiz-López M Zambrano E Granados-Silvestre Mde L Méndez C Blondeau B et al Developmental programming of neonatal pancreatic-cells by a maternal low-protein diet in rats involves a switch from proliferation to differentiation. . Am J Physiol Endocrinol Metab. (2012) 302:1431–9. 10.1152/ajpendo.00619.2011.-Maternal
15.
Martins I de Oliveira J Pavanello A Matiusso C Previate C Tófolo L et al Protein-restriction diet during the suckling phase programs rat metabolism against obesity and insulin resistance exacerbation induced by a high-fat diet in adulthood. J Nutr Biochem. (2018) 57:153–61. 10.1016/j.jnutbio.2018.03.017
16.
Otani L Nishi H Koyama A Akasaka Y Taguchi Y Toyoshima Y et al Low-arginine and low-protein diets induce hepatic lipid accumulation through different mechanisms in growing rats. Nutr Metab. (2020) 17:60. 10.1186/s12986-020-00477-5
17.
Souza Dde F Ignácio-Souza L Reis S Reis M Stoppiglia L Carneiro E et al A low-protein diet during pregnancy alters glucose metabolism and insulin secretion. Cell Biochem Funct. (2012) 30:114–21. 10.1002/cbf.1824
18.
Morimoto S Sosa T Calzada L Reyes-Castro L Díaz-Díaz E Morales A et al Developmental programming of aging of isolated pancreatic islet glucose-stimulated insulin secretion in female offspring of mothers fed low-protein diets in pregnancy and/or lactation. J Dev Orig Health Dis. (2012) 3:483–8. 10.1017/S2040174412000463
19.
Peixoto-Silva N Frantz E Mandarim-De-Lacerda C Pinheiro-Mulder A . Maternal protein restriction in mice causes adverse metabolic and hypothalamic effects in the F1 and F2 generations.Br J Nutr. (2011) 106:1364–73. 10.1017/S0007114511001735
20.
Frantz E Aguila M Pinheiro-Mulder Ada R Mandarim-de-Lacerda C . Transgenerational endocrine pancreatic adaptation in mice from maternal protein restriction in utero.Mech Ageing Dev. (2011) 132:110–6. 10.1016/j.mad.2011.01.003
21.
Benyshek D Johnston C Martin J Ross W . Insulin sensitivity is normalized in the third generation (F3) offspring of developmentally programmed insulin resistant (F2) rats fed an energy-restricted diet.Nutr Metab. (2008) 5:26. 10.1186/1743-7075-5-26
22.
Zambrano E Martínez-Samayoa P Bautista C Deás M Guillén L Rodríguez-González G et al Sex differences in transgenerational alterations of growth and metabolism in progeny (F2) of female offspring (F1) of rats fed a low protein diet during pregnancy and lactation. J Physiol. (2005) 566:225–36. 10.1113/jphysiol.2005.086462
23.
Kilkenny C Browne W Cuthill I Emerson M Altman D . Improving bioscience research reporting: the ARRIVE guidelines for reporting animal research.J Pharmacol Pharmacother. (2010) 1:94–9. 10.4103/0976-500x.72351
24.
de Oliveira J Scomparin D Andreazzi A Branco R Martins A Gravena C et al Metabolic imprinting by maternal protein malnourishment impairs vagal activity in adult rats. J Neuroendocrinol. (2011) 23:148–57. 10.1111/j.1365-2826.2010.02095.x
25.
Trinder P . Determination of blood glucose using an oxidase-peroxidase system with a non-carcinogenic chromogen.J Clin Pathol. (1969) 22:158–61. 10.1136/jcp.22.2.158
26.
Kiss A Woodside B Felício L Anselmo-Franci J Damasceno D . Impact of maternal mild hyperglycemia on maternal care and offspring development and behavior of Wistar rats.Physiol Behav. (2012) 107:292–300. 10.1016/j.physbeh.2012.08.001
27.
Carrara M Batista M Saruhashi T Felisberto-Junior A Guilhermetti M Bazotte R . Coexistence of insulin resistance and increased glucose tolerance in pregnant rats: a physiological mechanism for glucose maintenance.Life Sci. (2012) 90:831–7. 10.1016/j.lfs.2012.03.037
28.
Bonora E Moghetti P Zancanaro C Cigolini M Querena M Cacciatori V et al Estimates of In Vivo insulin action in man: comparison of insulin tolerance tests with euglycemic and hyperglycemic glucose clamp studies*. J Clin Endocrinol Metab. (1989) 68:374–8. 10.1210/jcem-68-2-374
29.
Miranda R Agostinho A Trevenzoli I Barella L Franco C Trombini A et al Insulin oversecretion in MSG-obese rats is related to alterations in cholinergic muscarinic receptor subtypes in pancreatic islets. Cell Physiol Biochem. (2014) 33:1075–86. 10.1159/000358677
30.
Simões F Marques R Diestel C Caetano C Dinis A Horst N et al Lipidic profile among rats submitted to total splenectomy isolated or combined with splenic autotransplant. Acta Cir Bras. (2007) 22:46–51. 10.1590/S0102-86502007000700010
31.
Folch J Lees M Sloane Stanley GH . A simple method for the isolation and purification of total lipides from animal tissues.J Biol Chem. (1957) 226:497–509.
32.
Kleiner D Brunt E van Natta M Behling C Contos M Cummings O et al Design and validation of a histological scoring system for nonalcoholic fatty liver disease. Hepatology. (2005) 41:1313–21. 10.1002/hep.20701
33.
Livak K Schmittgen T . Analysis of relative gene expression data using real-time quantitative PCR and the 2-ΔΔCT method.Methods. (2001) 25:402–8. 10.1006/meth.2001.1262
34.
Plagemann A Harder T Rake A Melchior K Rohde W Dörner G . Nutritional neurosciences hypothalamic nuclei are malformed in weanling offspring of low protein malnourished rat dams.J Nutr. (2000) 130:2582–90. 10.1093/jn/130.10.2582
35.
Orozco-Solís R Matos R Guzmán-Quevedo O de Souza S Bihouée A Houlgatte R et al Nutritional programming in the rat is linked to long-lasting changes in nutrient sensing and energy homeostasis in the hypothalamus. PLoS One. (2010) 5:e13537. 10.1371/journal.pone.0013537
36.
da Silva A Oliveira M Cavalcante T do Amaral Almeida L de Souza J da Silva M. et al Int J Dev Neurosci. (2016) 49:50–9. 10.1016/j.ijdevneu.2016.01.004
37.
Bautista C Bautista R Montaño S Reyes-Castro L Rodriguez-Peña O Ibáñez C et al Effects of maternal protein restriction during pregnancy and lactation on milk composition and offspring development. Br J Nutr. (2019) 122:141–51. 10.1017/S0007114519001120
38.
Brito P Ramos C Passos M Moura E . Adaptive changes in thyroid function of female rats fed a high-fat and low-protein diet during gestation and lactation.Braz J Med Biol Res. (2006) 39:809–16. 10.1590/s0100-879x2006000600015
39.
Talton O Bates K Rojas Salazar S Ji T Clamon Schulz L . Title: lean maternal hyperglycemia alters offspring lipid metabolism and susceptibility to diet-induced obesity in mice.Biol Reprod. (2019) 100:1356–69. 10.1093/biolre/ioz009/5304170
40.
Walker A . Breast milk as the gold standard for protective nutrients.J Pediatr. (2010) 156(Suppl. 2):S3–7. 10.1016/j.jpeds.2009.11.021
41.
Aerts L van Assche F . Animal evidence for the transgenerational development of diabetes mellitus.Int J Biochem Cell Biol. (2006) 38:894–903. 10.1016/j.biocel.2005.07.006
42.
Lindblom J Johansson A Holmgren A Grandin E Nedergård C Fredriksson R et al Increased mRNA levels of tyrosine hydroxylase and dopamine transporter in the VTA of male rats after chronic food restriction. Eur J Neurosci. (2006) 23:180–6. 10.1111/j.1460-9568.2005.04531.x
43.
Lim K Armitage J Stefanidis A Oldfield B Black M . IUGR in the absence of postnatal “catch-up” growth leads to improved whole body insulin sensitivity in rat offspring.Pediatr Res. (2011) 70:339–44. 10.1203/PDR.0b013e31822a65a3
44.
Coward W . Changes in serum @-lipoprotein concentration during the development of kwashiorkor and in recovery.Br J Nutr. (1972) 27:383. 10.1079/bjn19720104
45.
Nowacka-Woszuk J Madeja Z Chmurzynska A . Prenatal caloric restriction alters lipid metabolism but not hepatic Fasn gene expression and methylation profiles in rats.BMC Genet. (2017) 18:78. 10.1186/s12863-017-0544-0
46.
Gomez-Delgado F Katsiki N Lopez-Miranda J Perez-Martinez P . Dietary habits, lipoprotein metabolism and cardiovascular disease: from individual foods to dietary patterns.Crit Rev Food Sci Nutr. (2021) 61:1651–69. 10.1080/10408398.2020.1764487
47.
Flynn M Zmuda J Milosavljevic D Caldwell M Herbert P . Lipoprotein response to a national cholesterol education program step II diet with and without energy restriction.Metabolism. (1999) 48:822–6.
48.
Erhuma A Salter A Sculley DV Langley-Evans S Bennett A . Prenatal exposure to a low protein diet programmes disordered regulation of lipid metabolism in the ageing rat.Am J Physiol Endocrinol Metab. (2007) 292:E1702–14. 10.1152/ajpendo.00605.2006
49.
Jarc E Petan T . Lipid droplets and the management of cellular stress.Yale J Biol Med. (2019) 92:435–52.
50.
Palekar N Naus R Larson S Ward J Harrison S . Clinical model for distinguishing nonalcoholic steatohepatitis from simple steatosis in patients with nonalcoholic fatty liver disease.Liver Int. (2006) 26:151–6. 10.1111/j.1478-3231.2005.01209.x
51.
Shelness G Sellers J . Very-low-density lipoprotein assembly and secretion.Curr Opin Lipidol. (2001) 12:151–7.
52.
Song Z Xiaoli A Yang F . Regulation and metabolic significance of De Novo lipogenesis in adipose tissues.Nutrients. (2018) 10:1383. 10.3390/nu10101383
53.
Hoile S Lillycrop K Thomas N Hanson M Burdge G . Dietary protein restriction during F0 pregnancy in rats induces transgenerational changes in the hepatic transcriptome in female offspring.PLoS One. (2011) 6:e21668. 10.1371/journal.pone.0021668
54.
Ramírez-López M Arco R Decara J Vázquez M Rivera P Blanco R et al Long-term effects of prenatal exposure to undernutrition on cannabinoid receptor-related behaviors: sex and tissue-specific alterations in the mRNA expression of cannabinoid receptors and lipid metabolic regulators. Front Behav Neurosci. (2016) 10:241. 10.3389/fnbeh.2016.00241
55.
Delgado T Pinheiro D Caldeira M Castro M Geraldes C López-Larrubia P et al Sources of hepatic triglyceride accumulation during high-fat feeding in the healthy rat. NMR Biomed. (2009) 22:310–7. 10.1002/nbm.1327
56.
Kietzmann T . Metabolic zonation of the liver: the oxygen gradient revisited.Redox Biol. (2017) 11:622–30. 10.1016/j.redox.2017.01.012
57.
Dumortier O Blondeau B Duvillié B Reusens B Bréant B Remacle C . Different mechanisms operating during different critical time-windows reduce rat fetal beta cell mass due to a maternal low-protein or low-energy diet.Diabetologia. (2007) 50:2495–503. 10.1007/s00125-007-0811-0
58.
Kai Y Matsumura H Izui K . Phosphoenolpyruvate carboxylase: three-dimensional structure and molecular mechanisms.Arch Biochem Biophys. (2003) 414:170–9. 10.1016/S0003-9861(03)00170-X
59.
Zhou D Wang H Cui H Chen H Pan Y . Early-life exposure to high-fat diet may predispose rats to gender-specific hepatic fat accumulation by programming Pepck expression.J Nutr Biochem. (2015) 26:433–40. 10.1016/j.jnutbio.2014.10.009
Summary
Keywords
metabolic programming, maternal malnutrition, steatosis, thrifty phenotype hypothesis, metabolism
Citation
Vargas R, Martins IP, Matiusso CCI, Casagrande RA, Zara CB, Huppes de Souza AC, Horst WP, Sieklicki TC, Becker TCA, Lucredi NC, Comar JF, Malta A and Mathias PCdF (2023) Protein restriction during lactation causes transgenerational metabolic dysfunction in adult rat offspring. Front. Nutr. 9:1062116. doi: 10.3389/fnut.2022.1062116
Received
05 October 2022
Accepted
08 December 2022
Published
10 January 2023
Volume
9 - 2022
Edited by
Defu Ma, Peking University, China
Reviewed by
Liyuan Zhou, Capital Medical University, China; Ziyi Song, Guangxi University, China
Updates
Copyright
© 2023 Vargas, Martins, Matiusso, Casagrande, Zara, Huppes de Souza, Horst, Sieklicki, Becker, Lucredi, Comar, Malta and Mathias.
This is an open-access article distributed under the terms of the Creative Commons Attribution License (CC BY). The use, distribution or reproduction in other forums is permitted, provided the original author(s) and the copyright owner(s) are credited and that the original publication in this journal is cited, in accordance with accepted academic practice. No use, distribution or reproduction is permitted which does not comply with these terms.
*Correspondence: Rodrigo Vargas, rodrigokockvargas@gmail.com
This article was submitted to Nutrition and Metabolism, a section of the journal Frontiers in Nutrition
Disclaimer
All claims expressed in this article are solely those of the authors and do not necessarily represent those of their affiliated organizations, or those of the publisher, the editors and the reviewers. Any product that may be evaluated in this article or claim that may be made by its manufacturer is not guaranteed or endorsed by the publisher.