 Shiqi Hao
 Liang Ming
 Yafei Li1
 Haodi Lv
 Lin Li
 Rimutu Ji
- 1Key Laboratory of Dairy Biotechnology and Engineering, Ministry of Education, Inner Mongolia Agricultural University, Hohhot, China
- 2China-Mongolia Joint Laboratory for Biomacromolecule Research, Ulaanbaatar, Mongolia
Non-alcoholic fatty liver disease (NAFLD) is a common metabolic disease of life, usually caused by unhealthy diet and lifestyle. Compared to normal individuals, the structure of the intestinal flora of NAFLD patients is altered accordingly. This study investigates the effect of camel milk on the regulation of intestinal flora structure in mice with high-fat diet-induced NAFLD. NAFLD model was established by feeding C57BL/6J mice a high-fat diet for 12 weeks, meanwhile camel milk (3.0 g/kg/d), cow milk (3.0 g/kg/d), and silymarin (200 mg/kg/d) were administered by gavage, respectively. Food intake and changes of physiological indexes in mice were observed and recorded. The 16S rRNA gene V3-V4 region was sequenced and the intestinal flora diversity and gene function were predicted in the colon contents of mice from different group. The results showed that camel milk enhanced glucolipid metabolism by downregulate the levels of blood glucose and triglyceride (TG) in serum, reduced lipid accumulation by downregulate the level of TG in the liver and improved liver tissue structure in NAFLD mice (p < 0.05). Meanwhile, camel milk had a positive modulatory effect on the intestinal flora of NAFLD mice, increasing the relative abundance of beneficial bacteria and decreasing the relative abundance of harmful bacteria in the intestinal flora of NAFLD mice, and silymarin had a similar modulatory effect. At the genus level, camel milk increased the relative abundance of Bacteroides, norank_f_Muribaculaceae and Alloprevotella and decreased the relative abundance of Dubosiella and Coriobacteriaceae_UCG-002 (p < 0.05). Camel milk also enhanced Carbohydrate metabolism, Amino acid metabolism, Energy metabolism, Metabolism of cofactors and vitamins and Lipid metabolism in NAFLD mice, thus reducing the degree of hepatic lipid accumulation in NAFLD mice and maintaining the normal structure of the liver. In conclusion, camel milk can improve the structure and diversity of intestinal flora and enhance the levels of substance and energy metabolism in NAFLD mice, which has a positive effect on alleviating NAFLD and improving the structure of intestinal flora.
Introduction
Non-alcoholic fatty liver disease (NAFLD), a major community health challenge for the World Health Organization, is one of the most common and preventable liver diseases, affecting approximately one-quarter of the population, and is expected to become a worldwide epidemic in the future (1, 2). According to the severity of liver disease, NAFLD is classified as simple hepatic lipid accumulation, hepatic steatosis, inflammatory infiltration of liver cells, liver fibrosis, cirrhosis, and hepatocellular carcinoma. Currently, some studies also called hepatic lipid accumulation and hepatic steatosis as metabolic associated fatty liver disease (MAFLD) (3). NAFLD occurs for a variety of reasons, including but not limited to unhealthy eating habits, obesity, physical or psychological stress, and insulin resistance; and the development of NAFLD is a risk signal for the development of diabetes, atherosclerosis, and other metabolic syndromes (4–7). Generally, a healthy person can convert sugar and fat into energy through digestion, absorption, and metabolism or store them as glycogen and lipid droplets through liver metabolism. However, the liver will convert a large amount of blood glucose and triglycerides that cannot be consumed into lipid droplets and store them in fat cells because of a lack enough of exercise or consuming a high-fat and high-sugar diet for a long time. Firstly, lipid droplets accumulate in the liver, and the liver’s function of glycolipid metabolism will be impaired, and then lipid droplets will accumulate in the waist and abdomen, causing non-alcoholic fatty liver and obesity. Overeating in obese people causes the body to resist insulin due to sudden rise and drop in blood glucose (6). Due to the body’s resistance to insulin, high blood glucose increases the burden of liver glucolipid metabolism which damages the liver. In addition, the “double hit” theory and the “multiple hit” theory are also leading to the occurrence of NAFLD. “Double hit” means that NAFLD is caused by hepatic steatosis and a subsequent systemic inflammatory response (8–10). The “multiple-hit” theory is an extension of the “double-hit” theory, which states that NAFLD is caused by impairments of physiological functions, including insulin resistance, lipotoxicity, oxidative damage, endoplasmic reticulum stress, mitochondrial dysfunction, adipose tissue dysfunction, innate immune dysregulation, and cytokine secretion (11, 12). Improving dietary structure, increasing exercise, enhancing body immunity, clinical medication, cold stimulation, and local hyperthermia therapy were considered to prevent and treat NAFLD. However, such methods have certain limitations, and clinical medications generally have certain nephrotoxicity, so the use of functional foods (Functional foods are foods with specific nutritional health functions, which are suitable for consumption by specific groups of people and have the function of regulating the body, not for the purpose of treatment) to alleviate liver lipid deposition and adjuvant treatment of NAFLD is necessary (13, 14).
Camel milk, known as “desert platinum” because of its minimal production, is a nutritionally balanced food with various biological functions such as anti-allergy, antioxidant, and antihypertensive (15). Because camel milk is rich in immunoglobulins IgG, IgA, and various vitamins (vitamin A, vitamin B2, vitamin C, and vitamin E), lower in fatty acids and cholesterol, and lacking in allergens because of the absence of beta-lactoglobulin, camel milk is often used in arid regions of Asia and Africa as a treatment for asthma, edema, and diabetes (15–18). In addition, camel milk protects the kidney from oxidative stress by Nrf2/HO-1 and AKT/eNOS/NO pathway and maintains kidney function. Several researches have demonstrated that camel milk significantly alleviate alcoholic liver disease by activating the IL-17 and TNF pathways (19–23). Type II diabetes is a typical metabolic disorder with significant insulin resistance and unstable blood glucose before the onset of the disease. Camel milk effectively regulated blood glucose and availably improved the body’s insulin resistance and prevented type II diabetes (24, 25).
The intestinal flora, a complex ecosystem, is closely linked to the health of the body. The intestinal flora and its metabolites (such as amino acids, nucleotides, polysaccharides, lipids, vitamins, antibiotics, toxins, hormones) are important factors affecting the health of the body, and changes in the structure of the intestinal flora often mean the onset of disease (26, 27). In the process of establishing a diarrhea model, Bao et al. (28) found that the intestinal flora structure of mice changes over time, with the relative abundance of beneficial bacteria decreasing and the relative abundance of harmful bacteria increasing. Treatment of obesity and type II diabetes by improving intestinal flora has been reported (29–31). Camel milk has also been reported to alter intestinal flora in mice, which increased the relative abundance of Allobaculum and Akkermansia and a decreased Erysipelotrichaceae and Desulfovibrionaceae (32). Therefore, camel milk can be considered to be used to regulate the intestinal flora of NAFLD mice and improve the metabolic status of the body, alleviating NAFLD.
In this study, NAFLD model was established by feeding C57BL/6J mice with high-fat diet for 12 weeks. Meanwhile, camel milk, cow milk, and silymarin were gavaged daily to mice in camel milk group, cow milk group and silymarin group, respectively. The changes of the physiological and biochemical indexes of NAFLD mice were observed to study the effects of camel milk, cow milk and silymarin on the alleviation of NAFLD and the intestinal flora of mice.
Materials and methods
Experimental reagents and preparation of camel milk
Total triglycerides (TG) kit (Item No. A110-1-1) and Total cholesterol (TC) kit (Item No. A111-1-1) were purchased from Nanjing Jiancheng Institute of Biological Engineering. ELISA kit obtained from Shanghai EnzymeLink Biotechnology Co. Silymarin and carboxymethyl cellulose were purchased from Shanghai Yuanye Biological Co.
Camel milk and cow milk were collected from the pasture area of Alax Right Banner, Alax League, Inner Mongolia, China. Fresh camel milk was transported back to the laboratory after quick-freezing in liquid nitrogen, and stored at −80°C. Frozen camel milk was thawed in cold water, centrifuged (4°C, 5000 r min–1, 30 min) to separate the fat, freeze-dried, sieved and packaged, and stored at 4°C. High-fat feed (45% fat, 17% fructose, 1.25% cholesterol, No. TP32003) was purchased from Nantong TROPHY Feed Technology Co. Camel milk, cow milk and silymarin were mixed with 0.5% carboxymethylcellulose (CMC), respectively.
Animal ethics statement
Fifty SPF-grade male C57BL/6J mice were purchased from SPF (Beijing) Biotechnology Co., Ltd. Animals were housed in IVC animal experimental system with a housing temperature of 20°C ± 1°C, relative humidity of 50% ± 5%, and a 12-h day/night cycle. Mice were acclimatized and fed for 7 days prior to the start of the test, with free access to food and sterile distilled water. The control diet was gradually replaced with high-fat diet during acclimatization feeding. All animal experiments are conducted in strict accordance with the guidelines for the care and use of laboratory animals as described by the National Institutes of Health, minimizing the amount of mice and reducing their suffering while achieving the experimental objectives. The experimental program was approved by the Ministry of Education Key Laboratory of Dairy Biotechnology and Engineering, Inner Mongolia Agricultural University (License No.: SYXK Meng 2020-0002). During the experimental period, the NC group was fed the control diet, and the other groups were fed high-fat feed.
Experimental grouping and establishment of non-alcoholic fatty liver disease mice model
After 7 days of acclimatization feeding, fifty mice were randomly divided into negative control group (NC group, n = 10), model group (Mod group, n = 10), camel milk group (CaM group, n = 10), cow milk group (CoM group, n = 10), and positive control group (PC group, n = 10). After 12 weeks, the NAFLD model that was characterized by increased liver index and the levels of TG and TC in the liver was established. To alleviate NAFLD in mice, camel milk, cow milk and silymarin were administered by gavage. Twice daily (9:00 a.m and 4:00 p.m), CaM group was gavaged with camel milk (3.0 g/kg/d), CoM group was gavaged with cow milk (3.0 g/kg/d), PC group was gavaged with silymarin (200 mg/kg/d), Mod group and NC group were gavaged with 0.5% CMC (0.2 ml/d/per) (Table 1). The oral glucose tolerance test (OGTT) and insulin tolerance test (ITT) were measured at 13 weeks in each group of mice with fasting without water for 12 h. The mice were anesthetized with 3% pentobarbital sodium (45 mg/kg) and sacrificed by severing the neck. Blood sample, liver tissues and colon contents were collected. Serum was isolated from blood samples by centrifugation at 3,000 r/min, for 20 min at 4°C. The liver was used for the preparation of HE-stained sections to observe pathological structure. The levels of TG and TC in serum and liver were measured and the diversity of intestinal flora was analyzed, respectively.
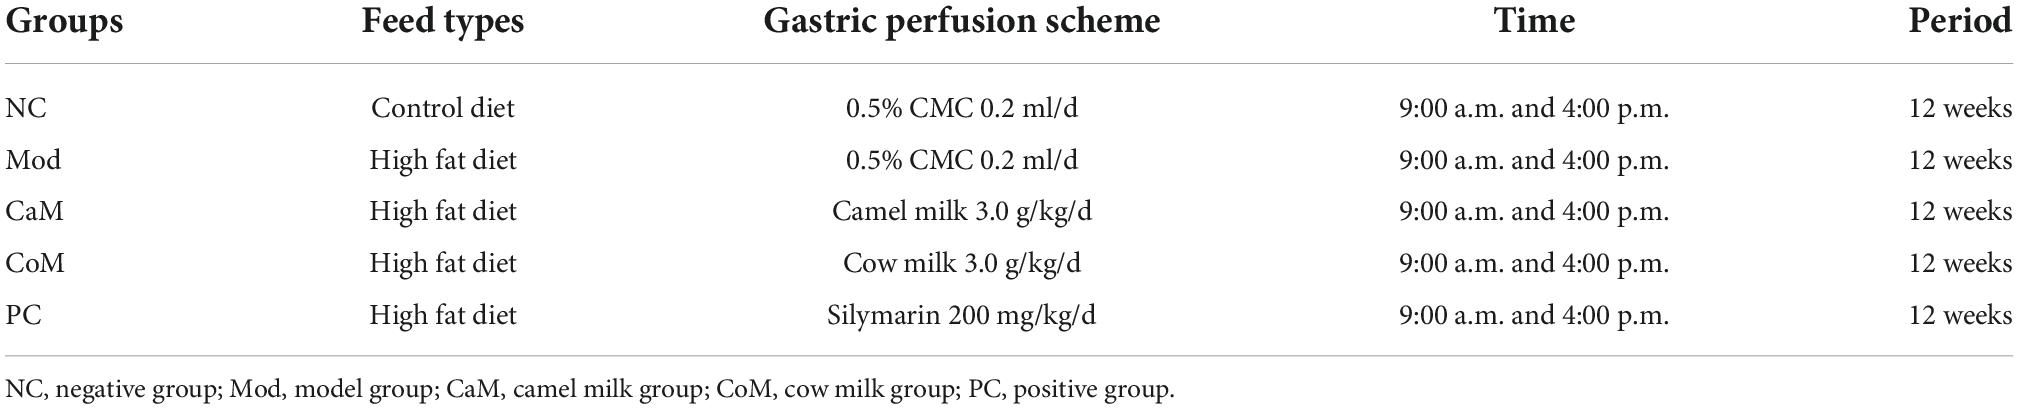
Table 1. Animal grouping and handing.
Detection of physiological indexes and observation of animal phenotype
Body weight, blood glucose, liver index, and the levels of TG and TC in the liver are important indices. Body weight and blood glucose of mice were measured weekly, blood glucose was detected using a blood glucose meter. Feed consumption was weighed and recorded every 3 days. The liver was weighed after dissecting the mice and the liver index was calculated. Liver was used to determine TG level and TC level and to make pathological sections (hematoxylin eosin staining) for observing the pathological structure of the liver. Liver tissue samples stored in 4% paraformaldehyde were gradient dehydrated and paraffin-embedded, and then cut into 5-μm sections. The sections were stained with hematoxylin staining solution and eosin staining solution, dried and placed under a microscope to observe the liver tissue structure. Liver index is calculated as follows.
Detection of biochemical indexes
The levels of alanine transaminase (ALT), aspartate aminotransferase (AST), leptin (LEP), adiponectin (ADPN), high density lipoprotein cholesterol (HDL-c), low density lipoprotein cholesterol (LDL-c), interleukin (IL-6), tumor necrosis factor-alpha (TNF-alpha), and insulin (INS) in serum were measured according to manufacturer’s instructions by ELISA kits (Item number are ml063179, ml058577, ml002287, ml057809, ml037765, ml037825, ml063159, ml002095, ml001983, respectively). And the levels of total triglycerides (TG) and total cholesterol (TC) in serum and liver were detected, respectively.
After 12 weeks of gavage, mice were fasted without water for 12 h and gavaged with 30% glucose solution (1.5 g/kg), then the blood glucose values were measured at 0, 30, 60, 90, and 120 min. Mice were given intraperitoneal injection of insulin (0.5 U/kg), and the blood glucose values at 0, 30, 60, 90, and 120 min were detected. While the area under the curve of ITT and OGTT were calculated. According to the formulas, the insulin resistance index (HOMA-IRI) and insulin sensitivity index (HOMA-ISI) were calculated (33).
Fins is mice fasting insulin, FBG is mice fasting blood glucose.
DNA extraction and PCR amplification
To observe the differences in intestinal flora different groups of mice, fresh fecal was collected in lyophilization tubes and quick-frozen in liquid nitrogen during week 12, and DNA of mouse intestinal flora was extracted using the E.Z.N.A.Cycle-Pure Kit (Omega BIO-TEK, Norcross, GA, USA) (Table 2). DNA integrity was detected by 1% agarose gel electrophoresis. The DNA purity and concentration were assayed by NanoDrop2000 (Thermo Scientific, Wilmington, NC, USA). The V3-V4 variable region of bacterial 16S rRNA were amplified by an ABI GeneAmp 9700 PCR thermocycler (ABI, CA, USA). The PCR amplification of 16S rRNA genes was performed as follows: initial denaturation at 95°C for 3 min, followed by 30 cycles of denaturing at 95°C for 30 s, annealing at 55°C for 30 s, extension at 72°C for 8 min, and end at 4°C. Quantitative analysis was performed using PCR after amplification (Table 3). PCR amplification results were detected by 2% agarose gel electrophoresis, purified using AxyPre DNA Gel Extraction Kit (Axygen Biosciences, Union City, CA, USA), and quantified using Quantus™ Fluorometer (Promega, Madison, WI, USA). Primer information and PCR reaction conditions are listed below.
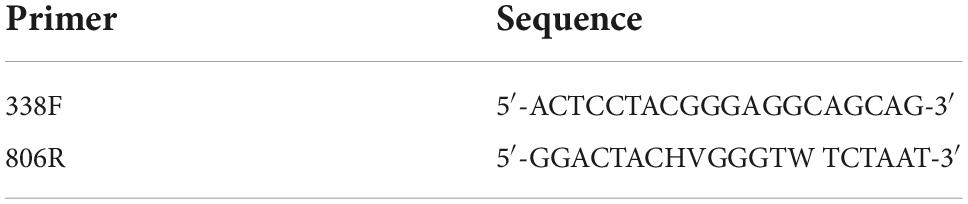
Table 2. Primer sequence.
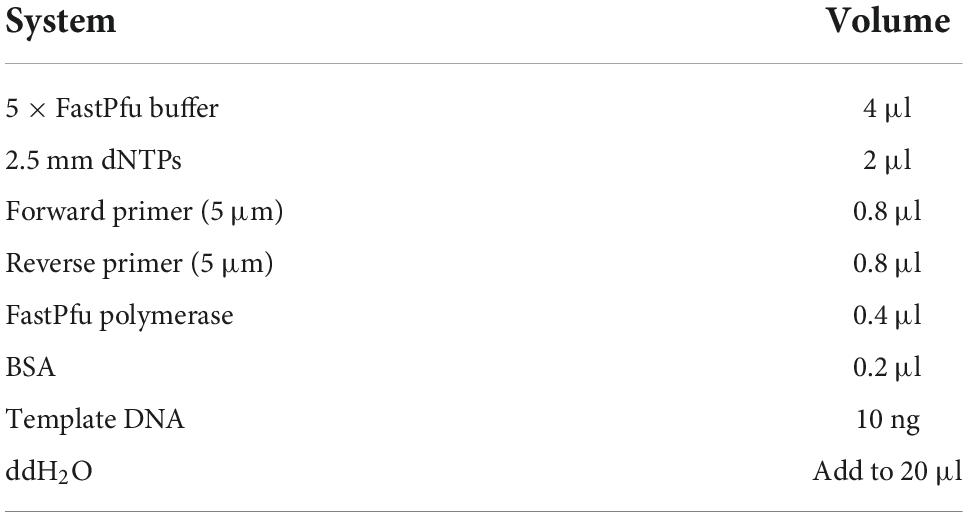
Table 3. PCR amplification system.
Illumina MiSeq sequencing
Purified amplicons were pooled in equimolar and paired-end sequenced on an Illumina MiSeq PE300 platform/NovaSeq PE250 platform (Illumina, San Diego, CA, United States) according to the standard protocols by Majorbio Bio-Pharm Technology Co. Ltd. (Shanghai, China). The raw reads were deposited into the National Center of Biotechnology Information (NCBI) Sequence Read Archive (SRA) database (accession number: PRJNA889750).
Processing of sequencing data
The original 16S rRNA was isolated screened and combined using the method of Bao et al. (28). The specific conditions were as follows: (i) the 300 bp reads were truncated at any site receiving an average quality score of <20 over a 50 bp sliding window, the truncated reads shorter than 50 bp were discarded, and reads containing ambiguous characters were also removed; (ii) only overlapping sequences longer than 10 bp were assembled according to their overlapped sequences; the maximum mismatch ratio of overlap region is 0.2; reads that could not be assembled were discarded; (iii) samples were distinguished according to the barcode and primers, and the sequence direction was adjusted, exact barcode matching, 2 nucleotide mismatch in primer matching.
Operational taxonomic units (OTUs) with 97% similarity cutoff were clustered using UPARSE version 7.1, and chimeric sequences were identified and removed. The taxonomy of each OTU representative sequence was analyzed by RDP Classifier version 2.2 against the 16S rRNA database (e.g., Silva v138) using a confidence threshold of 0.7.
Statistics and analysis of data
Mothur software (v.1.30.2) was used to calculate the alpha diversity index of OTU level, such as Ace, Chao, and Shannon index, and draw the dilution curve. Beta diversity distance matrix was calculated by Qiime software, and principal co-ordinates analysis (PCoA) and non-metric multidimensional scaling (NMDS) diagrams were drawn, respectively. Through linear discriminant analysis effect size (LEfSe) method, the species with significant differences in abundance among different groups were found, and the final difference species were obtained by linear discriminant analysis (LDA). The gene function was predicted and analyzed by PICRUSt2 software, and the relative abundance heat map of functional modules was drawn to find out KEGG metabolic pathway involved by intestinal microbes. All the above drawings were made with R language tools.
The experimental data were expressed as mean ± SD. SPSS 23 software was used for statistical analysis, and Graphpad prism 9.0 was used for drawing. After one-way analysis of variance (ANOVA), statistical analysis between groups was performed by Duncan’s multiple range tests, and the differences were considered as significance at p < 0.05. Bioinformatic analysis was carried out on Majorbio I-Sanger cloud platform.
Results
Establishment of non-alcoholic fatty liver disease mouse model and the effect of camel milk on the physiology of non-alcoholic fatty liver disease mice
Mice fed high-fat diet for 12 weeks to establish NAFLD model. As shown in Figures 1A–C, at the beginning of the experiment, there were no significant differences in food intake, body weight, and blood glucose between the groups of mice (p > 0.05). With the progress of the experiment, the food intake, body weight, and blood glucose of the mice in each group showed an increasing trend. The upward trend of mice in the Mod group was higher than all other groups. At week 12 (Table 4), mice in the Mod group had significantly higher body weight and blood glucose than all other groups (p < 0.05).
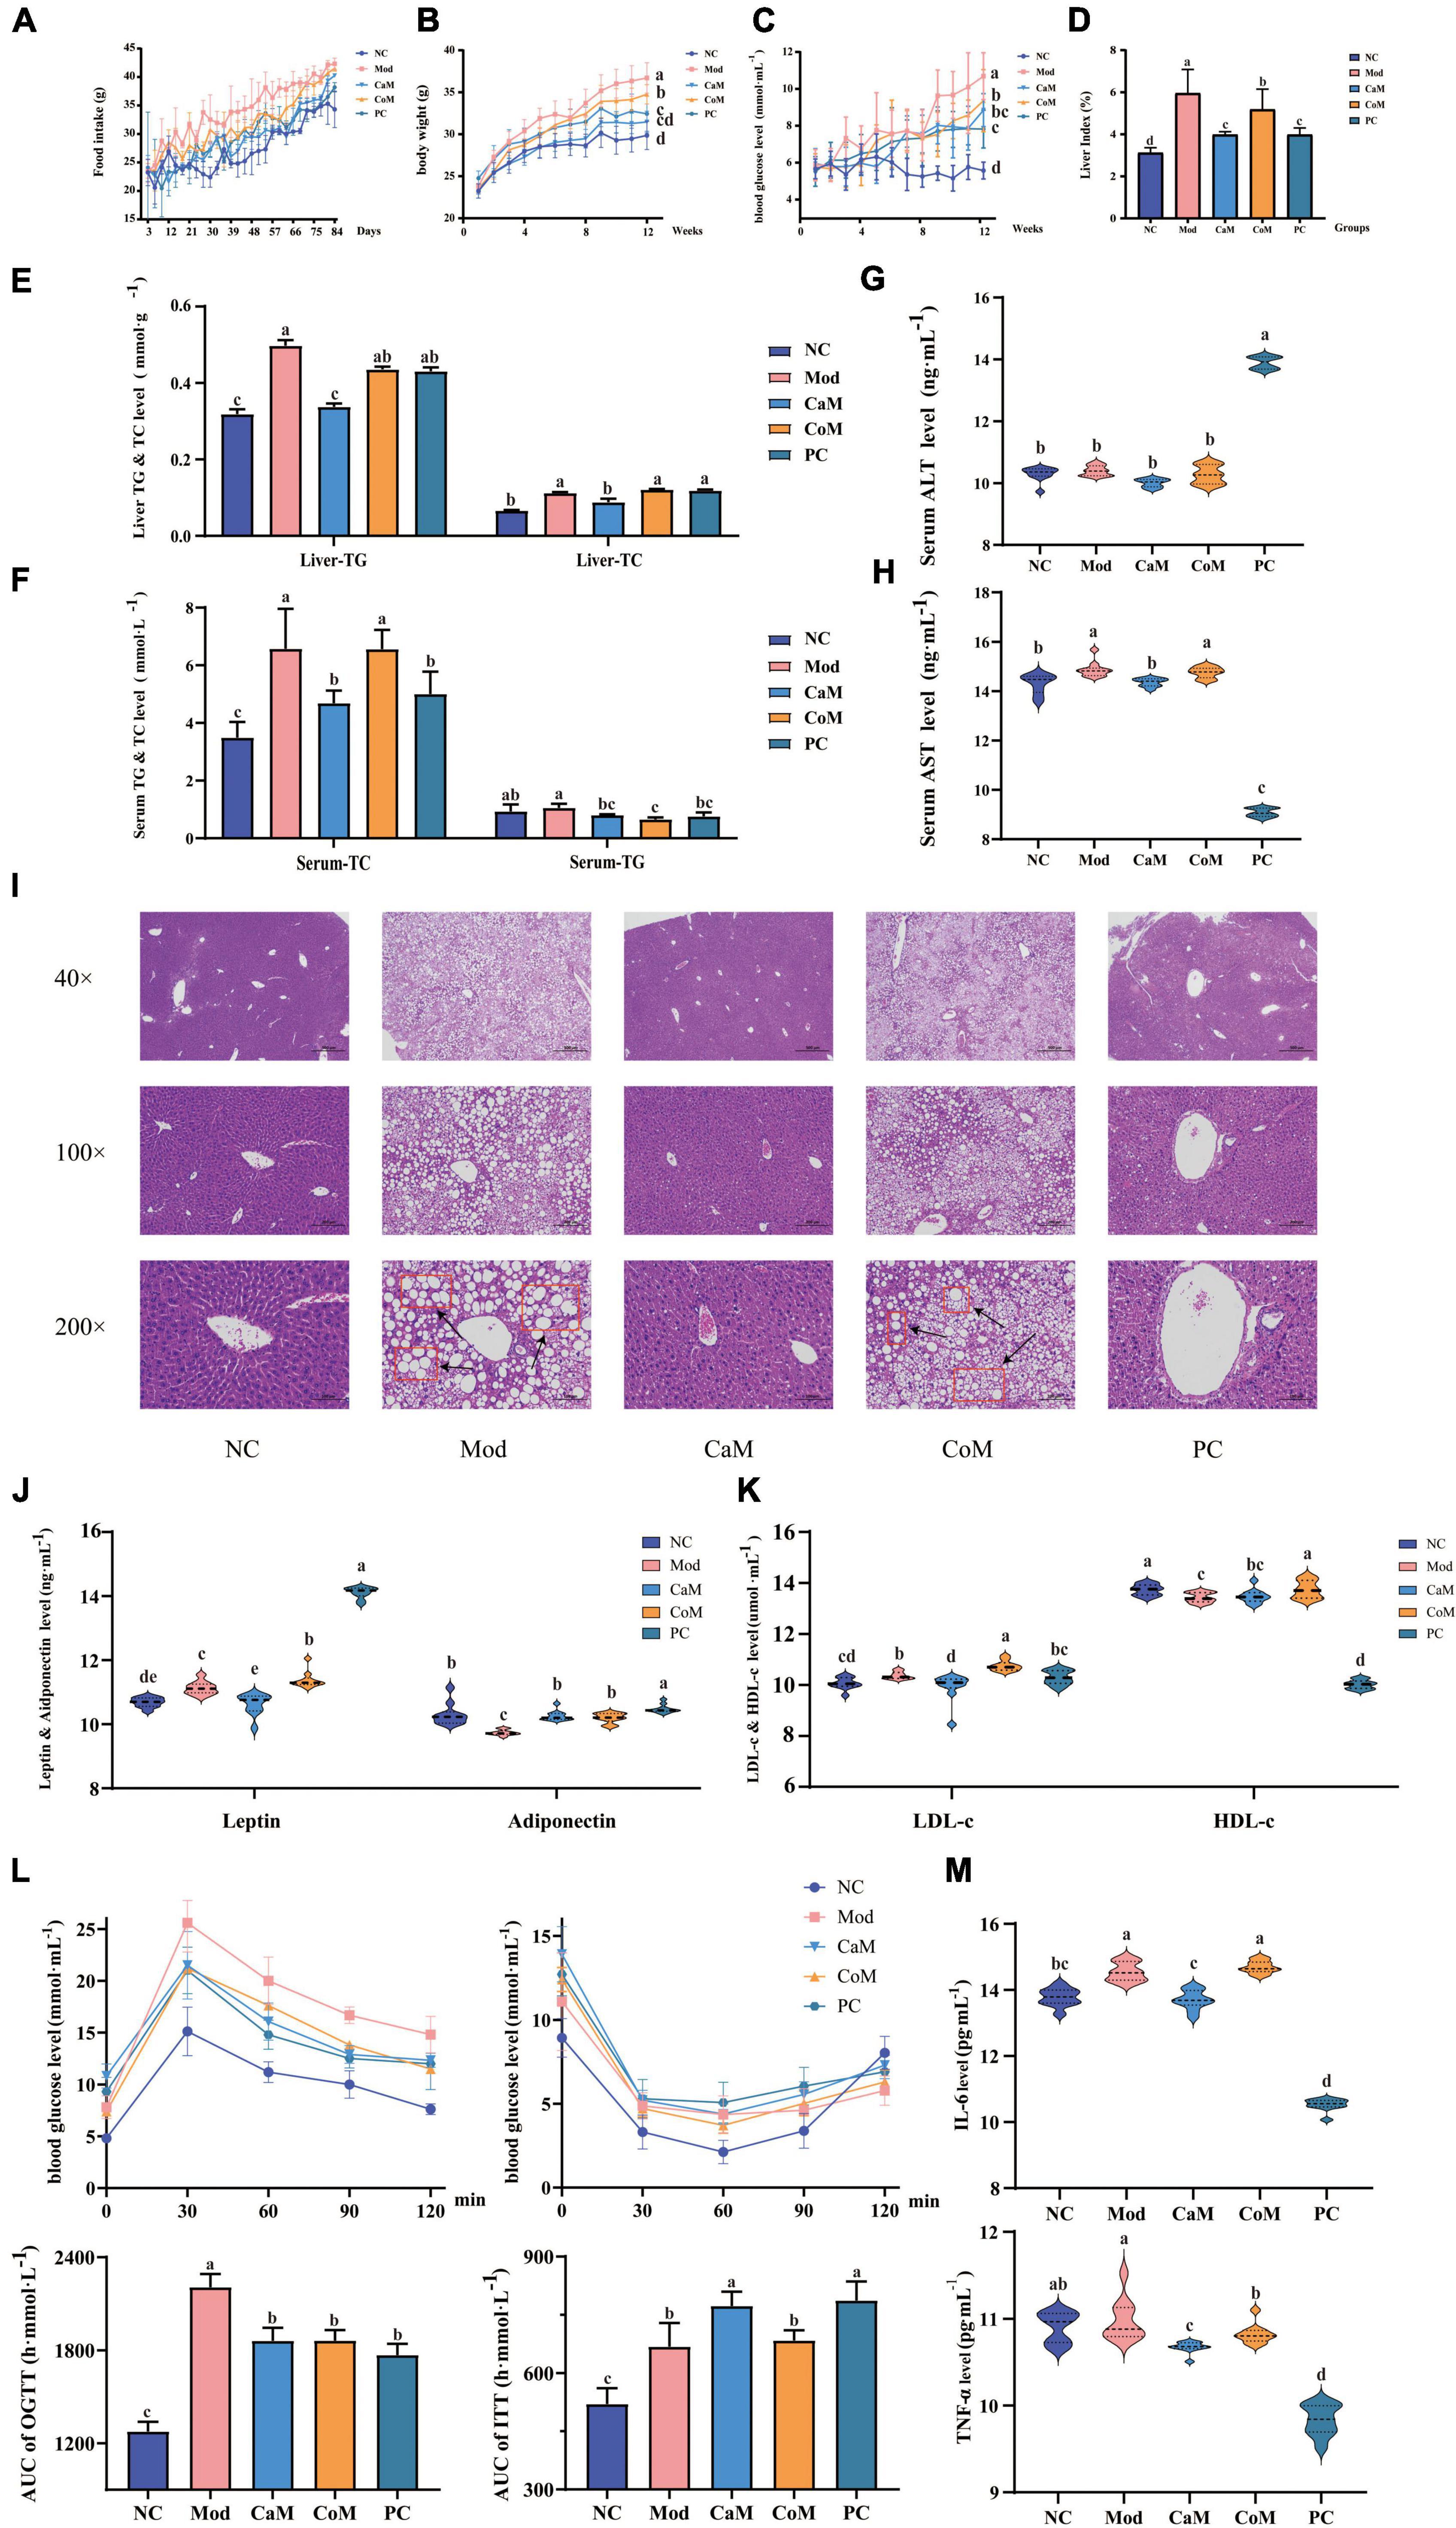
Figure 1. Physiological indicators and serum biochemical indicators: (A) Food intake. (B) Body weight. (C) Blood glucose. (D) Liver index. (E) The levels of triglyceride (TG) and total cholesterol (TC) in liver. (F) The levels of TG and TC in serum. (G) Serum alanine transaminase (ALT) level. (H) Serum aminotransferase (AST) level; (I) Liver pathology section. (J) The levels of leptin and adiponectin in serum. (K) The levels of low density lipoprotein cholesterol (LDL-c) and high density lipoprotein cholesterol (HDL-c) in serum; oral glucose tolerance test (OGTT) and insulin tolerance test (ITT) (L). (M) The levels of interleukin (IL-6) and tumor necrosis factor-alpha (TNF-α) in serum. The experimental results are expressed as the mean ± SD. n = 10.
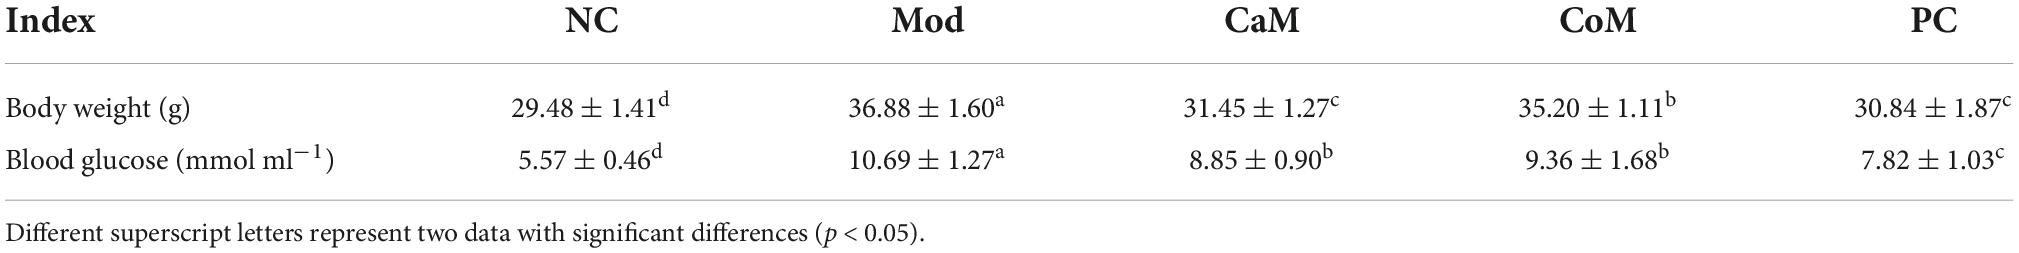
Table 4. Body weight and blood glucose at 12 weeks.
Non-alcoholic fatty liver disease is characterized by abnormally large liver, excessive accumulation of TG in the liver, hepatic steatosis, and structural damage to liver tissue. At week 12 (Figures 1D–F), the liver index and the levels of TG and TC in the liver of mice in the Mod group were notably higher than that of the NC group (p < 0.05). The TC level in serum in Mod group was significantly higher comparing with NC group (p < 0.05). However, there were not significantly difference between Mod group and NC group in serum TG level (p > 0.05, Figures 1E,F). In CaM group, the levels of TG and TC were reduced significantly in the serum and the liver (p < 0.05, Figures 1E,F).
The levels of AST and ALT in serum are important indicators to determine the extent of NAFLD development in mice. In our study (Figures 1G,H), there was no significant difference in ALT levels between the NC and Mod groups (p > 0.05), while AST levels in the Mod group were significantly higher than those in the NC group (p < 0.05). In addition, it can be observed from the histological sections of liver pathology that compared to the NC group (dense structure and neatly arranged hepatocytes), the Mod group of mice had severe lipid accumulation in the liver, the tissue structure was severely disrupted, and the hepatocytes were not arranged in a specific order (Figure 1I). After intervention of camel milk, the level of AST was decreased significantly in serum of mice (p < 0.05).
Leptin, adiponectin, HDL-c, and LDL-c are important indicators of lipid metabolism in the body. Compared with the NC group, the levels of leptin and LDL-c in serum were significantly increased and the levels of adiponectin and HDL-c were significantly decreased in the Mod group (p < 0.05). However, the levels of leptin and LDL-c were significantly lower and adiponectin in serum was significantly higher in the CaM group compared with Mod group (p < 0.05). There was not significantly difference in the serum HDL-c level between CaM group and Mod group (p > 0.05, Figures 1J,K).
Glucose tolerance, insulin tolerance, insulin sensitivity, and insulin resistance index respond to the glucose metabolism ability of the mice (Table 5). As shown in Figure 1L, the insulin tolerance of mice in the Mod group was severely impaired, and the blood glucose values of mice in the Mod group were significantly higher than mice in the NC group at 0, 30, 60, and 90 min (p < 0.05). Contrary to expectations, it was found that camel milk and silymarin interventions did not reduce the degree of impairment of insulin tolerance in mice by calculating the area under the ITT curve (Figure 1L). Figure 1L showed that the glucose tolerance of the mice in the Mod group suffered impairment, and the blood glucose values of the mice in the Mod group were significantly higher than other groups at 30, 60, 90, and 120 min (p < 0.05). And camel milk and silymarin regulated the glucose tolerance of the mice to different degrees (Figure 1L).
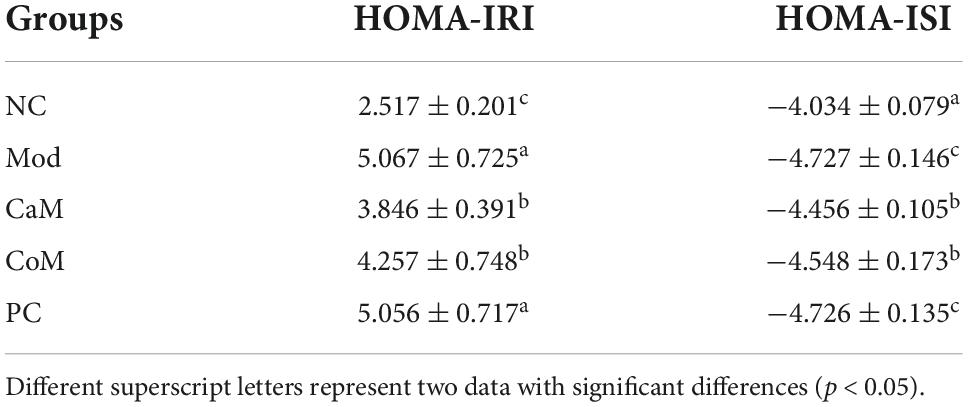
Table 5. Insulin resistance index and insulin sensitivity index of each group.
In addition, the inflammation indicators of IL-6 and TNF-α were measured. The level of IL-6 in serum was upregulated in Mod group comparing with NC group. After intervening of camel milk and silymarin, the levels of IL-6 and TNF-α were reduced significantly in serum in mice of CaM group and PC group. Camel milk and silymarin slowed down the in inflammatory response in mice with NAFLD (p < 0.05, Figure 1M).
Sequencing data quality evaluation and analysis of bacterial alpha diversity and beta diversity
To evaluate the sequencing quality and depth of the 16S rRNA gene in the colonic contents of NAFLD mice, Sob index and Shannon index dilution curves were plotted. The Sob index curve gradually increased with the increase of sample sequencing depth and finally leveled off. And the Shannon index curve reached a plateau (Figures 2A,B). The sequencing coverage was good, and the Coverage index was higher than 0.99 (Table 6), which can truly reflect the microbial community status in the samples. The Ace and Chao indices reflect the richness of the microbial communities contained in the samples. Compared to the NC group (Table 6), there was no significant difference in the Ace index and Chao index in the Mod group (p > 0.05). After 12 weeks of camel milk and silymarin intervention, the Ace index and Chao index were significantly higher in the CaM group and PC group compared to the Mod group (p < 0.05); the Ace index and Chao index were not significantly different between the CoM and Mod groups (p > 0.05). In summary, camel milk and silymarin can enhance the diversity of intestinal flora Alpha in NAFLD mice.
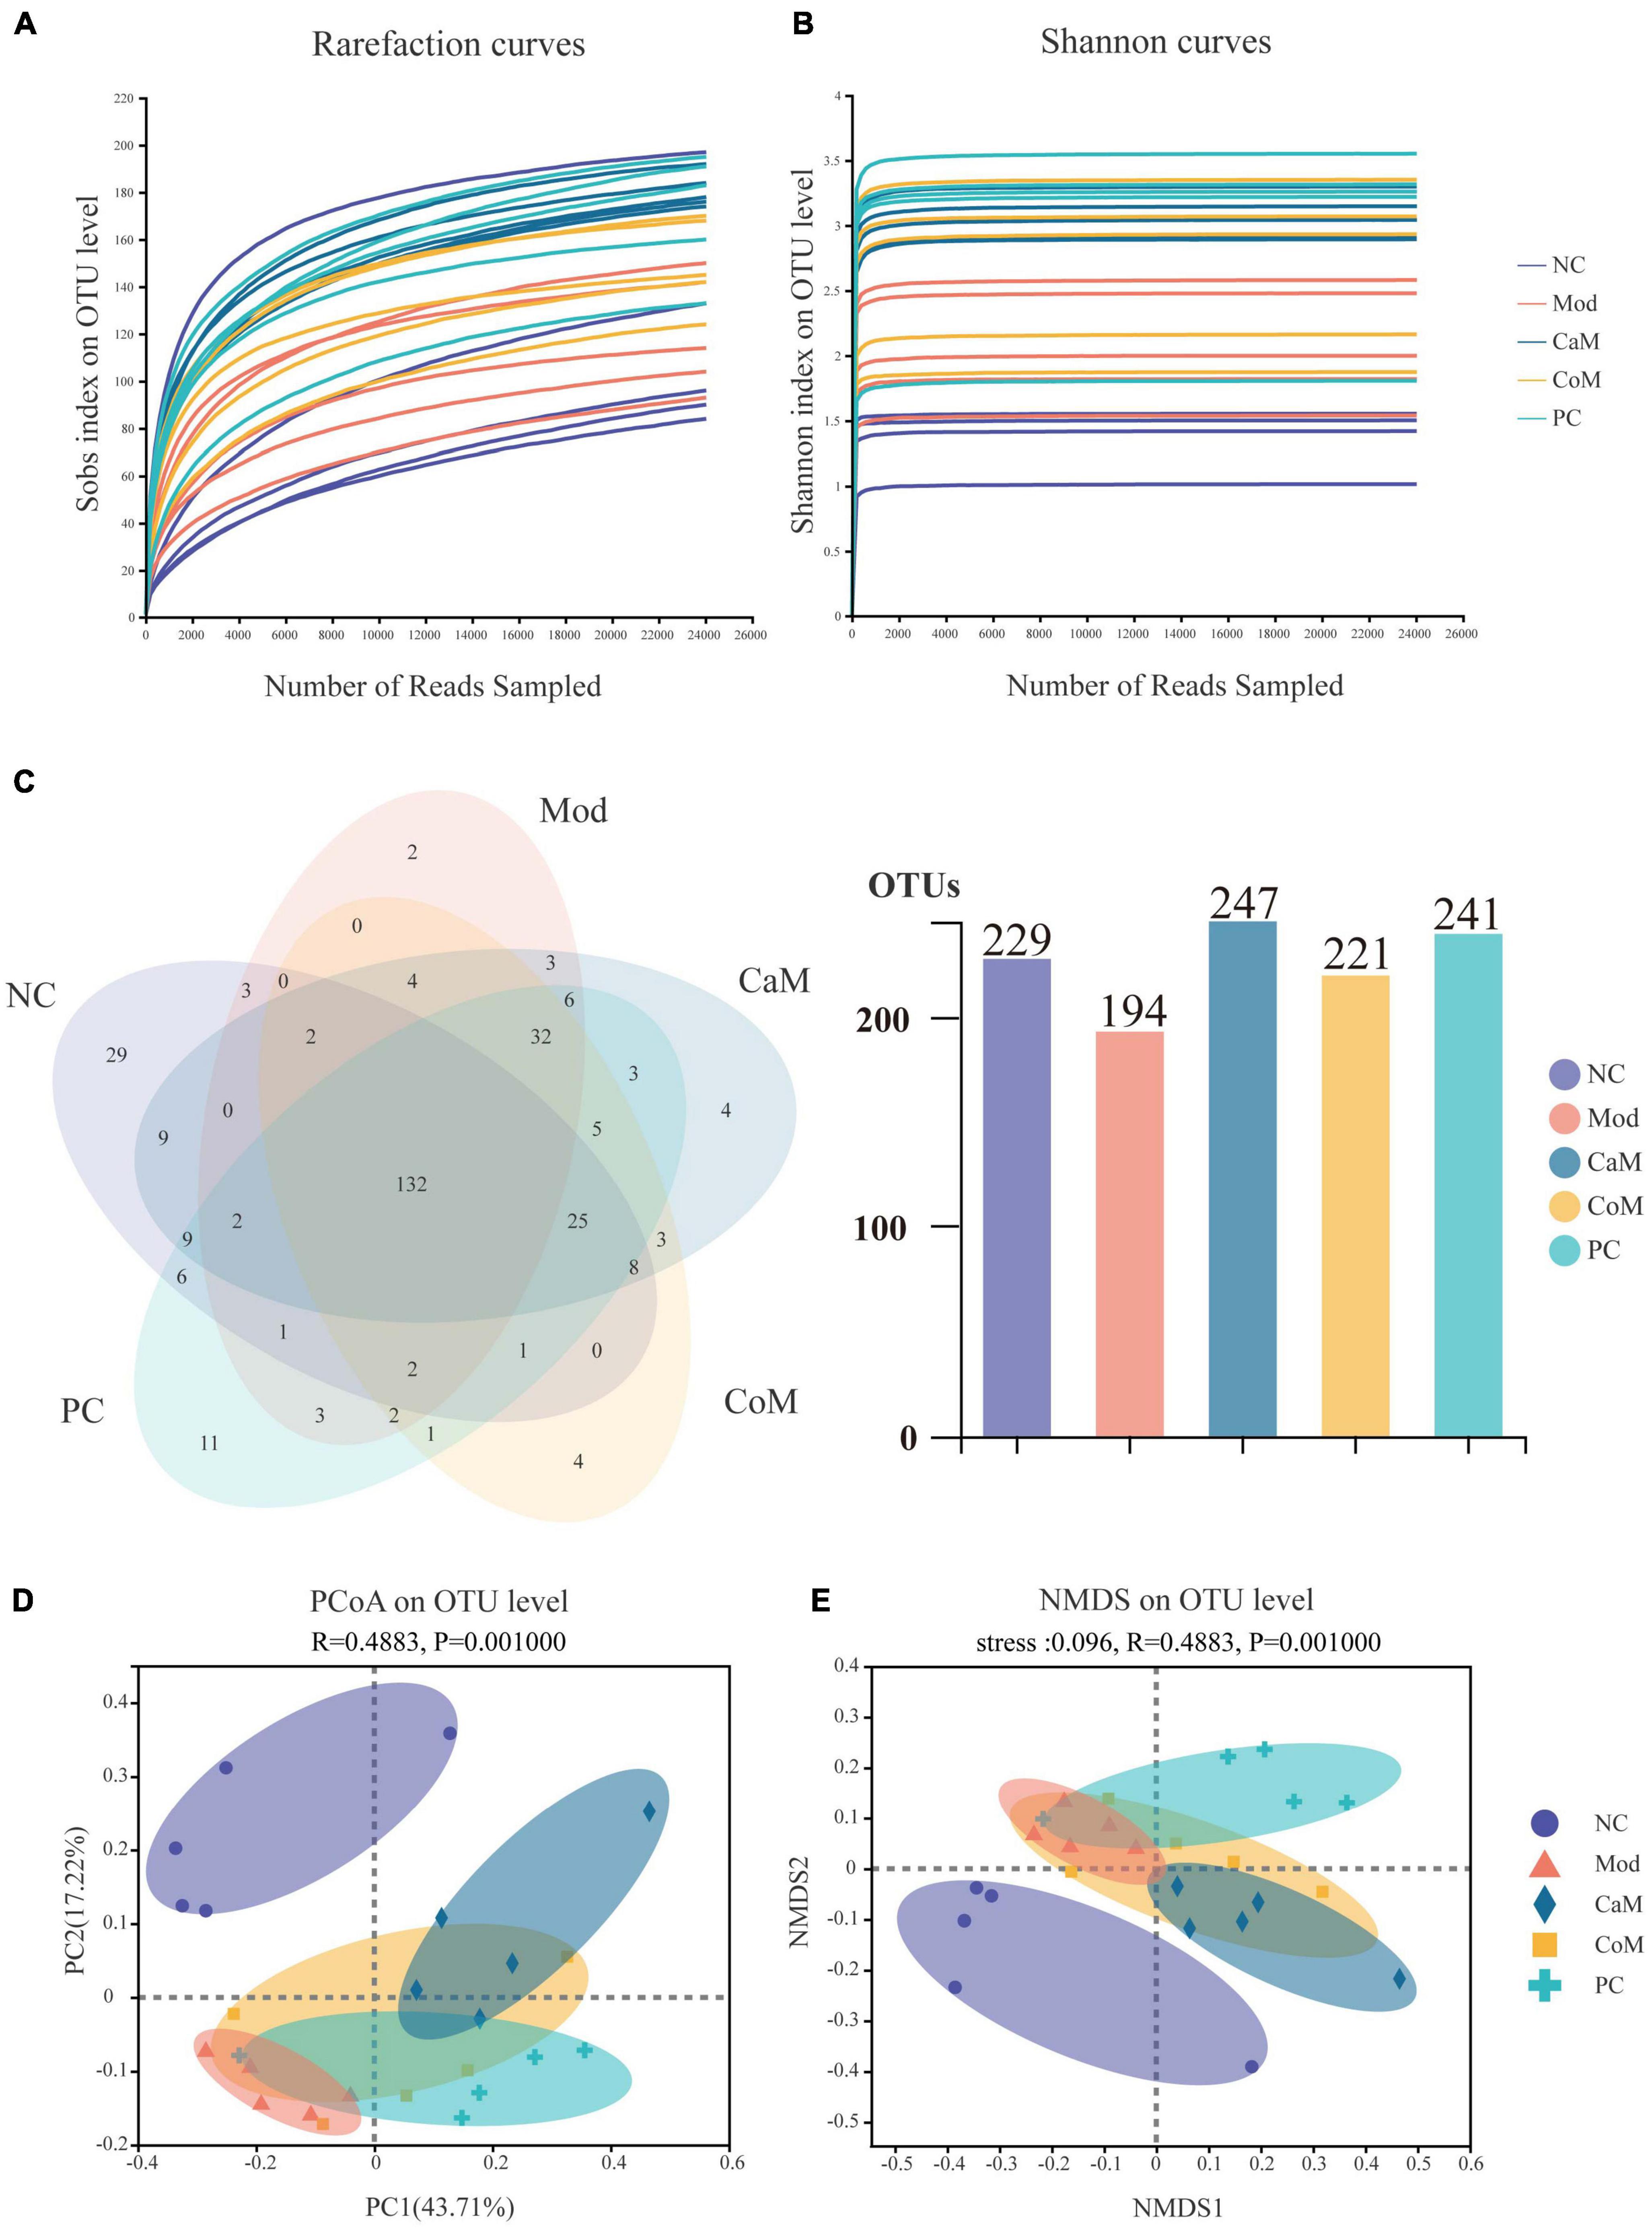
Figure 2. (A) Rarefaction curves. (B) Shannon curves. (C) Venn of operational taxonomic units (OTUs). (D) PCoA analysis of bacterial beta-diversity of intestinal flora. (E) NMDS analysis of bacterial beta-diversity of intestinal flora.
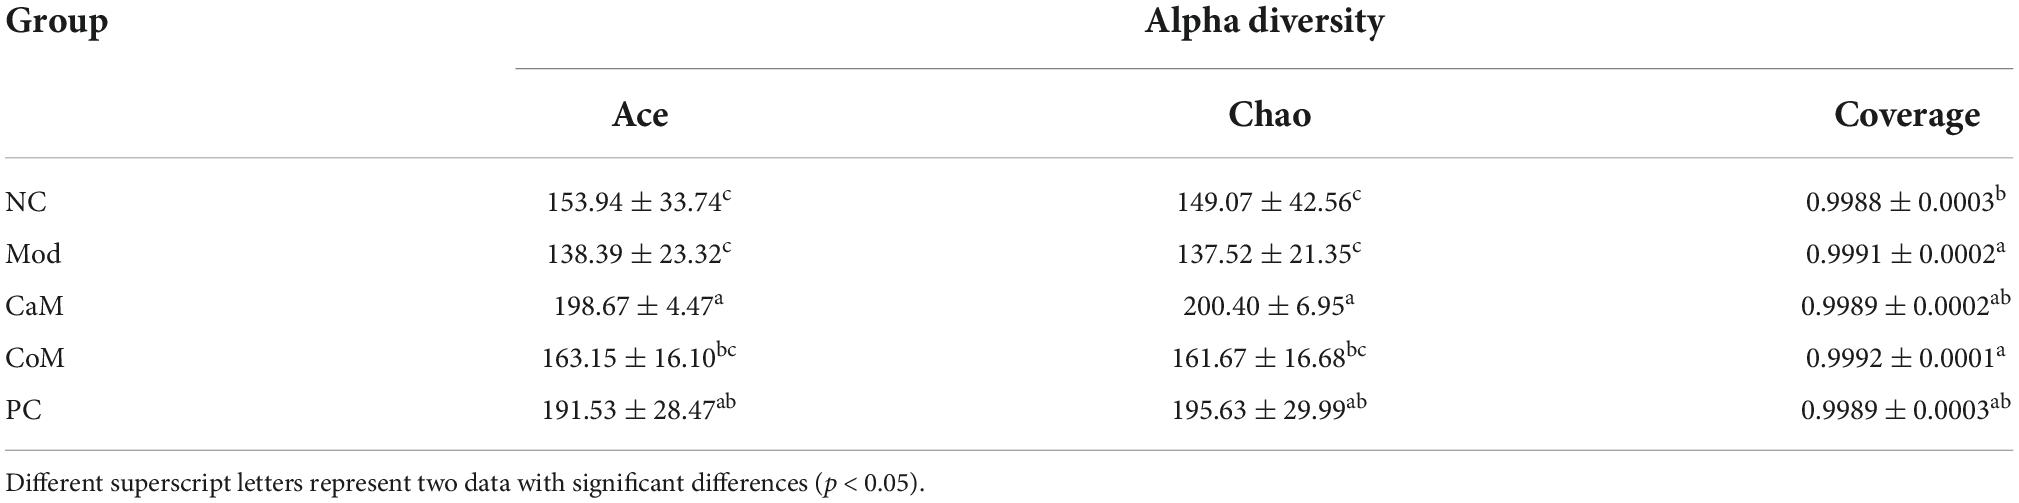
Table 6. Alpha diversity.
A total of 321 OTUs were detected by sequencing (Figure 2C). Long-term intake of a high-fat diet affecting the structure of the intestinal flora led to a decrease in the number of OTUs in the intestinal contents of mice, which may be due to differences in the structure of the diet. Compared with the Mod group, there were 53 more OTUs in the CaM group, 27 more OTUs in the CoM group, and 47 more OTUs in the PC group (Figure 2C).
To understand the overall differences in intestinal flora diversity between different groups, PCoA and NMDS plots were drawn based on the Brary-Curtis distance algorithm (Figures 2D,E). Samples with smaller differences in gut microbial community composition were distributed closer in the graph. As shown in Figure 2D, the samples of NC group were discrete, and the aggregation area of Mod group was smaller; however, Mod group and NC group mice were significantly separated (p < 0.05), indicating that the structure of intestinal flora has been changed in Mod group observably. The CaM group and the Mod group were distributed in different areas and far away from each other, indicating that the composition of the intestinal microbial community differed greatly between these two groups. The distribution areas of samples in the CoM, CaM, and PC groups partially overlapped, which may be due to the presence of the same or similar microbial communities in these three groups. However, the composition of the gut microbial community in the CoM and PC groups was significantly different from that in the Mod group (p < 0.05). This result infers that camel milk, cow milk, and silymarin can effectively change the structure of intestinal microbial community composition in mice. Furthermore, the results of NMDS plot analysis were highly similar to PCoA plot analysis, which further demonstrated that camel milk had a good regulatory effect on the intestinal microbial community structure of NAFLD mice.
Analysis of the differences in the composition of intestinal flora between groups
The community Bar map was drawn to understand the dominant species of each group and their proportion. As Figure 3A, the intestinal flora of the NC group had mainly Firmicutes, Bacteroidota and Actinobacteriota at the phylum level. Due to the long-term intake of high-fat diet, the Mod group showed a greater difference in the structure of the bacterial flora compared to the NC group, with an increase in the relative abundance of Firmicutes and a decrease in the relative abundance of Bacteroidota and Actinobacteriota in the Mod group. At the phylum level, the main intestinal flora dominant in the CaM group were Firmicutes and Bacteroidota, and the relative abundance of Actinobacteriota was reduced and that of Desulfobacterota was increased compared with the Mod group. The dominant intestinal flora in the CoM group of mice at the phylum level were mainly Firmicutes, Bacteroidota, and Actinobacteriota. The composition of the intestinal flora of the mice in the PC group was slightly different from that of the CoM group, in which the dominant flora at the phylum level were mainly Firmicutes, Bacteroidota, and Desulfobacterota. The Firmicutes to Bacteroidota ratio is an important basis for evaluating the structure of the flora. From Figure 3A, the Firmicutes to Bacteroidota ratio was higher in the Mod group than in the NC group (NC group: 10.01, Mod group: 66.67), and it was reduced after camel milk, cow milk, and silymarin interventions (CaM group: 2.25, CoM group: 8.10, PC group: 10.86).
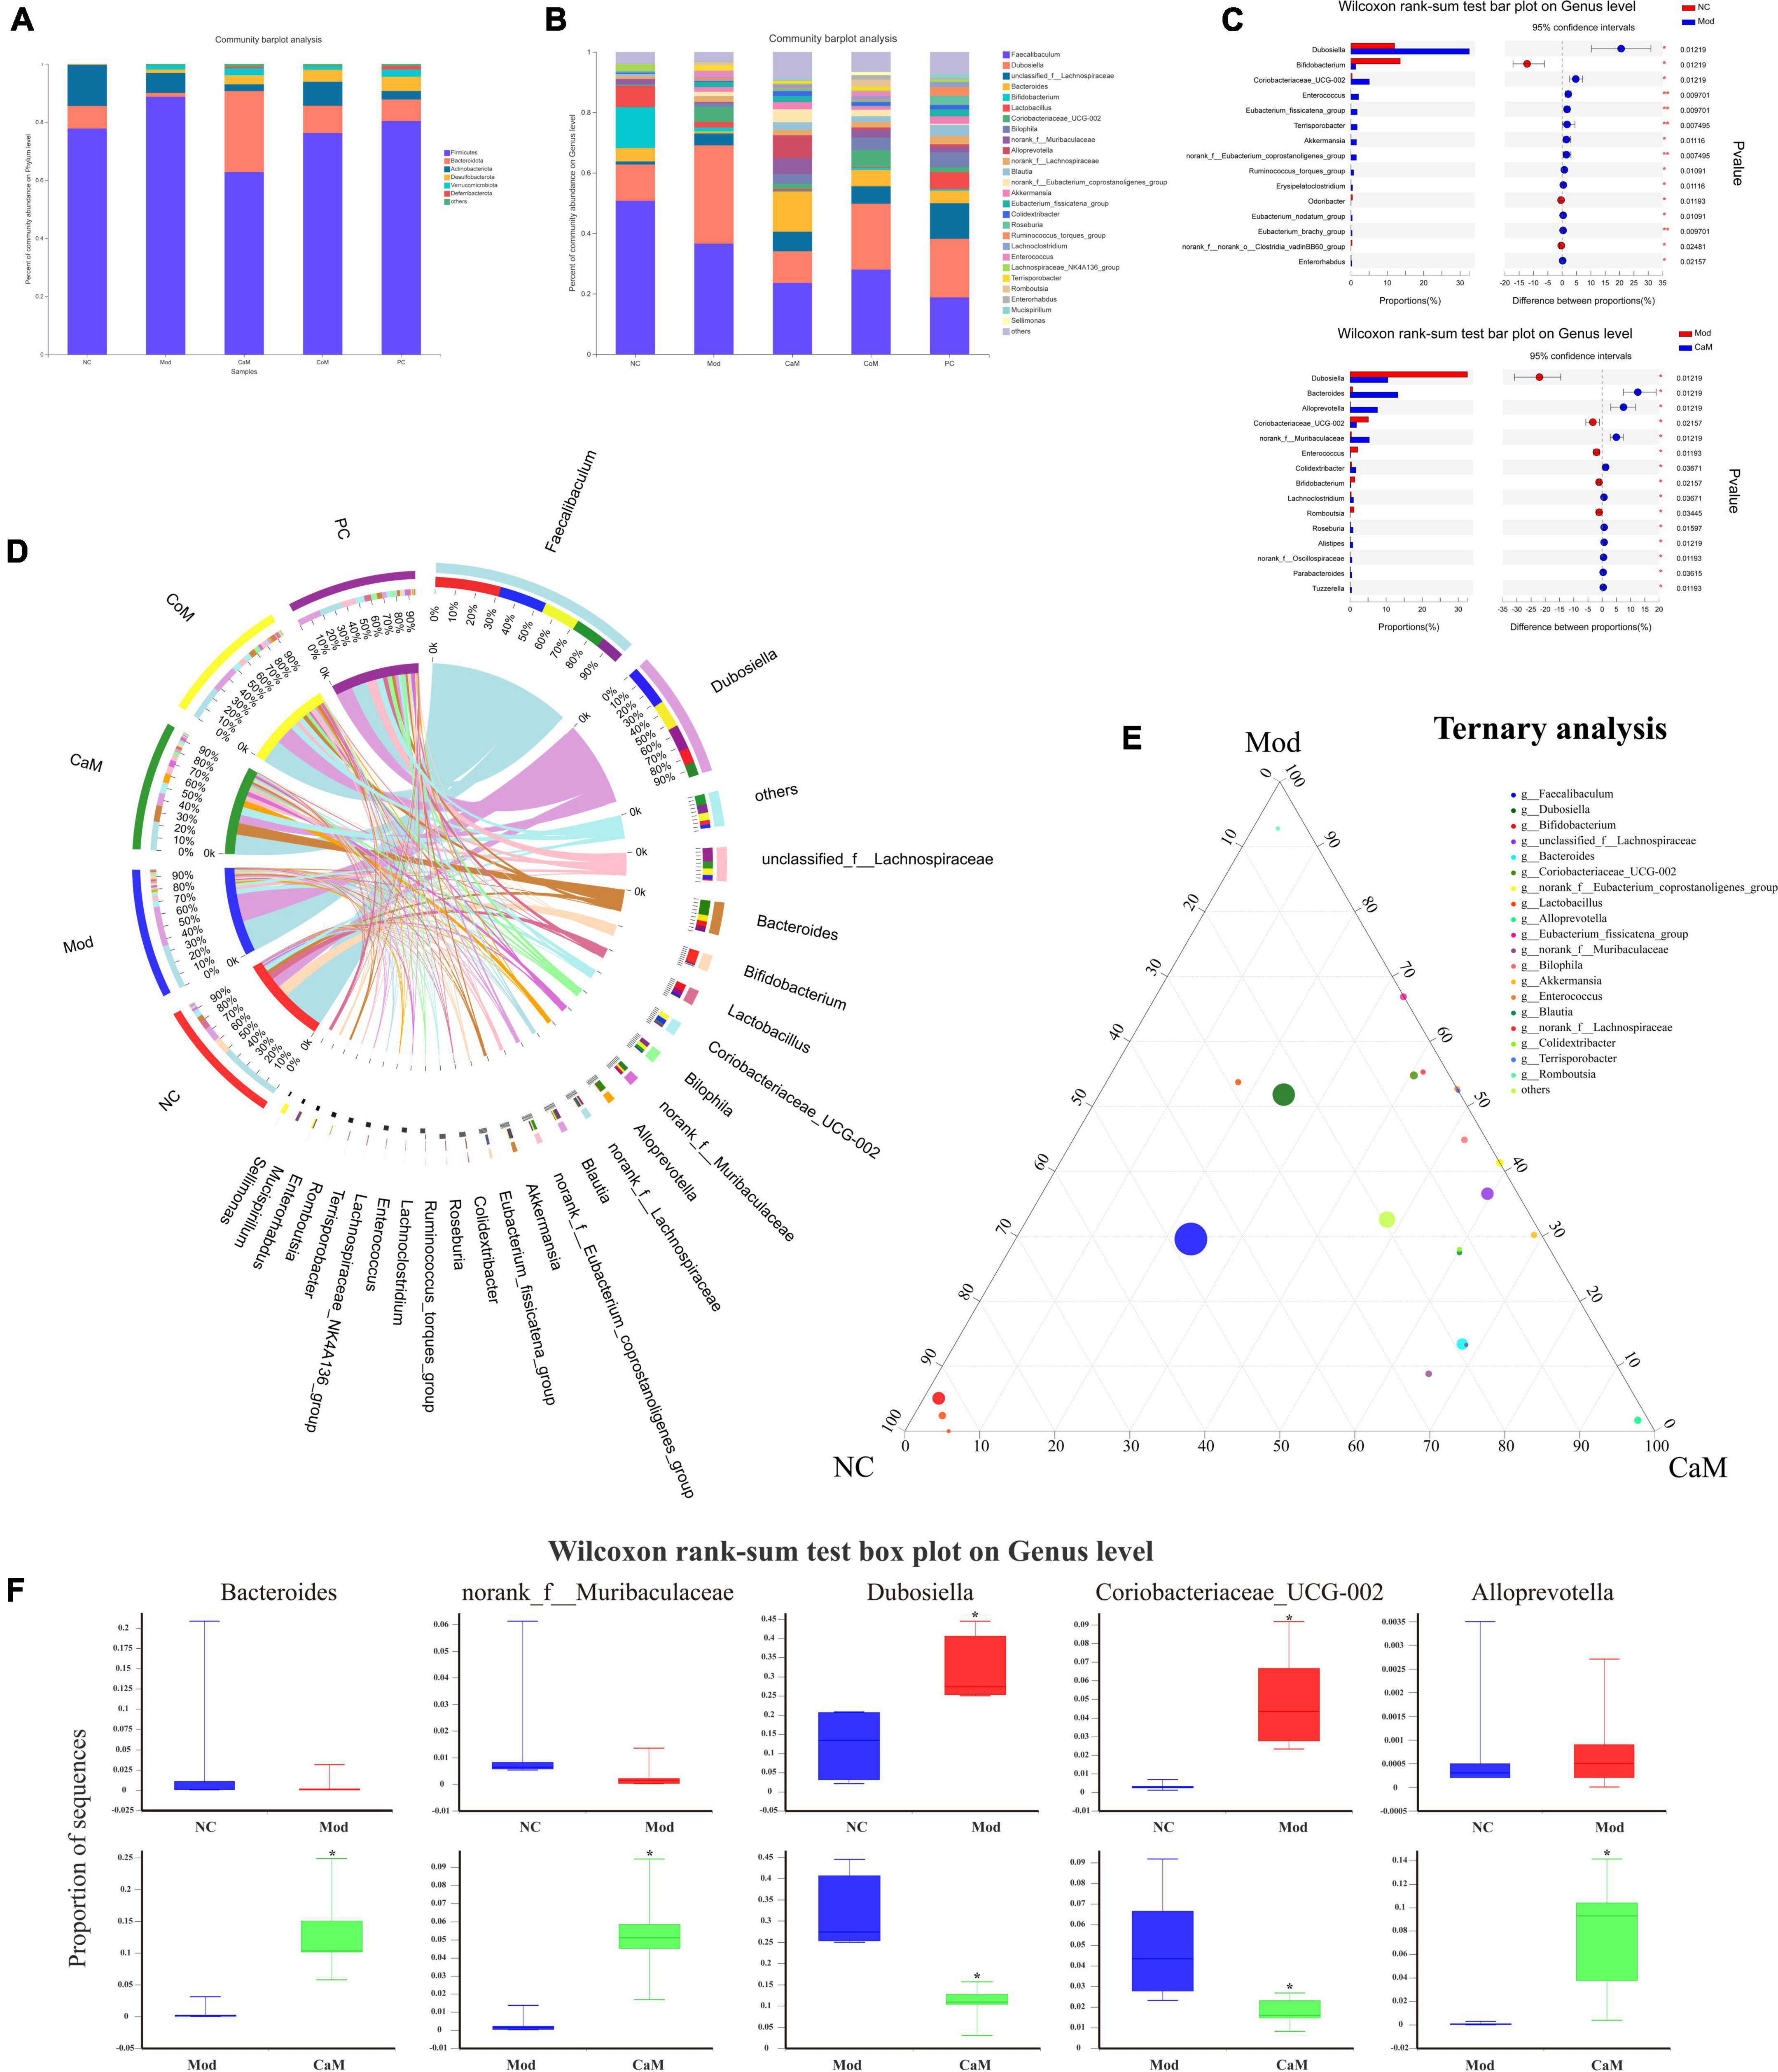
Figure 3. (A) The relative abundance of bacterial communities is at phylum level. (B) The relative abundance of bacterial communities is at genus level. (C) Relationship between groups and genus. (D) Comparation in NC, Mod, and CaM group. (E) Ternary analysis. (F) Wilcoxon rank-sum test box plot on genus level.
At the genus level, the Mod group had altered intestinal flora structure compared to the NC group (Figures 3B,D). Figure 3C showed the genus with marked differences in relative abundance in the NC, Mod, and CaM groups. Compared to the NC group, the Mod group showed a decrease in the relative abundance of Faecalibaculum, Bifidobacterium, Bacteroides, Lactobacillus, and an increase in the relative abundance of Dubosiella and unclassified_f_Lachnospiraceae,Coriobacteriaceae_UCG-002 (Figure 3D). After camel milk intervention, the relative abundance of Faecalibaculum, Dubosiella, Bifidobacterium, Lactobacillus, Coriobacteriaceae_UCG-002 were decreased and the relative abundance of unclassified_f_Lachnospiraceae, Bacteroides, norank_f_Muribaculaceae, Alloprevotella, Colidextribacter were increased in the CaM group compared to the Mod group. In addition, the relative abundance of Faecalibaculum, Dubosiella, and Coriobacteriaceae_UCG-002 were increased and Bacteroides was decreased in the CoM group compared to the CaM group. Compared with the Mod group, the relative abundance of Faecalibaculum, Dubosiella and Coriobacteriaceae_UCG-002 were decreased, and Bacteroides, norank_f_Muribaculaceae and Colidextribacter were increased in the PC group. The results are consistent with the changes of CaM group. According to the ternary analysis, five important genuses were screened and intergroup comparison was done for each of these five genuses, which were Bacteroides, norank_f_Muribaculaceae, Dubosiella, Coriobacteriaceae_UCG-002, and Alloprevotella (Figures 3E,F).
To display the taxonomic differences in bacterial groups between groups, LEfSe analysis was performed and the species with statistically different bacterial diversity in relative abundance between groups were shown in the Figures 4A,B. At the genus level, Faecalibaculum, Bifidobacterium and Lactobacillus were main differential microbiota in NC group; Dubosiella and Enterococcus were main differential microbiota in Mod group; Bacteroides, Alloprevotella, norank_f_Muribaculaceae, unclassified_o_Bacteroidales, and UCG-005 were main differential microbiota in CaM group; Coriobacteriaceae_UCG-002 and Romboutsia, were main differential microbiota in CoM group; unclassified_f_Lachnospiraceae, Bilophila, Blautia, and Roseburia were main differential microbiota in PC group. Therefore, camel milk, cow milk, and silymarin cause alterations in the intestinal flora of NAFLD mice of significantly different species.
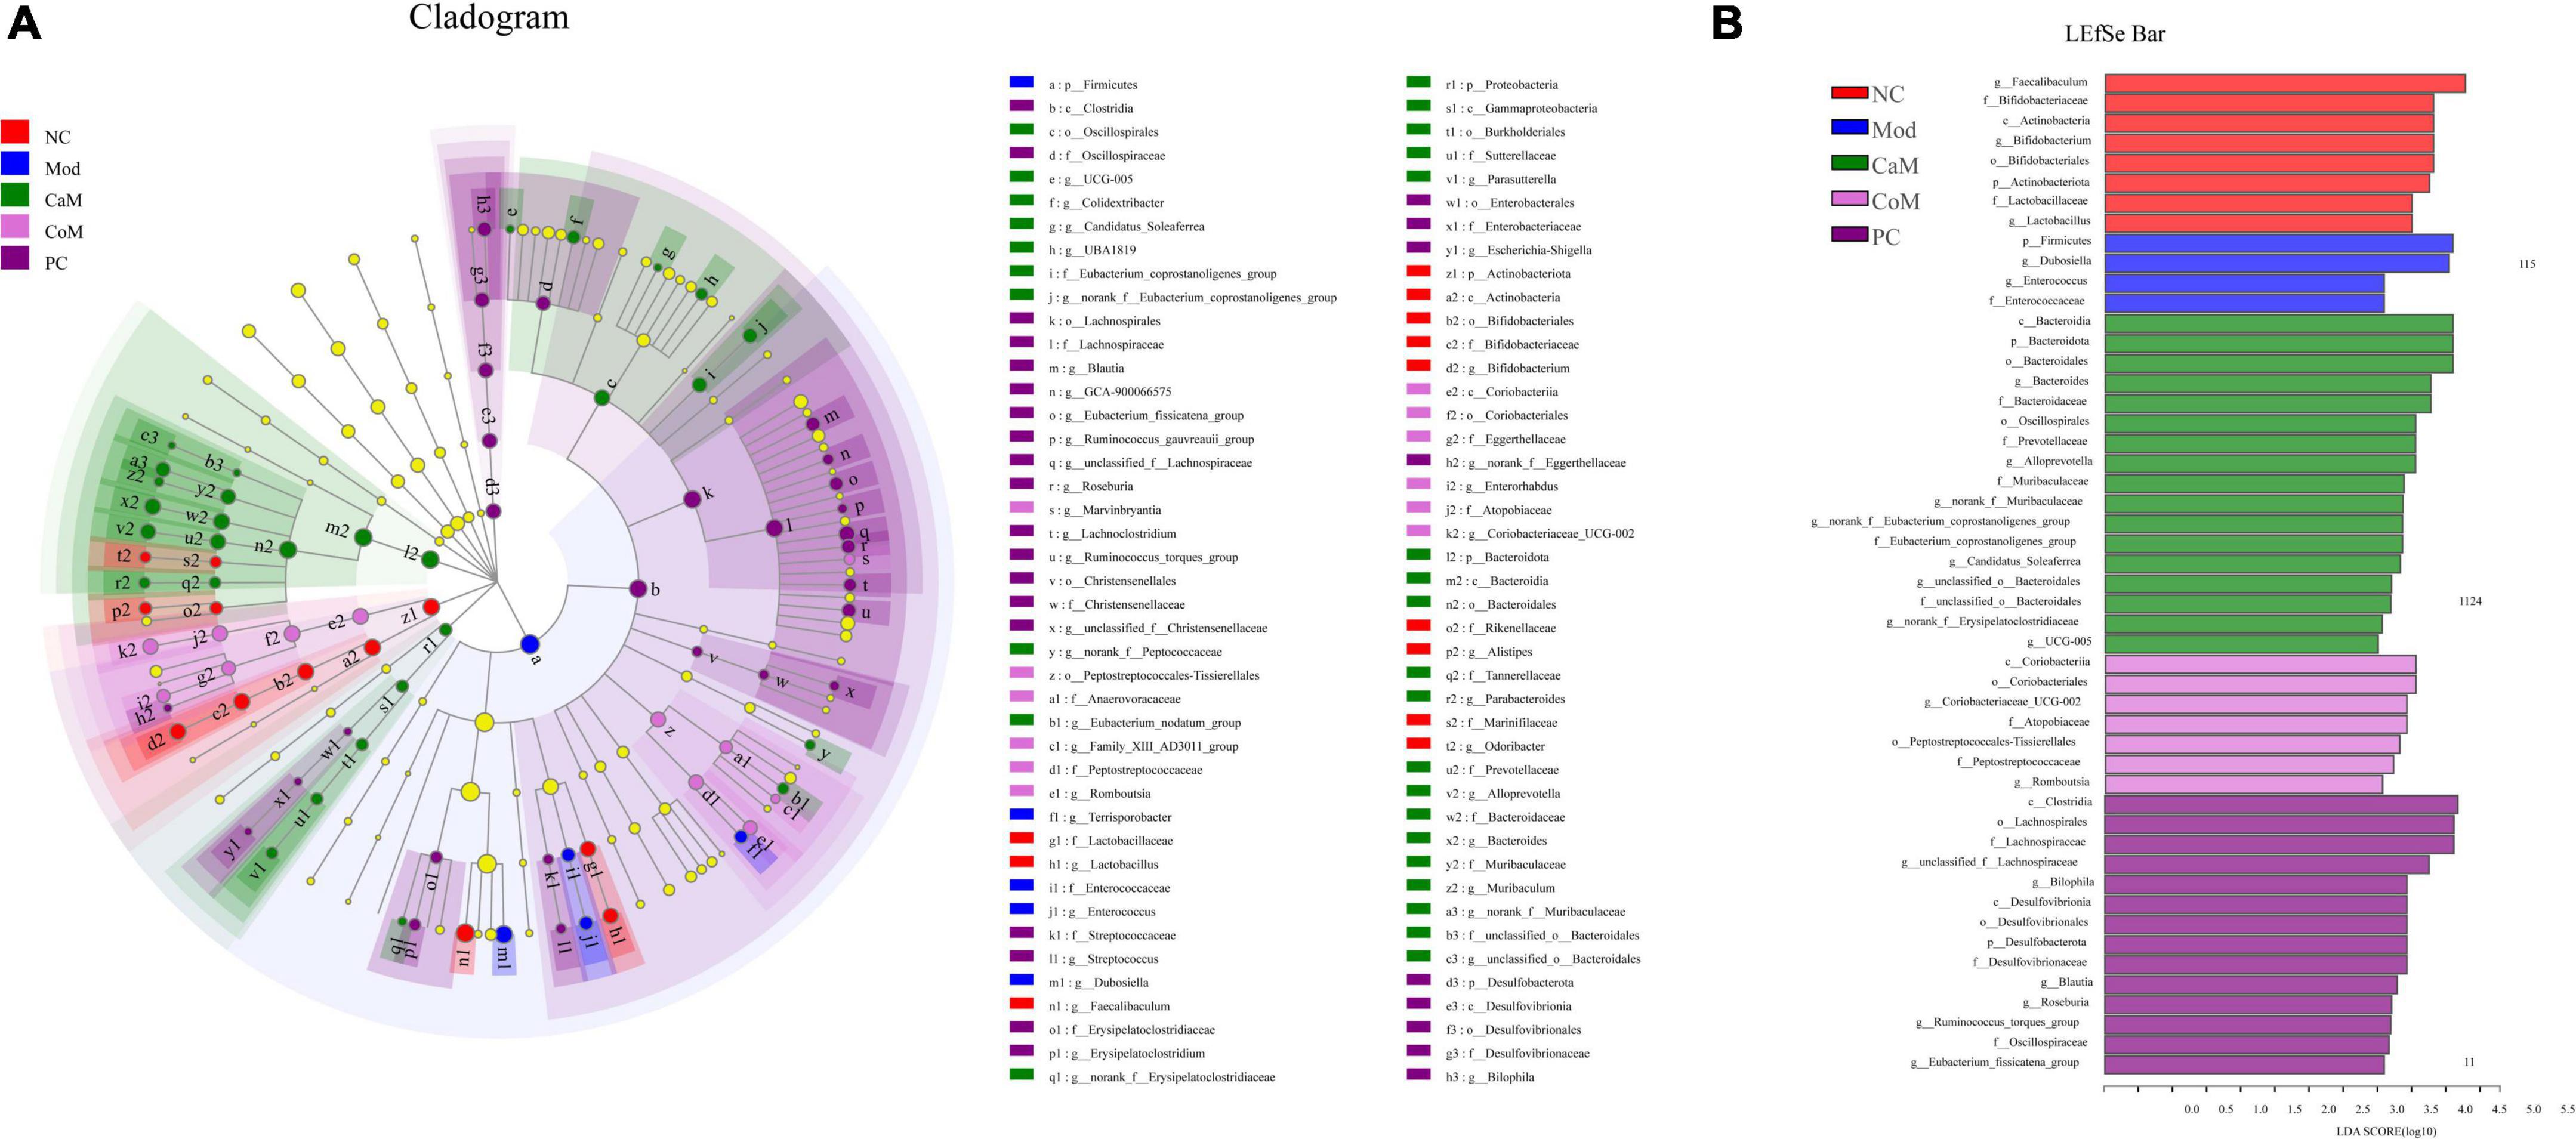
Figure 4. (A) LEfSe multi-level species hierarchy tree diagram, the circles from inner to outer in the diagram represent the phylum, class, order, family, and genus levels, each circle at different taxonomic levels represents a taxon under that level, the diameter of the circle is proportional to the relative abundance, species with significant differences follow the grouping for coloration, species without significant differences are in yellow. (B) Histogram of linear discriminant analysis (LDA) discrimination results, LDA value > 2.5.
The relationship between physiological indicators and genuses
To study the relationship between various physiological and biochemical indices and genus of mice in each group, the variance inflation factor (VIF) scores of various physiological and biochemical indices were conducted (Table 7). The indices with VIF < 10 were screened out. The correlation analysis between the screened physiological and biochemical indices and genus of bacteria was conducted (Figure 5). The results found that the relative abundance of Dubosiella, Coriobacteriaceae_UCG-002 significantly and positively correlated with body weight, blood glucose, the levels of leptin, LDL-c in serum, and the levels of TG in liver. Bacteroides, norank_f_Muribaculaceae, Alloprevotella positively correlated with TG level in serum, and negatively correlated with TG level in liver. This result was consistent with the Section “Results.”
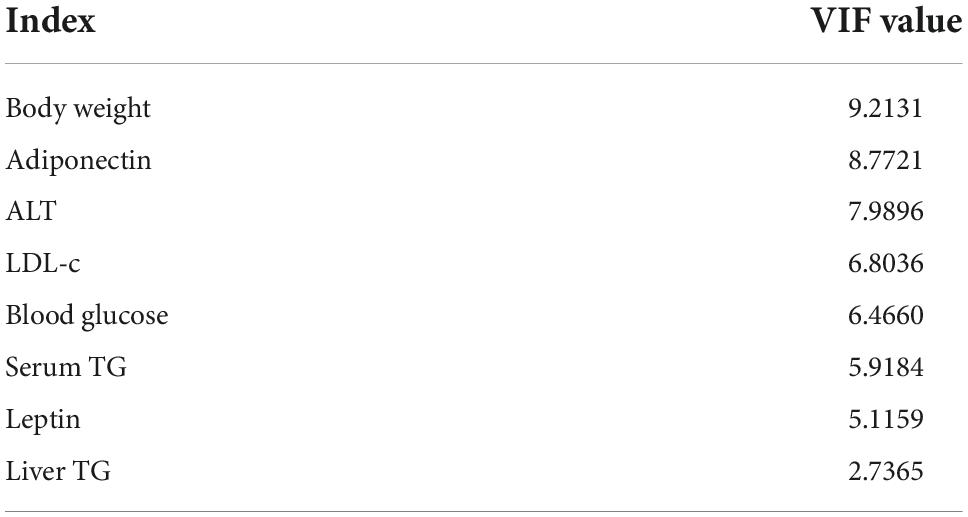
Table 7. VIF scores of biochemical indices.
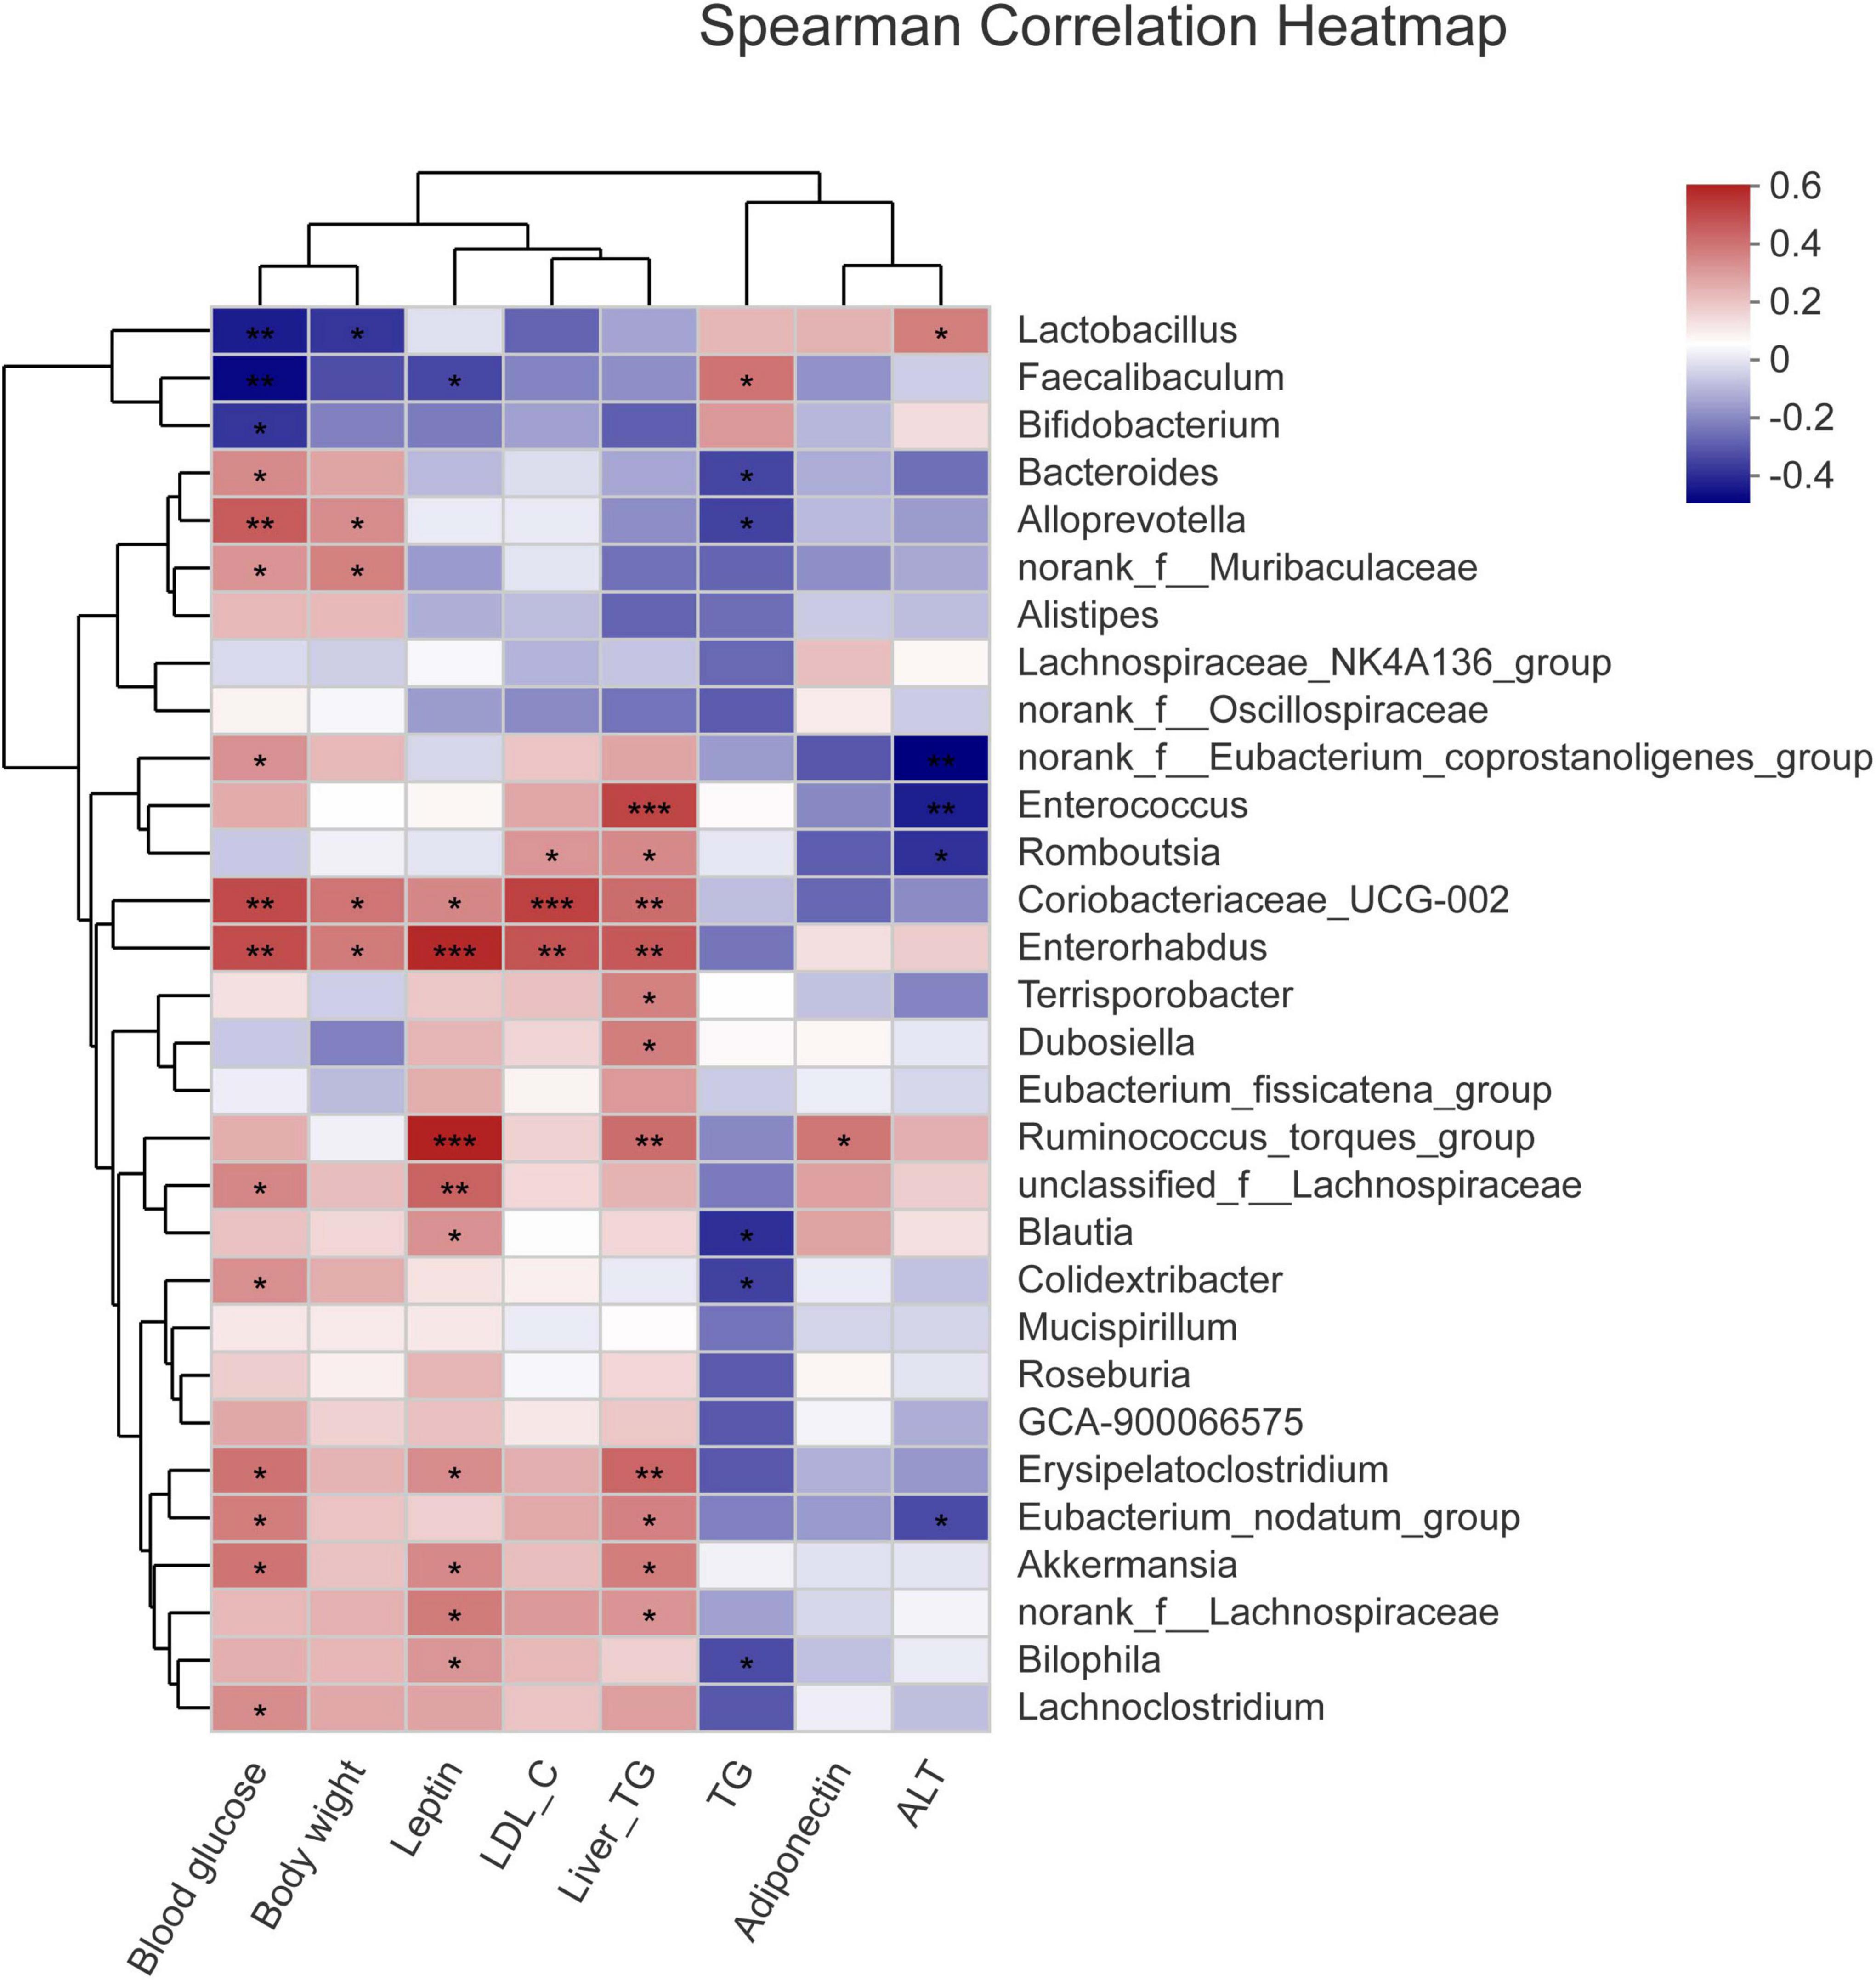
Figure 5. Correlation analysis between the screened physiological and biochemical indices and genuses of bacteria. *p < 0.05, **p < 0.01, ***p < 0.001.
Functional prediction analysis of intestinal flora genes
According to the analysis of intestinal flora diversity in NAFLD mice, long-term intake of high-fat diet changed the structure of intestinal flora in mice. The intestinal flora structure of mice was regulated after camel milk and silymarin intervention. The results of various physiological indicators and tissue sections also demonstrated that camel milk and silymarin could effectively alleviate liver lipid accumulation in mice. Identifying the KEGG metabolic pathway intestinal flora involved in combining intestinal flora data. From Figure 6A, the genes’ functional abundance of Metabolism, Genetic information processing, Environmental information processing, Cellular processes, Human diseases, Organismal systems were the same in the NC and Mod groups at the level 1. The genes’ functional abundance in the CoM group was slightly higher than Mod group. After camel milk and silymarin intervention, the intestinal flora structure of mice in the CaM and PC groups was regulated, and genes’ functional abundance was significantly higher in the CaM and PC groups than in the Mod group (p < 0.05). At the level 2 (Figure 6B and Table 8), there was no significant difference Carbohydrate metabolism, Amino acid metabolism, Energy metabolism, Metabolism of cofactors and vitamins, Lipid metabolism, Glycan biosynthesis and metabolism, Metabolism of terpenoids and polyketides and Xenobiotics biodegradation and metabolism in genes’ functional abundance in NC group, Mod group, and CoM group (p > 0.05). The genes’ functional abundance of metabolism-related increased in the CaM group and PC group after camel milk and silymarin intervention. It can be concluded that camel milk and silymarin induce dynamic changes of genes’ functional abundance related to intestinal flora metabolism in NAFLD mice, which reacted on the intestinal flora bacterial diversity.
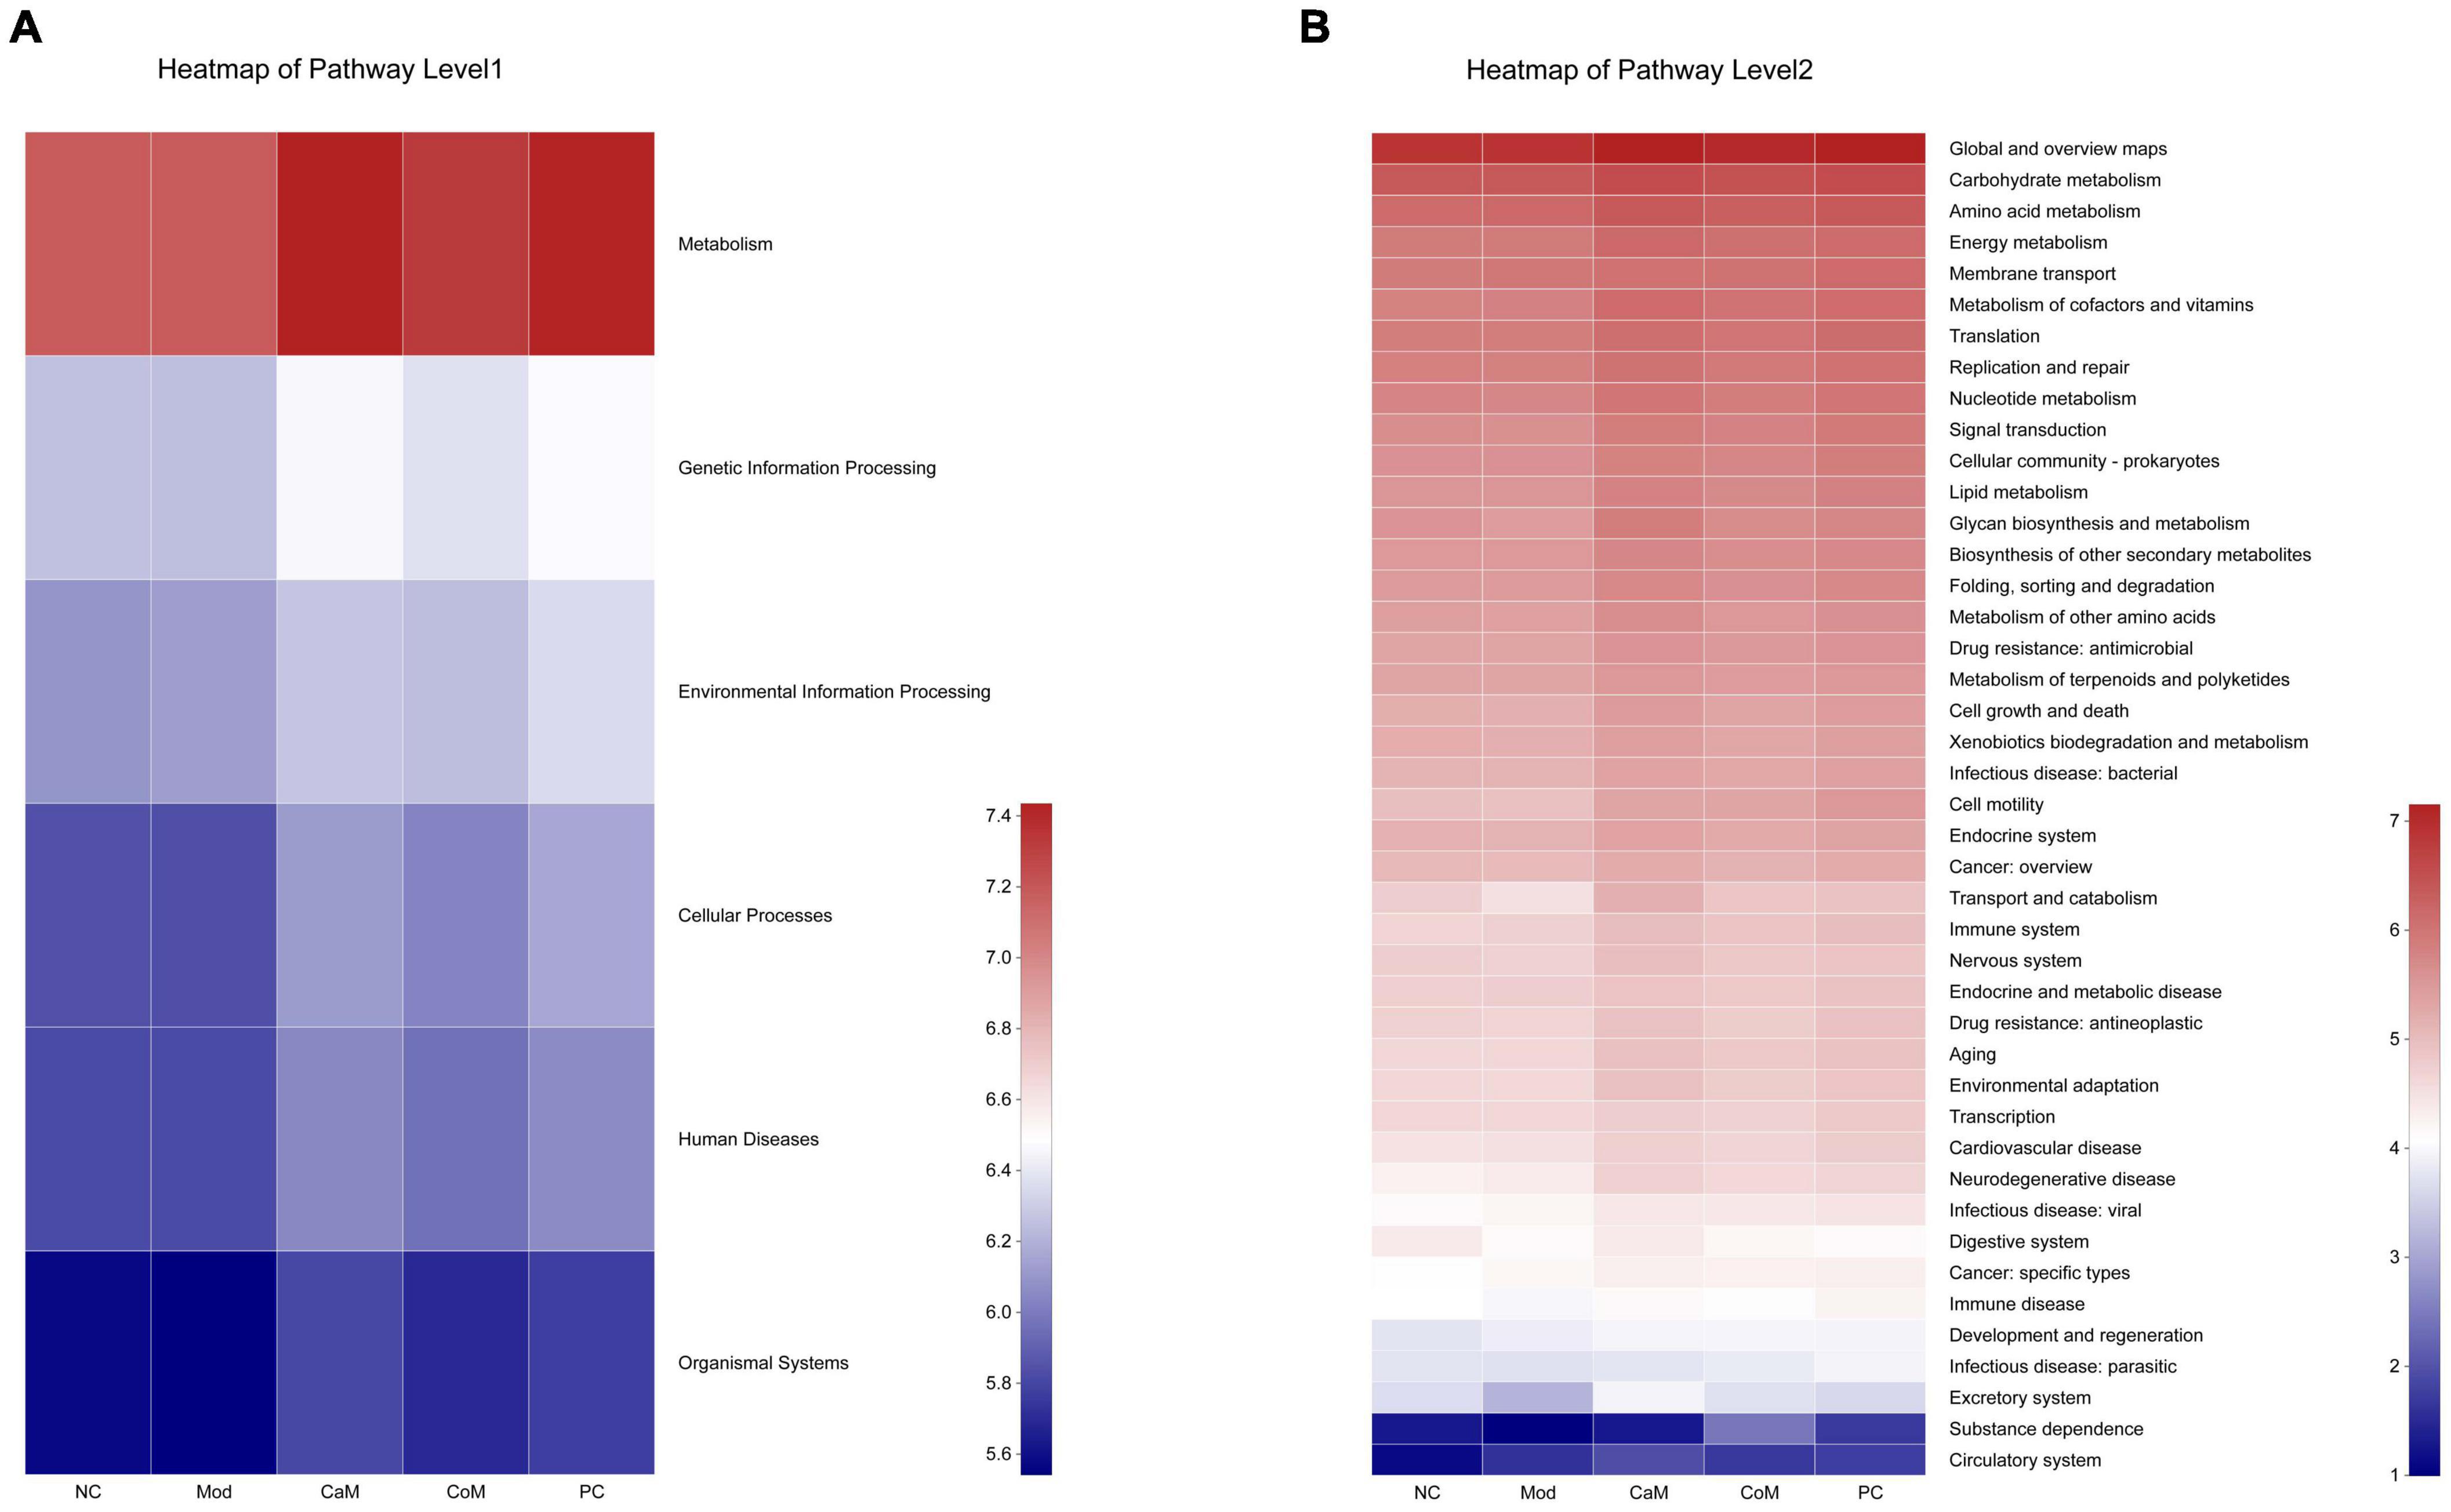
Figure 6. Predicting metabolic function genes based on PICRUSt2 analysis. (A) Heatmap of pathway level 1. (B) Heatmap of pathway level 2.
Table 8. Predicting metabolic function genes based on PICRUSt2 analysis.
Discussion
Non-alcoholic fatty liver disease is a chronic metabolic disease with worldwide prevalence, affecting a large number of people worldwide, characterized by obesity and excessive accumulation of lipids in the liver (1, 2). The most effective treatment for NAFLD is weight loss and enhancement of hepatic lipid metabolism. After a literature survey, we found that for those who are unable to achieve alleviation of NAFLD through lifestyle changes, bariatric surgery can also be used to reduce weight and thereby alleviate NAFLD (34). Currently, there are no drugs approved for the treatment of NAFLD specifically. Statins, pioglitazone, metformin, fenofibrate, vitamin E, and ursodeoxycholic acid are commonly used clinically to indirectly alleviate NAFLD (35–38). These drugs alleviate NAFLD through hypolipidemic effects, increased insulin sensitivity of the body, hypoglycemic effects, antioxidant effects, and enhancement of bile acid metabolism. However, some drugs had adverse effects on kidney and hepatotoxic (39–41). There are other substances that have also been shown to alleviate NAFLD. In a study by Kong et al., orange peel was used as an intervention for NAFLD and it was found that orange peel reduced body weight and lipid accumulation in the liver of animals and regulated the lipid metabolic status in animals (42). Curcumin, an extract from the rhizome of turmeric, has antioxidant and anti-inflammatory properties and was shown to reduce body mass index (BMI) and the level of TC in serum in patients with NAFLD in an investigation (43). Berberine is effective in reducing NAFLD, while some studies have claimed that its metabolite Berberrubine also has anti-obesity effects (44). Silymarin is a mixture including silybin, isosilybin, and silychristin. Mengesha et al. demonstrated that silymarin reduced hepatic steatosis and enhanced liver function in the animals (45). In addition, Ling Ren et al. used silymarin to intervene in NAFLD and found that silymarin reduce the symptoms of NAFLD by regulating the intestinal flora structure of animals (46). Therefore, in this trial, we chose silymarin as a positive drug as a reference. It is not denied that long-term medication for the treatment of NAFLD reduces the quality of life of patients (47). Therefore, it is necessary to develop health food products that effectively intervene in NAFLD.
There are more than 100 trillion microorganisms in the human gut (about 1.5 kg total weight), making it one of the most diverse ecosystems (48). It has been reported that camel milk can regulate the intestinal flora structure of mice with colitis, reduce the inflammatory response in mice, and reduce colitis in mice (49). Therefore, to study the effect of camel milk on the regulation of intestinal flora dysbiosis in NAFLD mice, we established a NAFLD mice model by feeding mice high-fat diets to change the structure of intestinal flora in mice. In the present study, as the experiment progressed, the Mod group of mice continued to increase food intake, body weight, and blood glucose. At the end of the trial period, compared with the NC group, the Mod group mice had significantly higher liver index and severe liver lipid accumulation (p < 0.05). And from the pathological sections, it can be observed that the Mod group mice have more lipid droplet in the liver and the liver tissue structure is severely damaged. This shows the success of the model building. Moreover, by comparing the body weight changes, blood glucose changes, liver lipid accumulation and liver tissue structure of mice in Mod and CaM groups, it can be determined that camel milk has a protective effect on the liver of NAFLD mice.
Serum biochemical indicators are important in the evaluation of NAFLD. In moderate amounts, leptin enhances hepatic TG transport, but excessive leptin increases the level of TG in the liver (50, 51). Adiponectin is a hormone secreted by adipose tissue that alleviates insulin resistance (52). High level of LDL-c in serum is an important factor in causing atherosclerosis, while high level of HDL-c in serum is an important factor in anti-atherosclerosis (53, 54). In this study, compared with the Mod group, camel milk significantly reduced the levels of leptin and LDL-c in serum and significantly increased the levels of adiponectin and HDL-c in serum in NAFLD mice (p < 0.05). These results, consistent with the insulin resistance index, suggest that camel milk reduced insulin resistance in NAFLD mice. In addition, camel milk reduced the inflammatory response in the NAFLD mice because of decrease of the levels of IL-6 and TNF-α in serum.
Long-term intake of high-fat diets did not change the Ace and Chao indices of intestinal flora Alpha diversity in the Mod group comparing with the NC group, suggesting that long-term intake of high-fat diets failed to change intestinal flora diversity in mice. We speculate that this may be a characteristic of the feed (which only causes NAFLD without changing the diversity of the mice’s intestinal flora). Which is different from previous studies, and the exact reason needs to be verified in subsequent supplementary experiments (55, 56). After gavage of camel milk, cow milk, and silymarin to mice, the Ace index and Chao index in the Alpha diversity of intestinal flora of mice in CaM and PC groups were significantly higher (p < 0.05), but the Ace index and Chao index of mice in CoM group were not significantly different from Mod group (p > 0.05), indicating that camel milk and silymarin could increase the number of species and the relative abundance of intestinal flora of mice. Beta diversity analysis showed that the samples of NC, Mod, CaM, CoM, and PC groups were distributed in different areas, while CoM and PC groups had some overlapping areas with Mod group; indicating that camel milk had significant effects on the intestinal flora structure of mice, while the effects of cow milk and silymarin on the intestinal flora structure of mice were different from camel milk. Combined with the analysis of physiological and biochemical indicators in mice, we can conclude that camel milk has a positive effect on the regulation of intestinal flora in NAFLD mice.
The occurrence of disease often means the change of intestinal flora, so the degree of disease occurrence and the trend of improvement can be judged by the structure of intestinal flora. At the phylum level, the ratio of Firmicutes to Bacteroidota affects the major components of the intestinal flora and is important for the assessment of metabolic disorders (57, 58). In the present study, compared with the NC group, the relative abundance of Firmicutes increased and the relative abundance of Bacteroidota decreased in the Mod group, and the ratio of Firmicutes to Bacteroidota increased. After camel milk intervention, the ratio of Firmicutes to Bacteroidota in the intestinal flora of mice in the CaM group decreased significantly (p < 0.05), indicating that camel milk improved the main components of the intestinal flora of NAFLD mice and had a regulation of intestinal flora diversity in NAFLD mice, thus alleviating NAFLD in mice. This change was also observed in the CoM and PC groups, but unlike the CaM group, NAFLD was not alleviated in the CoM group mice. The results of this study are similar to those of Wang and Zhao et al. (6, 59). At the genus level, Bacteroides is an important component of the intestinal flora and has an important impact on health. Dai et al. (60) demonstrated that Bacteroides was negatively correlated with obesity and type II diabetes, while Cheng’s et al. (61) results demonstrated that Bacteroides degrades polysaccharides and works with other genus to produce short-chain fatty acids, which are important for intestinal health at high levels in the gut; Russell et al. (62) also demonstrated that the secondary metabolites of Bacteroides improve the immune system. In the present study, chronic high-fat diet reduced the relative abundance of Bacteroides in the intestinal flora of mice in the Mod group. The relative abundance of Bacteroides in the intestinal flora of mice gavaged with camel milk, cow milk, and silymarin increased significantly, with the highest increase in the intestinal flora of mice in the CaM group (p < 0.05). Subsequent clustering analysis by genus and physiological indicators revealed that Bacteroides was significantly and negatively correlated with serum TG level and liver TG level (p < 0.05). This suggests that Bacteroides plays an important role in alleviating hepatic lipid accumulation in NAFLD mice. Short-chain fatty acids in the gut help protect the integrity of the intestinal barrier, and some studies have claimed that norank_f_Muribaculaceae is positively correlated with intestinal short-chain fatty acid levels (63, 64). In the present study, camel milk and silymarin upregulated the relative abundance of norank_f_Muribaculaceae in the intestine of NAFLD mice, and we also found that the relative abundance of norank_f_Muribaculaceae was negatively correlated with serum TG level and liver TG level in the clustering analysis of bacterial genera and physiological indicators, suggesting that norank_f_Muribaculaceae may regulate the levels of TG in serum and liver by increasing the content of short-chain fatty acids in the intestine. Dubosiella is positively associated with obesity and induces an inflammatory response in the body (65, 66). In the present study, the cluster analysis of genus and physiological indicators showed a positive correlation between Dubosiella and the level of TG in liver. The relative abundance of Dubosiella in the Mod group was significantly higher than that in the NC group (p < 0.05). After gavage of camel milk, cow milk, and silymarin in mice, the relative abundance of Dubosiella was reduced in the CaM, CoM, and PC groups, with the greatest reduction in the relative abundance of Dubosiella in the CaM group. This indicates that camel milk enhances hepatic TG metabolism and reduces hepatic lipid accumulation, which is consistent with the physiological index, which is also similar to the findings of Bai et al. (67). In addition, Coriobacteriaceae_UCG-002 was found to be enriched in the Mod and CoM groups in this study, while the relative abundance of Coriobacteriaceae_UCG-002 was significantly reduced in the CaM and PC groups compared to the Mod group. In the subsequent cluster analysis of genus and physiological indicators, Coriobacteriaceae_UCG-002 was found to be significantly positively correlated with body weight, blood glucose, serum LDL-c level, serum leptin level, and liver TG level (p < 0.05). These results were consistent with physiological and biochemical parameters and pathological sections of the liver. Studies have confirmed that Alloprevotella has a positive effect on improving the structure of the intestinal flora and protects the integrity of the intestinal barrier (68). In the present study, it is noteworthy that Alloprevotella was found to be significantly enriched in the CaM group by multiple group comparisons at the genus level and heat map clustering analysis (p < 0.05), and a significant negative correlation was found between Alloprevotella and the levels of TG in serum and liver, which may be an important reason for the reduced degree of liver lipid accumulation in the CaM group of mice. Lactobacillus and Bifidobacterium are considered to be beneficial bacteria, and the relative abundance of Faecalibaculum is was positively correlated with health status (57, 58). However, in our study, compared to NC group the relative abundance of Lactobacillus, Bifidobacterium, and Faecalibaculum in Mod group, CaM group, Cow group, and PC group was reduced. The relative abundance of Lactobacillus and Bifidobacterium in the intestinal flora of mice did not increase after camel milk and cow milk interventions, which may be due to differences in diet (control diet and high-fat diet). In conclusion, camel milk, and silymarin reduced the relative abundance of harmful bacteria in the intestinal flora of NAFLD mice, improved the structure of the intestinal flora and protected the integrity of the gut barrier. Although cow milk also changed the structure of intestinal flora in NAFLD mice, it did not effectively prevent lipid accumulation in the liver of mice.
Carbohydrate, amino acid, and lipid, as the three basic nutrients of the body, are the basis for the normal physiological activities of the body (69, 70). Cofactors and vitamins play a crucial role in the metabolic activities of carbohydrate, amino acid, and lipid (71–73). Meanwhile, the energy required for the metabolic activities of carbohydrate, amino acid, and lipid is provided by the mitochondria (the main site of energy metabolism), and mitochondrial dysfunction affects the normal metabolic processes of the body (74). In the present study, Carbohydrate metabolism, Amino acid metabolism, Energy metabolism, Metabolism of cofactors and vitamins and Lipid metabolism were observed to be significantly enhanced in NAFLD mice after camel milk and silymarin intervention. It means that camel milk and silymarin enhanced the energy metabolism of NAFLD mice, which in turn promoted the metabolism of the three major nutrients and further slowed down the accumulation of lipids in the liver. However, based on the 16S rRNA gene prediction is the basic metabolic function of microorganisms, it is necessary to design experiments to verify the effect of camel milk on NAFLD mice in terms of transcription level, protein level and phenotype regarding metabolism from the test animals themselves.
Conclusively, camel milk improved various physiological and biochemical indicators in NAFLD mice, positively regulated the structure of intestinal flora and modulate metabolism-related functional genes. Therefore, the results of this study provide a basis for camel milk to alleviate NAFLD.
Conclusion
Non-alcoholic fatty liver disease is a metabolic disorder with a wide range of effects, most notably characterized by the excessive accumulation of lipids in the liver. Interventions for NAFLD are particularly important in the absence of drugs specifically for the treatment of NAFLD. Our study demonstrates that camel milk reduced lipid accumulation in the liver, maintained normal liver tissue structure, enhanced hepatic glycolipid metabolism, and reduced inflammatory response in NAFLD mice. The analysis of intestinal flora of NAFLD mice demonstrated that camel milk regulated the intestinal flora structure of mice, increased intestinal flora diversity, reduced the relative abundance of Dubosiella and Coriobacteriaceae_UCG-002, which were positively correlated with liver TG level, and increased the relative abundance of Bacteroides, norank_f_Muribaculaceae, and Alloprevotella, which were negatively correlated with liver TG level. In addition, camel milk may also enhance the metabolism of the three major nutrients in the organism of NAFLD mice. Therefore, camel milk has a palliative effect on NAFLD in mice.
Data availability statement
The datasets presented in this study can be found in online repositories. The names of the repository/repositories and accession number(s) can be found below: https://www.ncbi.nlm.nih.gov/, PRJNA889750.
Ethics statement
The animal study was reviewed and approved by the Key Laboratory of Dairy Biotechnology and Engineering, Ministry of Education, Inner Mongolia Agricultural University, Hohhot, China.
Author contributions
SH, LM, and YL designed the experiments. SH, YL, HL, and LL conducted most of the experiments. SH wrote and edited the manuscript. TJ and RJ reviewed the manuscript. All authors read and approved the manuscript.
Funding
This work was supported by the National Key Research and Development Project (2020YFE0203300).
Conflict of interest
The authors declare that the research was conducted in the absence of any commercial or financial relationships that could be construed as a potential conflict of interest.
Publisher’s note
All claims expressed in this article are solely those of the authors and do not necessarily represent those of their affiliated organizations, or those of the publisher, the editors and the reviewers. Any product that may be evaluated in this article, or claim that may be made by its manufacturer, is not guaranteed or endorsed by the publisher.
References
1. Cotter TG, Rinella M. Nonalcoholic fatty liver disease 2020: the state of the disease. Gastroenterology. (2020) 158:1851–64. doi: 10.1053/j.gastro.2020.01.052
2. Huanan C, Sangsang L, Amoah AN, Yacong B, Xuejiao C, Zhan S, et al. Relationship between triglyceride glucose index and the incidence of non-alcoholic fatty liver disease in the elderly: a retrospective cohort study in China. BMJ Open. (2020) 10:e039804. doi: 10.1136/bmjopen-2020-039804
3. Junli Z, Shuhan W, Yajuan Z, Xiaoling D, Jiahuan L, Keshu X. The role and mechanism of CREBH regulating SIRT3 in metabolic associated fatty liver disease. Life Sci. (2022) 306:1–9. doi: 10.1016/j.lfs.2022.120838
4. Hansen CD, Gram-Kampmann E-M, Hansen JK, Hugger MB, Madsen BS, Jensen J, et al. A non-calorie restricted low carbohydrate high fat diet improves non-alcoholic fatty liver disease (NAFLD) activity score (NAS) and HbA1c in type 2 diabetes: a six-month randomised controlled trial. J Hepatol. (2022) 77:S9–10. doi: 10.1016/s0168-8278(22)00439-1
5. Tang ASP, Chan KE, Quek J, Xiao J, Tay P, Teng M, et al. Non-alcoholic fatty liver disease increases risk of carotid atherosclerosis and ischemic stroke: an updated meta-analysis with 135,602 individuals. Clin Mol Hepatol. (2022) 28:483–96. doi: 10.3350/cmh.2021.0406
6. Wang R, Wang L, Wu H, Zhang L, Hu X, Li C, et al. Noni (Morinda citrifolia L.) fruit phenolic extract supplementation ameliorates NAFLD by modulating insulin resistance, oxidative stress, inflammation, liver metabolism and gut microbiota. Food Res Int. (2022) 160:1–13. doi: 10.1016/j.foodres.2022.111732
7. Zhao J, Fan H, Wang T, Yu B, Mao S, Wang X, et al. TyG index is positively associated with risk of CHD and coronary atherosclerosis severity among NAFLD patients. Cardiovasc Diabetol. (2022) 21:1–11. doi: 10.1186/s12933-022-01548-y
8. Naudhani M, Thakur K, Ni ZJ, Zhang JG, Wei ZJ. Formononetin reshapes the gut microbiota, prevents progression of obesity and improves host metabolism. Food Funct. (2021) 12:12303–24. doi: 10.1039/d1fo02942h
9. Sunny NE, Bril F, Cusi K. Mitochondrial adaptation in nonalcoholic fatty liver disease: novel mechanisms and treatment strategies. Trends Endocrinol Metab. (2017) 28:250–60. doi: 10.1016/j.tem.2016.11.006
10. Wang CK. Health benefits of onion bioactives on hypercholesterolemia, cardiovascular diseases, and bone mineral density. Food Front. (2020) 1:107–8. doi: 10.1002/fft2.18
11. Fang YL, Chen H, Wang CL, Liang L. Pathogenesis of non-alcoholic fatty liver disease in children and adolescence: from “two hit theory” to “multiple hit model”. World J Gastroenterol. (2018) 24:2974–83. doi: 10.3748/wjg.v24.i27.2974
12. Zhang JK, Zhou XL, Wang XQ, Zhang JX, Yang ML, Liu YP, et al. Que Zui tea ameliorates hepatic lipid accumulation and oxidative stress in high fat diet induced nonalcoholic fatty liver disease. Food Res Int. (2022) 156:1–19. doi: 10.1016/j.foodres.2022.111196
13. Jilek JL, Frost KL, Jacobus KA, He W, Toth EL, Goedken M, et al. Altered cisplatin pharmacokinetics during nonalcoholic steatohepatitis contributes to reduced nephrotoxicity. Acta Pharm Sin B. (2021) 11:3869–78. doi: 10.1016/j.apsb.2021.05.030
14. Li Y, Wang D, Ping X, Zhang Y, Zhang T, Wang L, et al. Local hyperthermia therapy induces browning of white fat and treats obesity. Cell. (2022) 185:949–66. doi: 10.1016/j.cell.2022.02.004
15. Ayoub MA, Palakkott AR, Ashraf A, Iratni R. The molecular basis of the anti-diabetic properties of camel milk. Diabetes Res Clin Pract. (2018) 146:305–12. doi: 10.1016/j.diabres.2018.11.006
16. Khalesi M, Salami M, Moslehishad M, Winterburn J, Moosavi-Movahedi AA. Biomolecular content of camel milk: a traditional superfood towards future healthcare industry. Trends Food Sci Technol. (2017) 62:49–58. doi: 10.1016/j.tifs.2017.02.004
17. Sarin SK, Kumar M, Eslam M, George J, Al Mahtab M, Akbar SMF, et al. Liver diseases in the Asia-Pacific region: a lancet gastroenterology & hepatology commission. Lancet Gastroenterol Hepatol. (2020) 5:167–228. doi: 10.1016/s2468-1253(19)30342-5
18. Sboui A, Atig C, Khabir A, Hammadi M, Khorchani T, Kourkoutas Y. Camel milk used as an adjuvant therapy to treat type 2 diabetic patients: effects on blood glucose, HbA1c, cholesterol, and TG levels. J Chem. (2022) 2022:1–6. doi: 10.1155/2022/5860162
19. Almnaizel AT, Al-Khalifah AS, Alhaj OA, Yahya MA. Hypocholesterolemic effect of camel milk on rats fed a high-cholesterol diet. Emirates J Food Agric. (2018) 30:288–94. doi: 10.9755/ejfa.2018.v30.i4.1664
20. Arab HH, Eid AH, Gad AM, Yahia R, Mahmoud AM, Kabel AM. Inhibition of oxidative stress and apoptosis by camel milk mitigates cyclosporine-induced nephrotoxicity: targeting Nrf2/HO-1 and AKT/eNOS/NO pathways. Food Sci Nutr. (2021) 9:3177–90. doi: 10.1002/fsn3.2277
21. El-Fakharany EM, El-Baky NA, Linjawi MH, Aljaddawi AA, Saleem TH, Nassar AY, et al. Influence of camel milk on the hepatitis C virus burden of infected patients. Exp Ther Med. (2017) 13:1313–20. doi: 10.3892/etm.2017.4159
22. Ibrahim MAB, Wani FA, Rahiman S. Hepatorprotective effect of olive oil and camel milk on acetaminophen-induced liver toxicity in mice. Med Sci Public Health. (2017) 6:9. doi: 10.5455/ijmsph.2017.07092016614
23. Khan MZ, Xiao J, Ma Y, Ma J, Liu S, Khan A, et al. Research development on anti-microbial and antioxidant properties of camel milk and its role as an anti-cancer and anti-hepatitis agent. Antioxidants (Basel). (2021) 10:788. doi: 10.3390/antiox10050788
24. Hussain H, Wattoo FH, Wattoo MHS, Gulfraz M, Masud T, Shah I, et al. Camel milk as an alternative treatment regimen for diabetes therapy. Food Sci Nutr. (2021) 9:1347–56. doi: 10.1002/fsn3.2078
25. Khan FB, Anwar I, Redwan EM, Palakkott A, Ashraf A, Kizhakkayil J, et al. Camel and bovine milk lactoferrins activate insulin receptor and its related AKT and ERK1/2 pathways. J Dairy Sci. (2022) 105:1848–61. doi: 10.3168/jds.2021-20934
26. Ai X, Wu C, Yin T, Zhur O, Liu C, Yan X, et al. Antidiabetic function of Lactobacillus fermentum MF423-fermented rice bran and its effect on gut microbiota structure in type 2 diabetic mice. Front Microbiol. (2021) 12:682290. doi: 10.3389/fmicb.2021.682290
27. Huang ZR, Zhao LY, Zhu FR, Liu Y, Xiao JY, Chen ZC, et al. Anti-diabetic effects of ethanol extract from Sanghuangporous vaninii in high-fat/sucrose diet and streptozotocin-induced diabetic mice by modulating gut microbiota. Foods. (2022) 11:1–17. doi: 10.3390/foods11070974
28. Bao W, He Y, Yu J, Liu M, Yang X, Ta N, et al. Regulatory effect of Lactiplantibacillus plantarum 2-33 on intestinal microbiota of mice with antibiotic-associated diarrhea. Front Nutr. (2022) 9:921875. doi: 10.3389/fnut.2022.921875
29. Ejtahed HS, Niasari Naslaji A, Mirmiran P, Zraif Yeganeh M, Hedayati M, Azizi F, et al. Effect of camel milk on blood sugar and lipid profile of patients with type 2 diabetes: a pilot clinical trial. Int J Endocrinol Metab. (2015) 13:1–6. doi: 10.5812/ijem.21160
30. Guo X, Cao X, Fang X, Guo A, Li E. Inhibitory effects of fermented Ougan (Citrus reticulata cv. Suavissima) juice on high-fat diet-induced obesity associated with white adipose tissue browning and gut microbiota modulation in mice. Food Funct. (2021) 12:9300–14. doi: 10.1039/d0fo03423a
31. Rodriguez-Daza MC, Roquim M, Dudonne S, Pilon G, Levy E, Marette A, et al. Berry polyphenols and fibers modulate distinct microbial metabolic functions and gut microbiota enterotype-like clustering in obese mice. Front Microbiol. (2020) 11:2032. doi: 10.3389/fmicb.2020.02032
32. Sheikh A, Almathen F, Alfattah M. The impact of dromedary camel milk on mice gut microbiota. Appl Biol Chem. (2022) 65:1–12. doi: 10.1186/s13765-022-00699-6
33. Matthews DR, Hosker JR, Rudenski AS, Naylor BA, Treacher DF, Turner RC. Homeostasis model assessment: insulin resistance and fl-cell function from fasting plasma glucose and insulin concentrations in man. Diabetologia. (1985) 28:412–9. doi: 10.1007/BF00280883
34. Abdel-Rahman R. Non-alcoholic fatty liver disease: epidemiology, pathophysiology and an update on the therapeutic approaches. Asian Pac J Trop Biomed. (2022) 12:99–114. doi: 10.4103/2221-1691.338919
35. Riemann A, Blaschke M, Jauho-Ghadimi A, Siggelkow H, Gollisch KSC. Metformin improves the hepatic steatosis index in non-obese patients with polycystic ovary syndrome. J Clin Med. (2022) 11:1–12. doi: 10.3390/jcm11154294
36. Sun L, Deng C, Gu Y, He Y, Yang L, Shi J. Effects of dapagliflozin in patients with nonalcoholic fatty liver disease: a systematic review and meta-analysis of randomized controlled trials. Clin Res Hepatol Gastroenterol. (2022) 46:1–10. doi: 10.1016/j.clinre.2022.101876
37. Xie P, Peng Y, Qiu L. Responsive oligochitosan nano-vesicles with ursodeoxycholic acid and exenatide for NAFLD synergistic therapy via SIRT1. Carbohydr Polym. (2022) 288:119388. doi: 10.1016/j.carbpol.2022.119388
38. Yoneda M, Kobayashi T, Honda Y, Ogawa Y, Kessoku T, Imajo K, et al. Combination of tofogliflozin and pioglitazone for NAFLD: extension to the ToPiND randomized controlled trial. Hepatol Commun. (2022) 6:1–13. doi: 10.1002/hep4.1993
39. Attridge RL, Frei CR, Ryan L, Koeller J, Linn WD. Fenofibrate-associated nephrotoxicity: a review of current evidence. Am J Health Syst Pharm. (2013) 70:1219–25. doi: 10.2146/ajhp120131
40. Pinal-Fernandez I, Casal-Dominguez M, Mammen AL. Statins: pros and cons. Med Clín (English Edn). (2018) 150:398–402. doi: 10.1016/j.medcle.2018.03.001
41. Zou B, Odden MC, Nguyen MH. Statin use and reduced hepatocellular carcinoma risk in patients with nonalcoholic fatty liver disease. Clin Gastroenterol Hepatol. (2022):1–16. doi: 10.1016/j.cgh.2022.01.057
42. Feng K, Zhu X, Liu G, Kan Q, Chen T, Chen Y, et al. Dietary citrus peel essential oil ameliorates hypercholesterolemia and hepatic steatosis by modulating lipid and cholesterol homeostasis. Food Funct. (2020) 11:7217–30. doi: 10.1039/d0fo00810a
43. Ngu MH, Norhayati MN, Rosnani Z, Zulkifli MM. Curcumin as adjuvant treatment in patients with non-alcoholic fatty liver (NAFLD) disease: a systematic review and meta-analysis. Complement Ther Med. (2022) 68:1–12. doi: 10.1016/j.ctim.2022.102843
44. Yang S, Cao S, Li C, Zhang J, Liu C, Qiu F, et al. Berberrubine, a Main Metabolite of berberine, alleviates non-alcoholic fatty liver disease via modulating glucose and lipid metabolism and restoring gut microbiota. Front Pharmacol. (2022) 13:913378. doi: 10.3389/fphar.2022.913378
45. Mengesha T, Gnanasekaran N, Mehare T. Hepatoprotective effect of silymarin on fructose induced nonalcoholic fatty liver disease in male albino wistar rats. BMC Complement Med Ther. (2021) 21:104. doi: 10.1186/s12906-021-03275-5
46. Ren L, Ma XL, Wang HL, Li R, Cui JJ, Yan PJ, et al. Prebiotic-like cyclodextrin assisted silybin on NAFLD through restoring liver and gut homeostasis. J Control Release. (2022) 348:825–40. doi: 10.1016/j.jconrel.2022.06.031
47. Alrasheed M, Guo JJ, Lin AC, Wigle PR, Hardee A, Hincapie AL. The effect of polypharmacy on quality of life in adult patients with nonalcoholic fatty liver disease in the United States. Qual Life Res. (2022) 31:2481–91. doi: 10.1007/s11136-022-03090-6
48. Gupta H, Min BH, Ganesan R, Gebru YA, Sharma SP, Park E, et al. Gut microbiome in non-alcoholic fatty liver disease: from mechanisms to therapeutic role. Biomedicines. (2022) 10:1–24. doi: 10.3390/biomedicines10030550
49. He J, Guo K, Chen Q, Wang Y, Jirimutu. Camel milk modulates the gut microbiota and has anti-inflammatory effects in a mouse model of colitis. J Dairy Sci. (2022) 105:3782–93. doi: 10.3168/jds.2021-21345
50. Choi SS, Syn WK, Karaca GF, Omenetti A, Moylan CA, Witek RP, et al. Leptin promotes the myofibroblastic phenotype in hepatic stellate cells by activating the hedgehog pathway. J Biol Chem. (2010) 285:36551–60. doi: 10.1074/jbc.M110.168542
51. Shih PH, Shiue SJ, Chen CN, Cheng SW, Lin HY, Wu LW, et al. Fucoidan and fucoxanthin attenuate hepatic steatosis and inflammation of nafld through modulation of leptin/adiponectin axis. Mar Drugs. (2021) 19:1–17. doi: 10.3390/md19030148
52. Marques V, Afonso MB, Bierig N, Duarte-Ramos F, Santos-Laso A, Jimenez-Aguero R, et al. Adiponectin, leptin, and IGF-1 are useful diagnostic and stratification biomarkers of NAFLD. Front Med (Lausanne). (2021) 8:683250. doi: 10.3389/fmed.2021.683250
53. Hu X, Liu J, Li W, Wang C, Li G, Zhou Y, et al. Elevated serum uric acid was associated with pre-inflammatory state and impacted the role of HDL-C on carotid atherosclerosis. Nutr Metab Cardiovasc Dis. (2022) 32:1661–9. doi: 10.1016/j.numecd.2022.03.026
54. Xu L, Yan X, Tang Z, Feng B. Association between circulating oxidized OxLDL/LDL-C ratio and the severity of coronary atherosclerosis, along with other emerging biomarkers of cardiovascular disease in patients with type 2 diabetes. Diabetes Res Clin Pract. (2022) 191:110040. doi: 10.1016/j.diabres.2022.110040
55. Juarez-Fernandez M, Porras D, Petrov P, Roman-Saguillo S, Garcia-Mediavilla MV, Soluyanova P, et al. The synbiotic combination of Akkermansia muciniphila and quercetin ameliorates early obesity and NAFLD through gut microbiota reshaping and bile acid metabolism modulation. Antioxidants (Basel). (2021) 10:1–25. doi: 10.3390/antiox10122001
56. Loubet Filho PS, Baseggio AM, Vuolo MM, Reguengo LM, Telles Biasoto AC, Correa LC, et al. Gut microbiota modulation by jabuticaba peel and its effect on glucose metabolism via inflammatory signaling. Curr Res Food Sci. (2022) 5:382–91. doi: 10.1016/j.crfs.2022.02.001
57. Teng Y, Wang Y, Guan WY, Wang C, Yu HS, Li X, et al. Effect of Lactobacillus plantarum LP104 on hyperlipidemia in high-fat diet induced C57BL/6N mice via alteration of intestinal microbiota. J Funct Foods. (2022) 95:1–9. doi: 10.1016/j.jff.2022.105176
58. Zhong M, Yan Y, Yuan H, Rong A, Xu G, Cai F, et al. Astragalus mongholicus polysaccharides ameliorate hepatic lipid accumulation and inflammation as well as modulate gut microbiota in NAFLD rats. Food Funct. (2022) 13:7287–301. doi: 10.1039/d2fo01009g
59. Zhao Z, Wang J, Ren W, Bian Y, Wang Y, Wang L, et al. Effect of Jiangan-Jiangzhi pill on gut microbiota and chronic inflammatory response in rats with non-alcoholic fatty liver. Chem Biodivers. (2022) 19:1–12. doi: 10.1002/cbdv.202100987
60. Dai K, Song Y, Zhang D, Wei Y, Jiang S, Xu F, et al. Thinned peach polyphenols alleviate obesity in high fat mice by affecting gut microbiota. Food Res Int. (2022) 157:1–10. doi: 10.1016/j.foodres.2022.111255
61. Cheng J, Hu J, Geng F, Nie S. Bacteroides utilization for dietary polysaccharides and their beneficial effects on gut health. Food Sci Hum Wellness. (2022) 11:1101–10. doi: 10.1016/j.fshw.2022.04.002
62. Russell WR, Duncan SH, Scobbie L, Duncan G, Cantlay L, Calder AG, et al. Major phenylpropanoid-derived metabolites in the human gut can arise from microbial fermentation of protein. Mol Nutr Food Res. (2013) 57:523–35. doi: 10.1002/mnfr.201200594
63. Al-Bulish MSM, Cao W, Yang R, Wang Y, Xue C, Tang Q. Docosahexaenoic acid-rich fish oil alleviates hepatic steatosis in association with regulation of gut microbiome in ob/ob mice. Food Res Int. (2022) 157:1–12. doi: 10.1016/j.foodres.2022.111373
64. Luo X, Zhang B, Pan Y, Gu J, Tan R, Gong P. Phyllanthus emblica aqueous extract retards hepatic steatosis and fibrosis in NAFLD mice in association with the reshaping of intestinal microecology. Front Pharmacol. (2022) 13:893561. doi: 10.3389/fphar.2022.893561
65. Qiao Y, Zhang Z, Zhai Y, Yan X, Zhou W, Liu H, et al. Apigenin alleviates obesity-associated metabolic syndrome by regulating the composition of the gut microbiome. Front Microbiol. (2021) 12:805827. doi: 10.3389/fmicb.2021.805827
66. Qiu X, Macchietto MG, Liu X, Lu Y, Ma Y, Guo H, et al. Identification of gut microbiota and microbial metabolites regulated by an antimicrobial peptide lipocalin 2 in high fat diet-induced obesity. Int J Obes (Lond). (2021) 45:143–54. doi: 10.1038/s41366-020-00712-2
67. Bai YF, Wang SW, Wang XX, Weng YY, Fan XY, Sheng H, et al. The flavonoid-rich Quzhou Fructus Aurantii extract modulates gut microbiota and prevents obesity in high-fat diet-fed mice. Nutr Diabetes. (2019) 9:1–11. doi: 10.1038/s41387-019-0097-6
68. Bai X, Fu R, Duan Z, Wang P, Zhu C, Fan D. Ginsenoside Rk3 alleviates gut microbiota dysbiosis and colonic inflammation in antibiotic-treated mice. Food Res Int. (2021) 146:1–11. doi: 10.1016/j.foodres.2021.110465
69. Jian H, Xu Q, Wang X, Liu Y, Miao S, Li Y, et al. Amino acid and fatty acid metabolism disorders trigger oxidative stress and inflammatory response in excessive dietary valine-induced NAFLD of laying hens. Front Nutr. (2022) 9:849767. doi: 10.3389/fnut.2022.849767
70. Kattapuram N, Zhang C, Muyyarikkandy MS, Surugihalli C, Muralidaran V, Gregory T, et al. Dietary macronutrient composition differentially modulates the remodeling of mitochondrial oxidative metabolism during NAFLD. Metabolites. (2021) 11:1–18. doi: 10.3390/metabo11050272
71. Hong J, Shin WK, Lee JW, Lee SY, Kim Y. Associations of serum vitamin D Level with Sarcopenia, non-alcoholic fatty liver disease (NAFLD), and Sarcopenia in NAFLD among people aged 50 years and older: the Korea national health and nutrition examination survey IV-V. Metab Syndr Relat Disord. (2022) 20:210–8. doi: 10.1089/met.2021.0106
72. Scorletti E, Creasy KT, Vujkovic M, Vell M, Zandvakili I, Rader DJ, et al. Dietary vitamin E intake is associated with a reduced risk of developing digestive diseases and nonalcoholic fatty liver disease. Am J Gastroenterol. (2022) 117:927–30. doi: 10.14309/ajg.0000000000001726
73. Xie ZQ, Li HX, Tan WL, Yang L, Ma XW, Li WX, et al. Association of serum vitamin C with NAFLD and MAFLD among adults in the United States. Front Nutr. (2021) 8:795391. doi: 10.3389/fnut.2021.795391
Keywords: non-alcoholic fatty liver disease, camel milk, intestinal flora, glucolipid metabolism, regulating function
Citation: Hao S, Ming L, Li Y, Lv H, Li L, Jambal T and Ji R (2022) Modulatory effect of camel milk on intestinal microbiota of mice with non-alcoholic fatty liver disease. Front. Nutr. 9:1072133. doi: 10.3389/fnut.2022.1072133
Received: 17 October 2022; Accepted: 17 November 2022;
Published: 01 December 2022.
Edited by:
Daxi Ren, Zhejiang University, ChinaReviewed by:
Mohd Redzwan Sabran, Putra Malaysia University, MalaysiaRui Guo, Zhejiang Chinese Medical University, China
Copyright © 2022 Hao, Ming, Li, Lv, Li, Jambal and Ji. This is an open-access article distributed under the terms of the Creative Commons Attribution License (CC BY). The use, distribution or reproduction in other forums is permitted, provided the original author(s) and the copyright owner(s) are credited and that the original publication in this journal is cited, in accordance with accepted academic practice. No use, distribution or reproduction is permitted which does not comply with these terms.
*Correspondence: Rimutu Ji, eWVsdW90dW8xOTk5QHZpcC4xNjMuY29t
†These authors have contributed equally to this work and share first authorship