 Dennis Van Erck1,2*
 Pim Moeskops3
 Josje D. Schoufour2,4
 Peter J. M. Weijs2Wilma J. M. Scholte Op Reimer1,5Martijn S. Van Mourik1
 Yvonne C. Janmaat1
 R. Nils Planken6Marije Vis1Jan Baan1Robert Hemke6
 Ivana Išgum6,7José P. Henriques1Bob D. De Vos3,7Ronak Delewi1
- 1Department of Cardiology, Amsterdam UMC, University of Amsterdam, Amsterdam, Netherlands
- 2Faculty of Sports and Nutrition, Center of Expertise Urban Vitality, Amsterdam University of Applied Sciences, Amsterdam, Netherlands
- 3Quantib-U, Rotterdam, Netherlands
- 4Faculty of Health, Center of Expertise Urban Vitality, Amsterdam University of Applied Science, Amsterdam, Netherlands
- 5HU University of Applied Sciences, Research Group Chronic Diseases, Utrecht, Netherlands
- 6Department of Radiology and Nuclear Medicine, Amsterdam UMC, University of Amsterdam, Amsterdam, Netherslands
- 7Department of Biomedical Engineering and Physics, Amsterdam UMC, University of Amsterdam, Amsterdam, Netherlands
Background: Manual muscle mass assessment based on Computed Tomography (CT) scans is recognized as a good marker for malnutrition, sarcopenia, and adverse outcomes. However, manual muscle mass analysis is cumbersome and time consuming. An accurate fully automated method is needed. In this study, we evaluate if manual psoas annotation can be substituted by a fully automatic deep learning-based method.
Methods: This study included a cohort of 583 patients with severe aortic valve stenosis planned to undergo Transcatheter Aortic Valve Replacement (TAVR). Psoas muscle area was annotated manually on the CT scan at the height of lumbar vertebra 3 (L3). The deep learning-based method mimics this approach by first determining the L3 level and subsequently segmenting the psoas at that level. The fully automatic approach was evaluated as well as segmentation and slice selection, using average bias 95% limits of agreement, Intraclass Correlation Coefficient (ICC) and within-subject Coefficient of Variation (CV). To evaluate performance of the slice selection visual inspection was performed. To evaluate segmentation Dice index was computed between the manual and automatic segmentations (0 = no overlap, 1 = perfect overlap).
Results: Included patients had a mean age of 81 ± 6 and 45% was female. The fully automatic method showed a bias and limits of agreement of −0.69 [−6.60 to 5.23] cm2, an ICC of 0.78 [95% CI: 0.74–0.82] and a within-subject CV of 11.2% [95% CI: 10.2–12.2]. For slice selection, 84% of the selections were on the same vertebra between methods, bias and limits of agreement was 3.4 [−24.5 to 31.4] mm. The Dice index for segmentation was 0.93 ± 0.04, bias and limits of agreement was −0.55 [1.71–2.80] cm2.
Conclusion: Fully automatic assessment of psoas muscle area demonstrates accurate performance at the L3 level in CT images. It is a reliable tool that offers great opportunities for analysis in large scale studies and in clinical applications.
Introduction
Low muscle mass is a key criteria for diagnoses of malnutrition and sarcopenia (1, 2). It furthermore is a predictor for functional decline, falls, rehospitalization and higher mortality rates at mid-term to long-term follow-up (3). When low muscle mass is diagnosed timely, nutrition and exercise interventions can be implemented to mitigate muscle loss and subsequently improve clinical prognosis (4, 5). The gold standard for determination of muscle mass is the measurement of muscle area on the Computed Tomography (CT) scan (6). CT scans are frequently available in daily clinical practice, but muscle mass measurement for clinical assessment is currently not performed. A limiting factor is the processing method, which requires both expertise and time (7). Therefore, for clinical implementation and large-scale clinical outcome studies a fully automatic method is an unmet need.
Typically, muscle mass is assessed with proxy measures such as total muscle area or psoas muscle area determined in a single axial slice at level of lumbar vertebra 3 (L3) (6, 8). Both are highly correlated with total body muscle mass (9). Furthermore, the two areas show a good predictive ability for various clinical outcomes including major surgical complications, quality of life and mortality (6). It takes two steps to calculate total muscle area or psoas muscle area on an axial slice. First, the correct slice has to be selected and second, the muscle area of interest has to be identified, a process which is known as segmentation (10). Currently both processes are performed manually by trained researchers requiring approximately 5 min for slice selection and 10 min for segmentation per scan (6, 11).
Due to continuous improvements in medical image analysis, deep learning-based methods are able to replace the cumbersome manual process of slice selection and segmentation (12). Several studies have shown promising results for the automatic segmentation of muscle area on a single axial slice of the CT scan (12–15). However, validated fully automatic methods performing slice selection as well as segmentation is still lacking. The main purpose of this study is to evaluate slice selection and segmentation of the psoas muscle area on the CT scan of a fully automatic deep learning method compared to a manual method.
Materials and Methods
Study-Cohort
For this study, data of all patients with severe aortic stenosis that were planned to undergo Transcatheter Aortic Valve Replacement (TAVR) from January 2010 to January 2016 were used (n = 651) (16). All patients provided informed consent for the procedure. The institutional review board approved this study with a waiver. The protocol was in accordance with the declaration of Helsinki.
Data Collection
All patients underwent a CT scan prior to TAVR, with a 64-slice multi-detector scanner (Brilliance, Philips Medical Systems, Cleveland, OH) or a dual source 2 × 192 slice multi-detector scanner (Somatom Force, Siemens, Erlangen, Germany) after intravenous contrast administration. A body scan from cranium to thighs was acquired and reconstructed with at a slice thickness of 1.5 or 3.0 mm. A more detailed description of the method is provided elsewhere (16). Patient characteristics were collected from the prospective Institutional TAVR registry.
Manual Psoas Measurement
Manual assessment of the psoas muscle area had been previously performed by Van Mourik et al. (16). In short, slices were selected manually in the middle of L3, at the rear end of the vertebral body, using a multiplanar view on the Sante DICOM viewer (version 5.0.4, Santesoft, Athens, Greece). For segmentation Slice-O-Matic software (version 5.0, TomoVision, Montreal, Quebec, Canada) was used. Psoas muscle area was manually segmented with a mouse-operated paint brush selecting pixels with HU values between −29 and 150. Complete segmentation was performed by one researcher (YJ), trained in segmentation of psoas muscle area, blinded for patient characteristics.
Automatic Psoas Measurement
The automatic assessment was performed by the deep learning-based software of Quantib Body Composition (version 0.1.0, Quantib, Rotterdam, Netherlands) (17). The Quantib Body Composition software is available online for testing1 and provides quantification of three muscle areas: psoas muscle, abdominal muscle, long spine muscle, and two fat tissues: visceral fat and subcutaneous fat. Furthermore, features can be calculated from these segmentations such as skeletal muscle density (SMD) or intramuscular adipose tissue (IMAT). The algorithm allows post-hoc decisions for selection thresholds of Hounsfield Units (HU). The narrow field of view in several CT images only allowed accurate measurements of the psoas muscle in this cohort.
The software first resampled CT scans to 5 mm slice thickness. Based on these resampled slices, the L3 slice was automatically selected using a convolutional neural network. Subsequently, segmentation of the muscle and fat area was performed in the selected slice using a second convolutional neural network. To limit the influence of the automatic selection, results were averaged over 5 slices, i.e., 25 mm. Boundaries in Hounsfield Units (HU) between 29 and 150 HU were used for selection of muscle tissue. As output the program provided area of the muscle area and fat area in squared centimeters.
All automatically selected slices as well as all automatically segmented muscles were visually inspected. Three random examples and the three biggest outliers, based on the within-subject Coefficient of Variation (CV) for segmentation and distance from reference for slice selection, are shown and discussed in the result section. The examples and outliers are used as case examples to give an overview of the performance of the Quantib software compared to manual slice selection and segmentation.
Statistical Analysis
Data of continuous variables were presented as mean ± standard deviation or median and Inter Quartile Range (IQR) depending on distribution. Categorical variables were reported as a frequency and percentage.
The area of the psoas muscle attained with automatic method was compared with the manual method using the mean or median difference, the average bias and 95% limits of agreement, the two-way mixed ICC, the within-subject CV (18), and Bland-Altman analysis (19). Additionally, to get insight into the performance of the method’s two components, the slice selection and segmentation were evaluated separately. Detailed comparison between automatic and manual slice selection was performed with visual inspection by one author (DvE) to determine the number of scans that were not on the same vertebra. Comparison of segmentation was performed using the Dice index, a metric that describes overlap between the two segmentations (0 = no overlap, 1 = perfect overlap). For evaluation of the segmentation the manually selected slices were used.
To investigate the method’s performance, the evaluation is furthermore shown between sexes and for different Body Mass Index (BMI) categories (normal/underweight: BMI = 25, overweight BMI > 25 and = 30 or obese BMI > 30) (13). Differences between groups were calculated with student t-test or one-way ANOVA and Tukey’s tests. Significance level was set at p < 0.05 and all analysis were performed in R statistical software version 3.6.0.
Results
Study Cohort
Of the 651 patients undergoing TAVR, 68 patients were excluded, 36 patients had no CT in their medical records, in 15 patients the lumbar section was not available on the scan, 12 patients had no full body scan at 1.5 or 3 mm and 5 patients had an unusable scan at L3 due to noise or artifacts. The remaining 583 patients had a mean age of 81 ± 6 year and 45% was female. A comprehensive list of patient characteristics is shown in Table 1.
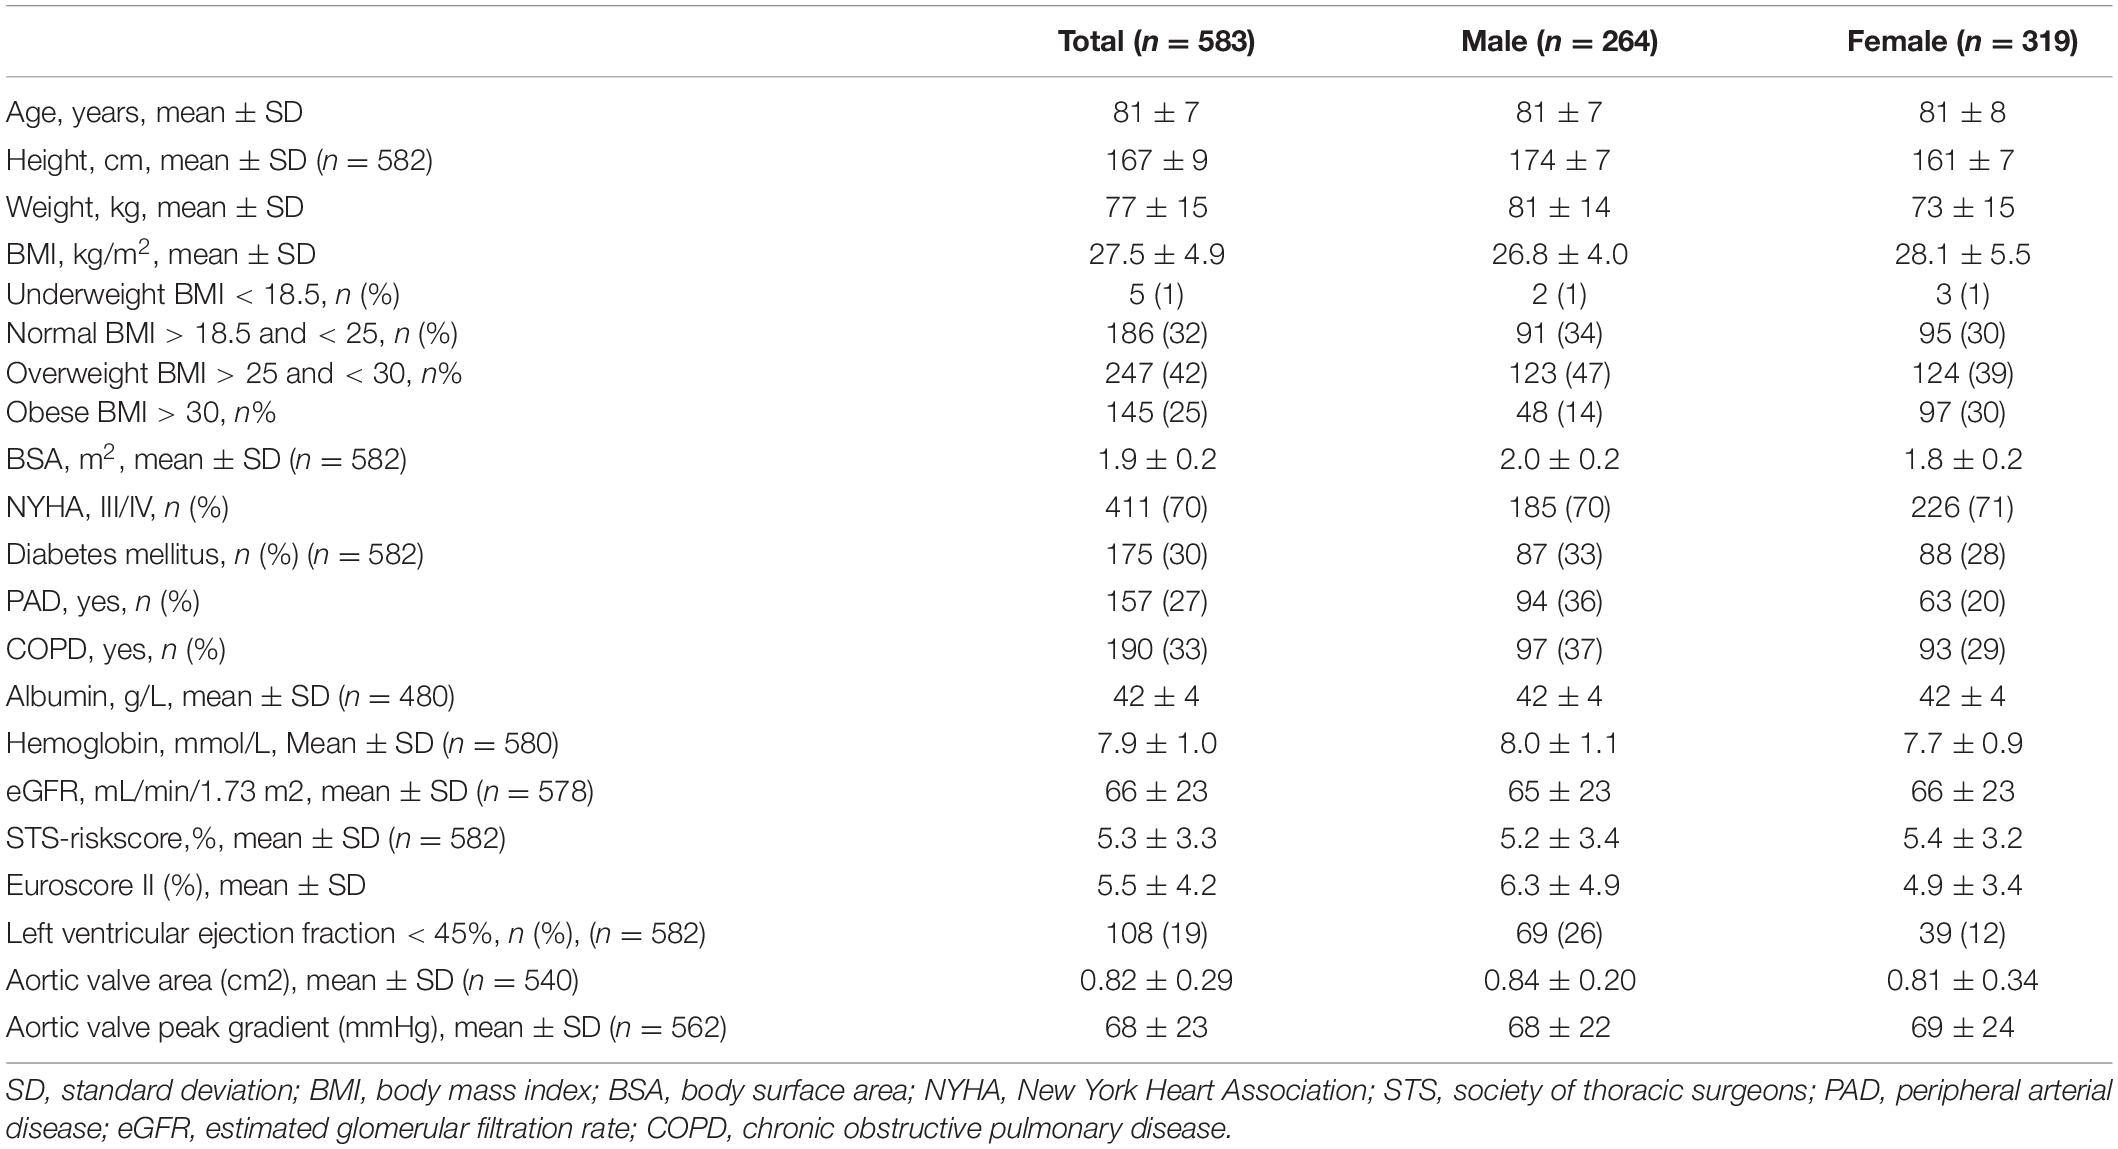
Table 1. Patient characteristics.
Evaluation of Psoas Measurement
In the fully automatic method, i.e., automatic slice selection followed by automatic segmentation, the average measured psoas muscle area was 15.4 ± 4.6 cm2 for the manual method and 14.7 ± 4.7 cm2 for the automatic method. Median difference was 1.54 cm2 [IQR: 0.78–2.96], and Bland-Altman analysis (Figure 1) showed a bias of −0.69 cm2 with a 95% limit of agreement of −6.60 to –5.23 cm2. The fully automatic muscle assessment had an ICC of 0.78 [95% CI: 0.74–0.82] and a within-subject CV of 11.2% [95% CI: 10.2–12.2]. Male patients had a significantly lower within-subject CV than female patients, 10.0% [8.6–11.4] vs. 12.2% [10.8–13.6] (p = 0.03). No significant differences were seen among the BMI groups.
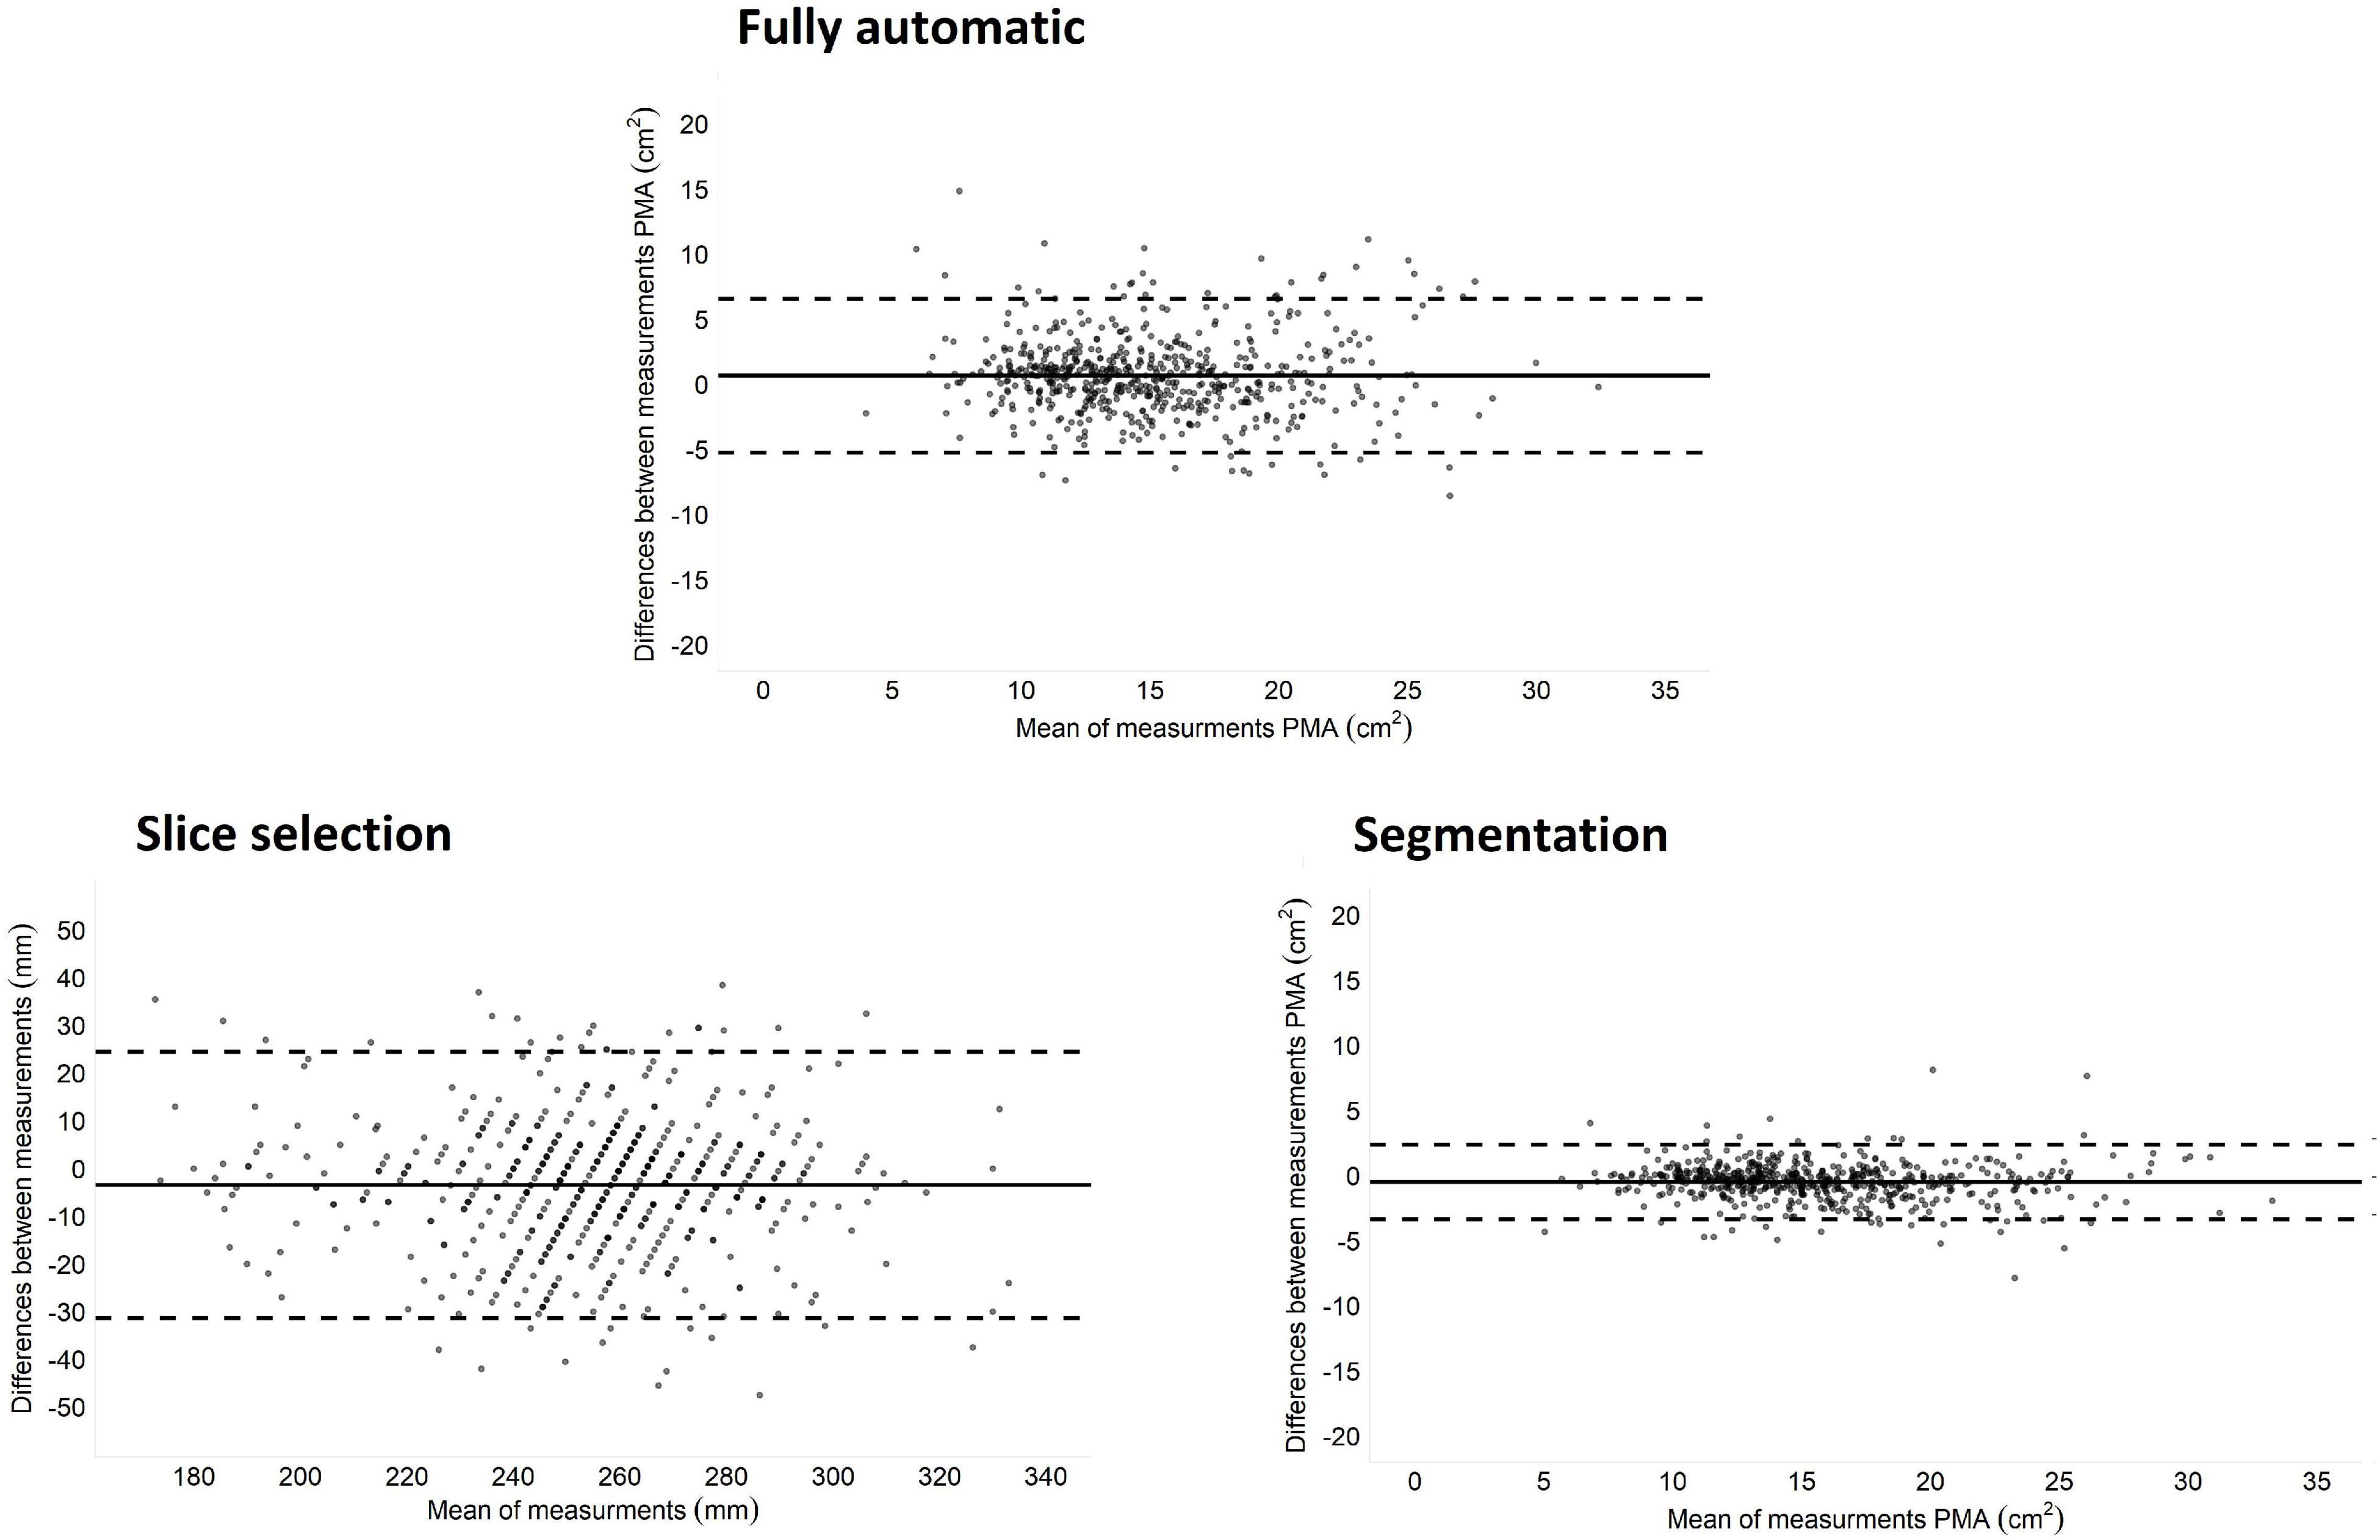
Figure 1. Bland-Altman plots of difference between the manual and automatic method. Fully automatic is automatic slice selection followed by automatic segmentation compared to complete manual slice selection and segmentation. Slice selection is automatic versus manual slice selection. Segmentation is automatic versus manual segmentation on the manual selected slice.
Evaluation of L3 Slice Selection
Median difference in slice selection was 7.5 mm [IQR: 3.0–16.5] and the bias was 3.4 mm with 95% limits of agreement of −24.5 to 31.4 mm. Visual inspection showed that 84% of the slices were on the same vertebra in both methods. The other 16% of the automatic selected slices were one slice higher or lower than the manual selected slice and one scan had an automatic selected slice two vertebra higher than the manual selected slice (Figure 2). Slice selection had an ICC of 0.86 [95% CI: 0.83–0.89] and a within-subject CV of 3.0% [95% CI: 2.8–3.3]. For slice selection male patients had a significantly lower within-subject CV than female patients, 2.7% [2.4–3.0] vs. 3.3% [2.9–3.7] (p = 0.01). There were no significant differences between BMI groups.
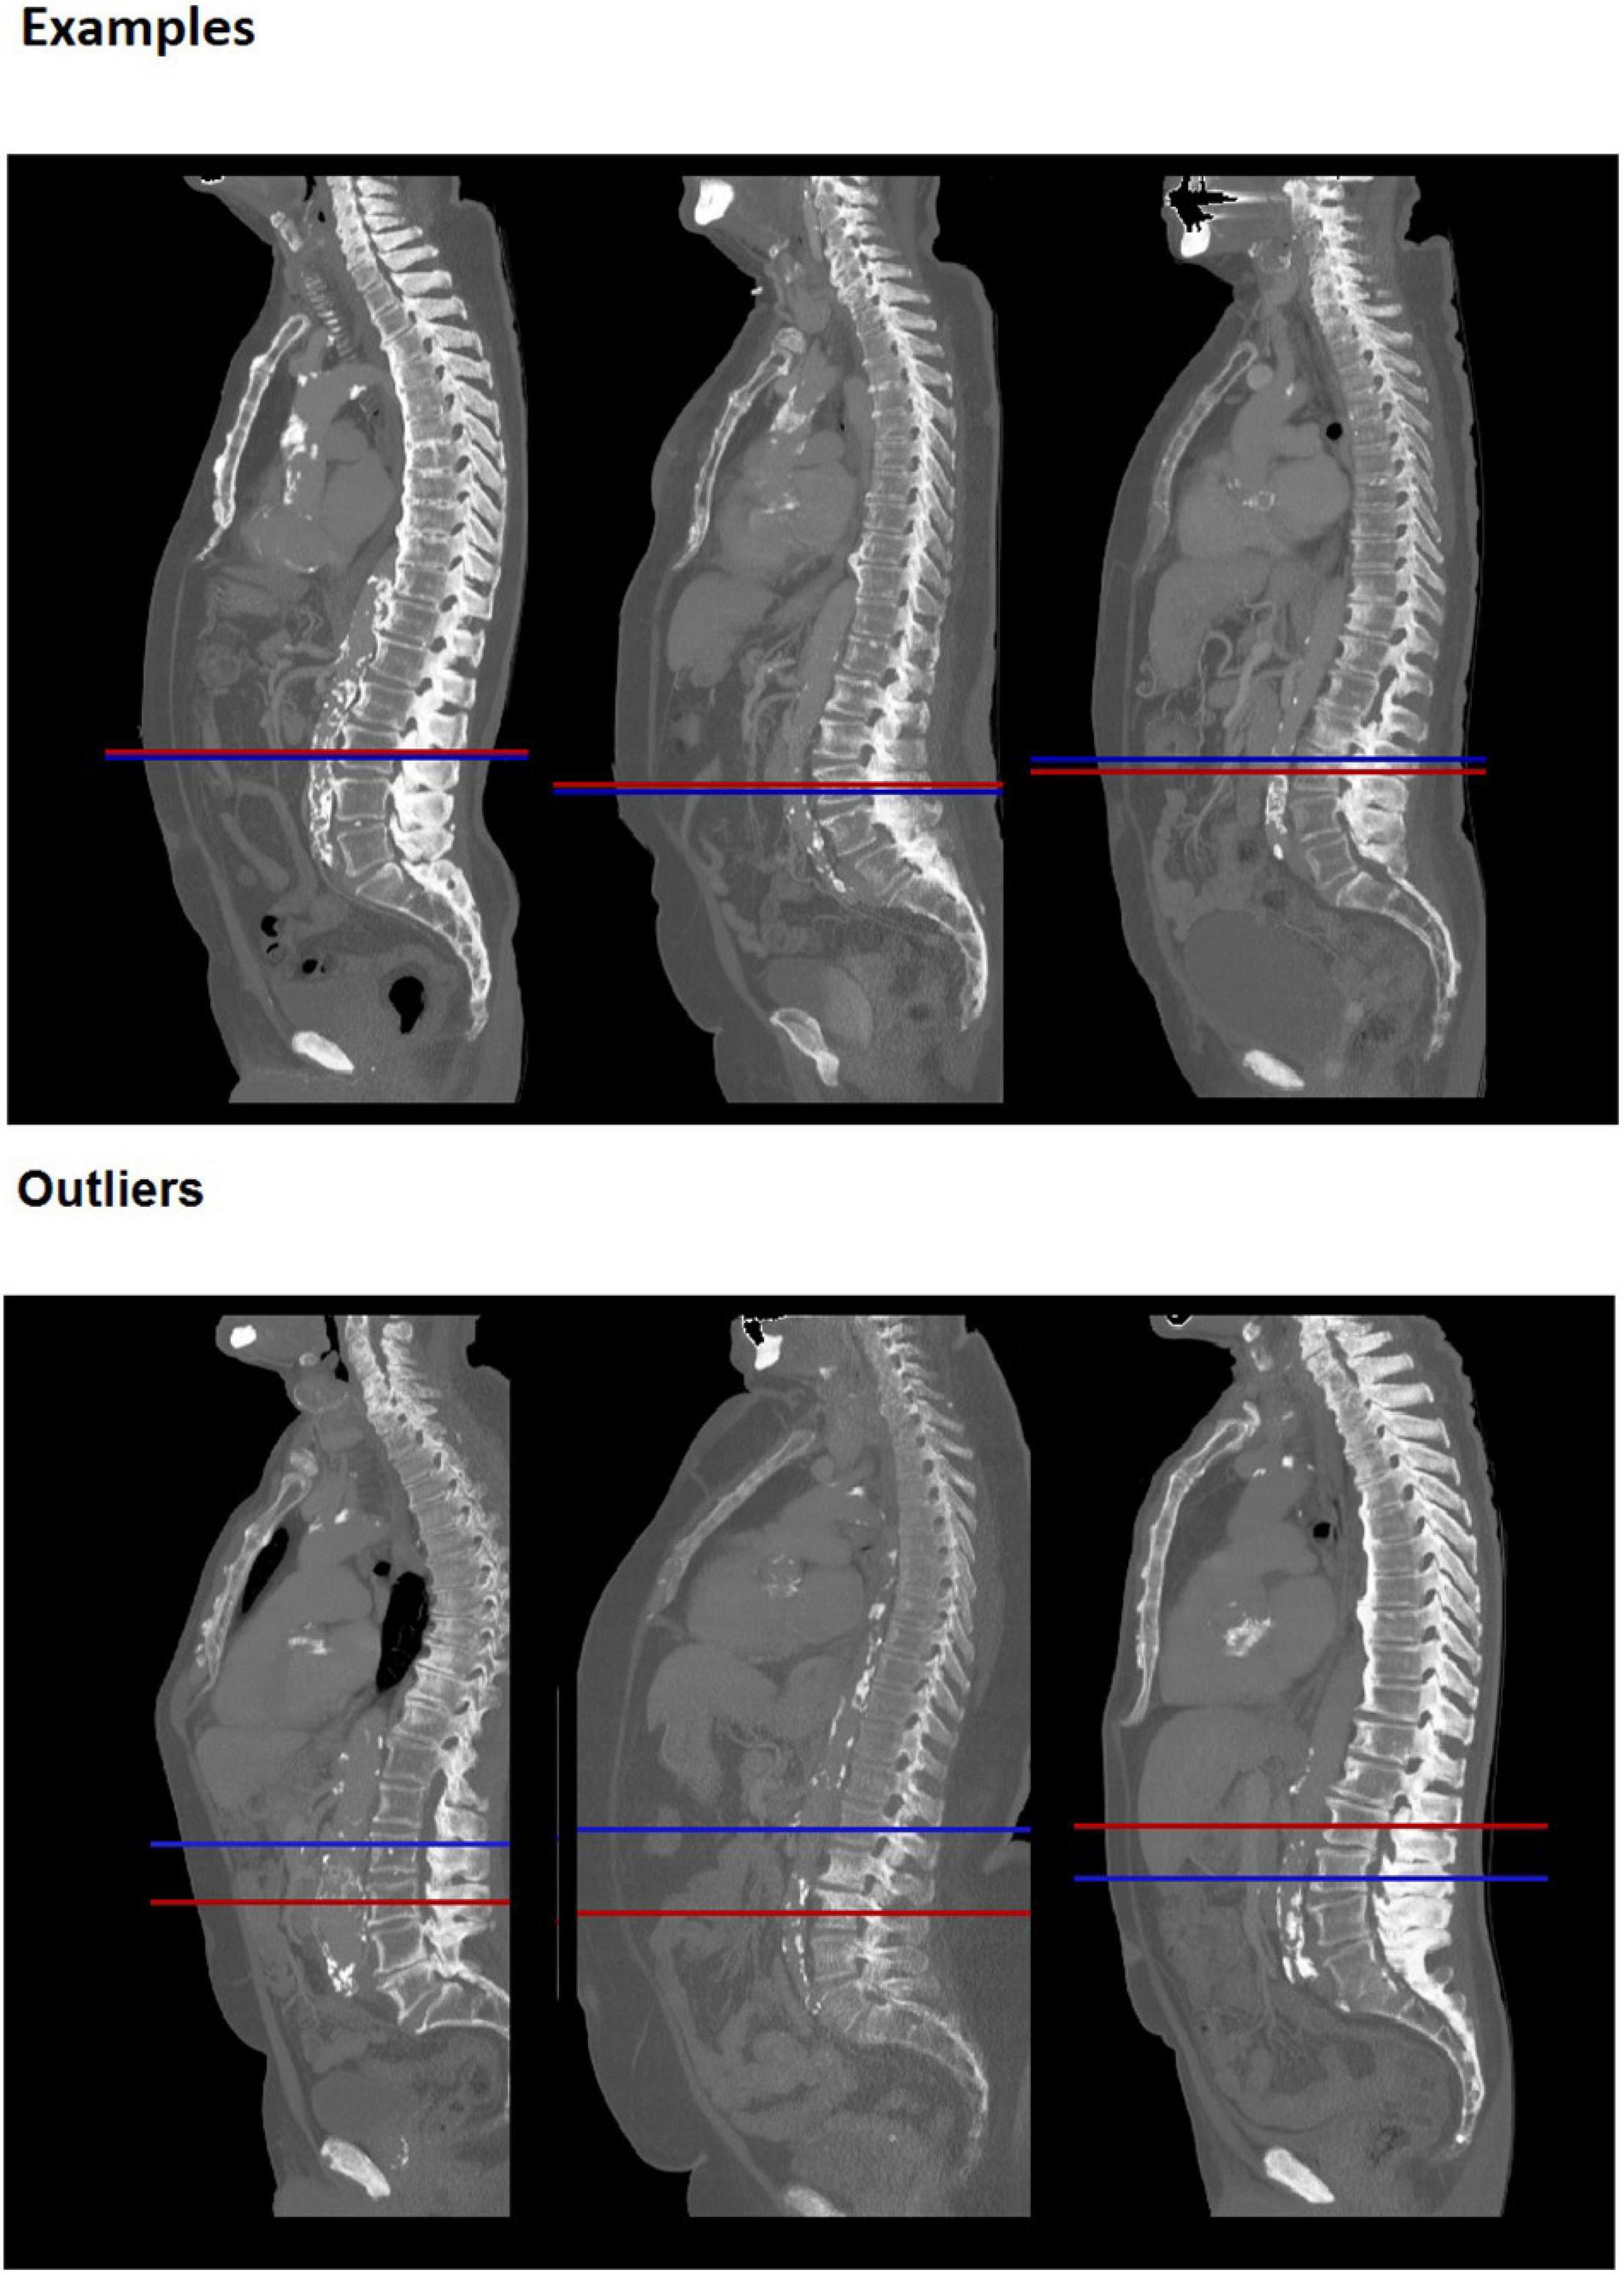
Figure 2. Examples of slice selection. Upper random examples and lower largest outliers, for 6 different patients. Red line: manually selected slice, Blue line: automatically selected slice. The bottom left and bottom middle example were incorrectly selected in the automatic analysis, which identified slices at L2 and L1 level, respectively. The bottom right example was incorrectly selected by the manual method and is correctly identified by the automatic analysis.
Evaluation of Psoas Muscle Segmentation on the Manual Selected Slice
Average psoas muscle area was 15.4 ± 4.6 cm2 for manual segmentation and 14.9 ± 4.6 cm2 for the automatic segmentation (Table 2). Median difference between methods was 0.69 cm2 [IQR:0.31–1.19], and Bland-Altman analysis (Figure 1) showed a bias of −0.55 cm2 with a 95% limit of agreement of −2.80 to 1.71 cm2 and an ICC of 0.96 [95% CI: 0.93–0.98]. Overall Dice index was 0.93 ± 0.04 and within-subject CV was 4.4% [95% CI: 4.0–4.8]. Examples of three randomly segmented CT scans and the three largest outliers, based on within-subject CV are shown in Figure 3. For male patients the Dice index was significantly higher 0.94 ± 0.03 vs. 0.92 ± 0.05 (p < 0.001) and the within-subject CV was significantly lower 3.7% [3.3–4.1] vs. 5.0% [4.4–5.6] (p < 0.001) than for female patients. Overweight and obese patients had significantly higher Dice index than patients in the normal/underweight group, 0.94 ± 0.03 and 0.94 ± 0.03 vs. 0.92 ± 0.06 (p < 0.001), respectively. The within-subject CV was significant lower in obese patients compared to the normal/underweight group, 3.6% [3.1–4.1] vs. 5.2% [4.3–6.0] (p = 0.008).
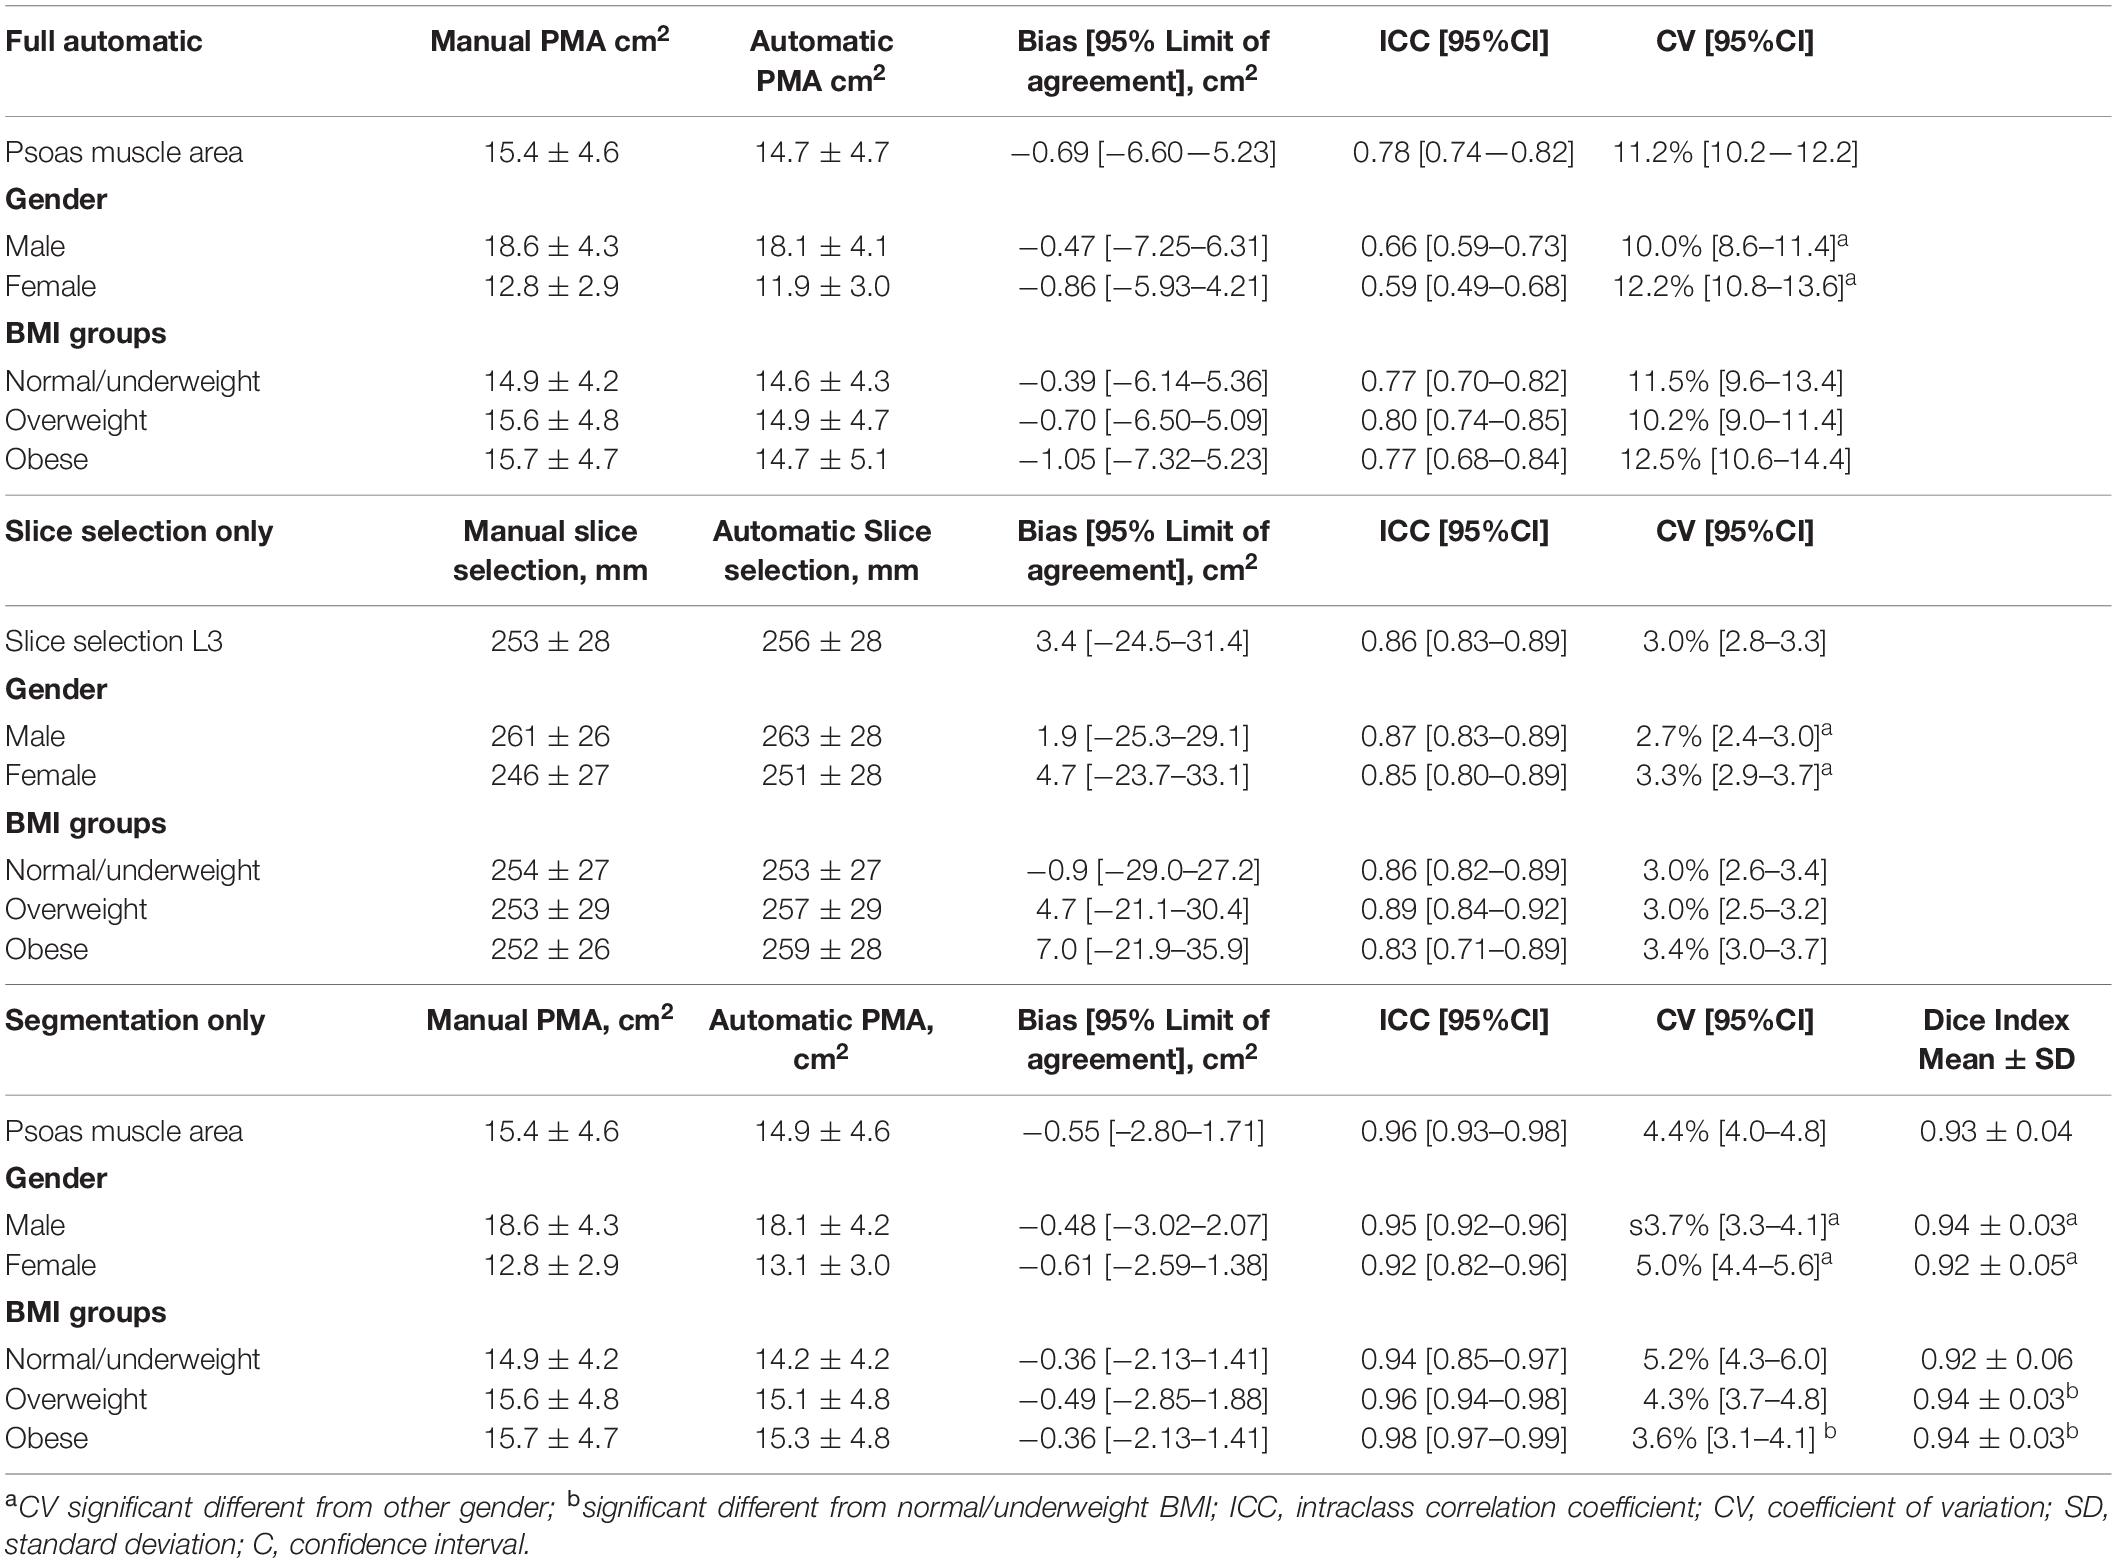
Table 2. Comparison between manual and automatic segmentation, slice selection and fully automatic assessment of psoas muscle area.
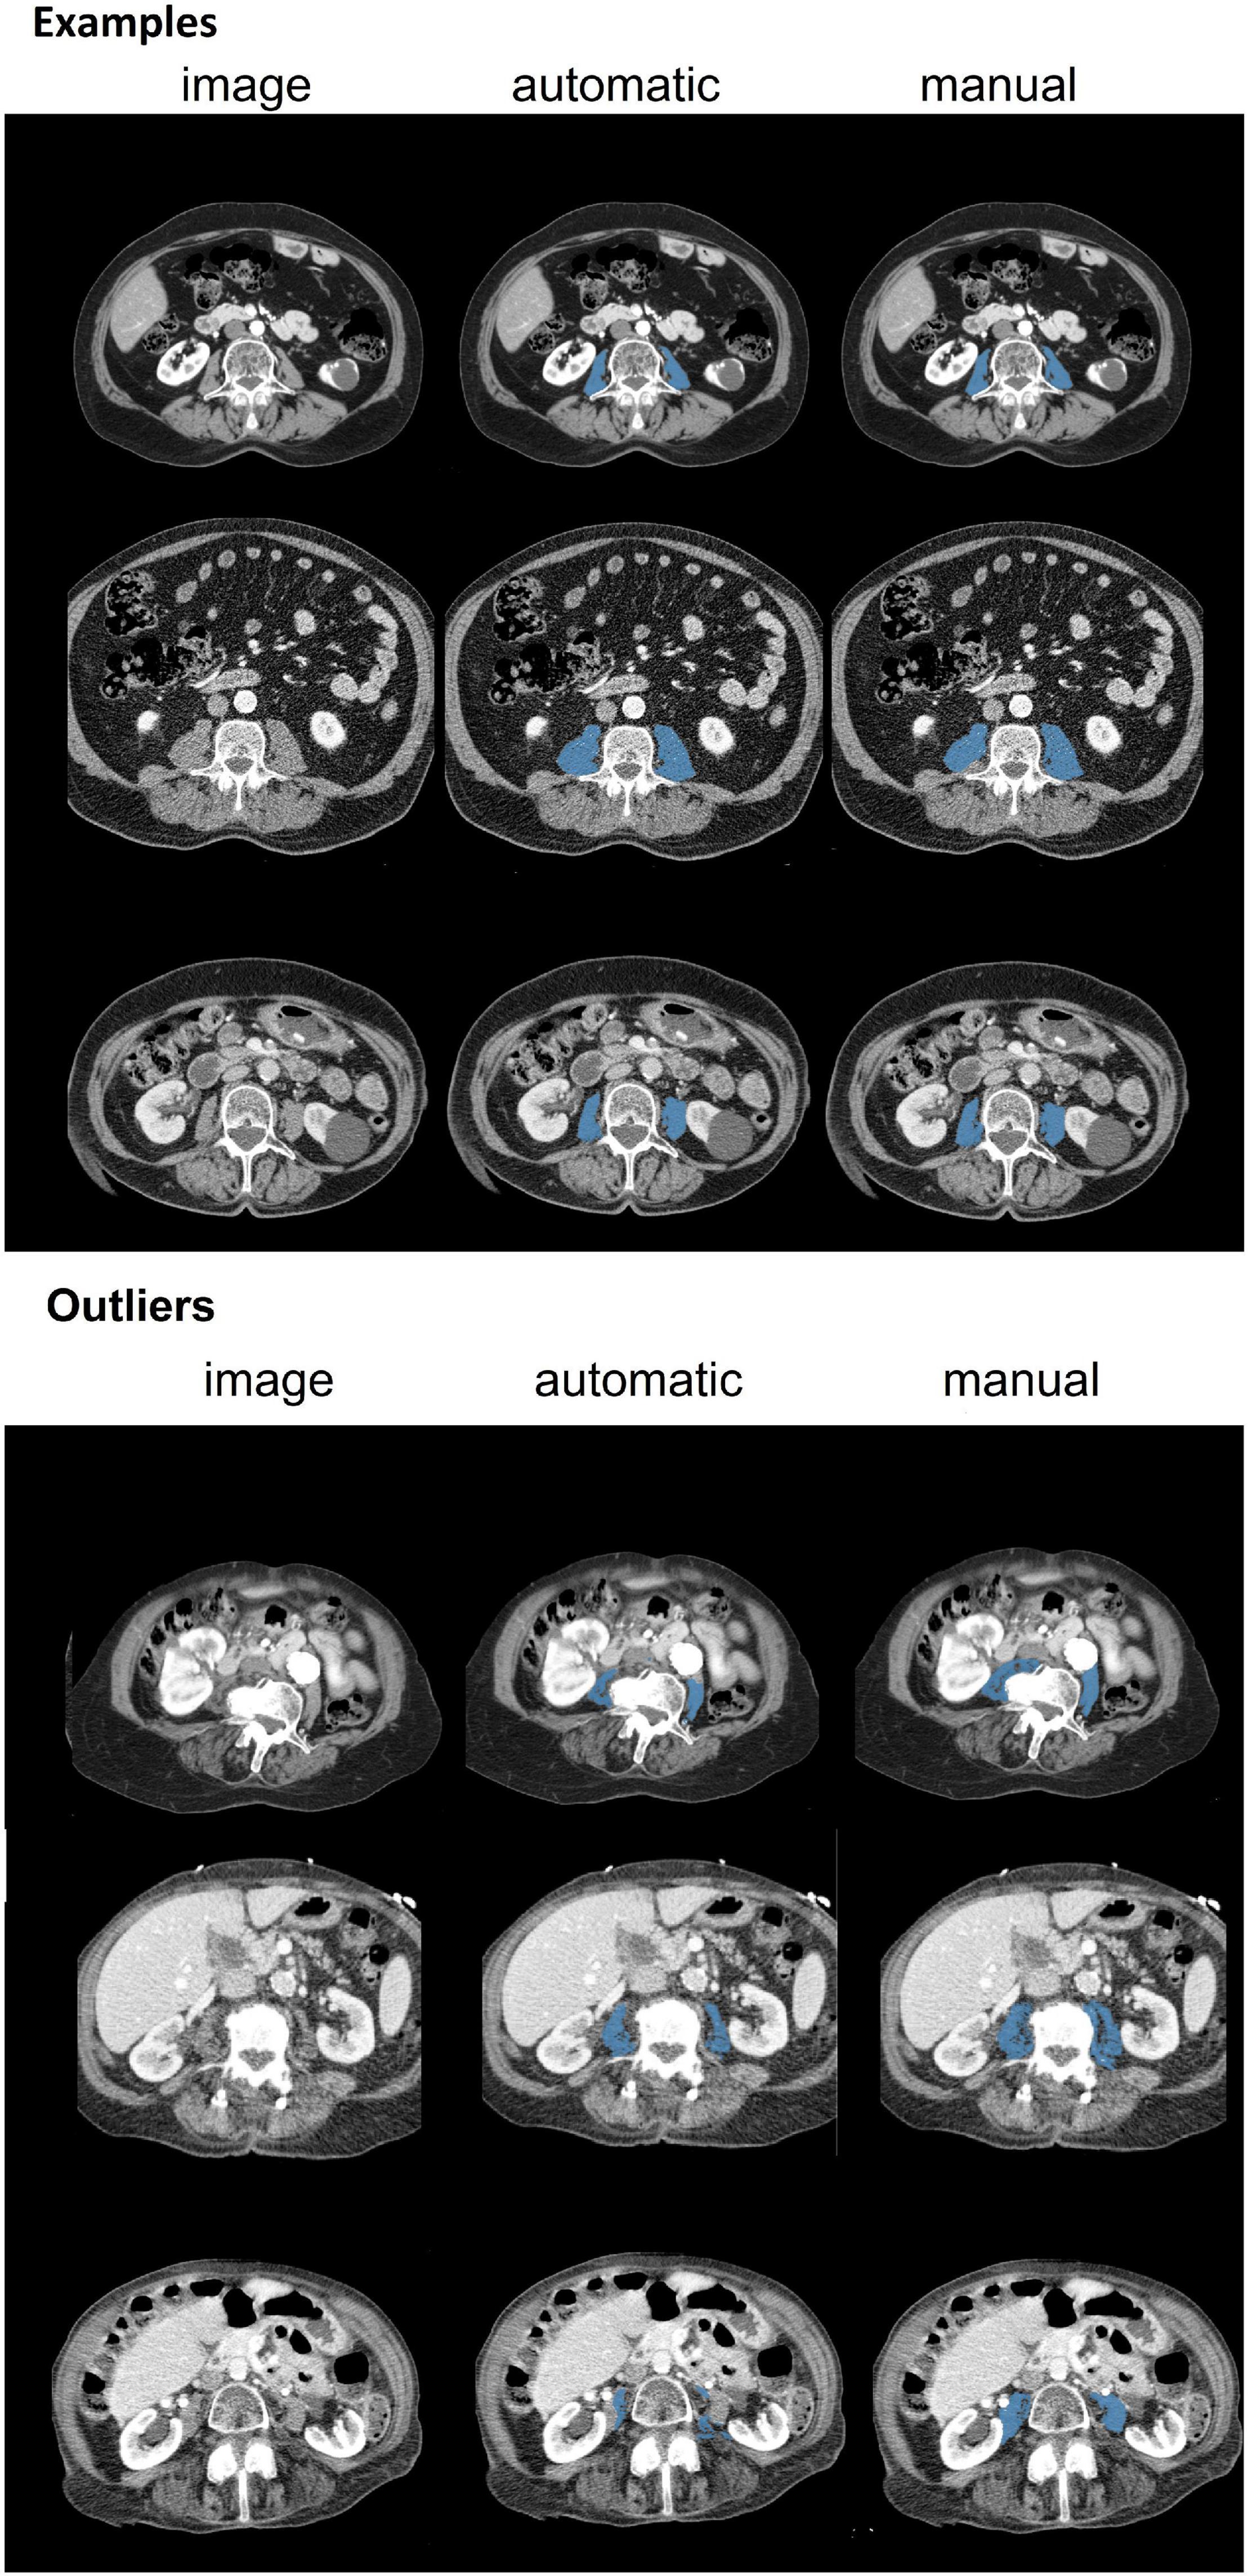
Figure 3. Examples of three randomly selected CT scans and three largest outliers for 6 different patients. Dice indices for these examples were 0.92 (top row), 0.90 (middle row) and 0.93 (bottom row). Dice indices for outliers were 0.74 (top row), 0.75 (middle row) and 0.36 (bottom row). The outlier shown in the top row contains an artifact, the middle row shows an overexposed vertebra and the bottom row shows an uncommon distribution of connective tissue, organs and muscle area and is incorrectly segmented by the automatic software.
Discussion
The aim of the study was to compare fully automatic psoas muscle area measurements and manual psoas muscle area measurements on a CT scan at the level of L3 vertebra. The results showed that automatic slice selection identified slices on the same vertebra as the manual selection in 84% of the cases and otherwise was one vertebra higher of lower than manual selected slice. The Dice index for the psoas segmentation was high with a score of 0.93, which means that overlap between methods is on average 93%.
This is the first study to evaluate assessment of the psoas muscle at L3 level in CT scans with automatic deep learning-based software (12). Concurrent slice selection between the manual and automatic method was correct in a vast majority off the CT scans. The median difference was 7.5 mm which is well within the range of the L3 vertebra, with a height of approximately 30 mm (20). Given that there is no substantial change of psoas muscle area over the entire vertebra height at the L3 level (8), it can be expected that small variations in slice selection within the range of L3 vertebra do not lead to a systematic segmentation error (21, 22). Besides a good performance on slice selection, we also observed that the difference between the manual and automatic segmentation is comparable with the interobserver variability of the manual method performed by trained researchers (16, 23, 24). Indeed, multiple studies in TAVR and pancreatitis patients observed an interobserver ICC of approximately 0.97 between trained researchers, which is close to our observed ICC of 0.96 (16, 23, 24).
In-depth analysis showed differences in Dice index and within-subject CV between the manual and automatic method for sex and BMI. Male, overweight and obese patients had a higher Dice index and lower within-subject CV compared to the female and normal/underweight patients. These results could be explained by the larger psoas muscle area in the male and overweight patients. Incorrectly segmented voxels in one of the methods have relatively less impact in patients with a larger psoas muscle area. Furthermore, these patients have relatively less transition from the psoas to the quadratus lumborum and erector spinae, because this area is more prone to segmentation errors, less transition area leads to lower differences (8). Similar results have been found earlier in other studies, in which groups with larger psoas muscle area also showed a higher Dice index between methods (13). However, differences were only small and most likely not clinically significant.
The results of this study have important implications for research and clinical practice. Automatic software provides the possibility to process large sets of CT scans without high costs of time and expertise. Large scale studies can be performed on available routine clinical scans in various patient populations to search for imaging biomarkers that predict clinical outcomes such as total muscle area at the level of L3 vertebra, muscle quality which can be measured as muscle density, or intra- and intermuscular adipose tissue (25). Furthermore, segmentation of muscle mass and muscle quality can easily be performed over multiple slices. Future research can therefore focus on muscle volume instead of muscle area. Some studies with deep learning have already been performed correctly determining volume of iliopsoas (26). However, it is currently unknown if complete volume is also predictive of clinical outcomes. Therefore, our study first focused on complete manual slice selection and segmentation of psoas muscle area on single slice. For clinical practice the fully automatic method can offer tremendous opportunity, as it could be applied, with limited overhead, alongside any clinical protocol that includes abdominal CT. The automatic method makes it possible to use this data during daily clinical practice. The information about muscle mass can be used to identify frail, malnourished or sarcopenic patients at higher risk of adverse clinical outcomes, which is currently not used in clinical practice (1, 2). In TAVR patients, other surgical patients and community based older adults it is already shown that low muscle mass and low psoas muscle area are associated with negative clinical outcomes including length of stay, physical decline and mortality (3, 27, 28). Patients identified with low muscle mass can be selected to receive extra specialized care and preventive treatment including supervision from a dietician and physiotherapist to increase muscle mass, which is of interest for future research (29, 30).
This is the first study that applies deep learning-based software for automatic muscle assessment on the CT scan in a large cohort of elderly cardiac patients. In-depth analysis of the method comprised of slice selection and segmentation was performed providing a complete overview of the performance of the automatic muscle assessment. The study has some limitations. First, the comparison between automatic and manual segmentation was limited to psoas muscle area, while the software can also segment abdominal muscle area, long-spine muscle area, visceral fat area and subcutaneous fat area. However, the narrow field of view of the scans prohibited accurate analysis of these tissues in several patients. Second, the study is single center by design and includes only patients planned for TAVR, i.e., patients with severe aortic stenosis. However, the employed body composition method is trained using images from various patient populations and with various acquisition protocols (e.g., with and without contrast agents). It is likely that the performance of the method will generalize to other cohorts, because muscle composition is relatively similar among cohorts (31–33). However, this hypothesis should be confirmed in future studies, especially in groups with extreme or deviating muscle composition. Finally, manual segmentation and slice selection were used as reference standard. Although manual segmentation is generally an accepted method, which is validated and has good performances, manual slice selection and segmentation can contain human errors, as can be seen by the largest outliers in this study.
To conclude, fully automatic deep learning-based assessment of muscle area on a CT scan offers an accurate and reliable alternative for the currently used manual method. It is a tool that offers great opportunities for analysis in large scale studies and in clinical applications.
Data Availability Statement
The dataset used in this study can be found in an online repository with digital object identifier: doi: 10.21942/uva.19403444.v1.
Ethics Statement
The studies involving human participants were reviewed and approved by the METC AMC. The patients/participants provided their written informed consent to participate in this study.
Author Contributions
DV, RD, and JS performed the first draft of the manuscript in close cooperation with all other authors. MV and YJ performed manual slice selection and segmentation. PM performed the automatic deep learning assessment of the psoas muscle area, both blinded for the contradicting method. DV performed the performance of all analysis. All authors did cooperate in the concept and design of the manuscript, interpretation of data and gave critical revision on the full manuscript.
Funding
This work was supported by an internal grant from the Amsterdam UMC, location AMC, and the Amsterdam University of Applied Sciences (171107/2017.03.xxx). We acknowledge the support from the Netherlands CardioVascular Research Initiative: the Dutch Heart Foundation (CVON 2018-28 and 2012-06 Heart Brain Connection), Dutch Federation of University Medical Centres, the Netherlands Organisation for Health Research and Development, and the Royal Netherlands Academy of Sciences.
Conflict of Interest
PM was employed by Quantib-U. BD was Artificial Intelligence lead and cofounder of Quantib-U. II was a cofounder and Scientific lead at Quantib-U.
The remaining authors declare that the research was conducted in the absence of any commercial or financial relationships that could be construed as a potential conflict of interest.
Publisher’s Note
All claims expressed in this article are solely those of the authors and do not necessarily represent those of their affiliated organizations, or those of the publisher, the editors and the reviewers. Any product that may be evaluated in this article, or claim that may be made by its manufacturer, is not guaranteed or endorsed by the publisher.
Footnotes
References
1. Cederholm T, Jensen GL, Correia MITD, Gonzalez MC, Fukushima R, Higashiguchi T, et al. ESPEN endorsed recommendation GLIM criteria for the diagnosis of malnutrition - a consensus report from the global clinical nutrition community. Clin Nutr. (2019) 38:1–9. doi: 10.1016/j.clnu.2018.08.002
2. Cruz-Jentoft AJ, Bahat G, Bauer J, Boirie Y, Bruyère O, Cederholm T, et al. Sarcopenia: revised European consensus on definition and diagnosis. Age Ageing. (2019) 48:16–31. doi: 10.1093/ageing/afy169
3. Beaudart C, Zaaria M, Pasleau F, Reginster J-Y, Bruyère O. Health outcomes of sarcopenia: a systematic review and meta-analysis. PLoS One. (2017) 12:e0169548. doi: 10.1371/journal.pone.0169548
4. Chun de L, Lee PH, Hsiao DJ, Huang SW, Tsauo JY, Chen HC, et al. Effects of protein supplementation combined with exercise intervention on frailty indices, body composition, and physical function in frail older adults. Nutrients. (2018) 10:1916. doi: 10.3390/nu10121916
5. Martone AM, Marzetti E, Calvani R, Picca A, Tosato M, Santoro L, et al. Exercise and protein intake: a synergistic approach against sarcopenia. Biomed Res Int. (2017) 2017:2672435. doi: 10.1155/2017/2672435
6. Boutin RD, Yao L, Canter RJ, Lenchik L. Sarcopenia: current concepts and imaging implications. Am J Roentgenol. (2015) 205:W255–66. doi: 10.2214/AJR.15.14635
7. Paris MT. Body composition analysis of computed tomography scans in clinical populations: the role of deep learning. Lifestyle Genom. (2020) 13:28–31. doi: 10.1159/000503996
8. Park J, Gil JR, Shin Y, Won SE, Huh J, You MW, et al. Reliable and robust method for abdominal muscle mass quantification using CT/MRI: an explorative study in healthy subjects. PLoS One. (2019) 14:e0222042. doi: 10.1371/journal.pone.0222042
9. Mourtzakis M, Prado CMM, Lieffers JR, Reiman T, McCargar LJ, Baracos VE. A practical and precise approach to quantification of body composition in cancer patients using computed tomography images acquired during routine care. Appl Physiol Nutr Metab. (2008) 33:997–1006. doi: 10.1139/H08-075
10. Amini B, Boyle SP, Boutin RD, Lenchik L. Approaches to assessment of muscle mass and myosteatosis on computed tomography: a systematic review. J Gerontol A Biol Sci Med Sci. (2019) 74:1671–8. doi: 10.1093/gerona/glz034
11. Takahashi N, Sugimoto M, Psutka SP, Chen B, Moynagh MR, Carter RE. Validation study of a new semi-automated software program for CT body composition analysis. Abdom Radiol. (2017) 42:2369–75. doi: 10.1007/s00261-017-1123-6
12. Rozynek M, Kucybała I, Urbanik A, Wojciechowski W. The use of artificial intelligence in the imaging of sarcopenia: a narrative review of current status and perspectives. Nutrition. (2021) 89:111227. doi: 10.1016/j.nut.2021.111227
13. Paris MT, Tandon P, Heyland DK, Furberg H, Premji T, Low G, et al. Automated body composition analysis of clinically acquired computed tomography scans using neural networks. Clin Nutr. (2020) 39:3049–55. doi: 10.1016/j.clnu.2020.01.008
14. Ackermans LLGC, Volmer L, Wee L, Brecheisen R, Sánchez-gonzález P, Seiffert AP, et al. Deep learning automated segmentation for muscle and adipose tissue from abdominal computed tomography in polytrauma patients. Sensors. (2021) 21:1–13. doi: 10.3390/s21062083
15. Hashimoto F, Kakimoto A, Ota N, Ito S, Nishizawa S. Automated segmentation of 2D low-dose CT images of the psoas-major muscle using deep convolutional neural networks. Radiol Phys Technol. (2019) 12:210–5. doi: 10.1007/s12194-019-00512-y
16. van Mourik MS, Janmaat YC, van Kesteren F, Vendrik J, Planken RN, Henstra MJ, et al. CT determined psoas muscle area predicts mortality in women undergoing transcatheter aortic valve implantation. Catheter Cardiovasc Interv. (2019) 93:E248–54. doi: 10.1002/ccd.27823
17. Moeskops P, de Vos B, Veldhuis WB, de Jong PA, Išgum I, Leiner T. Automatic quantification of body composition at L3 vertebra level with convolutional neural networks. Eur Soc Radiol ECR. (2020). doi: 10.26044/ecr2020/C-09334
18. Shoukri MM, Colak D, Kaya N, Donner A. Comparison of two dependent within subject coefficients of variation to evaluate the reproducibility of measurement devices. BMC Med Res Methodol. (2008) 8:24. doi: 10.1186/1471-2288-8-24
19. Bland MB, Altman GA. Statistical methods for assessing agreement between two methods of clinical measurement. Lancet. (1986) 1:307–10. doi: 10.1016/s0140-6736(86)90837-8
20. Zhou SH, McCarthy ID, McGregor AH, Coombs RRH, Hughes SPF. Geometrical dimensions, of the lumbar vertebrae - analysis of data from digitised CT images. Eur Spine J. (2000) 9:242–8. doi: 10.1007/s005860000140
21. Hioki A, Miyamoto K, Shimizu K, Inoue N. Test-retest repeatability of lumbar sagittal alignment and disc height measurements with or without axial loading: a computed tomography study. J Spinal Disord Tech. (2011) 24:93–8. doi: 10.1097/BSD.0b013e3181dd611f
22. MacDonald AJ, Greig CA, Baracos V. The advantages and limitations of cross-sectional body composition analysis. Curr Opin Support Palliat Care. (2011) 5:342–9. doi: 10.1097/SPC.0b013e32834c49eb
23. Ozola-Zâlîte I, Mark EB, Gudauskas T, Lyadov V, Olesen SS, Drewes AM, et al. Reliability and validity of the new vikingslice software for computed tomography body composition analysis. Eur J Clin Nutr. (2019) 73:54–61. doi: 10.1038/s41430-018-0110-5
24. Saji M, Lim DS, Ragosta M, LaPar DJ, Downs E, Ghanta RK, et al. Usefulness of psoas muscle area to predict mortality in patients undergoing transcatheter aortic valve replacement. Am J Cardiol. (2016) 118:251–7. doi: 10.1016/j.amjcard.2016.04.043
25. Bosch de Basea M, Salotti JA, Pearce MS, Muchart J, Riera L, Barber I, et al. Trends and patterns in the use of computed tomography in children and young adults in catalonia — results from the EPI-CT study. Pediatr Radiol. (2016) 46:119–29. doi: 10.1007/s00247-015-3434-5
26. Fitzpatrick JA, Basty N, Cule M, Liu Y, Bell JD, Thomas EL, et al. Large-scale analysis of iliopsoas muscle volumes in the UK biobank. Sci Rep. (2020) 10:1–10. doi: 10.1038/s41598-020-77351-0
27. Bertschi D, Kiss CM, Schoenenberger AW, Stuck AE, Kressig RW. Sarcopenia in patients undergoing transcatheter aortic valve implantation (TAVI): a systematic review of the literature. J Nutr Heal Aging. (2021) 25:64–70. doi: 10.1007/s12603-020-1448-7
28. Soud M, Alahdab F, Ho G, Kuku KO, Cejudo M, Alexandre T, et al. Usefulness of skeletal muscle area detected by computed tomography to predict mortality in patients undergoing transcatheter aortic valve replacement: a meta-analysis study. Int J Cardiovasc Imaging. (2019) 35:1141–7. doi: 10.1007/s10554-019-01582-0
29. Deutz NEP, Bauer JM, Barazzoni R, Biolo G, Boirie Y, Bosy-Westphal A, et al. Protein intake and exercise for optimal muscle function with aging: recommendations from the ESPEN expert group. Clin Nutr. (2014) 33:929–36. doi: 10.1016/j.clnu.2014.04.007
30. Chun de L, Tsauo JY, Wu YT, Cheng CP, Chen HC, Huang YC, et al. Effects of protein supplementation combined with resistance exercise on body composition and physical function in older adults: a systematic review and meta-analysis. Nutrients. (2018) 10:1916. doi: 10.3945/ajcn.116.143594
31. Tokuda T, Yamamoto M, Kagase A, Koyama Y, Otsuka T, Tada N. Importance of combined assessment of skeletal muscle mass and density by computed tomography in predicting clinical outcomes after transcatheter aortic valve replacement. Int J Cardiovasc Imaging. (2020) 36:929–38. doi: 10.1007/s10554-020-01776-x
32. van der Werf A, Langius JAE, de van der Schueren MAE, Nurmohamed SA. Percentiles for skeletal muscle index, area and radiation attenuation based on computed tomography imaging in a healthy caucasian population. Eur J Clin Nutr. (2018) 72:288–96. doi: 10.1038/s41430-017-0034-5
33. Looijaard WGPM, Dekker IM, Stapel SN, Girbes ARJ, Twisk JWR, Oudemans-van Straaten HM, et al. Skeletal muscle quality as assessed by CT-derived skeletal muscle density is associated with 6-month mortality in mechanically ventilated critically ill patients. Crit Care. (2016) 20:1–10. doi: 10.1186/s13054-016-1563-3
Keywords: computed tomography, muscle assessment, artificial intelligence, psoas muscle area (PMA), body composition, sarcopenia
Citation: Van Erck D, Moeskops P, Schoufour JD, Weijs PJM, Scholte Op Reimer WJM, Van Mourik MS, Janmaat YC, Planken RN, Vis M, Baan J, Hemke R, Išgum I, Henriques JP, De Vos BD and Delewi R (2022) Evaluation of a Fully Automatic Deep Learning-Based Method for the Measurement of Psoas Muscle Area. Front. Nutr. 9:781860. doi: 10.3389/fnut.2022.781860
Received: 23 September 2021; Accepted: 14 March 2022;
Published: 12 May 2022.
Edited by:
Maurizio Muscaritoli, Sapienza Università di Roma, ItalyReviewed by:
Kyle Joseph Edmunds, University of Oxford, United KingdomMing Yang, Sichuan University, China
Copyright © 2022 Van Erck, Moeskops, Schoufour, Weijs, Scholte Op Reimer, Van Mourik, Janmaat, Planken, Vis, Baan, Hemke, Išgum, Henriques, De Vos and Delewi. This is an open-access article distributed under the terms of the Creative Commons Attribution License (CC BY). The use, distribution or reproduction in other forums is permitted, provided the original author(s) and the copyright owner(s) are credited and that the original publication in this journal is cited, in accordance with accepted academic practice. No use, distribution or reproduction is permitted which does not comply with these terms.
*Correspondence: Dennis Van Erck, ZC52YW5lcmNrQGFtc3RlcmRhbXVtYy5ubA==