- School of Public Health and Social Sciences, Muhimbili University of Health and Allied Sciences, Dar es Salaam, Tanzania
Background: Undernutrition remains a major public health problem in low- and middle-income countries and Comoros is no exception. This study aimed to examine the prevalence and identify the risk factors of undernutrition among children under-five years in Bambao region, Comoros.
Methods: This cross-sectional study was conducted in Bambao region among 837 under-five years and their caregivers. Analyses were conducted using both descriptive and logistic regression to examine the magnitude and factors associated with stunting, wasting and underweight.
Results: Prevalence of stunting, wasting and underweight were 21.6, 13.7, and 13.6% respectively. Factors associated with stunting were caregiver's secondary education level compared to no education (AOR = 1.89, 95% CI: 1.04–3.43, P < 0.04), age of child between 13–24 months compared to 0–12 months (AOR = 2.69, 95% CI: 1.44–5.01, P < 0.001), and food insecurity (AOR = 2.55, 95% CI: 1.20–5.41, P < 0.02). Children aged 25–59 months were 78% less likely to have wasting compared to those with 0–12 months (AOR = 0.22, 95% CI: 0.10–0.51, P < 0.001). Wasting was also associated with food insecurity (AOR = 2.70, 95% CI: 1.12–6.49, P < 0.03), and low birthweight (AOR = 3.21, 95% CI: 1.73–5.94, P < 0.001). Children aged between 25–59 months were 86% less likely to have underweight compared to those aged 0–12 months (AOR = 0.14, 95% CI: 0.06–0.36, P < 0.001). Food insecurity (AOR = 2.65, 95% CI: 1.08–6.54, P < 0.03), low birthweight (AOR = 3.15, 95% CI: 1.67–5.93, P < 0.001), and non-exclusively breastfeeding (AOR = 2.37, 95% CI: 1.15–4.90, P < 0.02) were also associated with underweight.
Conclusion: More than one in five children under-five is stunted in Bambao region, Comoros. Moreover, more than 13% are underweight or wasted calling for streamlined efforts to address poor feeding practices, food insecurity, low birthweight, and socio-demographic disadvantages in this and other areas with similar context.
Introduction
Childhood undernutrition is one of the global leading cause of under-five mortality and morbidity (1, 2), contributing to more than a third of 5.4 million preventable children deaths annually (3). Stunting, underweight, and wasting have significant short and long-term consequences on child growth, health, and development (4, 5). They include increased diseases severity (6), delayed physical and mental development (7), poor academic performance (8) and premature death (9). A child is considered to be stunted, wasted, or underweight when their height-for-age, weight-for-height, and weight-for-age, respectively, is minus two standard deviations below the median population (10, 11).
About 144 million children under-five years of age were stunted, while 47 million suffered from wasting, and 99 million were underweight in 2020 (12). Such unprecedented burden varies with regions, with African continent suffering the biggest brunt of the burden with 39.4% of stunting, 24.9% of underweight, and 10.3% of wasting among children under-five years of age (13–15). Although the prevalence of stunting among children under-five years decreased between 2000 and 2016, from 38 to 23%, the number of affected children had increased from 50.6 to 58.7 million owing to population growth (16).
Evidence suggested a multifactorial causes of undernutrition among children under-fives (1, 17). They ranged from basic causes such as poverty and other economic and demographic disadvantages (18); underlying factors such as food insecurity and poor water supply (19), access to health services (20); and immediate factors such as poor dietary patterns (2), childhood illnesses, among others. Such factors vary between and within countries and therefore call for local studies to ensure tailored interventions that are informed by evidence.
The burden of child undernutrition is not different in Comoros compared to other African countries (21, 22). Evidence from a nationally representative survey conducted a decade ago showed stunting, underweight, and wasting to be prevalent among 31.1, 16.9, and 11.3% of children under-fives. The recent national report indicated a decline of stunting to 22.6% (9, 22, 23). Evidence is scanty on the magnitude of undernutrition and its risk factors among children below 5 years in different regions (9, 24). Such evidence is important to design context-appropriate strategies to mitigate the unprecedented burden. Therefore, this study aimed to assess the prevalence of undernutrition and its associated factors among under-five children in Bambao region, Comoros.
Materials and Methods
Study Design and Setting
This cross-sectional study was conducted among children under-five years and their caregivers in Bambao region, Comoros in July 2021. The Union of Comoros consists of three main islands, which are Ngazidja, Anjouan and Moheli. About 75% of the population of 882,605 people lives in rural areas (25). Bambao region has a population of 73,000 people. The region is made of sixteen villages along the sea and the mountainous areas. Most of Bambao is sub-urban with farmlands and forests (26).
Study Population
The selected participants included children aged below 5 years and their caregivers who lived in Bambao region. The study excluded children with critical illnesses or disabilities.
Sample Size Determination
The sample size was determined using a single population proportion formula: n = Z2 P(1-P)/E2 (3). The national representative sample indicated the prevalence of 31.1% for stunting, wasting (11.3%) and underweight (16.9%) (9, 23). The standard normal deviate of 1.96 on using 95% confidence interval (Z) and 5% margin of error (E) were used, and gave a minimum sample size of 329. A design effect of 2, and 10% non-response (refusal or closed houses after three repeated visit) were considered (3). The minimum sample size was therefore 730.
Sampling Procedures and Technique
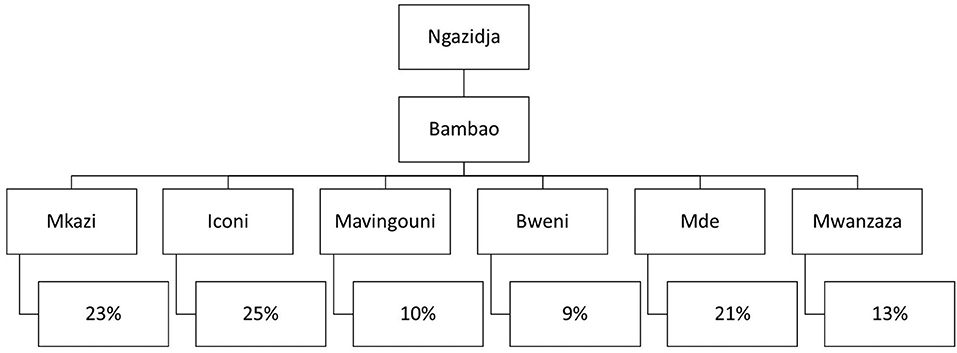
A multistage cluster sampling technique was used to enroll the study participants from the communities. First, the Bambao region was selected out of the seven regions in Ngazidja using simple random sampling (lottery) method. Second, six out of sixteen villages were similarly selected. Third, the total number of children under-five years in the selected villages was taken from the respective households using the registration at health posts. Then, the calculated sample size n = 730 was proportionally distributed to the selected villages based on the total number of households with under-five years children in each village. Finally, participants were selected using systematic random sampling technique after identifying the first household randomly in each village and proceed to the second participant based on the Kth interval (K = 3) (Figure 1). Whenever there were two or more children under-five years in a household, the youngest child was selected to avoid recall bias.
Study Variables and Their Measurements
The outcome variables were stunting, wasting, and underweight. All children below−2SD of height-for-age Z-score (HAZ), weight-for-age Z-score (WAZ) and weight-for-height Z-score (WHZ) for the reference population were considered stunted, underweighted and wasted respectively (27).
Independent variables included socio-demographic characteristics (age of child, child sex, age of mother/caregiver, family size, maternal/caregiver education level, household occupation, marital status of the mother and household wealth index); child characteristics (weight at birth, child feeding practices, childhood diseases/history of illness, feeding frequency, dietary diversity, and child immunization); and household characteristics (household food insecurity, main source of food, main source of water and antenatal care visit).
Child and caregiver's variables had their questions extracted from the Comorian Demographic and Health Survey 2012–2013 of women and children questionnaires. Education level was categorized into no formal education, primary level education, secondary level education and above secondary level education including college and others.
For feeding practices, exclusive breastfeeding was assessed through asking mothers/caregivers to recall on the period the child was exclusively breastfed as recommended by WHO (28). Responses were categorized into exclusively breastfed, or non-exclusively breastfed. Exclusive breastfeeding is defined as the practice of giving an infant breast-milk only for the first six months of life (28, 29). Complementary feeding referred to the time when introduction of soft, semi-solid and solid food item in addition to breast milk was done (30). Feeding frequency assessment was done by asking the mothers/caregivers to recall the number of times they fed/nourished their children in the previous 24 h as applied in others studies (31). A list of common food in Comoros was used to assess consumption of each of eight food groups provided by Food and Nutrition Technical Assistance (FANTA) and used to calculate the child Dietary Diversity Score (DDS) (32). The DDS ranged between 0–8 and consumption of food from at least four food groups means that the child has a high likelihood of consuming at least one animal source of food and at least one fruit or vegetable in addition to a staple food (grains, roots or tubers).
History of illness included malaria, fever, skin disease, oral disease, acute respiratory infections, pneumonia, vomiting, or diarrhea in the past 1 month as stated in previous studies (31). The responses were categorized into Yes or No. Child immunization, was defined as full immunized or not completed vaccination based on the United Nations International Children's Emergency Fund (UNICEF) guideline (11). Information was obtained from child's clinic cards. Antenatal Care visits during pregnancy of the child were categorized into three or less visits as low visit, or four and above visits as required number of visit recommended by the World Health Organization (WHO) (29). Birthweight of the child was categorized into below 2.5kg as low birthweight, between 2.5kg to 3.5kg as normal or above 3.5kg considered big baby (29). Household food insecurity access scale (HFIAS) was assessed using nine item questionnaires provided by FANTA (33). The scores were calculated according to the HFIAS Indicator guide. Generally, the scores are grouped into four categories; food secure, mildly insecure, moderately insecure and severely food insecure (33). In this study the mild, moderate and severe were collapsed into one group which resulted in two categories of HFIAS.
Household wealth index, was derived from household's possession, consumer goods or durable assets they own, ranging from a television to a bicycle or car, housing characteristics, such as source of drinking water, toilet facilities, and flooring materials which were adapted from previous study (34). Scores were derived from principal component analysis (PCA) using SPSS. There were 34 initial variables taken into principle component analysis in the SPSS, which were then iteratively reduced into 9 components. The first output component was selected as the wealth index as it showed the highest variation of 35% with a Kaiser-Meyer Measure Sampling adequacy of 0.758 which is considered acceptable. The wealth index for each household was weighted and then ranked before creating three equal wealth terciles. These were categorized as poor, middle and rich (4). For household economic activities, mothers/caretakers were asked to self-report the main occupation of the head of household. Responses were based on the main economic activities common in the area. There were four categories of occupation: farming, employees, businessman/woman, unskilled manual labor and unemployed. These were then classified as employed, self-employed and unemployed.
Data Collection Tools and Procedure
Quantitative data were collected using structured questionnaire. The tool was adopted from Comorian Demographic and Health Survey (CDHS) 2012/13 for household, caregivers and child factors (23). Mothers/caregivers were requested to provide consent to participate in the study. Interviews were conducted in privacy to enable respondents provide information. Field data collection was conducted in 4 weeks from 4th to 29th July 2021. Socio-demographic data of mothers/caregivers, child characteristics and household characteristics were collected using face-to-face interview. The questionnaire was prepared in English translated into Shi-Comore and administered by trained research assistants and principal investigator for data collection. An electronic data entry form was created using Kobo toolbox and used via smart phones for data collection. Before interview, the objective of the study was explained to study participants and it was guaranteed that the information will be kept confidential; then a written informed consent was obtained from mothers or caregivers. To ensure data quality, 2 days training were given to data collectors by principal investigator. The weight and height/length of all children were measured using the standard anthropometric measurement protocol designed by Food and Nutrition Technical Assistance project in 2007 (35). For children <2 years, weight were measured using Salter hanging weight scale and height was measured in recumbent position using standard measuring board calibrated in centimeters (36). Weight for children older than 2 years was measured using SECA digital weight scale to the nearest 0.1 kg and height was measured in standing position to the nearest 1 cm using UNICEF wooden height board (10, 37). Calibration for weight and height instruments was done upon every case examination. All measurements were taken twice and the mean values were used for data analysis. The child's age was recorded in months by observing the child's birth certificate or vaccination cards.
Data Entry and Analysis
Analyses were conducted using both descriptive and logistic regression methods. Descriptive statistics were used to estimate burden and assess characteristics of different forms of undernutrition. Anthropometric data were computed using Emergency Nutrition Assessment (ENA) 2007 software into Height-for-Age Z-scores (HAZ), Weight-for-Height Z-scores (WHZ) and Weight-for-Age Z-scores (WAZ) taking sex into consideration. The WHO classification was used to classify the nutritional status of the children (10). Both bivariate and multiple logistic regression analysis were used to determine risk factors of undernutrition (stunting, wasting and underweight). All variables found to be associated to undernutrition in bivariate analysis using Crude Odds Ratio with 95% CI at significant level of ≤ 0.2 were taken to multiple logistic regression analysis in order to control confounders. Statistical association between dependent and independent variables were declared significant at p-value of ≤ 0.05.
Results
Participants' Characteristics
Data of 837 children-caregivers' pairs were finally analyzed. Responding caregivers had a mean age of 29.5 (SD: 6.48), and the majority were the mothers (91.9%), married (88.2%) and had at least primary level education (74.7%). Most of the households were food secure (81.6%) and the main source of food was from purchasing (97.4%).
Most households (80.3%) had a dietary diversity more than four score (≥4) (Table 1). In terms of child feeding practices, nearly all children were breastfed (98.8%) and about half of them were exclusively breastfed during the first 6 months of life (53.2%) and nearly all children stopped breastfeeding before 24 months (99.7%). For most children, feeding frequency was <4 times per day (65%) (Supplementary Table 1). In terms of healthcare characteristics, most mothers attended antenatal care visits more than four times (62.4%) and nearly all children were born in a health facility (n = 98%). Most children completed vaccination or were on routine vaccination (95.2%). Around 54% of children had suffered any type of illnesses, most commonly fever (20.3%), cough (16.7%), diarrhea (12.8%) and malaria (8.1%). Boys had significantly more malaria episodes than girls (Supplementary Table 2).
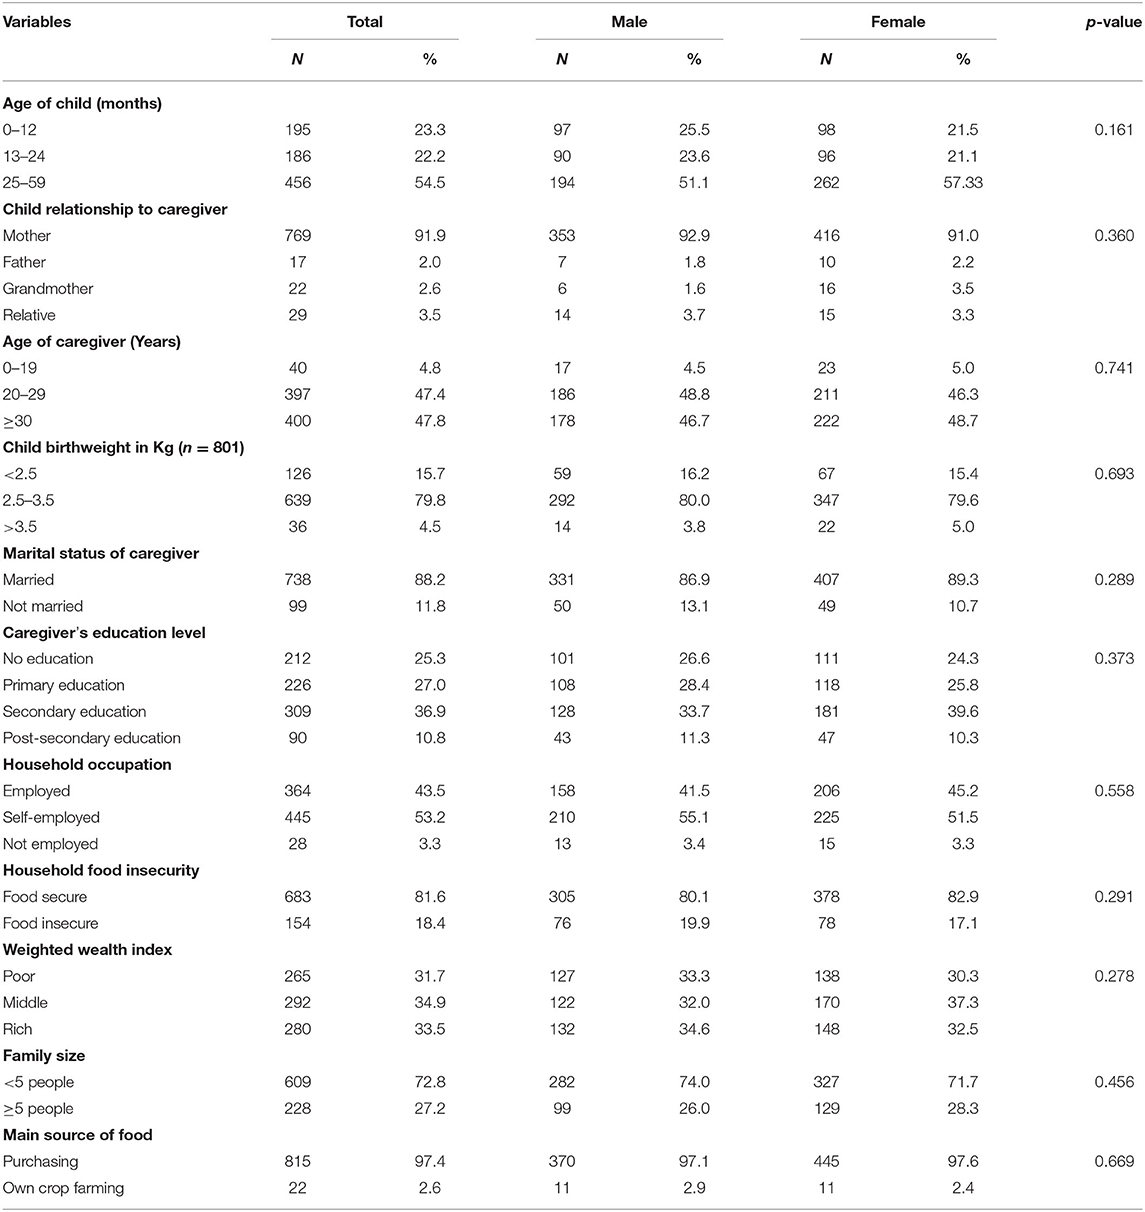
Table 1. Socio-demographic and household characteristics of children aged 0–59 months in Bambao region, July 2021 (N = 837).
Burden of Undernutrition
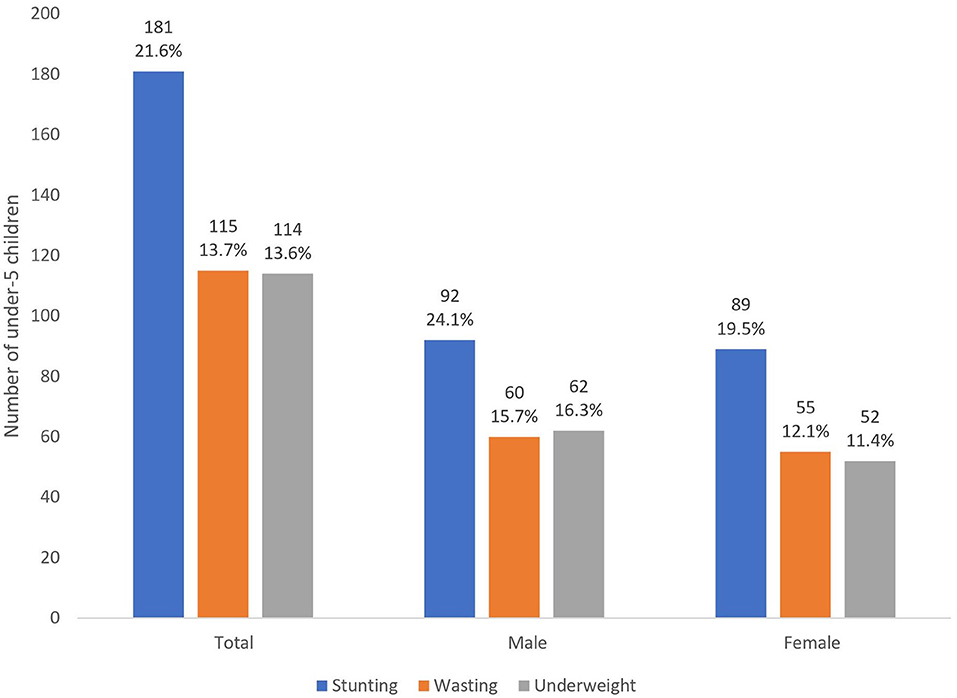
The prevalence of stunting, wasting and underweight was 21.6, 13.7, and 13.6%, respectively. The burden varied with child's sex, with higher prevalence among boys compared to girls. All forms were higher among boys (24.1% stunting, 15.7% wasting and 16.3% underweight) compared to girls (19.5% stunting, 12.1% wasting and 11.4% underweight). However, the difference did not reach a statistical significant level except for underweight (P = 0.041) (Figure 2).
Determinants of Stunting
After adjusting for covariates and confounders, children between 13–24 months were nearly three times more likely to be stunted compared to children 0–12 months, (AOR: 2.69, 95% CI 1.44–5.01). Also, food insecurity significantly increased the odds of stunting three-folds compared to being food-secure (AOR: 2.55, 95% CI 1.20–5.41). Children whose caregiver had secondary education were at increased odds of stunting in comparison to those who have no education (AOR: 1.89, 1.04–3.43) (Table 2).
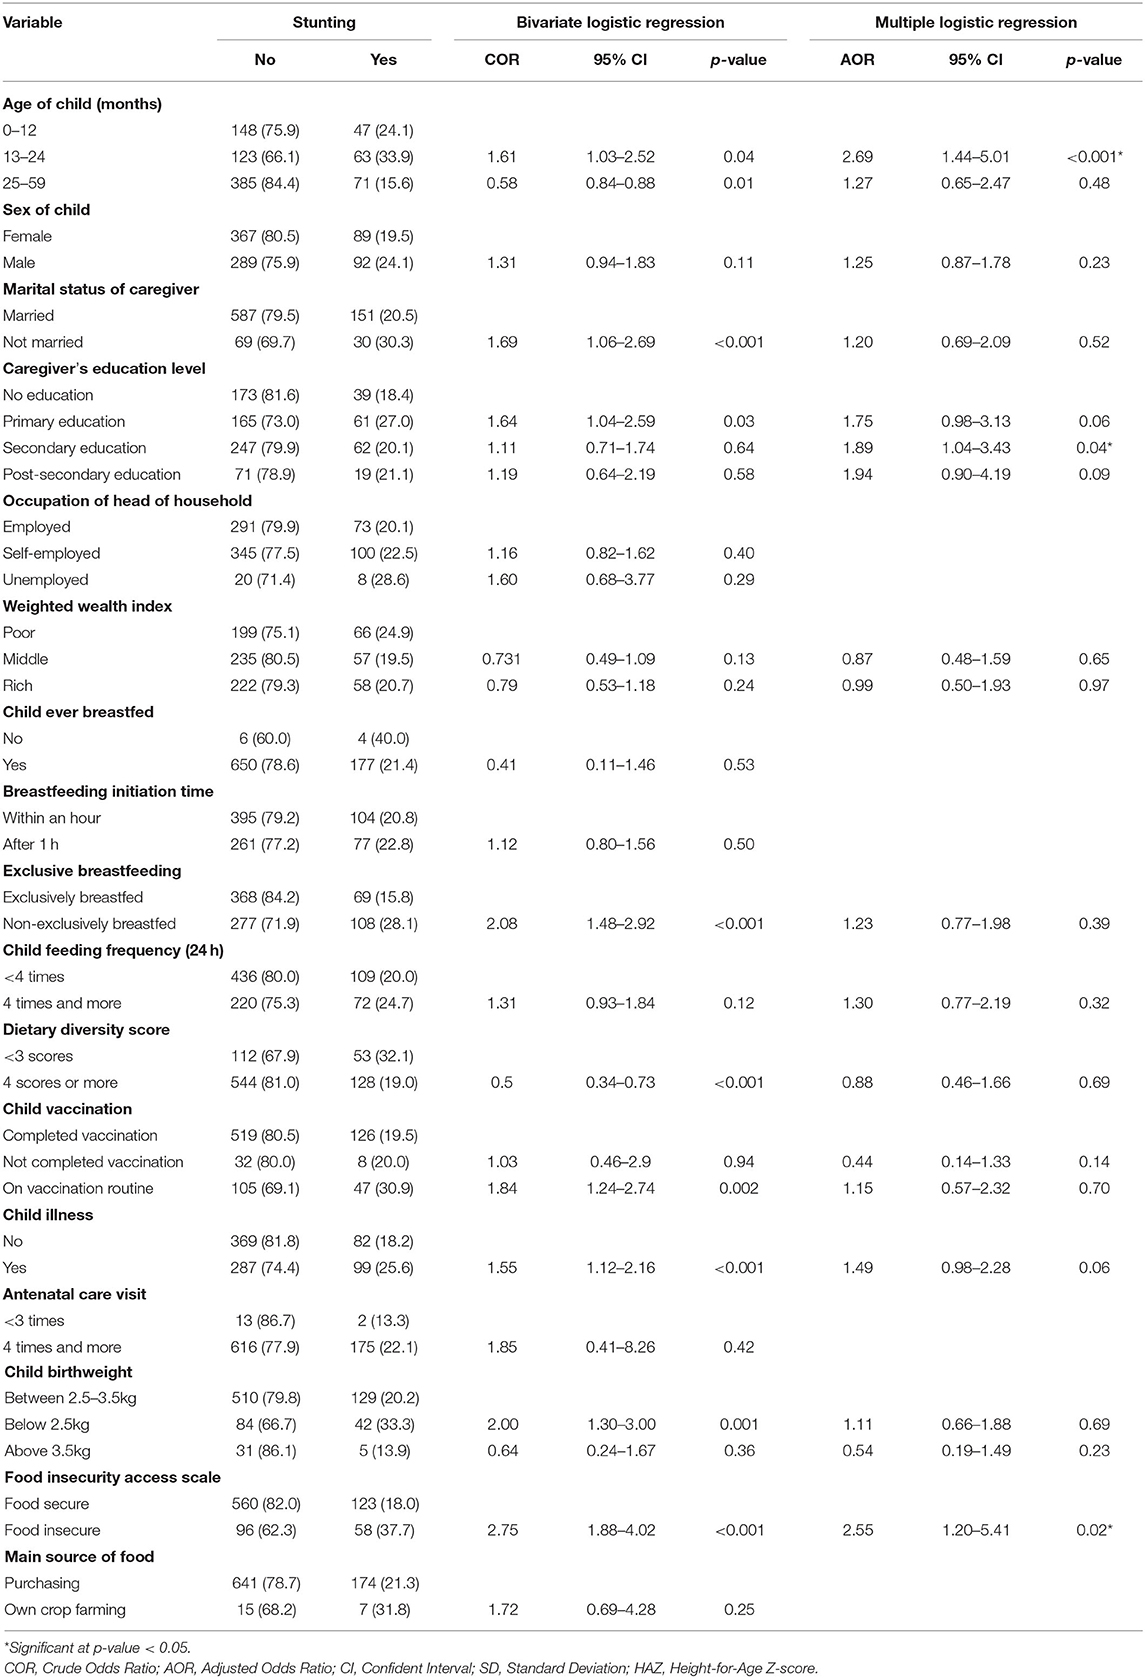
Table 2. Bivariate and multiple logistic regression for factors associated with stunting (HAZ < −2SD) among children age 0–59 months in Bambao region, July 2021 (N = 837).
Determinants of Wasting
Low birthweight (below 2.5kg) significantly increased the risk of wasting (AOR: 3.21, 95% CI 1.73–5.94). Food insecurity was associated with a three-fold increase in the risk of wasting (AOR: 2.85, 95% CI 1.17–6.94). Children aged 25–59 months were 78% less likely to be wasted compared to children 0–12 months old (AOR: 0.22, 95% CI 0.10–0.51) (Table 3).
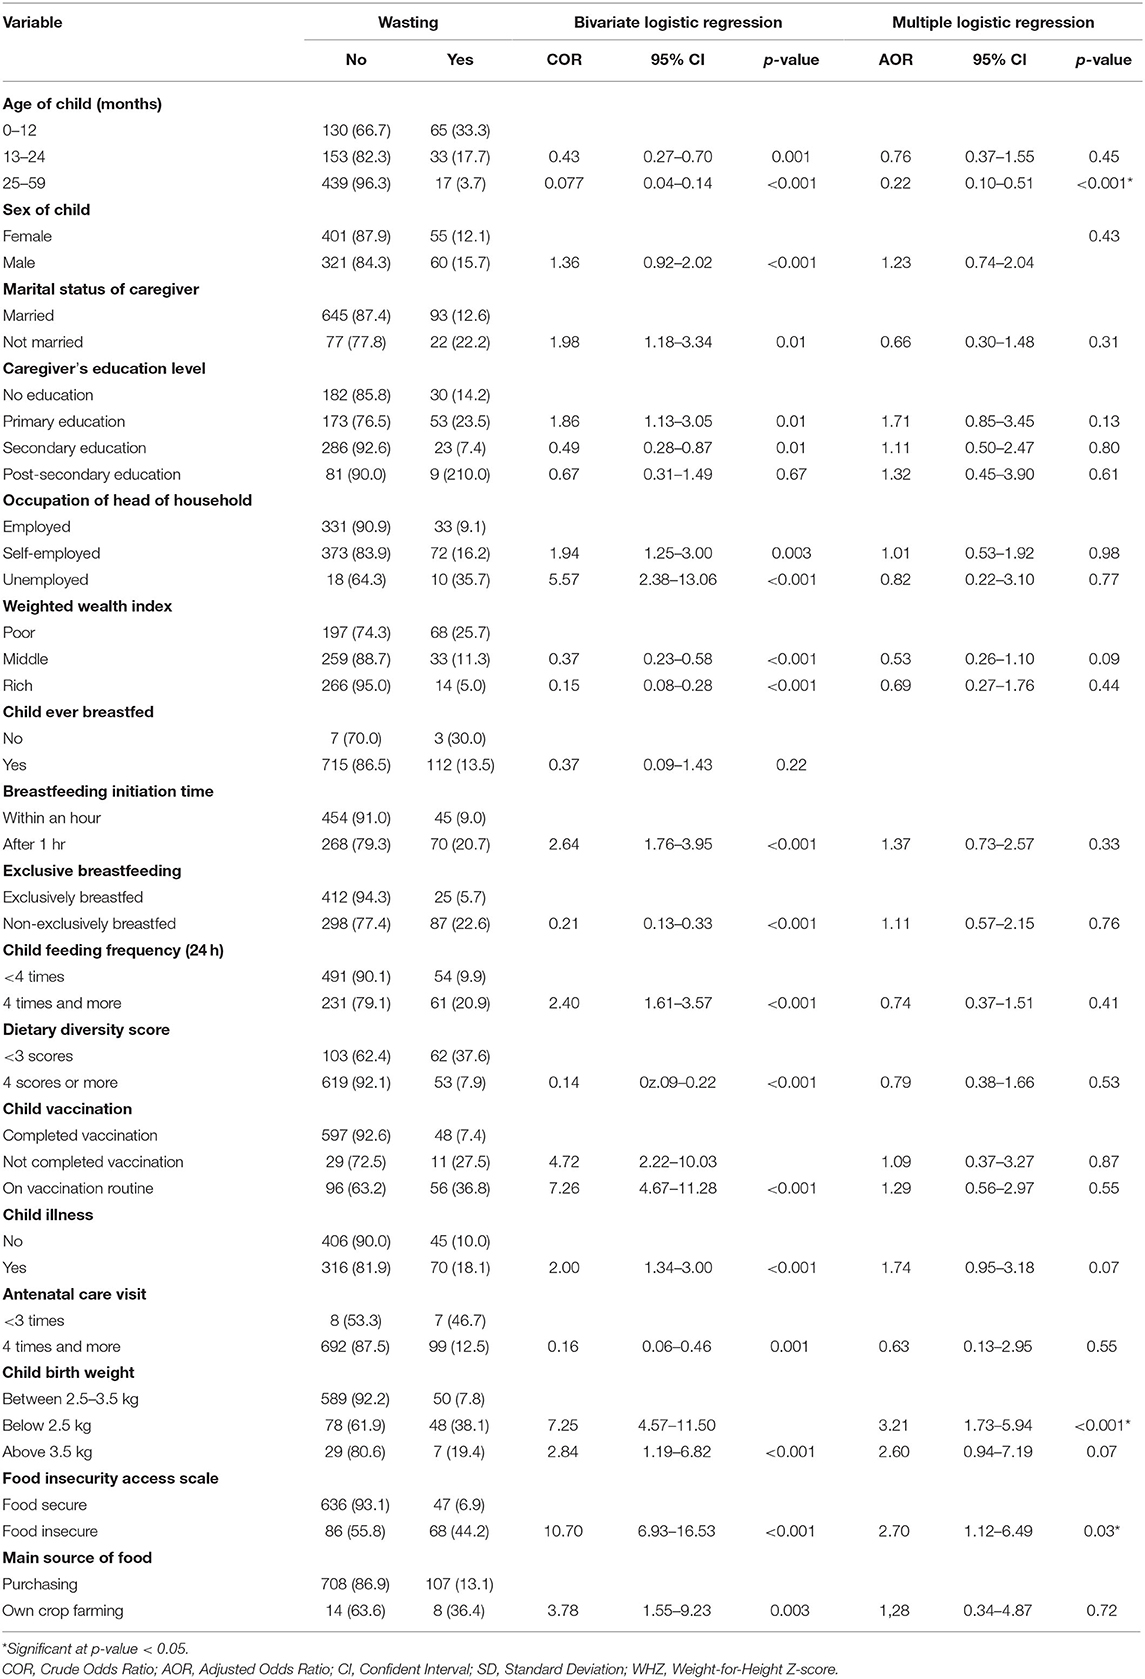
Table 3. Bivariate and multiple logistic regression for factors associated with wasting (WHZ < −2SD) among children age 0–59 months in Bambao region, July 2021 (N = 837).
Determinants of Underweight
In the multivariate analysis, children aged 25–59 months were 86% less likely to have wasting compared to children 0–12 months old (AOR: 0.14, 95% CI 0.06–0.36). Food insecurity was more likely to double the risk of underweight (AOR: 2.65, 95% CI 1.08–6.54), while Low birthweight significantly increased the risk of underweight (AOR: 3.15, 95% CI 1.67–5.93). In addition, non-exclusive breastfeeding in the first six months was significantly associated with underweight (AOR: 2.37, 95% CI 1.15–4.90) (Table 4).
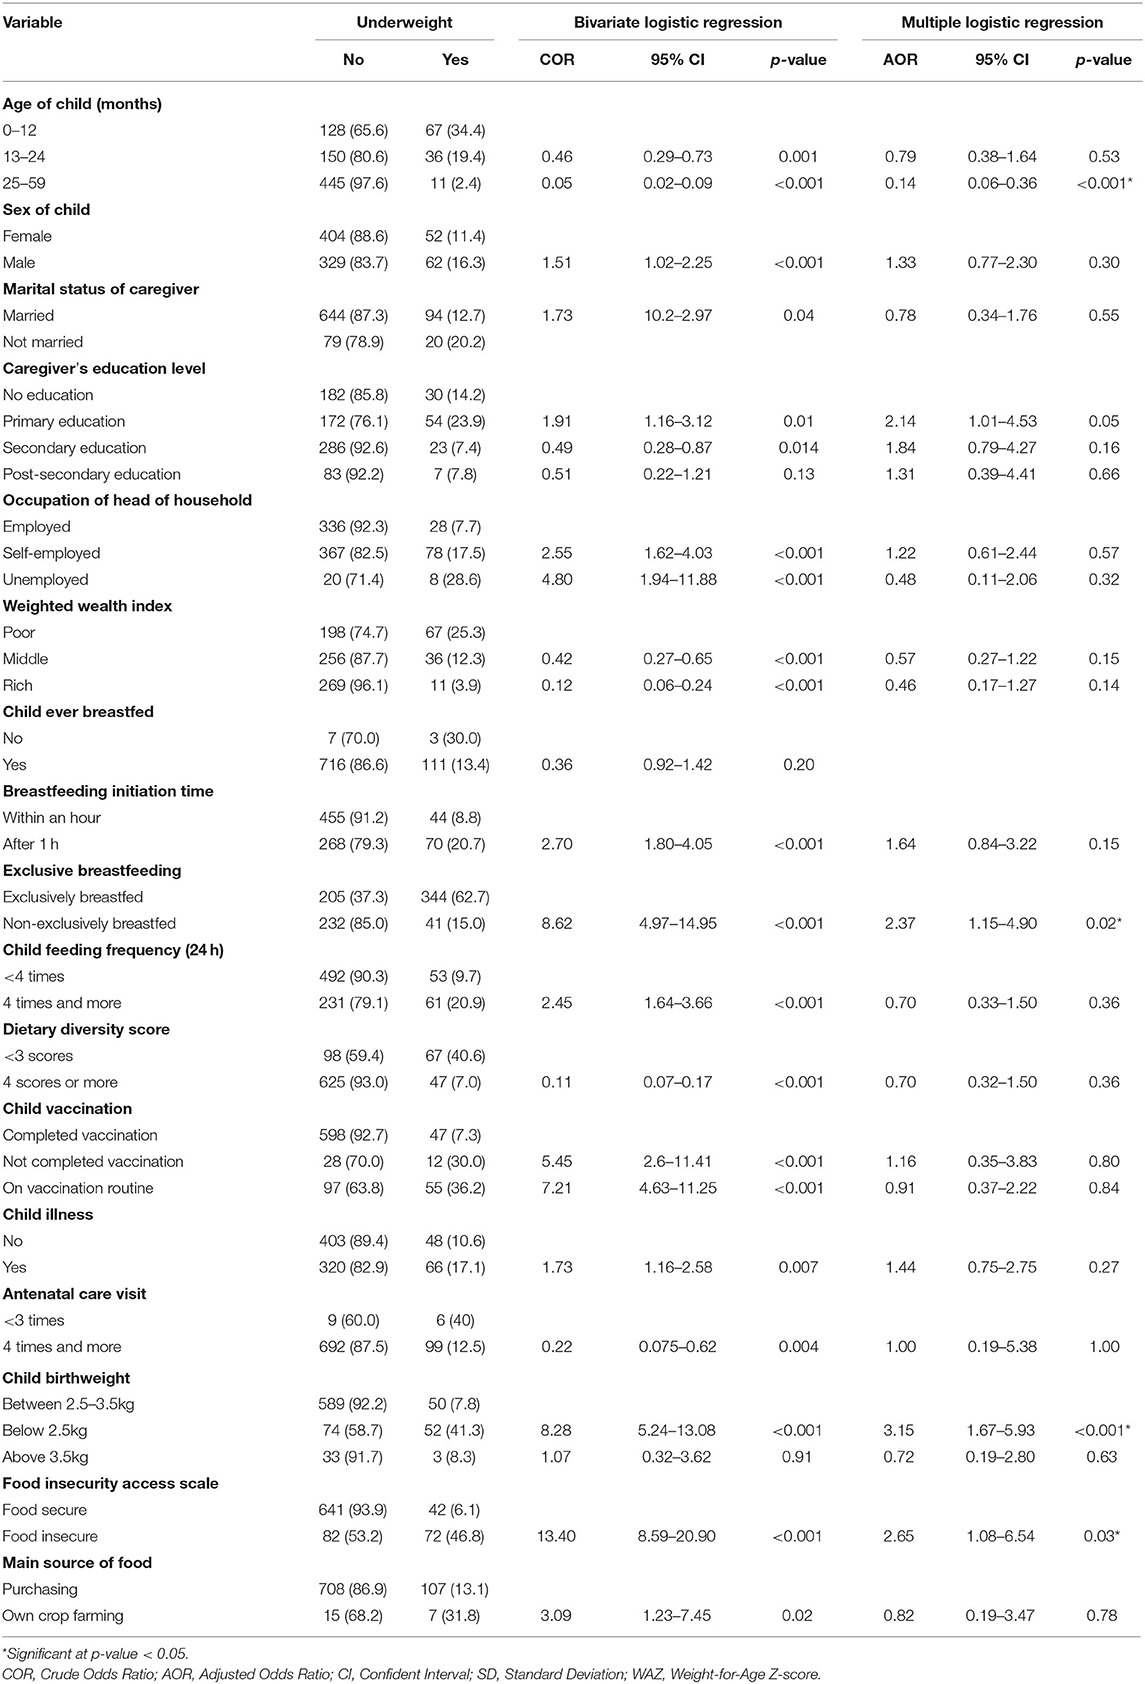
Table 4. Bivariate and multiple logistic regression for factors associated with underweight (WAZ < −2SD) among children age 0–59 months in Bambao region, July 2021 (N = 837).
Discussion
This study assessed the prevalence of child undernutrition and its associated factors in an urban setting in Comoros. Although the magnitudes are slightly lower than the nationally representative survey conducted a decade ago, the current magnitudes remains unprecedently high at 21.6, 13.7, and 13.6% for stunting, wasting and underweight respectively (9, 23). The progress is therefore insufficient to achieve the related Sustainable Development Goals by 2030 (38). Food insecurity, non-exclusive breastfeeding, low birthweight and child's age were strong predictors for undernutrition.
Despite reported improvement in household characteristics and access to health facility, the prevalence of undernutrition remains high (23). Underlying factors such as low economic productivity, high unemployment rates, power-cuts, shortage of water, low quality of healthcare and water sanitation are basic causes of undernutrition (18, 26, 39). In this study, severe household food insecurity access had three-fold increase in the odds of all three types of undernutrition. The impact is profound because nearly all the households depend on purchasing of food as the main source. It is highly likely that the COVID-19 pandemic has exacerbated food insecurity and threatened other vital pathways to good nutrition (22).
Age of the child was independent risk factors of all three types of undernutrition with higher odds of wasting and underweight in children aged 0–12 months and increased odds of stunting in children between 13–24 months. This indicates the vulnerability of children to undernutrition in the first 2 years of life. In addition, the study found that exclusive breastfeeding in the first 6 months was rare in this population and this was significantly associated with underweight (40). Other studies also reported similar findings emphasizing the need for optimal nutrition in the first 2 years of life including exclusive breastfeeding in the first 6 months and continuation of breastfeeding in the first 2 years of life as are universally recommended (37). Like other studies, we observed an association between low birthweight (below 2.5 kg) and underweight (3, 9) which also highlights the need to address maternal and pregnancy-related causes of low birthweight, such as prematurity, intrauterine growth restriction, infection and adequate maternal nutrition and antenatal care as a strategy to reducing undernutrition (41).
Contrary to known evidence, secondary education was associated with increased odds of stunting as compared to caregiver with no education (3). Higher maternal education is believed to lead to better employment and financial security and thus improve household food security, good dietary diversity, better feeding practices, and healthcare access. Our results may indicate that within the current Comorian context, higher education might not be particularly advantageous because mothers who are educated are less likely to stay at home as they go out to work which affects feeding practices such as quality of meals, frequency of feeding and importantly minimizes the time and ability to breastfeed (42–44). Moreover, high unemployment rates, low and irregular salaries offer households little financial opportunity to improve food security and diversity. However, further studies need to qualitatively explore and explain why secondary education of caregivers is associated with stunting.
Since the study had a cross-sectional design, causal inference might not be strong between the outcome and independent variables. Limitations of the study include the likelihood of recall bias as caregivers might not have been able to remember information adequately and accurately. Also, a cluster sampling technique provides a homogenous study sample which could lead to bias. Furthermore, we did not back-translate the script to English. This could have led to unintended translation. However, the investigator who supervised the overall translation process is fluent both in English and Shi-Comore language and tried to avoid the fatal misunderstandings especially since Shi-Comore is not a written language.
Monitoring systems are crucial for assessing progress and identify gaps. However, data on nutritional status of children in Comoros is very scarce and outdated. Our results show possible reduction of stunting of about a third, and to lesser extent a reduction in the prevalence of underweight. In contrast wasting may have increased. These mixed results show persistently high burden of undernutrition and insufficient progress to meeting the goals of reducing undernutrition. However, since our study was only conducted in an urban region, current data from all regions of the country are needed to be certain of the observed trends. It is thus crucial to strengthen monitoring systems including a regular and timely national demographic and health survey to assess the health needs of the people in general. Further research is necessary for understanding the dynamics of child undernutrition in Comoros including underlying causes and context-informed interventions.
Conclusion
In conclusion, this study showed a persistently high prevalence of stunting, wasting and underweight among children under-five years in Bambao region, Comoros. According to this study, food insecurity, non-exclusive breastfeeding, birthweight and child's age were strong predictors for undernutrition and the study shows the vulnerability to undernutrition in the first 2 years of life. Effective nutrition-sensitive and specific interventions using multi-sectoral approaches should be implemented at national level to address these important determinants including education to mothers and caregivers about nutrition and care during pregnancy and infant and young child feeding best practices and their importance to child growth and development. Also, emphasis should be made on improving food security at national level through targeted interventions such as food programs and horizontal interventions to improve households' socio-economic standing.
Data Availability Statement
The raw data supporting the conclusions of this article will be made available from the corresponding author upon request.
Ethics Statement
The studies involving human participants were reviewed and approved by Muhimbili University of Health and Allied Sciences' Institutional Research and Ethics Committee IRB: MUHAS-REC-06-2021-711. Written informed consent to participate in this study was provided by the participants' legal guardian/next of kin.
Author Contributions
HA prepared the research proposal including research questions, designed the study, planning, conducted the fieldwork, analyzed and interpreted data, and prepared the manuscript draft. BS was involved in research proposal development and supervision and revision of the manuscript. All authors read and approved the final manuscript draft.
Conflict of Interest
The authors declare that the research was conducted in the absence of any commercial or financial relationships that could be construed as a potential conflict of interest.
Publisher's Note
All claims expressed in this article are solely those of the authors and do not necessarily represent those of their affiliated organizations, or those of the publisher, the editors and the reviewers. Any product that may be evaluated in this article, or claim that may be made by its manufacturer, is not guaranteed or endorsed by the publisher.
Acknowledgments
The authors gratefully acknowledge all the participants, research assistants and the Regional Administrative Staff of Bambao. We also extend our thank to Dr. Natasha Housseine for her support.
Supplementary Material
The Supplementary Material for this article can be found online at: https://www.frontiersin.org/articles/10.3389/fnut.2022.885002/full#supplementary-material
References
1. Tesema GA, Yeshaw Y, Worku MG, Tessema ZT, Teshale AB. Pooled prevalence and associated factors of chronic undernutrition among under-five children in East Africa: a multilevel analysis. PLoS ONE. (2021) 16:1–17. doi: 10.1371/journal.pone.0248637
2. Onyango AW, Jean-Baptiste J, Samburu B, Mahlangu TLM. Regional overview on the double burden of malnutrition and examples of program and policy responses: African region. Ann Nutr Metab. (2019) 75:127–30. doi: 10.1159/000503671
3. Darsene H, Geleto A, Gebeyehu A, Meseret S. Magnitude and predictors of undernutrition among children aged six to fifty nine months in Ethiopia: A cross sectional study. Arch Public Heal. (2017) 75:1–11. doi: 10.1186/s13690-017-0198-4
4. Ayele E, Gebreayezgi G, Mariye T, Bahrey D, Aregawi G, Kidanemariam G. Prevalence of undernutrition and associated factors among pregnant women in a public general hospital, tigray, northern ethiopia: a cross-sectional study design. J Nutr Metab. (2020) 2020:2736536. doi: 10.1155/2020/2736536
5. Fatima S, Manzoor I, Joya AM, Arif S, Qayyum S. Stunting and associated factors in children of less than five years: a hospital-based study. Pak J Med Sci. (2020) 36:581–5. doi: 10.12669/pjms.36.3.1370
6. Mkhize M, Sibanda M. A review of selected studies on the factors associated with the nutrition status of children under the age of five years in South Africa. Int J Environ Res Public Health. (2020) 17:7973. doi: 10.3390/ijerph17217973
7. UNICEF. State of the World's Children 2019: Children, Food and Nutrition. New York, NY: UNICEF (2019). p. 4.
8. Schoenbuchner SM, Dolan C, Mwangome M, Hall A, Richard SA, Wells JC, et al. The relationship between wasting and stunting: a retrospective cohort analysis of longitudinal data in Gambian children from 1976 to 2016. Am J Clin Nutr. (2019) 110:498–507. doi: 10.1093/ajcn/nqy326
9. Dukhi N. Global prevalence of malnutrition: evidence from literature. Imran M, editor. Malnutriti. London: Intech Open Access (2020). p. 1–16
10. Child WHO, Standards, G, WHO. World Health Organization Child Growth Standards. Training Course on Child Growth Assessment. WHO. (2006) 7:10–1. Available online at: https://www.who.int/childgrowth/training/module_b_measuring_growth.pdf%0A (accessed March 22, 2021).
11. Choudhury N, Raihan MJ, Sultana S, Mahmud Z, Farzana FD, Haque MA, et al. Determinants of age-specific undernutrition in children aged less than 2 years—the Bangladesh context. Matern Child Nutr. (2017) 13:1–15. doi: 10.1111/mcn.12362
12. UNICEF WHO World Bank. Levels and trends in child malnutrition: Key findings of the 2020 Edition of the Joint Child Malnutrition Estimates. Geneva: WHO (2020). p. 1–16.
13. Ismail A, Darling AM, Mosha D, Fawzi W, Sudfeld C, Sando MM. et al. Prevalence and risk factors associated with malnutrition among adolescents in rural. Tanzania. (2020) 25:89–100. doi: 10.1111/tmi.13331
14. Agho KE, Akombi BJ, Ferdous AJ, Mbugua I, Kamara JK. Childhood undernutrition in three disadvantaged East African districts: a multinomial analysis. BMC Pediatr. (2019) 19:1–11. doi: 10.1186/s12887-019-1482-y
15. UNICEF WHO World Bank Group. Levels and trends in child malnutrition, UNICEF / WHO / World Bank Group Joint Child Malnutrition Estimates: Key Findings of the 2016 Edition. (2016). p.1–8. Available online at: http://www.who.int/nutrition/publications/jointchildmalnutrition_2016_estimates/en/ (accessed April 17, 2021).
16. Akombi BJ, Agho KE, Merom D, Renzaho AM HJ. Child malnutrition in sub-Saharan Africa: a meta-analysis of demographic and health surveys (2006-2016). PLoS ONE. (2017) 12:e0177338. doi: 10.1371/journal.pone.0177338
17. Sunguya BF, Poudel KC, Otsuka K, Yasuoka J, Mlunde LB, Urassa DP, et al. Undernutrition among HIV-positive children in Dar es Salaam, Tanzania: Antiretroviral therapy alone is not enough. BMC Public Health. (2011) 11:869. doi: 10.1186/1471-2458-11-869
18. UNICEF. UNICEF's Approach to Scaling Up Nutrition. (2015). Available online at: http://www.acp.int/sites/acpsec.waw.be/files/UNICEF.pdf (accessed March 24, 2021).
19. Mdimu EL, Massaga JJ, Sembuche SL, Abade AM, Leyna GH, Sembuche L, et al. Risk factors associated with under nutrition among children aged 6-59 months in Ngorongoro, Arusha region Tanzania: a case-control study, 2017. Pan Afr Med J. (2020) 37:315. doi: 10.11604/pamj.2020.37.315.21726
20. Amare D, Negesse A, Tsegaye B, Assefa B, Ayenie B. Prevalence of undernutrition and its associated factors among children below five years of age in Bure Town, West Gojjam Zone, Amhara national regional state, Northwest Ethiopia. Adv Public Heal. (2016) (9):1–8. doi: 10.1155/2016/7145708
21. von Grember K, Bernstein J, Alders R, Dar O, Kock R, Rampa F. 2020 Global Hunger Index: One Decade to Zero Hunger, Linking Health Sustainable Food Systems. Welthungerhilfe Concern Worldw. (2020) p. 1–80. Available online at: https://www.globalhungerindex.org/pdf/en/2020.pdf (accessed January 10, 2021).
22. UNICEF-WHO-The World Bank. Joint Child Malnutrition Estimates – Levels and Trends – 2021 Edition - UNICEF DATA. (2021). Available online at: https://data.unicef.org/resources/jme-report-2021/ (accessed Augest 12, 2021)
23. Direction Générale de la Statistique et de la Prospective (DGSP) et ICF International. Enquête Démographique et de Santé et à Indicateurs Multiples aux Comores 2012. Rockville, MD: DGSP et ICF International (2014).
24. Hunger Hilf W. GLOBAL Hunger Index 2019: Comoros. (2019). Available online at: www.globalhungerindex.org (accessed April 27, 2021).
25. World bank. Demographic in Comoros. (2020). Available online at: https://www.worldbank.org/en/country/comoros/overview (accessed July 17, 2021).
26. John Meyer, Donald Nelson DB. Comoros: Comprehensive Food Security and Vulnerability Analysis. Rome, Italy; (2006). Available online at: https://www.coursehero.com/file/80778912/Comoros-Comp-Food-Sec-Vil-Analaysis-Feb-2006pdf/
27. WHO. Nutrition Landscape Information System (NLiS) country profile indicators: interpretation guide. 2nd ed. In: Nutrition Landacape Information System (NLIS). Geneva: WHO (2012). p. 1–51.
28. World Health Organization. WHO Child Growth Standards. (2006). Available online: https://www.who.int/childgrowth/standards/Technical_report.pdf (accessed March 22, 2021).
29. WHO/UNICEF. Discussion Paper the Extension of the 2025 Maternal, Infant and Young Child nutrition Targets to 2030. Geneva: WHO (2017). p. 1–12.
30. Ngo J, Serra-Majem L. Hunger and malnutrition. In: Ferranti P, Berry EM, Anderson JR, editors. Encyclopedia of Food Security and Sustainability. Oxford: Elsevier (2019). p. 315–35.
31. Sunguya BF, Poudel KC, Mlunde LB, Urassa DP, Yasuoka J, Jimba M. Poor nutrition status and associated feeding practices among HIV-positive children in a food secure region in tanzania: a call for tailored nutrition training. PLoS ONE. (2014) 9:e98308. doi: 10.1371/journal.pone.0098308
32. Swindale A, Bilinsky P. Household Dietary Diversity Score (HDDS) for Measurement of Household Food Access: Indicator Guide (Version 2). Washington, DC FHI 360/FANTA. (2006). Available online at: www.fantaproject.org (accessed Augest 10, 2021).
33. Coates J, Swindale A, Bilinsky P. Household Food Insecurity Access Scale (HFIAS) for Measurement of Food Access: Indicator Guide: Version 3. Washington, DC FHI 360/FANTA. (2007). Available online at: www.fantaproject.org doi: 10.1037/e576842013-001 (accessed Augest 10 2021).
34. Sunguya BF, Zhu S, Mpembeni R, Huang J. Trends in prevalence and determinants of stunting in Tanzania: an analysis of Tanzania demographic health surveys (1991–2016). Nutr J. (2019) 8:85. doi: 10.1186/s12937-019-0505-8
35. Cogill B. Anthropometric Indicators Measurement Guide. Washington, DC: National Agricultural Library (2001). p. 51–4.
36. Mrema JD, Elisaria E, Mwanri AW, Nyaruhucha CM. Prevalence and determinants of undernutrition among 6- to 59-months-old children in lowland and highland areas in Kilosa district, Tanzania: A Cross-Sectional Study. J Nutr Metab. (2021) 2021:6627557. doi: 10.1155/2021/6627557
37. Menalu MM, Bayleyegn AD, Tizazu MA, Amare NS. Assessment of prevalence and factors associated with malnutrition among under-five children in debre berhan town, Ethiopia. Int J Gen Med. (2021) 14:1683–97. doi: 10.2147/IJGM.S307026
38. Nutrition and the Sustainable Development Goals. Available online at: https://scalingupnutrition.org/nutrition/nutrition-and-the-sustainable-development-goals/ (accessed Augest 12, 2021).
39. African Development Bank Group. African Development Bank Group 2016-2020 Country Strategy Paper. (2016). Available online at: https://www.afdb.org/fileadmin/uploads/afdb/Documents/Project-and-Operations/SENEGAL-2016-2020_CSP.pdf (accessed August 15, 2021).
40. Murarkar S, Gothankar J, Doke P, Pore P, Lalwani S, Dhumale G, et al. Prevalence and determinants of undernutrition among under-five children residing in urban slums and rural area, Maharashtra, India: a community-based cross-sectional study. BMC Public Health. (2020) 20:1–9. doi: 10.1186/s12889-020-09642-0
41. Blencowe H, Krasevec J, Onis M De, Black RE, An X, Stevens GA, et al. Articles national, regional, and worldwide estimates of low birthweight in 2015, with trends from 2000: a systematic analysis. Lancet Glob Heal. (2015) 7:e849–60. doi: 10.1016/S2214-109X(18)30565-5
42. Nankinga O, Kwagala B, Walakira EJ. Maternal employment and child nutritional status in Uganda. PLoS ONE. (2019) 14:1–14. doi: 10.1371/journal.pone.0226720
43. Eshete H, Abebe Y, Loha E, Gebru T, Tesheme T. Nutritional status and effect of maternal employment among children aged 6-59 months in Wolayta Sodo town, Southern Ethiopia: a cross-sectional study. Ethiop J Health Sci. (2017) 27:155–62. doi: 10.4314/ejhs.v27i2.8
Keywords: undernutrition, stunting, wasting, underweight, under-five, Comoros
Citation: Ahamada H and Sunguya BF (2022) The Burden of Undernutrition and Its Associated Factors Among Children Below 5 Years of Age in Bambao Region, Comoros. Front. Nutr. 9:885002. doi: 10.3389/fnut.2022.885002
Received: 27 February 2022; Accepted: 28 March 2022;
Published: 26 April 2022.
Edited by:
Mahalaqua Nazli Khatib, Datta Meghe Institute of Medical Sciences, IndiaReviewed by:
Swapnil Parve, Kazan State Medical University, RussiaKumar Gaurav Chhabra, NIMS University, India
Copyright © 2022 Ahamada and Sunguya. This is an open-access article distributed under the terms of the Creative Commons Attribution License (CC BY). The use, distribution or reproduction in other forums is permitted, provided the original author(s) and the copyright owner(s) are credited and that the original publication in this journal is cited, in accordance with accepted academic practice. No use, distribution or reproduction is permitted which does not comply with these terms.
*Correspondence: Hadji Ahamada, YmVuaGFkamkuYWhAZ21haWwuY29t
 Hadji Ahamada
 Bruno F. Sunguya