Abstract
Background:
Growing evidence suggests that dietary acid load plays an important role in the development of type 2 diabetes. However, prospective studies on the relationship between dietary acid load and gestational diabetes mellitus (GDM) are limited in the pregnant population. This study aimed to investigate the effect of dietary acid load during early pregnancy on the risk of GDM in Chinese pregnant women.
Methods:
A total of 1,327 pregnant women were enrolled from an ongoing prospective study of the Tongji Birth cohort (TJBC) in Wuhan, China. Dietary intake was assessed before 20 weeks using a 74-item semiquantitative food frequency questionnaire (FFQ). The dietary acid load was estimated using potential renal acid load (PRAL), net endogenous acid production (NEAP), and animal protein to potassium ratio (A:P ratio). A 75g 2-h oral glucose tolerance test (OGTT) was performed at 24-28 gestational weeks to diagnose GDM.
Results:
The mean (standard deviation) values for PRAL score, NEAP score, and A:P ratio were 0.8 ± 11.3 mEq/day, 45.3 ± 16.5 mEq/day, and 9.8 ± 6.0, respectively. There was a significant positive correlation of dietary acid load with the intake of red meat, poultry, fish, and eggs, and a negative correlation with the intake of vegetables, fruits, nuts, and legumes (all P < 0.05). Compared to the lowest tertile, the highest tertile of dietary acid load, including PRAL score (odds ratio [OR]: 2.26, 95% confidence interval [CI] = 1.38–3.71, P-trend = 0.002), NEAP score (OR: 2.02, 95% CI = 1.25–3.27, P-trend = 0.009), and A:P ratio (2.08, 95% CI = 1.30–3.31, P-trend = 0.005), significantly increased the risk of GDM. In addition, the dietary acid load was also significantly associated with an increase in 1-h and 2-h post-load blood glucose concentrations (all P-trend < 0.05).
Conclusion:
We found a significant positive association between dietary acid load during early pregnancy and the risk of GDM in a Chinese population, suggesting that the reduction of food sources of dietary acid load may be an effective strategy for preventing the risk of GDM.
Introduction
Gestational diabetes mellitus (GDM) is defined as glucose intolerance that is new onset or first recognized during pregnancy (1). As one of the most common complications of pregnancy, GDM affects approximately 5.8-20.7% of pregnant women worldwide (2, 3). A systematic review and meta-analysis showed that the prevalence of GDM in Chinese pregnant women was 14.8% (95% confidence interval [CI]: 12.8-16.7%) (4). In the short term, pregnant women with GDM are at higher risk of preterm birth, macrosomia, and cesarean section (5, 6). In addition, it can also have long-term effects, leading to overweight (7) and neurodevelopmental disorders (8) in the offspring and a higher risk of type 2 diabetes in the mothers (9). Several risk factors for the development of GDM have been identified in previous studies, such as maternal age, family history of diabetes, pre-pregnancy body mass index (pre-pregnancy BMI), gestational weight gain, and multiple births (10, 11). The identification of modifiable risk factors that contribute to the prevention of GDM is of great importance in promoting the health of mothers and offspring.
In recent years, the role of dietary acid load in the etiology of insulin resistance and type 2 diabetes has attracted increasing attention (12–17). It has been suggested that acid-base disturbance may contribute to the development of insulin resistance (18, 19). Randomized controlled trials have demonstrated that a short-term vegan dietary intervention is effective in reducing dietary acid load and raising 24-h urine pH in healthy individuals (20, 21). Similarly, observational studies have shown that Western dietary patterns (high intake of acidogenic foods including animal products, and low intake of alkalizing foods including fruits and vegetables) might lead to excessive production of endogenous acids and dietary acid-base imbalances, which in turn might contribute to the development of type 2 diabetes (16, 22). Currently, there are three main indicators for evaluating dietary acid load produced by overall diet, including potential renal acid load (PRAL), net endogenous acid production (NEAP), and animal protein to potassium ratio (A:P ratio). A recent meta-analysis of observational studies showed that higher dietary acid load levels, particularly PRAL scores, were associated with an increased risk of type 2 diabetes (17). The results of a longitudinal study suggested that higher diet-dependent acid load, both PRAL and NEAP scores, is positively associated with the development of insulin resistance (12). However, prospective evidence for the effect of dietary acid load on GDM risk is limited. Only one case-control study in Iran has examined the association between dietary acid load and GDM risk, showing that higher dietary acid load was associated with greater odds of GDM (23). Given the wide variation in dietary habits across regions, it is valuable to provide additional data from the Chinese Population to improve the generalizability of the findings.
Therefore, this study aimed to prospectively evaluate the relationship between dietary acid load in early pregnancy and the risk of GDM in Chinese pregnant women using the PRAL score, NEAP score, and A:P ratio.
Materials and Methods
Study Population
Data was used from the prospective cohort study of Tongji Birth Cohort (TJBC) in Wuhan, China. The TJBC study was established in 2018 to assess the role of nutritional status and environmental exposures in maternal and child health. Pregnant women with a single pregnancy, gestational age < 20 weeks, planning to deliver at a participating hospital, and agreeing to complete a face-to-face questionnaire were included in the study (n = 2261). For the present analyses, we excluded participants with pre-pregnancy diabetes (n = 7), no dietary data on early pregnancy (n = 857), extreme energy intake (< 500 kcal/day or > 3500 kcal/day) (n = 8), and lack of GDM diagnosis (n = 62), with a total of 1,327 participants finally being included (Figure 1). Ethical approval was obtained from the Ethics Committee of Tongji Medical College of Huazhong University of Science and Technology, and all participants provided written informed consent before enrollment.
FIGURE 1
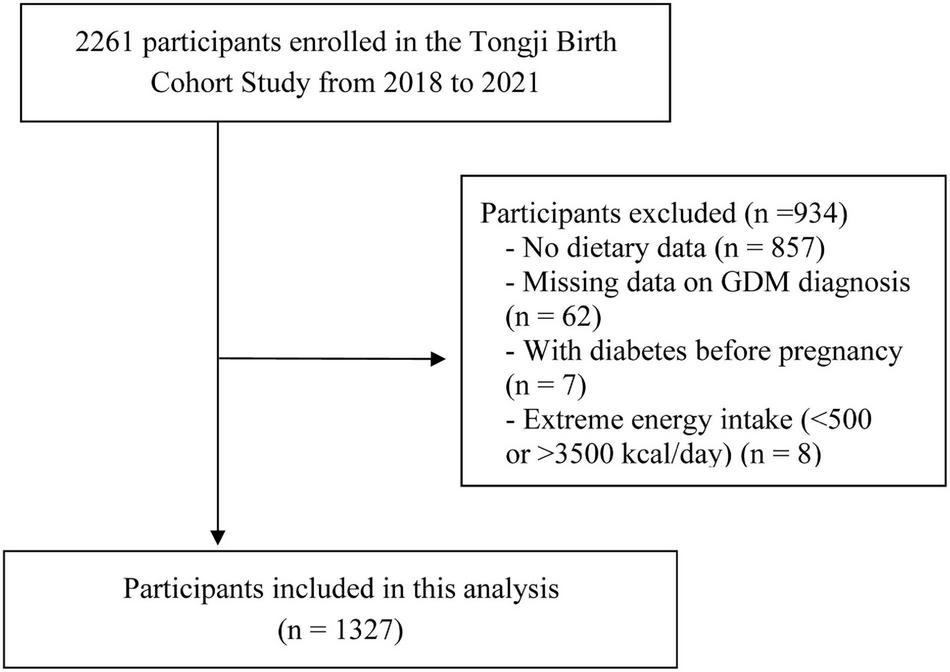
Flow chart for the selection of subjects included in the analysis.
Dietary Assessment
Dietary intake was assessed through face-to-face interviews using a 74-item semiquantitative food frequency questionnaire (FFQ), which has been proven in the previous study to be a reasonable tool for assessing nutrient and food intakes of pregnant women in China (24). The description of FFQ has been described in detail in the previous study (25). In brief, pregnant women were asked about the frequency and amount of the 74 food items consumed over the past four weeks. The frequency of food intake ranged from “less than once a month” to “more than three times a day” among the 13 frequency options. Trained dietitians used a color food photography atlas containing different portion sizes of all foods and food models representing the standard portions to make the estimation more accurate. The daily intake of energy and nutrients was calculated by FFQ based on the Chinese Food Composition Tables (26). Food and nutrient intakes were adjusted according to the energy residual method (27).
Dietary Acid Load
In this study, we calculated the dietary acid load through three different measures: potential renal acid load (PRAL) (28), net endogenous acid production (NEAP) (29), and animal protein-to-potassium ratio (A:P ratio) (30).
The equations are as follows:
- (1)
PRAL (mEq/day) = (0.4888 × protein (g/day)) + (0.0366 × phosphorus (mg/day)) − (0.0205 × potassium (mg/day)) − (0.0263 × magnesium (mg/day))−(0.0125 × calcium (mg/day));
- (2)
NEAP (mEq/day) = 54.5 × protein intake (g/day)/ potassium intake (mEq/day) − 10.2;
- (3)
A:P ratio = animal protein (g/day)/potassium (g/day).
Outcome Definitions
A 75 g 2-h oral glucose tolerance test (OGTT) was performed for all pregnant women at 24-28 gestational weeks after at least 8-h of fasting. Fasting blood glucose (FBG), 1-h post-load blood glucose (PBG), and 2-h PBG levels were collected from medical records. According to the criteria established by the International Association of the Diabetes and Pregnancy Study Groups, subjects were diagnosed with GDM if they met any of the following criteria: FBG ≥ 5.1 mmol/L; 1-h PBG ≥ 10.0 mmol/L; or 2-h PBG ≥ 8.5 mmol/L (31).
Other Variables
Information on covariates was obtained through a structured questionnaire completed at enrolment, including maternal age, education level, gravidity, parity, personal and family history of diabetes, and lifestyle habits before pregnancy such as smoking status, alcohol intake, and physical activity. Alcohol consumers (or smokers) were defined as drinking (or smoking) more than one time a week before pregnancy. Participants were considered to have regular physical activity if they reported physical activity at least once a week before pregnancy. We also collected data on anthropometric measurements, including maternal height and pre-pregnancy weight. Pre-pregnancy BMI was calculated using self-reported pre-pregnancy weight (kg) divided by height2 (m2).
Statistical Analyses
Data are presented as mean (standard deviation [SD]) for continuous variables and n (%) for categorical variables. One-way analysis of variance and the Chi-squared test were used to compare continuous and categorical variables, respectively. The PRAL score, NEAP score, and A:P ratio were categorized in tertiles, with the lowest tertile as the reference group. Multivariable logistic regression analyses were used to assess the associations between dietary acid load levels in early pregnancy and risk of GDM, with the results expressed as odds ratios (ORs) and 95% CIs. In order to test the significance of linear trends across tertiles, the median value of each tertile of dietary acid load measures was considered to be a continuous variable. Generalized linear models were conducted to examine the association of dietary acid load levels with FBG, 1-h PBG, and 2-h PBG, and the results were presented as coefficients (β) with 95% CIs. All potential confounders in the multivariable models were chosen based on both biological and statistical considerations (changed main effect estimates > 10%). Multivariate models were as followed: (1) model 1 was the crude model; (2) model 2 adjusted for maternal age (continuous), pre-pregnancy BMI (continuous), education years (≤ 12, 13–15, ≥ 16 years), primiparity (yes/no), smoking status before pregnancy (yes/no), alcohol intake before pregnancy (yes/no), regular physical activity before pregnancy (yes/no), and family history of diabetes (yes/no); (3) model 3 further adjusted for energy-adjusted nutrient intake (i.e., carbohydrate, dietary fiber, cholesterol, vitamin A, vitamin C, vitamin E, saturated fatty acids (SFAs), and Monounsaturated fatty acids (MUFAs)).
To evaluate the potential modification effect, stratified analyses were conducted according to the median value of maternal age (< 29.2 or ≥ 29.2 years), pre-pregnancy BMI (< 20.5 or ≥ 20.5 kg/m2), primiparity (yes or no), gravidity (yes or no), regular physical activity (yes or no), and family history of diabetes (yes or no). The likelihood ratio tests were used to assess the interactions between stratified variables and freshwater fish intake. In addition, we performed different sensitivity analyses to assess the stability of the study results. First, we excluded participants who were over 30 years old at the time of pregnancy. Second, we excluded participants with abnormal pre-pregnancy BMI (< 18.5 or ≥ 24 kg/m2). Third, we separately excluded participants with smoking or alcohol consumption habits before pregnancy. All analyses were performed using statistical packages R (The R Foundation; v. 3.4.3)1 and Empower(R) (X&Y Solutions Inc.)2. We considered P < 0.05 in the two-sided test as significant.
Results
Characteristics of Participants
A total of 1,327 subjects were included in the present study (Figure 1). The mean (SD) values for PRAL score, NEAP score, and A:P ratio in the study population were 0.8 ± 11.3 mEq/day, 45.3 ± 16.5 mEq/day, and 9.8 ± 6.0, respectively. Table 1 shows the characteristics of study participants by tertiles of the PRAL score distribution. Compared to those with the lowest tertile of PRAL scores (< −3.2 mEq/day), individuals with the highest tertile of PRAL scores (≥ 5.3 mEq/day) were more likely to be multiparous and to have a family history of diabetes. For specific food groups, participants with higher PRAL scores consumed more grains and animal products (red meat, poultry, fish, eggs) and fewer vegetables, fruit, and legumes than participants with lower PRAL scores. In addition, they also had higher intakes of protein, cholesterol, SFAs, and MUFAs, and lower intakes of carbohydrates, dietary fiber, vitamin A, vitamin C, vitamin E, potassium, calcium, and magnesium.
TABLE 1
| Variables | Overall (n = 1327) | Tertiles of PRAL score (mEq/day) | P valueb | ||
| T1 (n = 442) | T2 (n = 442) | T3 (n = 443) | |||
| Maternal Characteristics | |||||
| Maternal age (years) | 29.5 ± 3.3 | 29.4 ± 3.6 | 29.5 ± 3.1 | 29.7 ± 3.4 | 0.365 |
| Pre-pregnancy BMI (kg/m2) | 21.1 ± 3.1 | 20.9 ± 2.8 | 21.0 ± 3.2 | 21.3 ± 3.2 | 0.170 |
| Education (years), n (%) | 0.919 | ||||
| ≤ 12 | 304 (22.9%) | 105 (23.8%) | 97 (21.9%) | 102 (23.0%) | |
| 13–15 | 427 (32.2%) | 146 (33.0%) | 139 (31.4%) | 142 (32.1%) | |
| ≥ 16 | 590 (44.5%) | 189 (42.8%) | 203 (45.9%) | 198 (44.7%) | |
| Income (CNY/month), n (%) | 0.193 | ||||
| ≤ 4999 | 189 (14.2%) | 60 (13.6%) | 70 (15.8%) | 59 (13.3%) | |
| 5000–9999 | 734 (55.3%) | 240 (54.3%) | 242 (54.8%) | 252 (56.9%) | |
| ≥ 10000 | 376 (28.3%) | 128 (29.0%) | 127 (28.7%) | 121 (27.3%) | |
| Gravidity (times), n (%) | 0.451 | ||||
| 1 | 789 (59.5%) | 266 (60.2%) | 270 (61.1%) | 253 (57.1%) | |
| ≥ 2 | 538 (40.5%) | 176 (39.8%) | 172 (38.9%) | 190 (42.9%) | |
| Primiparity (yes), n (%) | 1069 (80.6%) | 362 (81.9%) | 366 (82.8%) | 341 (77.0%) | 0.062 |
| Alcohol intake (yes), n (%) | 29 (2.2%) | 8 (1.8%) | 8 (1.8%) | 13 (2.9%) | 0.418 |
| Smoking status (yes), n (%) | 36 (2.7%) | 11 (2.5%) | 12 (2.7%) | 13 (2.9%) | 0.920 |
| Regular physical activity (yes), n (%) | 503 (37.9%) | 177 (40.0%) | 167 (37.8%) | 159 (35.9%) | 0.444 |
| Family history of diabetes (yes), n (%) | 150 (11.3%) | 31 (7.0%) | 56 (12.7%) | 63 (14.2%) | 0.010 |
| GDM, n (%) | 217 (16.4%) | 53 (12.0%) | 82 (18.6%) | 82 (18.5%) | 0.010 |
| Food intakec | |||||
| Grains (g/day) | 245.2 ± 58.9 | 223.8 ± 58.7 | 245.3 ± 54.9 | 266.2 ± 55.3 | < 0.001 |
| Vegetables (g/day) | 309.8 ± 139.0 | 376.0 ± 155.7 | 309.6 ± 120.2 | 244.0 ± 103.2 | < 0.001 |
| Fruits (g/day) | 485.7 ± 219.3 | 649.0 ± 229.4 | 453.0 ± 152.5 | 355.3 ± 154.0 | < 0.001 |
| Red meats (g/day) | 31.3 ± 34.6 | 18.6 ± 18.1 | 27.8 ± 21.2 | 47.4 ± 48.9 | < 0.001 |
| Poultry (g/day) | 7.4 ± 11.7 | 5.3 ± 8.6 | 7.4 ± 10.8 | 9.5 ± 14.7 | < 0.001 |
| Fish (g/day) | 27.7 ± 27.5 | 22.8 ± 21.9 | 26.3 ± 24.7 | 33.9 ± 33.5 | < 0.001 |
| Eggs (g/day) | 31.7 ± 23.9 | 28.1 ± 24.8 | 30.6 ± 21.5 | 36.4 ± 24.6 | < 0.001 |
| Dairy products (ml/day) | 165.2 ± 136.0 | 167.2 ± 144.0 | 170.2 ± 131.8 | 158.2 ± 131.8 | 0.394 |
| Nuts (g/day) | 13.3 ± 13.2 | 14.4 ± 14.5 | 13.0 ± 12.7 | 12.6 ± 12.2 | 0.117 |
| Legumes (g/day) | 7.9 ± 8.2 | 8.1 ± 6.8 | 8.1 ± 9.0 | 7.5 ± 8.6 | 0.473 |
| Nutrient intakec | |||||
| Energy (kcal/day) | 1899.9 ± 492.8 | 1915.5 ± 516.0 | 1923.1 ± 451.6 | 1861.1 ± 507.1 | 0.125 |
| Protein (g/day) | 57.7 ± 14.4 | 51.1 ± 10.0 | 55.9 ± 8.4 | 66.1 ± 18.2 | < 0.001 |
| Animal protein (g/day) | 21.8 ± 12.9 | 16.5 ± 8.1 | 20.4 ± 8.9 | 28.4 ± 16.7 | < 0.001 |
| Plant protein (g/day) | 35.9 ± 7.3 | 34.4 ± 7.0 | 35.3 ± 5.8 | 38.1 ± 8.4 | < 0.001 |
| Fat (g/day) | 68.8 ± 15.5 | 67.3 ± 15.1 | 70.1 ± 15.9 | 69.2 ± 15.6 | 0.022 |
| Carbohydrates (g/day) | 289.9 ± 35.8 | 296.8 ± 34.2 | 287.3 ± 36.4 | 285.5 ± 35.8 | < 0.001 |
| Dietary fiber (g/day) | 14.6 ± 3.5 | 16.8 ± 3.6 | 14.3 ± 2.8 | 12.6 ± 2.6 | < 0.001 |
| Cholesterol (mg/day) | 296.0 ± 164.9 | 260.9 ± 165.6 | 286.4 ± 149.0 | 340.7 ± 169.6 | < 0.001 |
| Vitamin A (ugRAE/day) | 781.3 ± 331.9 | 922.7 ± 355.3 | 764.7 ± 302.0 | 656.7 ± 278.6 | < 0.001 |
| Vitamin C (mg/day) | 186.7 ± 68.5 | 238.9 ± 70.8 | 179.9 ± 47.4 | 141.6 ± 45.0 | < 0.001 |
| Vitamin E (mg/day) | 39.6 ± 12.7 | 42.3 ± 13.0 | 39.9 ± 13.1 | 36.8 ± 11.4 | < 0.001 |
| Dietary SFAs (g/day) | 14.8 ± 4.2 | 13.9 ± 3.9 | 15.1 ± 4.0 | 15.5 ± 4.5 | < 0.001 |
| Dietary MUFAs (g/day) | 22.7 ± 8.1 | 21.7 ± 8.0 | 23.0 ± 8.1 | 23.4 ± 8.1 | 0.005 |
| Dietary PUFAs (g/day) | 23.1 ± 8.7 | 23.3 ± 9.0 | 23.5 ± 9.0 | 22.5 ± 8.1 | 0.156 |
| Sodium (mg/day) | 385.4 ± 155.8 | 391.6 ± 136.6 | 381.5 ± 145.9 | 383.2 ± 181.3 | 0.589 |
| Potassium (g/day) | 2.3 ± 0.4 | 2.6 ± 0.4 | 2.2 ± 0.3 | 2.0 ± 0.3 | < 0.001 |
| Calcium (mg/day) | 536.3 ± 166.8 | 576.1 ± 170.3 | 535.2 ± 161.6 | 497.7 ± 159.5 | < 0.001 |
| Magnesium (mg/day) | 314.7 ± 46.2 | 341.0 ± 45.7 | 310.0 ± 40.4 | 293.0 ± 38.6 | < 0.001 |
| Phosphorus (mg/day) | 937.3 ± 119.7 | 936.6 ± 116.8 | 931.1 ± 120.6 | 944.1 ± 121.7 | 0.266 |
| PRAL score (mEq/day) | 0.8 ± 11.3 | −11.0 ± 7.1 | 1.1 ± 2.4 | 12.3 ± 7.7 | < 0.001 |
| NEAP score (mEq/day) | 45.3 ± 16.5 | 31.2 ± 6.9 | 43.4 ± 4.0 | 61.1 ± 17.3 | < 0.001 |
| A:P ratio | 9.8 ± 6.0 | 6.2 ± 2.7 | 9.0 ± 3.2 | 14.1 ± 7.7 | < 0.001 |
Characteristics of study participants according to tertiles of the PRAL scorea.
aValues are expressed as mean ± standard deviation or n (%).
bP value was obtained using the chi-square test for categorical variables and ANOVA tests for continuous variables.
cEnergy-adjusted using the residual method. A:P ratio, animal protein to potassium ratio; pre-pregnancy BMI, pre-pregnancy body mass index; Eq, equivalent; GDM, gestational diabetes mellitus; MUFAs, Monounsaturated fatty acids; NEAP, net endogenous acid production; PRAL, potential renal acid load; PUFAs, Polyunsaturated fatty acids; SFAs, saturated fatty acids; T, tertile.
Correlation Between Dietary Acid Load and Food Intake
Table 2 shows the Pearson correlation coefficients between dietary acid load scores and food intake. There were statistically significant positive correlations between intake of most animal foods (red meats, poultry, fish, and eggs) and dietary acid load scores (all P < 0.05), except for dairy products. Regarding plant foods, we observed significant negative correlations of vegetables, fruits, nuts, and legumes intake with dietary acid load (all P < 0.05). However, grains intake was positively correlated with PRAL and NEAP scores, while it was negatively correlated with the A:P ratio.
TABLE 2
| Food groupb | Dietary acid load | |||||
| PRAL score | P value | NEAP score | P value | A:P ratio | P value | |
| Grains (g/day) | 0.177 | < 0.001 | 0.278 | < 0.001 | −0.100 | < 0.001 |
| Vegetables (g/day) | −0.223 | < 0.001 | −0.305 | < 0.001 | −0.197 | < 0.001 |
| Fruits (g/day) | −0.261 | < 0.001 | −0.452 | < 0.001 | −0.263 | < 0.001 |
| Nuts (g/day) | −0.059 | 0.132 | −0.090 | 0.002 | −0.047 | 0.104 |
| Legumes (g/day) | −0.071 | 0.065 | −0.059 | 0.040 | −0.102 | < 0.001 |
| Total meats g/day) | 0.140 | < 0.001 | 0.246 | < 0.001 | 0.608 | < 0.001 |
| Red meats (g/day) | 0.280 | < 0.001 | 0.453 | < 0.001 | 0.571 | < 0.001 |
| Poultry (g/day) | 0.135 | 0.002 | 0.214 | < 0.001 | 0.355 | < 0.001 |
| Fish (g/day) | 0.086 | 0.024 | 0.121 | < 0.001 | 0.360 | < 0.001 |
| Eggs (g/day) | 0.055 | 0.144 | 0.078 | 0.007 | 0.253 | < 0.001 |
| Dairy products (ml/day) | −0.024 | 0.533 | −0.017 | 0.546 | 0.281 | < 0.001 |
Pearson correlations between food group intake and three dietary acid load measuresa.
aFood group intakes and three dietary acid load measures were log10-transformed to improve normality.
bEnergy-adjusted using the residual method. A:P ratio, animal protein to potassium ratio; NEAP, net endogenous acid production; PRAL, potential renal acid load.
Association Between Maternal Dietary Acid Load and GDM Risk
The associations between indices of dietary acid load and GDM risk were shown in Table 3. In the multivariable models, PRAL score, NEAP score, and A:P ratio were all associated with an increased risk of GDM after adjusting for covariates of maternal age, pre-pregnancy BMI, education, primiparity, smoking status, alcohol intake, regular physical activity, family history of diabetes, and other dietary factors. The multivariable-adjusted ORs (95% CIs) of GDM for the lowest to the highest tertiles of PRAL score were 1.00 (reference), 2.06 (1.35, 3.15), and 2.26 (1.38, 3.71) (P-trend = 0.002). Similar findings were found for the NEAP score (OR for T3 vs. T1: 2.02, 95% CI: 1.25–3.27; T2 vs. T1: 2.05, 95% CI: 1.36–3.10; P-trend = 0.009). In addition, those in the highest tertile of the A:P ratio had a 108% higher risk of GDM than those in the lowest tertile after controlling for potential covariates (OR: 2.08, 95% CI: 1.30–3.31, P-trend = 0.005).
TABLE 3
| Variables | OR (95% CI) | ||||
| Median (IQR) | Cases/N | Crude model | Multivariate model Ia | Multivariate model IIb | |
| PRAL score | |||||
| T1 | −8.91 (−13.79–6.00) | 53/442 | 1.00 | 1.00 | 1.00 |
| T2 | 1.22 (−0.79-3.23) | 82/442 | 1.67 (1.15, 2.43) | 1.69 (1.14, 2.50) | 2.06 (1.35, 3.15) |
| T3 | 10.15 (7.30-14.48) | 82/443 | 1.67 (1.15, 2.42) | 1.64 (1.11, 2.43) | 2.26 (1.38, 3.71) |
| P-trendc | 0.007 | 0.015 | 0.002 | ||
| NEAP score | |||||
| T1 | 32.74 (27.73-35.92) | 52/442 | 1.00 | 1.00 | 1.00 |
| T2 | 43.47 (40.84-46.31) | 86/442 | 1.81 (1.25, 2.63) | 1.78 (1.21, 2.63) | 2.05 (1.36, 3.10) |
| T3 | 55.62 (51.54-64.79) | 79/443 | 1.63 (1.12, 2.38) | 1.63 (1.10, 2.42) | 2.02 (1.25, 3.27) |
| P-trendc | 0.019 | 0.025 | 0.009 | ||
| A:P ratio | |||||
| T1 | 5.32 (3.80-6.29) | 50/442 | 1.00 | 1.00 | 1.00 |
| T2 | 8.85 (8.11-9.62) | 81/442 | 1.76 (1.20, 2.57) | 1.65 (1.11, 2.46) | 1.85 (1.23, 2.79) |
| T3 | 13.75 (12.02-16.34) | 86/443 | 1.89 (1.30, 2.75) | 1.77 (1.19, 2.62) | 2.08 (1.30, 3.31) |
| P-trendc | 0.002 | 0.008 | 0.005 | ||
Associations between maternal dietary acid load and risk of GDM.
aMultivariate model I was adjusted for maternal age, pre-pregnancy BMI, education, primiparity, smoking status, alcohol intake, regular physical activity, and family history of diabetes.
bMultivariate model II was further adjusted for intake of carbohydrate, dietary fiber, cholesterol, vitamin A, vitamin C, vitamin E, SFAs, and MUFAs.
cTests for linear trend were conducted by using the median value for each tertile and treating it as a continuous variable in the logistic regression. A:P ratio, animal protein to potassium ratio; GDM, gestational diabetes mellitus; IQR, interquartile range; NEAP, net endogenous acid production; OR, odds ratio; PRAL, potential renal acid load, T, tertile.
Association Between Maternal Dietary Acid Load and Blood Glucose Concentrations
In the crude model, the highest tertile of dietary acid load (PRAL score, NEAP score, and A:P ratio) in early pregnancy was associated with an increase in FBG, 1-h PBG, and 2-h PBG compared to the lowest tertile. After controlling for potential covariates, we found that women in the highest tertile of the PRAL score significantly increased FBG by 0.09 mmol/L (95% CI: 0.02, 0.17, P-trend = 0.017), 1-h PBG by 0.50 mmol/L (95% CI: 0.19, 0.81, P-trend = 0.002) and 2-h PBG by 0.54 mmol/L (95% CI: 0.28, 0.80, P-trend < 0.001), respectively, compared to women in the lowest tertile. Similarly, we identified the significant positive relationships of NEAP score and A:P ratio with 1-h PBG (β = 0.47, 95% CI: 0.17, 0.77, P-trend = 0.003 for NEAP; β = 0.31, 95% CI: 0.01, 0.61, P-trend = 0.044 for A:P ratio) and 2-h PBG (β = 0.43, 95% CI: 0.18, 0.69, P-trend = 0.001 for NEAP; β = 0.28, 95% CI: 0.03, 0.53, P-trend = 0.041 for A:P ratio) when the highest tertile compared to the lowest tertile (Table 4).
TABLE 4
| Variables | β (95% CI), mmol/L | ||
| Crude model | Multivariate model Ia | Multivariate model IIb | |
| PRAL score | |||
| FBG | |||
| T1 | 0.00 | 0.00 | 0.00 |
| T2 | 0.08 (0.02, 0.14) | 0.06 (0.00, 0.12) | 0.07 (0.01, 0.14) |
| T3 | 0.10 (0.04, 0.16) | 0.08 (0.02, 0.13) | 0.09 (0.02, 0.17) |
| P-trendc | 0.001 | 0.009 | 0.017 |
| 1-h PBG | |||
| T1 | 0.00 | 0.00 | 0.00 |
| T2 | 0.21 (−0.04, 0.46) | 0.09 (−0.15, 0.33) | 0.26 (−0.01, 0.53) |
| T3 | 0.37 (0.12, 0.61) | 0.23 (0.00, 0.47) | 0.50 (0.19, 0.81) |
| P-trendc | 0.003 | 0.051 | 0.002 |
| 2-h PBG | |||
| T1 | 0.00 | 0.00 | 0.00 |
| T2 | 0.29 (0.09, 0.50) | 0.18 (−0.02, 0.38) | 0.40 (0.18, 0.63) |
| T3 | 0.33 (0.13, 0.53) | 0.23 (0.03, 0.42) | 0.54 (0.28, 0.80) |
| P-trendc | 0.001 | 0.022 | < 0.001 |
| NEAP score | |||
| FBG | |||
| T1 | 0.00 | 0.00 | 0.00 |
| T2 | 0.05 (−0.01, 0.12) | 0.03 (−0.03, 0.09) | 0.04 (−0.02, 0.11) |
| T3 | 0.08 (0.02, 0.14) | 0.06 (−0.00, 0.11) | 0.06 (−0.01, 0.14) |
| P-trendc | 0.010 | 0.053 | 0.113 |
| 1-h PBG | |||
| T1 | 0.00 | 0.00 | 0.00 |
| T2 | 0.27 (0.02, 0.52) | 0.15 (−0.09, 0.39) | 0.31 (0.04, 0.57) |
| T3 | 0.36 (0.11, 0.60) | 0.25 (0.02, 0.49) | 0.47 (0.17, 0.77) |
| P-trendc | 0.004 | 0.034 | 0.003 |
| 2-h PBG | |||
| T1 | 0.00 | 0.00 | 0.00 |
| T2 | 0.36 (0.15, 0.56) | 0.25 (0.05, 0.45) | 0.43 (0.20, 0.65) |
| T3 | 0.29 (0.08, 0.49) | 0.21 (0.02, 0.41) | 0.43 (0.18, 0.69) |
| P-trendc | 0.008 | 0.039 | 0.001 |
| A:P ratio | |||
| FBG | |||
| T1 | 0.00 | 0.00 | 0.00 |
| T2 | 0.08 (0.02, 0.14) | 0.05 (−0.01, 0.11) | 0.06 (−0.01, 0.12) |
| T3 | 0.09 (0.03, 0.15) | 0.06 (0.00, 0.12) | 0.05 (−0.03, 0.12) |
| P-trendc | 0.006 | 0.043 | 0.309 |
| 1-h PBG | |||
| T1 | 0.00 | 0.00 | 0.00 |
| T2 | 0.13 (−0.12, 0.38) | 0.01 (−0.23, 0.25) | 0.15 (−0.12, 0.41) |
| T3 | 0.27 (0.03, 0.52) | 0.13 (−0.10, 0.37) | 0.31 (0.01, 0.61) |
| P-trendc | 0.031 | 0.245 | 0.044 |
| 2-h PBG | |||
| T1 | 0.00 | 0.00 | 0.00 |
| T2 | 0.18 (−0.03, 0.39) | 0.09 (−0.11, 0.29) | 0.23 (0.01, 0.45) |
| T3 | 0.20 (−0.01, 0.40) | 0.09 (−0.11, 0.29) | 0.28 (0.03, 0.53) |
| P-trendc | 0.075 | 0.411 | 0.041 |
Associations between maternal dietary acid load and blood glucose levels.
aMultivariate model I was adjusted for maternal age, pre-pregnancy BMI, education, primiparity, smoking status, alcohol intake, regular physical activity, and family history of diabetes.
bMultivariate model II was further adjusted for intake of carbohydrate, dietary fiber, cholesterol, vitamin A, vitamin C, vitamin E, SFAs, and MUFAs.
cTests for linear trend were conducted by using the median value for each tertile and treating it as a continuous variable in the logistic regression. A:P ratio, animal protein to potassium ratio; FBG, fasting blood glucose; NEAP, net endogenous acid production; PBG, post-load blood glucose; PRAL, potential renal acid load, T, tertile.
Subgroup and Sensitivity Analyses
To assess whether other confounding factors modified the association between dietary acid load and risk of GDM, we performed stratified analyses by maternal age (< 29.2 or ≥ 29.2 years), pre-pregnancy BMI (< 20.5 or ≥ 20.5 kg/m2), primiparity (yes or no), gravidity (< 1 or ≥ 2), regular physical activity (yes or no), and family history of diabetes (yes or no). No significant modifications were observed between dietary acid load and GDM risk (all Pinteraction > 0.05) (Supplementary Table 1). In sensitivity analyses that excluded participants with age >30 years, abnormal pregnancy BMI, smoking, and alcohol consumption, the results remained stable and the significantly positive associations were still observed (Supplementary Table 2).
Discussion
In this study of pregnant Chinese women, we found that higher dietary acid load (as reflected by three different dietary acid load indices) in early pregnancy was associated with an increased risk of GDM, even after adjustment for characteristics, lifestyle, and other dietary factors (carbohydrate, dietary fiber, cholesterol, vitamin A, vitamin C, vitamin E, SFAs, and MUFAs). In addition, the positive associations tended to be stronger in women with pre-pregnancy BMI ≥ 20.5 kg/m2, primiparity, gravidity ≥ 2, lack of regular physical activity, and having a family history of diabetes. After controlling for potential covariates, FBG, 1-h PBG, and 2-h PBG were all significantly increased in the highest tertile of PRAL scores compared to the lowest tertile. Also, higher NEAP scores and A:P ratio increased 1-h PBG and 2-h PBG, but not FBG levels.
In recent years, the interest of research has focused on the relationship between diet-induced acid load and type 2 diabetes and insulin resistance (12, 13, 17, 32). A prospective cohort study of 66,485 French women and the pooled results from three prospective cohort studies in the United States both showed that dietary acid load was positively associated with the risk of type 2 diabetes (13, 32). Similarly, the results of a meta-analysis that included 14 studies showed that participants in the highest categories of PRAL and NEAP scores had a 19 and 22% increased risk of developing diabetes, respectively, compared to the lowest categories (17). Another prospective study in a Korean middle-aged and elderly population found that a higher diet-dependent acid load was associated with an increased risk of insulin resistance in the future (12). To our knowledge, however, research investigating the relationship between dietary acid load and the risk of GDM has been limited to date. In line with our findings, a case-control study conducted in Iran reported a positive association between dietary acid load and risk of GDM measured by PRAL score and A:P ratio (23). Furthermore, apart from finding a positive relationship between PRAL scores and FBG as in the previous study (23), we also identified significant relationships of dietary acid load with 1-h PBG and 2-h PBG.
Our study used three different methods to calculate dietary acid load: PRAL, NEAP, and A:P ratio. These methods are calculated based on the intake of protein, phosphorus, potassium, magnesium, and calcium. All these nutrients are acid-base precursors and may be in relation to pH homeostasis in the body (28, 30, 33). Studies have suggested that foods from animals, such as cheese, fish, and meat, have more acid precursors, while fruits and vegetables are net alkalinizing in nature (20, 21, 34). In the current study, the results showed that the PRAL score, NEAP score, and A:P ratio were all strongly positively correlated with the intake of red meat, poultry, fish, and eggs, while there were significant negative correlations with the intake of vegetables, fruits, legumes, and nuts. The findings are consistent with those of previous studies in other populations (32, 35). Notably, previous studies have only confirmed that consumption of single acidic foods (e.g., meat, milk) or alkaline foods (e.g., fruit, vegetables) was associated with the risk of GDM (36–39); however, taking an integrated approach considering the balance of acidic and alkaline foods may be more important than assessing single acidic and alkaline foods.
The underlying mechanisms linking dietary acid load to glucose homeostasis and GDM risk remain to be elucidated. In the current study, we found that individuals in the highest tertile of dietary acid load had higher protein intakes and lower potassium, calcium, and magnesium intakes. Studies have shown that meat and dairy products, as the main sources of animal protein, were significantly associated with a higher risk of GDM (36, 37). Moreover, animal protein and cereal grains have higher contents of sulfur-containing amino acids (methionine, homocysteine, and cysteine), which produce sulfates with acidifying effects during their metabolism and constitute the main contributor to the daily acid load (33, 40). The main food sources of potassium are vegetables and fruits, which also provide other basic cations (e.g., magnesium). A low-potassium diet can lead to the development of impaired glucose tolerance, through impairments in insulin secretion from pancreatic β-cells (41). Also, potassium can involves in acid-base homeostasis by exchanging hydrogen ions across the cell membrane to assist in electroneutrality (42). Low blood pH could reduce the uptake of glucose by muscle tissue, disrupt the binding of insulin to its receptors (43), and further inhibit insulin signaling pathways, which could lead to the development of insulin resistance and diabetes (44). In addition, the high acidity of the diet may stimulate cortisol secretion from the adrenal cortex, and chronically elevated cortisol levels may induce insulin resistance (45, 46). Furthermore, a higher dietary acid load may stimulate the expression of induced NO synthase and increase levels of inflammatory factors, which may in turn be triggers for GDM (47, 48).
The strengths of this study include detailed information on potential confounders and a prospective design, which greatly reduces the chance of reverse causality and provides strong evidence for examining the associations between dietary acid load and GDM risk. Secondly, we used three indicators, PRAL score, NEAP score, and A:P ratio, which could provide a more comprehensive assessment of dietary acid load during pregnancy from different perspectives. In addition, as dietary habits vary considerably between populations, this study provides evidence from the population of Chinese pregnant women, filling a data gap in the relationship between dietary acid load and GDM in this population.
The current study also has some limitations that need to be considered. Firstly, we used the validated FFQ for dietary assessment, which may still be subject to measurement error and inaccuracy. To partially control for reporting bias, we excluded all participants with extreme values of total energy intake (< 500 kcal/day or > 3500 kcal/day) from the analysis and also adjusted food and nutrient intakes according to the energy residual method. Secondly, we only assessed dietary acid load in early pregnancy, whereas subsequent dietary changes in mid and late pregnancy may have some influence on the results. However, diet before the onset of GDM may more accurately reflect the true causal relationship between exposure and outcome, which could exclude the effect of changes to diet after the occurrence of GDM. Finally, we cannot completely exclude the impact of unmeasured residual factors that may influence the association between dietary acid load and GDM risk. However, it is worth noting that our analysis has adjusted for several confounding factors identified in the previous studies including maternal age, education level, pre-pregnancy BMI, primiparity, smoking status, alcohol intake, regular physical activity, and family history of diabetes.
Conclusion
To our knowledge, this is the first prospective cohort study using a combination of three indicators to assess the association between dietary acid load and the risk of GDM. Collectively, we found that dietary acid load scores in early pregnancy were positively related to GDM risk in Chinese pregnant women. Decreasing dietary acid load may be a preventive strategy to reduce the occurrence of GDM. Underlying biological mechanisms involved in these associations should be identified and further explored in future studies. Besides, further large-scale studies are needed to confirm our findings in other populations.
Publisher’s Note
All claims expressed in this article are solely those of the authors and do not necessarily represent those of their affiliated organizations, or those of the publisher, the editors and the reviewers. Any product that may be evaluated in this article, or claim that may be made by its manufacturer, is not guaranteed or endorsed by the publisher.
Statements
Data availability statement
The raw data supporting the conclusions of this article will be made available by the authors, without undue reservation.
Ethics statement
The studies involving human participants were reviewed and approved by Tongji Medical College of Huazhong University of Science and Technology. The patients/participants provided their written informed consent to participate in this study.
Author contributions
LH, GX, and XY contributed to the conceptualization of the study. RZ and YL performed the analysis. SW, LZ, and GL conducted data collection. RZ wrote the manuscript. LH and GX critically revised the manuscript. All authors read and approved the submitted manuscript.
Funding
This study was supported by the National Natural Science Foundation of China (LH, Nos. 81773426 and 82173513) and the Foundation of the Health Commission of Hubei Province (GX, WJ2021F003). The funders had no role in the study design, implementation, analysis, decision to publish, or reparation of the manuscript.
Acknowledgments
We thank all the pregnant women who participated in the Tongji Birth Cohort study (TJBC) for their cooperation. We also sincerely thank all the investigators in the TJBC study group for their valuable contributions.
Conflict of interest
The authors declare that the research was conducted in the absence of any commercial or financial relationships that could be construed as a potential conflict of interest.
Supplementary material
The Supplementary Material for this article can be found online at: https://www.frontiersin.org/articles/10.3389/fnut.2022.892698/full#supplementary-material
References
1.
American Diabetes Association [ADA].2. Classification and diagnosis of diabetes: standards of medical care in diabetes-2020.Diabetes Care. (2020) 43:S14–31. 10.2337/dc20-S002
2.
Al-RifaiRHAbdoNMPauloMSSahaSAhmedLA.Prevalence of gestational diabetes mellitus in the Middle East and North Africa, 2000–2019: a systematic review, meta-analysis, and meta-regression.Front Endocrinol (Lausanne). (2021) 12:668447. 10.3389/fendo.2021.668447
3.
ZhuYZhangC.Prevalence of gestational diabetes and risk of progression to Type 2 diabetes: a global perspective.Curr Diab Rep. (2016) 16:7. 10.1007/s11892-015-0699-x
4.
GaoCSunXLuLLiuFYuanJ.Prevalence of gestational diabetes mellitus in mainland China: a systematic review and meta-analysis.J Diabetes Investig. (2019) 10:154–62. 10.1111/jdi.12854
5.
BillionnetCMitanchezDWeillANizardJAllaFHartemannAet alGestational diabetes and adverse perinatal outcomes from 716,152 births in France in 2012.Diabetologia. (2017) 60:636–44. 10.1007/s00125-017-4206-6
6.
FarrarDSimmondsMBryantMSheldonTATuffnellDGolderSet alHyperglycaemia and risk of adverse perinatal outcomes: systematic review and meta-analysis.BMJ. (2016) 354:i4694. 10.1136/bmj.i4694
7.
GaoMCaoSLiNLiuJLyuYLiJet alRisks of overweight in the offspring of women with gestational diabetes at different developmental stages: a meta-analysis with more than half a million offspring.Obes Rev. (2021) 23:e13395. 10.1111/obr.13395
8.
RowlandJWilsonCA.The association between gestational diabetes and ASD and ADHD: a systematic review and meta-analysis.Sci Rep. (2021) 11:5136. 10.1038/s41598-021-84573-3
9.
LiZChengYWangDChenHChenHMingWKet alIncidence rate of Type 2 diabetes mellitus after gestational diabetes mellitus: a systematic review and meta-analysis of 170,139 women.J Diabetes Res. (2020) 2020:3076463. 10.1155/2020/3076463
10.
HannahWBhavadhariniBBeksHDeepaMAnjanaRMUmaRet alGlobal burden of early pregnancy gestational diabetes mellitus (eGDM): a systematic review.Acta Diabetol. (2022) 59:403–27. 10.1007/s00592-021-01800-z
11.
PengYHanNSuTZhouSBaoHJiYet alGestational weight gain and the risk of gestational diabetes mellitus: a latent class trajectory analysis using birth cohort data.Diabetes Res Clin Pract. (2021) 182:109130. 10.1016/j.diabres.2021.109130
12.
LeeKWShinD.Positive association between dietary acid load and future insulin resistance risk: findings from the Korean Genome and Epidemiology Study.Nutr J. (2020) 19:137. 10.1186/s12937-020-00653-6
13.
Kiefte-de JongJCLiYChenMCurhanGCMatteiJMalikVSet alDiet-dependent acid load and type 2 diabetes: pooled results from three prospective cohort studies.Diabetologia. (2017) 60:270–9. 10.1007/s00125-016-4153-7
14.
GædeJNielsenTMadsenMLToftUJørgensenTOvervadKet alPopulation-based studies of relationships between dietary acidity load, insulin resistance and incident diabetes in Danes.Nutr J. (2018) 17:91. 10.1186/s12937-018-0395-1
15.
AbshiriniMBagheriFMahakiBSiassiFKoohdaniFSafabakhshMet alThe dietary acid load is higher in subjects with prediabetes who are at greater risk of diabetes: a case-control study.Diabetol Metab Syndr. (2019) 11:52. 10.1186/s13098-019-0447-5
16.
Medina-RemónAKirwanRLamuela-RaventósRMEstruchR.Dietary patterns and the risk of obesity, type 2 diabetes mellitus, cardiovascular diseases, asthma, and neurodegenerative diseases.Crit Rev Food Sci Nutr. (2018) 58:262–96. 10.1080/10408398.2016.1158690
17.
DehghanPAbbasalizad FarhangiM.Dietary acid load, blood pressure, fasting blood sugar and biomarkers of insulin resistance among adults: findings from an updated systematic review and meta-analysis.Int J Clin Pract. (2020) 74:e13471. 10.1111/ijcp.13471
18.
FarwellWRTaylorEN.Serum bicarbonate, anion gap and insulin resistance in the National Health and Nutrition Examination Survey.Diabet Med. (2008) 25:798–804. 10.1111/j.1464-5491.2008.02471.x
19.
McCartyMF.Acid-base balance may influence risk for insulin resistance syndrome by modulating cortisol output.Med Hypotheses. (2005) 64:380–4. 10.1016/j.mehy.2004.01.045
20.
MüllerAZimmermann-KlemdAMLedererAKHannibalLKowarschikSHuberRet alA vegan diet is associated with a significant reduction in dietary acid load: post hoc analysis of a randomized controlled trial in healthy individuals.Int J Environ Res Public Health. (2021) 18:9998. 10.3390/ijerph18199998
21.
CosgroveKJohnstonCS.Examining the impact of adherence to a vegan diet on acid-base balance in healthy adults.Plant Foods Hum Nutr. (2017) 72:308–13. 10.1007/s11130-017-0620-7
22.
BeigrezaeiSGhiasvandRFeiziAIrajB.Relationship between dietary patterns and incidence of Type 2 diabetes.Int J Prev Med. (2019) 10:122. 10.4103/ijpvm.IJPVM_206_17
23.
Saraf-BankSTehraniHHaghighatdoostFMoosavianSPAzadbakhtL.The acidity of early pregnancy diet and risk of gestational diabetes mellitus.Clin Nutr. (2018) 37:2054–9. 10.1016/j.clnu.2017.09.020
24.
ZhangHQiuXZhongCZhangKXiaoMYiNet alReproducibility and relative validity of a semi-quantitative food frequency questionnaire for Chinese pregnant women.Nutr J. (2015) 14:56. 10.1186/s12937-015-0044-x
25.
ZhaoRGaoQXiongTZhouJWangSZhangZet alModerate freshwater fish intake, but not n-3 polyunsaturated fatty acids, is associated with a reduced risk of small for gestational age in a prospective cohort of chinese pregnant women.J Acad Nutr Diet. (2022) 122:722–30.e12. 10.1016/j.jand.2021.10.016
26.
YangYWangGPanX.China Food Composition.Dongguan: Peiking University Medical Center Press (2009).
27.
WillettWStampferMJ.Total energy intake: implications for epidemiologic analyses.Am J Epidemiol. (1986) 124:17–27. 10.1093/oxfordjournals.aje.a114366
28.
RemerTDimitriouTManzF.Dietary potential renal acid load and renal net acid excretion in healthy, free-living children and adolescents.Am J Clin Nutr. (2003) 77:1255–60. 10.1093/ajcn/77.5.1255
29.
FrassettoLAToddKMMorrisRCJr.SebastianA.Estimation of net endogenous noncarbonic acid production in humans from diet potassium and protein contents.Am J Clin Nutr. (1998) 68:576–83. 10.1093/ajcn/68.3.576
30.
ZwartSRHargensARSmithSM.The ratio of animal protein intake to potassium intake is a predictor of bone resorption in space flight analogues and in ambulatory subjects.Am J Clin Nutr. (2004) 80:1058–65. 10.1093/ajcn/80.4.1058
31.
MetzgerBEGabbeSGPerssonBBuchananTACatalanoPADammPet alInternational association of diabetes and pregnancy study groups recommendations on the diagnosis and classification of hyperglycemia in pregnancy.Diabetes Care. (2010) 33:676–82. 10.2337/dc09-1848
32.
FagherazziGVilierABonnetFLajousMBalkauBBoutron-RualtMCet alDietary acid load and risk of type 2 diabetes: the E3N-EPIC cohort study.Diabetologia. (2014) 57:313–20. 10.1007/s00125-013-3100-0
33.
AdevaMMSoutoG.Diet-induced metabolic acidosis.Clin Nutr. (2011) 30:416–21. 10.1016/j.clnu.2011.03.008
34.
RemerTManzF.Potential renal acid load of foods and its influence on urine pH.J Am Diet Assoc. (1995) 95:791–7. 10.1016/s0002-8223(95)00219-7
35.
AkterSKurotaniKKashinoIGotoAMizoueTNodaMet alHigh dietary acid load score is associated with increased risk of Type 2 diabetes in Japanese men: the Japan public health center-based prospective study.J Nutr. (2016) 146:1076–83. 10.3945/jn.115.225177
36.
PangWWColegaMCaiSChanYHPadmapriyaNChenLWet alHigher maternal dietary protein intake is associated with a higher risk of gestational diabetes mellitus in a multiethnic Asian cohort.J Nutr. (2017) 147:653–60. 10.3945/jn.116.243881
37.
LiangYGongYZhangXYangDZhaoDQuanLet alDietary protein intake, meat consumption, and dairy consumption in the year preceding pregnancy and during pregnancy and their associations with the risk of gestational diabetes mellitus: a prospective cohort study in Southwest China.Front Endocrinol (Lausanne). (2018) 9:596. 10.3389/fendo.2018.00596
38.
ZhouXChenRZhongCWuJLiXLiQet alFresh fruit intake in pregnancy and association with gestational diabetes mellitus: a prospective cohort study.Nutrition. (2019) 60:129–35. 10.1016/j.nut.2018.09.022
39.
ChenQWuWYangHZhangPFengYWangKet alA vegetable dietary pattern is associated with lowered risk of gestational diabetes mellitus in Chinese women.Diabetes Metab J. (2020) 44:887–96. 10.4093/dmj.2019.0138
40.
Osuna-PadillaIALeal-EscobarGGarza-GarcíaCARodríguez-CastellanosFE.Dietary Acid Load: mechanisms and evidence of its health repercussions.Nefrologia (Engl Ed). (2019) 39:343–54. 10.1016/j.nefro.2018.10.005
41.
ChatterjeeRDavenportCARaffieldLMMaruthurNLangeLSelvinEet alKCNJ11 variants and their effect on the association between serum potassium and diabetes risk in the Atherosclerosis Risk in Communities (ARIC) Study and Jackson Heart Study (JHS) cohorts.PLoS One. (2018) 13:e0203213. 10.1371/journal.pone.0203213
42.
AronsonPSGiebischG.Effects of pH on potassium: new explanations for old observations.J Am Soc Nephrol. (2011) 22:1981–9. 10.1681/asn.2011040414
43.
IgarashiMYamataniKFukaseNDaimonMOhnumaHOgawaAet alEffect of acidosis on insulin binding and glucose uptake in isolated rat adipocytes.Tohoku J Exp Med. (1993) 169:205–13. 10.1620/tjem.169.205
44.
HayataHMiyazakiHNiisatoNYokoyamaNMarunakaY.Lowered extracellular pH is involved in the pathogenesis of skeletal muscle insulin resistance.Biochem Biophys Res Commun. (2014) 445:170–4. 10.1016/j.bbrc.2014.01.162
45.
EscheJShiLSánchez-GuijoAHartmannMFWudySARemerT.Higher diet-dependent renal acid load associates with higher glucocorticoid secretion and potentially bioactive free glucocorticoids in healthy children.Kidney Int. (2016) 90:325–33. 10.1016/j.kint.2016.02.033
46.
KambaADaimonMMurakamiHOtakaHMatsukiKSatoEet alAssociation between higher serum cortisol levels and decreased insulin secretion in a general population.PLoS One. (2016) 11:e0166077. 10.1371/journal.pone.0166077
47.
CapelliniVKRestiniCBBendhackLMEvoraPRCelottoAC.The effect of extracellular pH changes on intracellular pH and nitric oxide concentration in endothelial and smooth muscle cells from rat aorta.PLoS One. (2013) 8:e62887. 10.1371/journal.pone.0062887
48.
WuTSeaverPLemusHHollenbachKWangEPierceJP.Associations between Dietary Acid Load and biomarkers of inflammation and hyperglycemia in breast cancer survivors.Nutrients. (2019) 11:1913. 10.3390/nu11081913
Summary
Keywords
dietary acid load, gestational diabetes mellitus (GDM), potential renal acid load (PRAL), net endogenous acid production (NEAP), animal protein to potassium ratio (A:P ratio), cohort
Citation
Zhao R, Zhou L, Lei G, Wang S, Li Y, Yang X, Xiong G and Hao L (2022) Dietary Acid Load Is Positively Associated With Risk of Gestational Diabetes Mellitus in a Prospective Cohort of Chinese Pregnant Women. Front. Nutr. 9:892698. doi: 10.3389/fnut.2022.892698
Received
09 March 2022
Accepted
09 May 2022
Published
26 May 2022
Volume
9 - 2022
Edited by
Rafaela Rosário, University of Minho, Portugal
Reviewed by
Ghazaleh Eslamian, Shahid Beheshti University of Medical Sciences, Iran; Geng-dong Chen, Foshan Women and Children Hospital, China
Updates
Copyright
© 2022 Zhao, Zhou, Lei, Wang, Li, Yang, Xiong and Hao.
This is an open-access article distributed under the terms of the Creative Commons Attribution License (CC BY). The use, distribution or reproduction in other forums is permitted, provided the original author(s) and the copyright owner(s) are credited and that the original publication in this journal is cited, in accordance with accepted academic practice. No use, distribution or reproduction is permitted which does not comply with these terms.
*Correspondence: Guoping Xiong, Hyh0120@163.comLiping Hao, haolp@mails.tjmu.edu.cn
This article was submitted to Nutritional Epidemiology, a section of the journal Frontiers in Nutrition
Disclaimer
All claims expressed in this article are solely those of the authors and do not necessarily represent those of their affiliated organizations, or those of the publisher, the editors and the reviewers. Any product that may be evaluated in this article or claim that may be made by its manufacturer is not guaranteed or endorsed by the publisher.