Abstract
Introduction:
Although waist-to-height ratio (WHtR) has established association with cardiometabolic disease, the trend of changes in elevated WHtR among general population have not been examined adequately.
Methods:
This study examined the prevalence of elevated WHtR and waist circumference (WC) and their trends over time using Joinpoint regression models among adults who participated in the United States National Health and Nutrition Examination Survey (U.S. NHANES) 1999–2018. We performed weighted logistic regression to identify the association between central obesity subtypes and the prevalence of comorbidities, including diabetes, chronic kidney disease, hypertension, cardiovascular disease, and cancer.
Results:
The prevalence of elevated WHtR has increased from 74.8% in 1999–2000 to 82.7% in 2017–2018 while elevated WC also increased from 46.9% in 1999–2000 to 60.3% in 2017–2018. Men, older adults, former smokers, and people with lower education levels were more likely to have elevated WHtR. A total of 25.5% of American adults had normal WC but elevated WHtR, and they had a significantly higher chance of suffering from diabetes (odds ratio [OR] = 2.06 [1.66, 2.55]), hypertension (OR = 1.75 [1.58, 1.93]) and CVD (OR = 1.32 [1.11, 1.57]).
Discussion:
In conclusion, the burden of elevated WHtR and WC have been increasing among U.S. adults throughout the years, and the changes have been more significant across most subgroups. It is also notable that approximately a quarter of the population had normal WC but elevated WHtR, which had increased likelihood of having cardiometabolic diseases, especially diabetes. Future clinical practices should pay more attention to this subgroup of the population with overlooked health risks.
1. Introduction
Valid and easy-to-measure anthropometric indicators are needed to screen for people with elevated risk of non-communicable diseases, including diabetes, cardiovascular diseases (CVD) and cancer, which confer a significant global health burden (1, 2). Although body mass index (BMI) is a simple and widely used anthropometric index, accumulating evidence suggests that obesity indices such as waist-to-height ratio (WHtR) and waist circumference (WC) have better screening power for cardiometabolic risk (3). WHtR is a better tool than BMI in assessing central obesity and can be better than WC in accounting for the variations in height (4). Receiver operating characteristic curves of two meta-analyses showed that WHtR had better power than BMI and WC in classifying CVD risk factors among adults and children (3, 5). A cross-sectional analysis of baseline data from a Chinese prospective cohort also suggested WHtR to be the best indicator for dyslipidemia and hyperglycemia (6). Another cross-sectional analysis in 21,109 participants using the United States (U.S.) National Health and Nutrition Examination Survey (NHANES) 1999–2014 also suggested WHtR had a better discriminatory power in predicting diabetes than BMI (area under the curve: 0.709 versus 0.654), and a stronger association with the prevalence of diabetes than BMI (7).
Moreover, increasing prospective studies have demonstrated the predictive power of obesity indices on long-term risk of cardiometabolic diseases. For example, a higher WC has been associated with higher all-cause and CVD mortalities regardless of BMI categories (8, 9). Results from the Nurses’ Health Study also supported that elevated WC was positively associated with all-cause, CVD, and cancer mortalities independently of BMI (10). Among 26,607 participants from the Alberta’s Tomorrow Project cohort, the association between BMI and all-cancer risk became insignificant after adjusting for WC, especially among women (11). In terms of WHtR, it may be associated with a higher risk of diabetes (12), CVD morbidity (13) and liver cancer in prospective cohorts (14). Another cohort analysis among 109,536 postmenopausal women participated in the Women’s Health Initiative had shown a higher risk for CVD events when WHtR was ≥0.5 (Hazard ratio 1.29, 95% confidence interval [CI] 1.22 to 1.36), and the magnitude of association was comparable to WC (HR 1.23, 95% CI 1.17 to 1.30) and possibly stronger than BMI-classified obesity (HR 1.19, 95% CI 1.11 to 1.27) (15).
Although growing studies have indicated the utility of WHtR in early screening for individuals with elevated health risks, several research questions still have not been answered. First, previous studies have examined the changes in WHtR over time among Australian children (15, 16), Chinese women of childbearing age (17), and Chinese adults (18), but the temporal analyses using the U.S. NHANES data did not include WHtR (19, 20). Studies on the prevalence of elevated WHtR in general population in Western countries are inadequate. The second research question is the prevalence of people with normal WC but having elevated WHtR in the general population, as well as their associations with comorbidities. Several studies have investigated the association between normal weight central obesity (people with normal BMI but having excessive abdominal fat), cardiometabolic health and cause-specific mortality (21–23). The key missing information in these studies was the proportion of individuals with central obesity classified by WHtR, but they were defined as normal based on their WC. If this group of individuals also have elevated risk of cardiometabolic diseases, such as higher risk of diabetes and CVD, WHtR should be routinely screened.
To address these aforementioned knowledge gaps, we have conducted the present study to examine the changes in the prevalence of elevated WHtR and WC among U.S. adults using a nationally representative sample. We also demonstrated the prevalence of people with normal WC but having elevated WHtR, and whether this subgroup of population may have significantly higher risk of comorbidities.
2. Materials and methods
2.1. Study population
NHANES is a nationally representative cross-sectional survey designed to monitor the health and nutritional status of the resident civilian noninstitutionalized U.S. population of the entire nation. The formulation and review of the NHANES program complies with the U.S. Department of Health and Human services’ policy to protect human research subjects (45 CFR 46, available from https://www.hhs.gov/ohrp/regulations-and-policy/regulations/45-cfr-46/index.html, accessed on 10 June 2021). The National Center for Health Statistics Research Ethics Review Board (NCHS ERB) reviewed and approved the study (NCHS ERB protocol number #2005–06 and #2011–17, available from https://www.cdc.gov/nchs/nhanes/irba98.htm, accessed on 10 June 2021). Informed consent was obtained from participants upon recruitment.
We included adults (aged ≥20) from NHANES cycles 1999 to 2018 in this study. Pregnant women and participants without data on WHtR or WC were excluded. To perform the logistic regression, we further excluded those with missing covariate data, including demographic variables and comorbidities. This study was reported as per the Strengthening the Reporting of Observational Studies in Epidemiology (STROBE) guideline for cross-sectional study.
2.2. Anthropometric assessment
The anthropometric indexes included WHtR and WC. Anthropometric measurements were performed at the Mobile Examination Center using standardized anthropometry examination procedures and calibrated equipment (24). A fixed stadiometer with a vertical backboard and a moveable headboard was used for height measurement. Height measurements were taken using different equipment during different time periods. Between 1999 and 2006, a Seca electronic stadiometer was used, while starting in 2007, a ProScale Inductive Incremental scale with a ProScale digital measurement device connected to the acrylic headpiece was utilized. Although the equipment changed, the measurement discrepancies were minor and negligible. WC was measured at minimal respiration by positioning a measuring tape in a horizontal plane at the level of right above the uppermost lateral border of the right ilium. Between 1999 and 2006, the measurements were carried out by a single examiner who relied on a wall-mounted mirror to ensure accurate horizontal alignment of the measuring tape. However, starting from 2007, the measurement procedure was revised to include an additional step. In addition to the use of the mirror, the recorder was now also required to move to the participants’ left side to verify the correct placement of the measuring tape. This amendment to the Anthropometry Procedures Manual was intended to improve accuracy and reduce measurement error, rather than to substantially change the measurement itself. As a result, the impact of these changes on data analysis is typically minor and can be neglected. WHtR was defined as the waist circumference divided by the height, both in the same units. WC and WHtR were dichotomized by the common cut-off points among adult population. The conventional indicators for central obesity included elevated WHtR (WHtR≥0.5) (25), and elevated WC (≥102 cm for men and ≥ 88 cm for women) (26).
2.3. Sociodemographic and lifestyle characteristics
Questionnaires were administered by trained interviewers to collect sociodemographic information and medical history. These included age (20–39, 40–59, ≥60 years), sex (men or women), race/ethnicity (Non-Hispanic White, Non-Hispanic Black, other Hispanic or other race), educational attainment (less than high school, high school, at least some college), poverty-income-ratio (PIR, dichotomized as <1 or ≥ 1), smoking status (categorized as never, former, or current smoker). For adults 20 and older, smoking status were asked by trained interviewers using a Computer-Assisted Personal Interviewing (CAPI) system in the home. In this study, smoking status grouped as never smoker (<100 cigarettes in the entire life), former smoker (≥100 cigarettes and non-smoker currently), and current smoker (≥100 cigarettes and smoking currently) (27). PIR, a socioeconomic status index, is the ratio of the family’s self-reported income to the family’s appropriate poverty threshold according to the U.S. Census Bureau, and PIR values of 1.00 or greater indicating people above the poverty threshold (28).
2.4. Definition of pre-existing comorbidities
Diabetes was defined as the presence of at least one of following criteria: (1) fasting plasma glucose ≥7.0 mmol/L (126 mg/dL); (2) hemoglobin A1c (HbA1c) ≥6.5% (48 mmol/mol); (3) oral glucose tolerance test ≥11.1 mmol/L (200 mg/dL); (4) for a patient with classic symptoms of hyperglycemia or hyperglycemic crisis, having a random plasma glucose ≥11.1 mmol/L (200 mg/dL) (29). Chronic kidney disease (CKD) was defined as eGFR <60 mL/min per 1.73 m2 or a urinary albumin-to-creatinine ratio > 30 mg/g (30). Hypertension was defined as the presence of at least one of the following conditions: (1) systolic blood pressure ≥ 140 mmHg or diastolic blood pressure ≥ 90 mmHg; (2) current use of medication to treat hypertension; and/or (3) self-reported hypertension (31). Any CVD was considered to be present if the participant self-reported prior coronary heart disease, heart failure, or stroke as informed by a doctor (32). Cancer was defined as self-reported history of cancer or malignancy.
2.5. Statistical analyses
Descriptive statistics were used to present the frequency and proportion of the sociodemographic factors. We calculated the weighted prevalence of elevated WHtR and WC using the sample weights created for the NHANES study. The weights account for the complex survey design (including oversampling), survey nonresponse, and post-stratification in order to ensure that calculated estimates are representative of the U.S. civilian noninstitutionalized population. We used Joinpoint regression models and examined changes in the prevalence of elevated WHtR and elevated WC over time expressed as average annual percentage change (AAPC) for the entire study period and annual percentage change (APC) for each linear trend segment detected (33, 34). The minimum number of observations from a Joinpoint to either end of the data (excluding the first or last Joinpoint if it falls on an observation) and between two Joinpoints (excluding any Joinpoint if it falls on an observation) was set as 2. Tests of coincidence were performed in pairwise comparison to see whether the changing trend of WHtR and WC among various subgroups were statistically significant, p value <0.05 (35).
We conducted a series of subgroup analyses on estimating trends in prevalence of elevated WHtR and WC over time, including the socio-demographics (sex, ethnicity, age, education level, PIR), lifestyle characteristics (smoking status), and with or without established-comorbidities (diabetes, CKD, hypertension, CVD, and cancer). We further defined four subtypes of central obesity by elevated WHtR and elevated WC and examined changes in prevalence of each subtype of central obesity over time (normal WC and normal WHtR, normal WC and elevated WHtR, elevated WC and normal WHtR, elevated WC and elevated WHtR).
We additionally performed logistic regression to identify the association of central obesity subtypes and prevalence of comorbidities. Logistic regression models were adjusted for socio-demographics (sex, ethnicity, age, education level, PIR), lifestyle characteristics (smoking status), and other included comorbidities. Two-sided p values <0.05 were considered statistically significant. All statistical analyses were completed using R version 4.0.3 software (R Foundation for Statistical Computing, Vienna, Austria) and the Joinpoint Regression Program, Version 4.9.1.0 -April 2022; Statistical Methodology and Applications Branch, Surveillance Research Program, National Cancer Institute (35).
3. Results
3.1. Characteristics of participants
In the analysis on trends in prevalence of elevated WHtR and elevated WC, among 101,316 participants in the NHANES survey from 1999 to 2018, those age < 20 years (n = 46,235), pregnant women (n = 1,442), and participants without data on WHtR or WC (n = 5,790) were excluded. A total of 47,849 participants were included in the trend analysis (Supplementary Figure S1). Over 20 years, the mean (SD) age ranged from 48.4 (17.4) and 51.2 (17.5) years, while the percentage of men varied between 48.7 and 51.3%. The prevalence of comorbidities varied in 11.8 to 21.1% for diabetes, 10.4 to 14.2% for CKD, 39.9 to 46.7% for hypertension, 9.5 to 13.1% for CVD, and 7.9 to 10.1% for cancer (Table 1). To perform the association analyses of subtypes of central obesity with the prevalence of comorbidities, 43,294 participants without missing covariate data were included, with characteristics presented in Supplementary Table S1.
Table 1
| 1999–2000 | 2001–2002 | 2003–2004 | 2005–2006 | 2007–2008 | 2009–2010 | 2011–2012 | 2013–2014 | 2015–2016 | 2017–2018 | Overall | |
|---|---|---|---|---|---|---|---|---|---|---|---|
| 4022 | 4378 | 4254 | 4186 | 5317 | 5632 | 4916 | 5206 | 5050 | 4888 | 47849 | |
| Men, n (%) | 2005 (49.9) | 2199 (50.2) | 2153 (50.6) | 2148 (51.3) | 2635 (49.6) | 2764 (49.1) | 2473 (50.3) | 2533 (48.7) | 2470 (48.9) | 2404 (49.2) | 23784 (49.7) |
| Ethnicity, n(%) | |||||||||||
| Mexican american | 1087 (27.0) | 920 (21.0) | 847 (19.9) | 817 (19.5) | 911 (17.1) | 1,043 (18.5) | 487 (9.9) | 700 (13.4) | 882 (17.5) | 646 (13.2) | 8340 (17.4) |
| Other hispanic | 253 (6.3) | 179 (4.1) | 130 (3.1) | 130 (3.1) | 596 (11.2) | 581 (10.3) | 505 (10.3) | 471 (9.0) | 682 (13.5) | 449 (9.2) | 3976 (8.3) |
| Non-Hispanic White | 1794 (44.6) | 2284 (52.2) | 2257 (53.1) | 2104 (50.3) | 2,93 (46.9) | 2724 (48.4) | 1805 (36.7) | 2230 (42.8) | 1674 (33.1) | 1696 (34.7) | 21061 (44.0) |
| Non-Hispanic Black | 764 (19.0) | 860 (19.6) | 838 (19.7) | 969 (23.1) | 1101 (20.7) | 976 (17.3) | 1284 (26.1) | 1056 (20.3) | 1,050 (20.8) | 1,150 (23.5) | 10,048 (21.0) |
| Other race | 124 (3.1) | 135 (3.1) | 182 (4.3) | 166 (4.0) | 216 (4.1) | 308 (5.5) | 835 (17.0) | 749 (14.4) | 749 (14.4) | 947 (19.4) | 4424 (9.2) |
| Age group, (years) | 50.9 (18.4) | 49.4 (18.2) | 51.0 (19.1) | 49.2 (18.4) | 50.4 (17.6) | 49.4 (17.6) | 48.4 (17.4) | 48.8 (17.2) | 49.3 (17.4) | 51.2 (17.5) | 49.8 (17.9) |
| 20–39 | 1282 (31.9) | 1477 (33.7) | 1380 (32.4) | 1454 (34.7) | 1706 (32.1) | 1864 (33.1) | 1744 (35.5) | 1761 (33.8) | 1705 (33.8) | 1466 (30.0) | 15839 (33.1) |
| 40–59 | 1224 (30.4) | 1491 (34.1) | 1275 (30.0) | 1385 (33.1) | 1739 (32.7) | 1937 (34.4) | 1,659 (33.7) | 1834 (35.2) | 1709 (33.8) | 1577 (32.3) | 15830 (33.1) |
| ≥60 | 1516 (37.7) | 1410 (32.2) | 1599 (37.6) | 1347 (32.2) | 1872 (35.2) | 1831 (32.5) | 1513 (30.8) | 1611 (30.9) | 1,636 (32.4) | 1845 (37.7) | 16180 (33.8) |
| Smoking status, n (%) | |||||||||||
| Never smoker | 2080 (51.7) | 2192 (50.1) | 2098 (49.3) | 2,159 (51.6) | 2773 (52.2) | 3028 (53.8) | 2794 (56.8) | 2930 (56.3) | 2918 (57.8) | 2,817 (57.6) | 25,789 (53.9) |
| Former smoker | 1082 (26.9) | 1152 (26.3) | 1157 (27.2) | 1068 (25.5) | 1322 (24.9) | 1376 (24.4) | 1110 (22.6) | 1202 (23.1) | 1158 (22.9) | 1,170 (23.9) | 11,797 (24.7) |
| Current smoker | 853 (21.2) | 1028 (23.5) | 997 (23.4) | 957 (22.9) | 1216 (22.9) | 1228 (21.8) | 1005 (20.4) | 1073 (20.6) | 966 (19.1) | 901 (18.4) | 10,224 (21.4) |
| Education level, n (%) | |||||||||||
| Less than high school | 1,583 (39.4) | 1307 (29.9) | 1241 (29.2) | 1133 (27.1) | 1643 (30.9) | 1598 (28.4) | 1138 (23.1) | 1105 (21.2) | 1174 (23.2) | 957 (19.6) | 12,879 (26.9) |
| High school graduate | 915 (22.7) | 1,032 (23.6) | 1,076 (25.3) | 1009 (24.1) | 1312 (24.7) | 1298 (23.0) | 1032 (21.0) | 1160 (22.3) | 1097 (21.7) | 1,172 (24.0) | 11,103 (23.2) |
| College or above | 1,524 (37.9) | 2038 (46.6) | 1937 (45.5) | 2044 (48.8) | 2362 (44.4) | 2736 (48.6) | 2746 (55.9) | 2941 (56.5) | 2779 (55.0) | 2,759 (56.4) | 23,866 (49.8) |
| Poverty income ratio, n (%) | |||||||||||
| In poverty (< 1.00) | 694 (17.3) | 674 (15.4) | 722 (17.0) | 662 (15.8) | 1001 (18.8) | 1123 (19.9) | 1129 (23.0) | 1062 (20.4) | 993 (19.7) | 773 (15.8) | 8,833 (18.5) |
| Not in poverty (≥ 1.00) | 2761 (68.6) | 3396 (77.6) | 3286 (77.2) | 3339 (79.8) | 3847 (72.4) | 3983 (69.0) | 3393 (69.0) | 3750 (72.0) | 3566 (70.6) | 3501 (71.6) | 34822 (72.8) |
| Comorbidities, n (%) | |||||||||||
| Diabetes, n (%) | 501 (12.5) | 517 (11.8) | 591 (13.9) | 619 (14.8) | 987 (18.6) | 993 (17.6) | 898 (18.3) | 910 (17.5) | 1007 (19.9) | 1030 (21.1) | 8053 (16.8) |
| Chronic kidney disease, n (%) | 570 (14.2) | 523 (11.9) | 503 (11.8) | 521 (12.4) | 726 (13.7) | 584 (10.4) | 596 (12.1) | 599 (11.5) | 604 (12.0) | 649 (13.3) | 5875 (12.3) |
| Hypertension, n (%) | 1703 (42.3) | 1745 (39.9) | 1882 (44.2) | 1690 (40.4) | 2294 (43.1) | 2295 (40.7) | 2036 (41.4) | 2192 (42.1) | 2139 (42.4) | 2281 (46.7) | 20257 (42.3) |
| Cardiovascular disease, n (%) | 446 (11.1) | 448 (10.2) | 557 (13.1) | 461 (11.0) | 597 (11.2) | 577 (10.2) | 467 (9.5) | 502 (9.6) | 516 (10.2) | 578 (11.8) | 5,149 (10.8) |
| Cancer, n (%) | 318 (7.9) | 405 (9.3) | 401 (9.4) | 357 (8.5) | 514 (9.7) | 562 (10.0) | 402 (8.2) | 492 (9.5) | 479 (9.5) | 494 (10.1) | 4424 (9.2) |
Characteristics of participants in NHANES 1999–2018.
3.2. Trends in prevalence of elevated WHtR and WC
The overall standardized prevalence increased from 74.8 to 82.7% (AAPC 0.6, 95% CI 0.5 to 0.8) for elevated WHtR and from 46.9 to 60.3% (AAPC 1.2, 95% CI 1.0 to 1.5) for elevated WC during 1999–2018 (Figure 1A; Supplementary Table S2). Similar increased trends in elevated WHtR and elevated WC were observed in both sexes, with the significantly more rapid increment of elevated WHtR in women (AAPC 0.9, 95% CI 0.6 to 1.1 versus AAPC 0.4, 95% CI 0.2 to 0.5 in men, p = 0.010) and elevated WC in men (AAPC 1.3, 95% CI 0.9 to 1.8 versus AAPC 1.2, 95% CI 0.9 to 1.5 in women, p < 0.001) (Figure 1B). Compared with women, men had the significantly higher prevalence of elevated WHtR (83.1% versus 72.9%, p < 0.001) (Supplementary Table S2) but lower prevalence of elevated WC (51.4% versus 68.8%, p < 0.001) in 2017–2018 (Supplementary Table S3). Similar increasing trends were observed in all age-groups (Figures 1C,D). Compared with the youngest participants (20–39 years), those aged ≥60 years had the highest prevalence of elevated WHtR (93.7% versus 69.9%) (Supplementary Table S2) and elevated WC (72.5% versus 47.3%) (Supplementary Table S3) in 2017–2018, while the youngest participants (aged 20–39) had the most rapid increment of elevated WC (AAPC 1.8, 95% CI 1.5 to 2.1, Figure 1D).
Figure 1
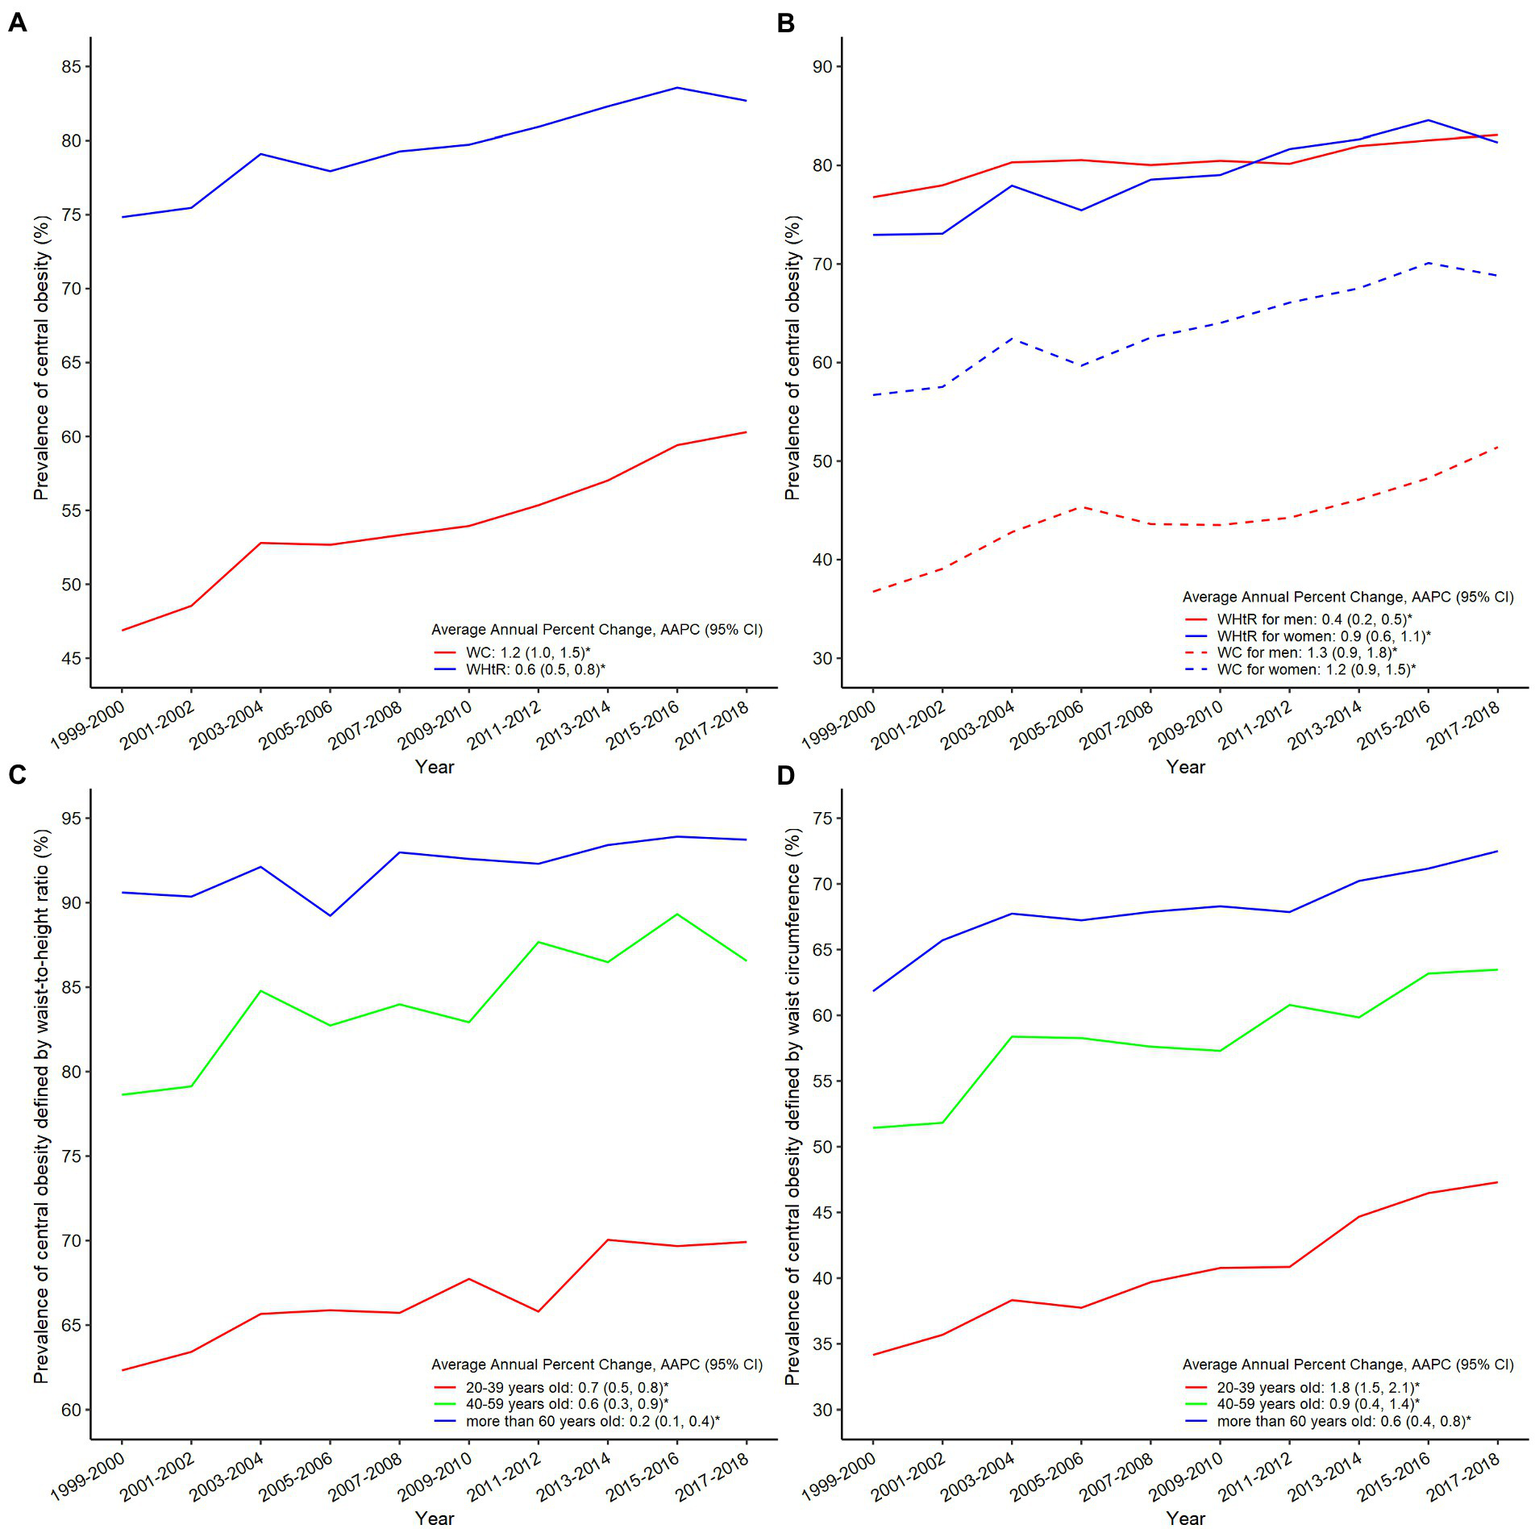
Trends of prevalence of elevated waist-to-height ratio and waist circumference in NHANES 1999–2018 in overall population (A) and when stratified by sex (B); prevalence of elevated WHtR (C) and WC (D) stratified by age.
3.3. Subgroups analyses of trends in elevated WHtR and WC
There were significant variations in trends of elevated WHtR (Figure 2A; Supplementary Table S2) and elevated WC (Figure 2B; Supplementary Table S3) by ethnicity and comorbidities. Mexican American had the highest prevalence of elevated WHtR (91.6%) and elevated WC (65.5%) in 2017–2018 (Figures 2A,B; Supplementary Tables S2, S3). Compared with and without established comorbidities, those with established comorbidities had the highest prevalence of elevated WHtR and elevated WC (97.7% versus 80.0 and 83.0% versus 56.3% for diabetes, and 94.6% versus 81.5 and 73.8% versus 58.9% for CVD, Figures 2C,D and Supplementary Tables S2-S4). The similar patterns of elevated WHtR and elevated WC were also observed by smoke status education, PIR, and other comorbidities such as hypertension, CKD, and cancer (Supplementary Figures S2−S7; Supplementary Tables S2−S4).
Figure 2
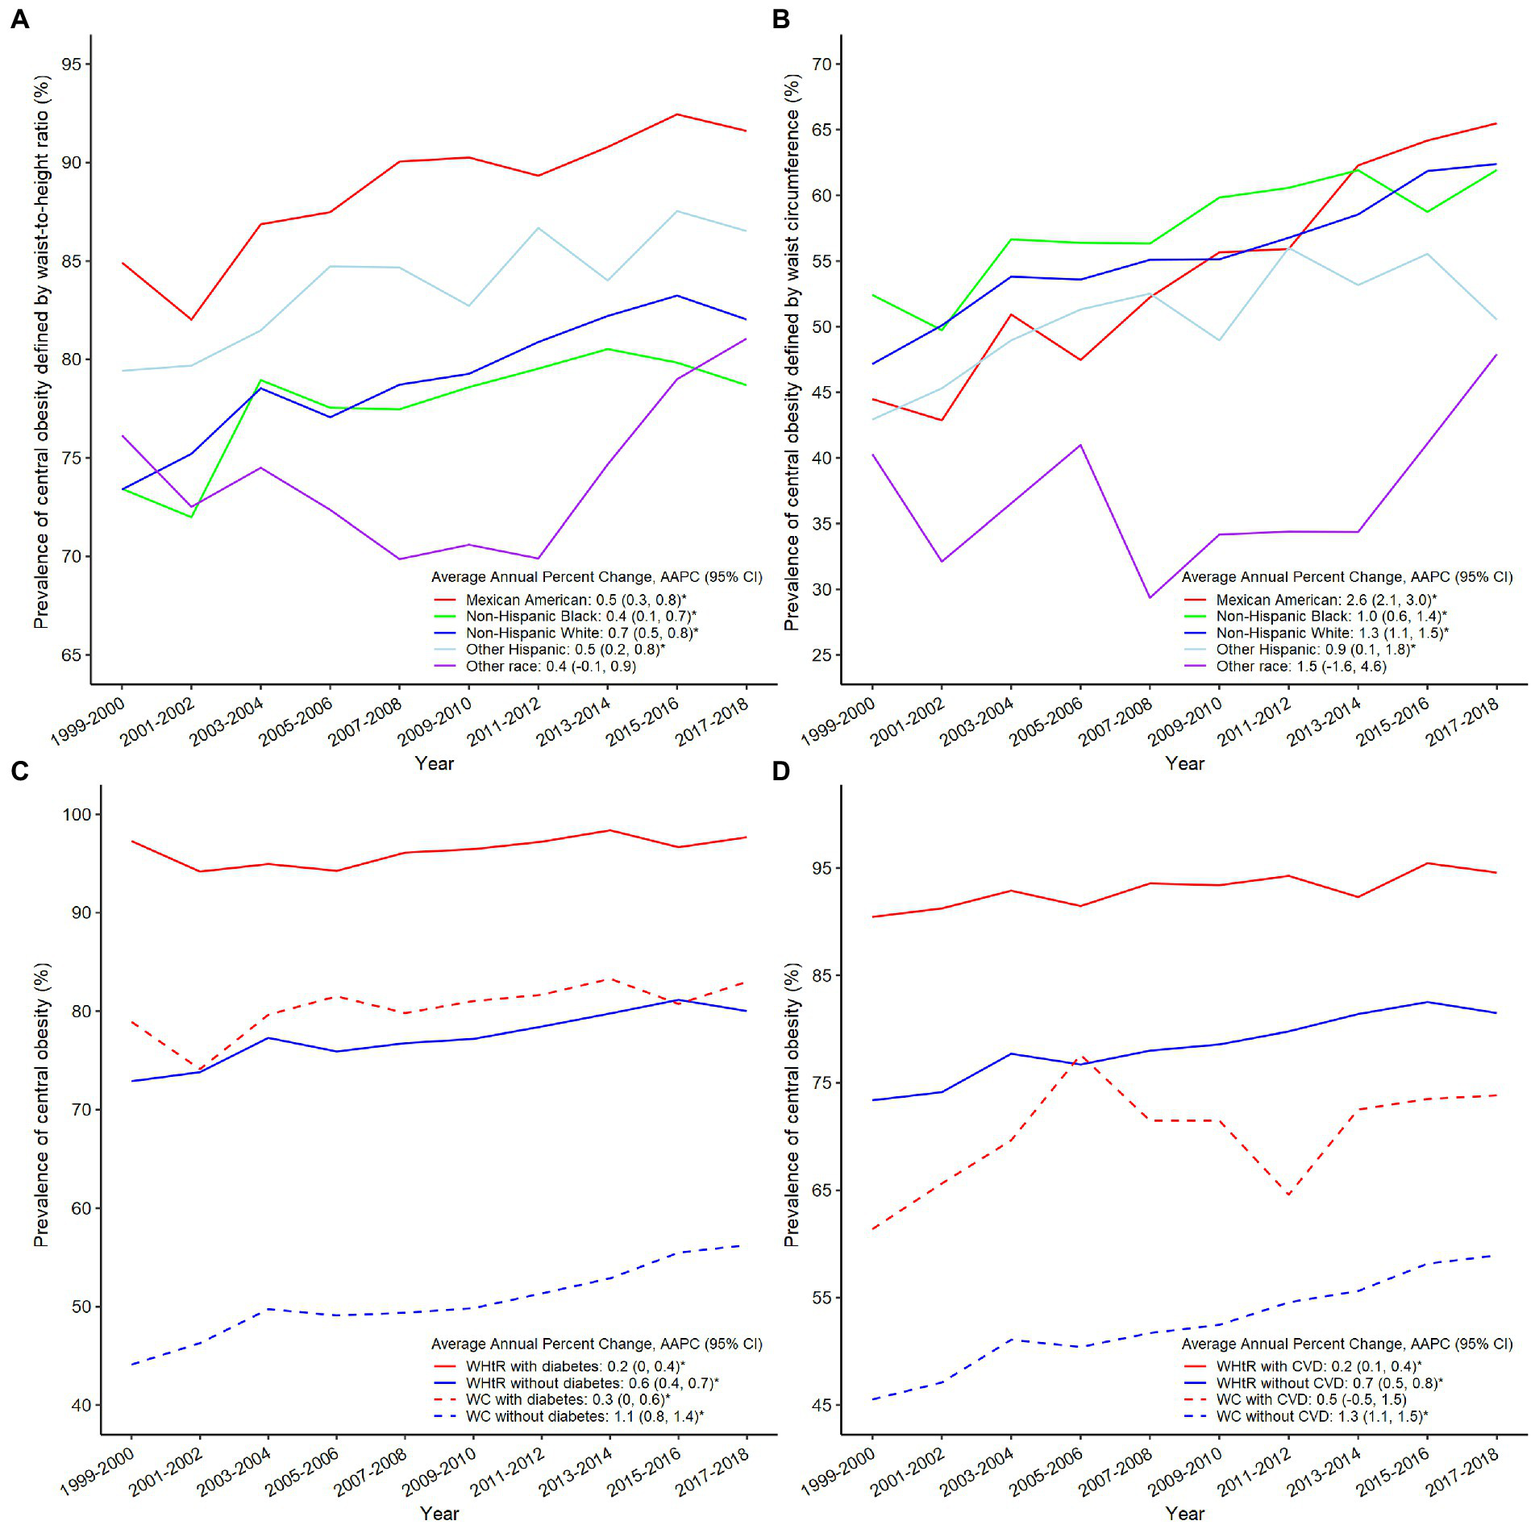
Trends of prevalence of elevated WHtR (A) and WC (B) in NHANES 1999–2018 stratified by ethnicity; prevalence of elevated WHtR and WC stratified by the status of diabetes (C) or CVD (D).
3.4. Trends in prevalence of central obesity subtypes and their associations with comorbidities
From 1999 to 2018, the prevalence of normal WC and normal WHtR decreased from 25.1 to 17.3% (AAPC -2.4, 95% CI -2.9 to -1.9), while the prevalence of elevated WHtR and elevated WC increased from 46.8 to 60.3% (AAPC 1.2, 95% CI 1.0 to 1.5). The prevalence of elevated WHtR and normal WC decreased from 28.0 to 22.4% (AAPC -0.8, 95% CI -1.2 to -0.3, Figure 3A and Supplementary Table S5). Compared with participants with normal WHtR and normal WC, those with elevated WHtR and normal WC had higher odds of diabetes (OR 2.06, 95% CI 1.66 to 2.55), hypertension (OR 1.75, 95% CI 1.58 to 1.93) and CVD (OR 1.32, 95% CI 1.11 to 1.57) after adjusting for potential risk factors (Figure 3B). The highest odds of these comorbidities were observed in participants with elevated WHtR and elevated WC. Effect estimates were not shown for adults with normal WHtR and elevated WC due to small sample size (n = 15).
Figure 3
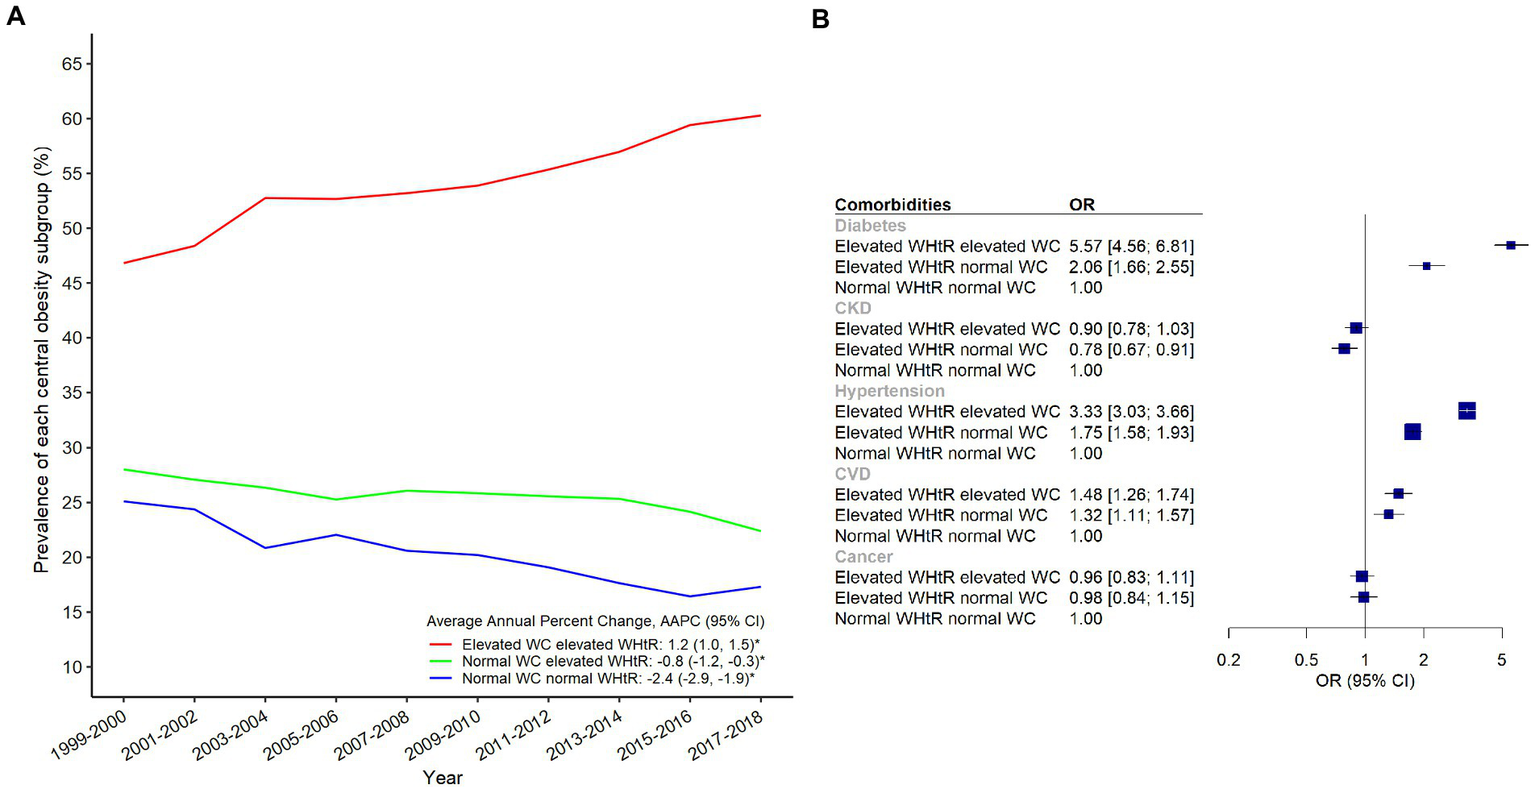
Trends of prevalence of each central obesity subgroup in NHANES 1999–2018 (A) and the forest plot of the associations between central obesity subgroups and comorbidities (B).
4. Discussion
In 1999–2018 among the American adults, the prevalence of central obesity (elevated WHtR and elevated WC) increased across various subgroups by socio-demographics, lifestyle, and comorbidity status. An estimated 22 to 28% of adults had normal WC but elevated WHtR, and these individuals had 1.3 to 2.1 times higher odds of diabetes, hypertension, and CVD. Men, older adults, former smokers, and people with lower education levels were more likely to have elevated WHtR and/or WC.
The variation in central obesity prevalence by sex, age, smoking status and socioeconomic status were in generally consistent with the relationship suggested from previous literature. The increased rate of elevated WHtR and WC among women can be explained by the levels of physical activity and the role of sex hormones on adipose tissue lipolysis (36). Moreover, the dysfunction of adipose tissue and accumulated inflammation related with aging, may explain the linkage between older age and a higher likelihood of central obesity (37). For the relationship between smoking status and obesity, previous literature suggested that the increase in resting metabolic rate due to acute effect of nicotine (38), which may explain the lower rate of elevated WHtR and WC among current smokers. Along with the reduction of nicotine intake, it is likely that individuals resumed normal appetite and increased energy intake after quitting smoking, leading to temporary weight gain (39). However, the present study only examined the cross-sectional variation between smoking status and the rate of central obesity, therefore how the duration of smoking cessation might impact obesity has not been evaluated. For the ethnic differences in obesity rate, disparities between Mexican Americans and non-Hispanic white Americans have also been observed in the systematic review of the trend of BMI-classified obesity in NHANES population (40), which may be related to the weight misperception and lower intention to try weight loss (41, 42). In the same review, it is also found a short leveling-off of BMI-classified obesity between 2009 and 2012 (40), which also agrees with our present analysis using WHtR as adiposity indicator. However, the reason behind warrants further investigation. For the variation of central obesity by education levels, the reasons behind can be limited health literacy, fewer socioeconomic resources to purchase healthier dietary options, and fewer social support (43). Although the observed associations may not be fully consistent with previous literature, the present study has indicated the at-risk population for more efforts on obesity prevention and management. Furthermore, based on the findings from Joinpoint regression model, the prevalence of elevated WHtR and WC increased consistent across subgroups, and the disparities did not attenuate with time. This is also another alarming sign in controlling the obesity pandemic.
Another major finding of the present study is to quantify the proportion of individuals with central obesity but being masked by having normal WC, which may reveal a subgroup of population with overlooked risk for cardiometabolic diseases. From the logistic regression, people with diabetes, hypertension and CVD were positively associated with the odds of having elevated WHtR and WC, which was consistent with previous meta-analysis and NHANES analysis (3, 7), suggesting that WHtR may be a better screening tool than WC in identifying participants with diabetes risk. Although WC is an established indicator for assessing central obesity (≥ 102 cm for men and ≥ 88 cm for women), it has not accounted for the variation in body height. For people with different heights, the proportion of abdominal fat reflected by waist circumference may differ. In other words, the use of WC in screening may miss out individuals with WHtR≥0.5 but having smaller body size, i.e., men with height lower than 204 cm and women with height lower than 176 cm. From the logistic regression, people with elevated WHtR but normal WC were more likely to suffer from diabetes, hypertension, and CVD, especially for diabetes, despite having normal WC. This observation has provided evidence to support that WHtR may be a better screening tool than WC in identifying participants with diabetes, hypertension, and CVD risk. Apart from the surveillance of elevated WHtR in national samples, incorporating WHtR into routine clinical screening, and potentially the risk algorithm of calculating cardiometabolic risk becomes necessary. WHtR can be easily derived from the data of BMI and WC and is convenient to measure and interpret (5). This great advantage in practice allows quick identification of individuals with cardio-metabolic risk.
The main strength of this study is the use of nationally representative NHANES data, which provides an estimate of national prevalence in elevated WHtR and WC, as well as the high-risk population being masked by having normal WC. The NHANES anthropometry measurement data analyzed in this study was of exceptional quality. To maintain accuracy and comparability over time, NHANES has established standardized examination procedures for measuring height and waist circumference. These procedures entail specific techniques for taking measurements and necessitate equipment calibration. While equipment and techniques for measuring height and waist circumference have undergone minor improvements, the objective has been to enhance accuracy and reduce measurement error, as outlined in the Methods section. This study has several limitations. First, anthropometric data were only collected at single time point and the individual trajectory of adiposity indicators were not examined. Second, we were not able to establish a causal relationship between WHtR, WC and long-term risk of chronic disease due to the repeated cross-sectional design. Third, the history of comorbidities was self-reported, and the prevalence of comorbidities may be underestimated in this study.
5. Conclusion
The overall prevalence of elevated WHtR (82.7%) and WC (60.3%) was high among U.S. adults, and there was a significant increasing trend in 1999–2018, with consistent patterns by socio-demographics, lifestyle, and comorbidity status. Women, older adults, former smokers, people with lower education levels and comorbidities were more likely to have elevated WHtR. The present study also indicated that people with elevated WHtR but with normal WC had a higher likelihood of having diabetes, hypertension, and CVD.
Funding
KL was supported by Funding for Research Institutes (grant number: CD69), Undergraduate Research and Innovation Scheme (grant number: TAAU) and Start-up Fund for RAPs under the Strategic Hiring Scheme (grant number: BD8H). The funders had no role in study design, data collection and analysis, decision to publish, or preparation of the manuscript.
Publisher’s note
All claims expressed in this article are solely those of the authors and do not necessarily represent those of their affiliated organizations, or those of the publisher, the editors and the reviewers. Any product that may be evaluated in this article, or claim that may be made by its manufacturer, is not guaranteed or endorsed by the publisher.
Statements
Data availability statement
Publicly available datasets were analyzed in this study. This data can be found at: https://wwwn.cdc.gov/nchs/nhanes/Default.aspx.
Author contributions
AY and KL designed the research and revised the manuscript critically. BY and JY conducted statistical analysis and led the writing of the manuscript. BY, JY, MW, JR, VC, MK, and KL drafted the manuscript. All authors contributed to the interpretation of the results and critical revision of the manuscript for important intellectual content and approved the final version of the manuscript.
Conflict of interest
The authors declare that the research was conducted in the absence of any commercial or financial relationships that could be construed as a potential conflict of interest.
Supplementary material
The Supplementary material for this article can be found online at: https://www.frontiersin.org/articles/10.3389/fnut.2023.1124468/full#supplementary-material
References
1.
StaimezLRWeiMYKimMNarayanKMVSaydahSH. Multimorbidity of four cardiometabolic and chronic pulmonary disease groups: prevalence and attributable fraction in US adults, 2007-2012. J Comorb. (2017) 7:22–32. doi: 10.15256/joc.2017.7.89
2.
SungHFerlayJSiegelRLLaversanneMSoerjomataramIJemalAet al. Global cancer statistics 2020: GLOBOCAN estimates of incidence and mortality worldwide for 36 cancers in 185 countries. CA Cancer J Clin. (2021) 71:209–49. doi: 10.3322/caac.21660
3.
AshwellMGunnPGibsonS. Waist-to-height ratio is a better screening tool than waist circumference and BMI for adult cardiometabolic risk factors: systematic review and meta-analysis. Obes Rev. (2012) 13:275–86. doi: 10.1111/j.1467-789X.2011.00952.x
4.
AshwellMHsiehSD. Six reasons why the waist-to-height ratio is a rapid and effective global indicator for health risks of obesity and how its use could simplify the international public health message on obesity. Int J Food Sci Nutr. (2005) 56:303–7. doi: 10.1080/09637480500195066
5.
LoKWongMKhalechelvamPTamW. Waist-to-height ratio, body mass index and waist circumference for screening paediatric cardio-metabolic risk factors: a meta-analysis. Obes Rev. (2016) 17:1258–75. doi: 10.1111/obr.12456
6.
LiuJTseLALiuZRangarajanSHuBYinLet al. Predictive values of anthropometric measurements for Cardiometabolic risk factors and cardiovascular diseases among 44 048 Chinese. J Am Heart Assoc. (2019) 8:e010870. doi: 10.1161/JAHA.118.010870
7.
LoKHuangYQShenGHuangJYLiuLYuYLet al. Effects of waist to height ratio, waist circumference, body mass index on the risk of chronic diseases, all-cause, cardiovascular and cancer mortality. Postgrad Med J. (2021) 97:306–11. doi: 10.1136/postgradmedj-2020-137542
8.
CerhanJRMooreSCJacobsEJKitaharaCMRosenbergPSAdamiHOet al. A pooled analysis of waist circumference and mortality in 650,000 adults. Mayo Clin Proc. (2014) 89:335–45. doi: 10.1016/j.mayocp.2013.11.011
9.
CzernichowSKengneAPStamatakisEHamerMBattyGD. Body mass index, waist circumference and waist-hip ratio: which is the better discriminator of cardiovascular disease mortality risk?: evidence from an individual-participant meta-analysis of 82 864 participants from nine cohort studies. Obes Rev. (2011) 12:680–7. doi: 10.1111/j.1467-789X.2011.00879.x
10.
ZhangCRexrodeKMvan DamRMLiTYHuFB. Abdominal obesity and the risk of all-cause, cardiovascular, and cancer mortality: sixteen years of follow-up in US women. Circulation. (2008) 117:1658–67. doi: 10.1161/CIRCULATIONAHA.107.739714
11.
BarberioAMAlareekiAVinerBPaderJVenaJEAroraPet al. Central body fatness is a stronger predictor of cancer risk than overall body size. Nat Commun. (2019) 10:383. doi: 10.1038/s41467-018-08159-w
12.
KodamaSHorikawaCFujiharaKHeianzaYHirasawaRYachiYet al. Comparisons of the strength of associations with future type 2 diabetes risk among anthropometric obesity indicators, including waist-to-height ratio: a meta-analysis. Am J Epidemiol. (2012) 176:959–69. doi: 10.1093/aje/kws172
13.
TatsumiYWatanabeMKokuboYNishimuraKHigashiyamaAOkamuraTet al. Effect of age on the association between waist-to-height ratio and incidence of cardiovascular disease: the Suita study. J Epidemiol. (2013) 23:351–9. doi: 10.2188/jea.JE20130004
14.
PangYKartsonakiCGuoYChenYYangLBianZet al. Central adiposity in relation to risk of liver cancer in Chinese adults: a prospective study of 0.5 million people. Int J Cancer. (2019) 145:1245–53. doi: 10.1002/ijc.32148
15.
LoKLiuQAllisonMFengYQChanKPhillipsLet al. Prospective associations of waist-to-height ratio with cardiovascular events in postmenopausal women: results from the Women's Health Initiative. Diabetes Care. (2019) 42:e148–9. doi: 10.2337/dc19-0612
16.
HardyLLJinKMihrshahiSDingD. Trends in overweight, obesity, and waist-to-height ratio among Australian children from linguistically diverse backgrounds, 1997 to 2015. Int J Obes. (2019) 43:116–24. doi: 10.1038/s41366-018-0139-5
17.
LongZHuangLLyuJXiaYChenYLiRet al. Trends of central obesity and associations with nutrients intake and daily behaviors among women of childbearing age in China. BMC Womens Health. (2022) 22:12. doi: 10.1186/s12905-022-01600-9
18.
QianXSuCZhangBQinGWangHWuZ. Changes in distributions of waist circumference, waist-to-hip ratio and waist-to-height ratio over an 18-year period among Chinese adults: a longitudinal study using quantile regression. BMC Public Health. (2019) 19:700. doi: 10.1186/s12889-019-6927-6
19.
LiuXChenYBoucherNLRothbergAE. Prevalence and change of central obesity among US Asian adults: NHANES 2011-2014. BMC Public Health. (2017) 17:678. doi: 10.1186/s12889-017-4689-6
20.
LiuBDuYWuYSnetselaarLGWallaceRBBaoW. Trends in obesity and adiposity measures by race or ethnicity among adults in the United States 2011-18: population based study. BMJ. (2021) 372:n365. doi: 10.1136/bmj.n365
21.
SongPLiXBuYDingSZhaiDWangEet al. Temporal trends in normal weight central obesity and its associations with cardiometabolic risk among Chinese adults. Sci Rep. (2019) 9:5411. doi: 10.1038/s41598-019-41986-5
22.
ShirasawaTOchiaiHYoshimotoTNagahamaSKobayashiMOhtsuIet al. Associations between normal weight central obesity and cardiovascular disease risk factors in Japanese middle-aged adults: a cross-sectional study. J Health Popul Nutr. (2019) 38:46. doi: 10.1186/s41043-019-0201-5
23.
SunYLiuBSnetselaarLGWallaceRBCaanBJRohanTEet al. Association of Normal-Weight Central Obesity with all-Cause and Cause-Specific Mortality among Postmenopausal Women. JAMA Netw Open. (2019) 2:e197337. doi: 10.1001/jamanetworkopen.2019.7337
24.
Centers-for-Disease-Control-and-Prevention. National Health and Nutrition Examination survey (NHANES): Anthropometry Procedures Manual. Hyattsville, MD: United States Department of Health and Human Services; (2016). p. 2015–2016.
25.
BrowningLMHsiehSDAshwellM. A systematic review of waist-to-height ratio as a screening tool for the prediction of cardiovascular disease and diabetes: 0.5 could be a suitable global boundary value. Nutr Res Rev. (2010) 23:247–69. doi: 10.1017/S0954422410000144
26.
World Health Organization. Waist circumference and waist-hip ratio: report of a WHO expert consultation, Geneva, 8-11 December 2008. World Health Organization. (2011). Available at: https://apps.who.int/iris/handle/10665/44583
27.
YangJYangAChengNHuangWHuangPLiuNet al. Sex-specific associations of blood and urinary manganese levels with glucose levels, insulin resistance and kidney function in US adults: national health and nutrition examination survey 2011-2016. Chemosphere. (2020) 258:126940. doi: 10.1016/j.chemosphere.2020.126940
28.
TyrrellJMelzerDHenleyWGallowayTSOsborneNJ. Associations between socioeconomic status and environmental toxicant concentrations in adults in the USA: NHANES 2001-2010. Environ Int. (2013) 59:328–35. doi: 10.1016/j.envint.2013.06.017
29.
American Diabetes Association. 2. Classification and diagnosis of diabetes: standards of medical Care in Diabetes-2021. Diabetes Care. (2021) 44:S15–33. doi: 10.2337/dc21-S002
30.
LeveyASde JongPECoreshJel NahasMAstorBCMatsushitaKet al. The definition, classification, and prognosis of chronic kidney disease: a KDIGO controversies conference report. Kidney Int. (2011) 80:17–28. doi: 10.1038/ki.2010.483
31.
WilliamsBManciaGSpieringWAgabiti RoseiEAziziMBurnierMet al. 2018 ESC/ESH guidelines for the management of arterial hypertension. Eur Heart J. (2018) 39:3021–104. doi: 10.1093/eurheartj/ehy339
32.
KaczmarskiKRSozioSMChenJSangYShafiT. Resistant hypertension and cardiovascular disease mortality in the US: results from the National Health and nutrition examination survey (NHANES). BMC Nephrol. (2019) 20:138. doi: 10.1186/s12882-019-1315-0
33.
YangAWuHLauESHMaRCWKongAPSSoWYet al. Trends in glucose-lowering drug use, glycemic control, and severe hypoglycemia in adults with diabetes in Hong Kong, 2002-2016. Diabetes Care. (2020) 43:2967–74. doi: 10.2337/dc20-0260
34.
YangAWuHLauESHZhangXShiMFanBet al. Glucose-lowering drug use, glycemic outcomes, and severe hypoglycemia: 18-year trends in 0.9 million adults with diabetes in Hong Kong (2002-2019). Lancet Reg Health West Pac. (2022) 26:100509. doi: 10.1016/j.lanwpc.2022.100572
35.
KimHJFayMPFeuerEJMidthuneDN. Permutation tests for joinpoint regression with applications to cancer rates. Stat Med. (2000) 19:335–51. doi: 10.1002/(SICI)1097-0258(20000215)19:3<335::AID-SIM336>3.0.CO;2-Z
36.
LovejoyJCSainsburyAthe Stock Conference 2008 Working Group G. Sex differences in obesity and the regulation of energy homeostasis. Obes Rev. (2009) 10:154–67. doi: 10.1111/j.1467-789X.2008.00529.x
37.
PerezLMPareja-GaleanoHSanchis-GomarFEmanueleELuciaAGalvezBG. 'Adipaging': ageing and obesity share biological hallmarks related to a dysfunctional adipose tissue. J Physiol. (2016) 594:3187–207. doi: 10.1113/JP271691
38.
PerkinsKAEpsteinLHStillerRLMarksBLJacobRG. Acute effects of nicotine on resting metabolic rate in cigarette smokers. Am J Clin Nutr. (1989) 50:545–50. doi: 10.1093/ajcn/50.3.545
39.
DareSMackayDFPellJP. Relationship between smoking and obesity: a cross-sectional study of 499,504 middle-aged adults in the UK general population. PLoS One. (2015) 10:e0123579. doi: 10.1371/journal.pone.0123579
40.
MinJGoodaleHXueHBreyRWangY. Racial-ethnic disparities in obesity and biological, behavioral, and sociocultural influences in the United States: a systematic review. Adv Nutr. (2021) 12:1137–48. doi: 10.1093/advances/nmaa162
41.
DorseyRREberhardtMSOgdenCL. Racial/ethnic differences in weight perception. Obesity (Silver Spring). (2009) 17:790–5. doi: 10.1038/oby.2008.603
42.
MarquezBMurilloR. Racial/ethnic differences in weight-loss strategies among US adults: National Health and nutrition examination survey 2007-2012. J Acad Nutr Diet. (2017) 117:923–8. doi: 10.1016/j.jand.2017.01.025
43.
ChaeWRSchienkiewitzADuYHapkeUOtteCMichalskiN. Comorbid depression and obesity among adults in Germany: effects of age, sex, and socioeconomic status. J Affect Disord. (2022) 299:383–92. doi: 10.1016/j.jad.2021.12.025
Summary
Keywords
waist-to-height ratio, waist circumference, prevalence, trend analysis, NHANES
Citation
Yang B, Yang J, Wong MM-h, Rana J, Yang Q, Chan V, Khan MS, Yang A and Lo K (2023) Trends in elevated waist-to-height ratio and waist circumference in U.S. adults and their associations with cardiometabolic diseases and cancer, 1999–2018. Front. Nutr. 10:1124468. doi: 10.3389/fnut.2023.1124468
Received
15 December 2022
Accepted
22 March 2023
Published
11 April 2023
Volume
10 - 2023
Edited by
Abraham Wall-Medrano, Universidad Autónoma de Ciudad Juárez, Mexico
Reviewed by
Shelly R. McFarlane, University of the West Indies, Mona, Jamaica; Hsin-Jen Chen, National Yang Ming Chiao Tung University, Taiwan
Updates
Copyright
© 2023 Yang, Yang, Wong, Rana, Yang, Chan, Khan, Yang and Lo.
This is an open-access article distributed under the terms of the Creative Commons Attribution License (CC BY). The use, distribution or reproduction in other forums is permitted, provided the original author(s) and the copyright owner(s) are credited and that the original publication in this journal is cited, in accordance with accepted academic practice. No use, distribution or reproduction is permitted which does not comply with these terms.
*Correspondence: Aimin Yang, aiminyang@cuhk.edu.hkKenneth Lo, kenneth.kh.lo@polyu.edu.hk
†These authors have contributed equally to this work
This article was submitted to Nutrition and Metabolism, a section of the journal Frontiers in Nutrition
Disclaimer
All claims expressed in this article are solely those of the authors and do not necessarily represent those of their affiliated organizations, or those of the publisher, the editors and the reviewers. Any product that may be evaluated in this article or claim that may be made by its manufacturer is not guaranteed or endorsed by the publisher.