Abstract
Introduction:
Thiopurines, azathiopurine (AZA) and mercaptopurine (6-MP) have been regularly used in the treatment of inflammatory bowel disease (IBD). Despite optimized dosage adjustment based on the NUDT15 genotypes, some patients still discontinue or change treatment regimens due to thiopurine-induced leukopenia.
Methods:
We proposed a prospective observational study of lipidomics to reveal the lipids perturbations associated with thiopurine-induced leukopenia. One hundred and twenty-seven IBD participants treated with thiopurine were enrolled, twenty-seven of which have developed thiopurine-induced leucopenia. Plasma lipid profiles were measured using Ultra-High-Performance Liquid Chromatography-Tandem Q-Exactive. Lipidomic alterations were validated with an independent validation cohort (leukopenia n = 26, non-leukopenia n = 74).
Results:
Using univariate and multivariate analysis, there were 16 lipid species from four lipid classes, triglyceride (n = 11), sphingomyelin (n = 1), phosphatidylcholine (n = 1) and lactosylceramide (n = 3) identified. Based on machine learning feature reduction and variable screening strategies, the random forest algorithm established by six lipids showed an excellent performance to distinguish the leukopenia group from the normal group, with a model accuracy of 95.28% (discovery cohort), 79.00% (validation cohort) and an area under the receiver operating characteristic (ROC) curve (ROC-AUC) of 0.9989 (discovery cohort), 0.8098 (validation cohort).
Discussion:
Our novel findings suggested that lipidomic provided unique insights into formulating individualized medication strategies for thiopurines in IBD patients.
1. Introduction
Inflammatory bowel disease (IBD), including Crohn's disease (CD) and ulcerative colitis (UC), is characterized by chronic and relapsing intestinal inflammation (1). The incidence of IBD is accelerating due to more Westernized societies in China (1, 2). IBD is affecting millions of people worldwide, and IBD-related healthcare costs have increased significantly (3, 4).
Thiopurines, AZA and 6-MP, have been conventionally used to maintain remission as steroid-sparing agents in IBD patients (5–8). However, 10–30% of patients discontinue therapy due to adverse events (8–10). The most frequent and severe adverse event is leukopenia (thiopurine-induced leukopenia, TIL), especially in Asian populations (11, 12). The Clinical Pharmacogenetics Implementation Consortium has developed guidelines for guiding thiopurine drug dosing based on TPMT and NUDT15 genotypes (13). Thiopurine methyltransferase (TPMT), as a biomarker of thiopurine drug toxicity, effectively solves the problem of leukopenia in European and American populations. However, the mutation rate of TPMT in Asian populations is extremely low (~1%) and cannot effectively guide the dosing regimen for the Asian population (14, 15). The nucleic acid oxidation inhibitor gene (NUDT15) in Asian populations plays a vital role in TIL (16–19). The loss-of-function allele in the NUDT15 gene, which is mutated at a high frequency in Asians, decreases the degradation of active thiopurine nucleotide metabolites and leads to leukopenia (13). Thiopurines are not recommended as a treatment option in patients with NUDT15 TT because leukopenia is certain to occur in this patient (12). Although our previous prospective, randomized, controlled trial confirmed that dose optimization according to NUDT15 C415T could reduce the incidence of TIL, without significantly affecting efficacy (5), there were still 23.7% of patients developed thiopurine-induced leucopenia (5). It is noted that drug metabolism including the active product 6TGN and metabolic enzyme genotype TPMT/NUDT15 can only partially explain the TIL. Thus, it is worthwhile to investigate whether other non-drug metabolic influences exist or not.
Untargeted metabolomics is a flourishing unbiased approach for the systematic and global analysis of small molecule metabolites in biological systems (20–22). Lipidomic is a large branch of metabolomics aimed at studying how lipid metabolism is perturbed by biological stimuli and has been extensively applied to capture total lipids in the body (23, 24). Lipids are an important class of compounds widely found in living organisms and play a key role in a range of life activities. As early as 1979, studies have found that compared with normal mature neutrophils, the lipid composition of acute lymphoblastic leukemia cells was changed, with a decrease in total cholesterol and cholesterol–phospholipid ratio and an increase in the percentage of unsaturated fatty acids. Such lipid changes may be the same as normal immature myeloid cells (25). Several studies have shown extensive changes in the plasma (26) and bone marrow (27) lipid profiling of acute lymphoblastic leukemia patients. Recently, studies have also found that hypertriglyceridemia is a risk factor for early death in acute promyelocytic leukemia (28). Yu et al. found that UC patients often had an imbalance in lipid homeostasis, in which triglycerides and phosphatidylcholine were significantly reduced (29). Lipidomic has been universally used to understand the pathogenesis of IBD and diseases of the blood system (1, 30) and has shown potential for the classification of disease subtypes and assessment of therapeutic response (1, 31). However, no lipidomic studies on TIL in IBD patients have been reported. Therefore, we proposed this exploratory study to analyze the plasma lipidomic profile in Chinese IBD patients prescribed thiopurines after NUDT15 genetic screening. The identified biomarkers were validated in an independent validation cohort. We established a random forest (RF) model based on six lipids that could well distinguish leukopenia patients from non-leukopenia patients.
2. Material and methods
2.1. Chemicals and reagents
HPLC grade acetonitrile (ACN) and methanol (MeOH) were obtained from Fisher Scientific (Fair Lawn, NJ, USA), and 2-propanol (IPA, LC-MS grade) was purchased from Merck (Darmstadt, Germany). Methyl tert-butyl ether (MTBE, HPLC grade) and ammonium acetate (AmAc) were purchased from Sigma–Aldrich (St. Louis, MO. USA). Ultrapure water (18.2 MΩ cm at 25°C) was obtained from a Millipore Direct-®Q ultrapure water system (Billerica, MA, USA).
2.2. Patient recruitment and study design
This is a prospective observational trial. The study was conducted at the Sixth Affiliated Hospital of Sun Yat-sen University. This center has a large number of IBD patients from different regions of China. The study was approved by the Clinical Research Ethics Committee of the Sixth Affiliated Hospital of Sun Yat-sen University and was registered at http://www.chictr.org.cn/ (ChiCTR2100050295).
Patients were recruited between 1 July 2018 and 31 January 2022. Only those patients between the ages of 14 and 75 years with a definite diagnosis of IBD who opted for thiopurine therapy were included. The diagnosis of IBD was based on endoscopic, clinical, radiological, histopathological, and/or surgical findings according to current guidelines (7). Disease location and behavior were categorized in the light of the Montreal classification. The exclusion criteria included patients with NUDT15 C415T homozygotes (TT genotype), administration of methotrexate or cyclosporine; insufficient function of the heart, liver, or kidney; pregnancy; and blood transfusion and active infection. Dose reduction could be applied to patients who developed adverse events, for example, leukopenia [white blood cell count (WBC) <3.5 × 10⁹/L], rash, hepatotoxicity, flu-like symptoms, gastric intolerance, pancreatitis, or others. If the laboratory abnormalities do not subside, the treatment will be discontinued.
NUDT15 C415T genotyping for each patient was conducted by Guangzhou KingMed Diagnostics Group Co., Ltd. For wild-type carrier (CC) patients, an initial dose of 1.0 mg/kg per day for AZA or 0.5 mg/kg per day for MP was gradually increased to a target dose of 2.0 mg/kg or 1.0 mg/kg, respectively. The dose was halved for those carrying the CT genotype. Usually, blood samples were taken on routine follow-up with the examination of complete blood cell count and Comprehensive Metabolic Panel, when patients were fasting. Sometimes the blood samples were taken for further consultation when patients were not required to be fasting. In general, 5 ml of venous blood samples (EDTA anticoagulation) were collected at the onset of leukopenia or at least 4 weeks after stable dosing.
2.3. Sample preparation
Approximately 300 μL of cold MeOH was added to 40 μL of plasma sample followed by the addition of 1 mL of MTBE and vortex mixing (10 s before and after adding MTBE). After vibrating the mixture for 15 min and the addition of 300 μL H2O, a two-phase system was formed. Subsequently, the mixture was equilibrated on ice for 10 min followed by centrifugation at 15,000 rpm under 4°C. Approximately 400 μL of supernatant was lyophilized and stored at −80°C for LC-MS/MS analysis. To ensure the repeatability of the assay, QC samples were prepared the same as the test sample for analyses as well.
2.4. UPLC-QExcative/MS data acquisition
A Thermo Scientific Dionex Ultimate 3000 UPLC-ESI-Q Exactive system was used for untargeted lipidomic in full MS/ddMS2 modes. After sample randomization, freeze-dried samples were reconstituted in ACN/IPA/H2O (65:30:5, v/v/v/) containing 5 mM AmAc, and 10 μL was injected in the Waters Acquity BEH C18 column (100 mm × 2.1 mm, 1.7 μm) coupled to an Acquity UPLC BEH C18 1.7 μm VanGuard pre-column (5 mm × 2.1 mm) for both positive ion mode and negative ion mode. Mobile phases A and B were ACN/H2O (60:40, v/v) and IPA/ACN (90:10, v/v), respectively, both containing 10 mM AmAc. The linear elution gradient started with 68% A and held for 1.5 min, then linearly reduced to 15% at 15.5 min, and then to 3% A at 15.6 min, and kept for 2.4 min. The gradient was returned to 68% A at 18.1 min and was maintained for 1.9 min to equilibrate the column. The flow rate was 0.26 mL/min. The column temperature was set at 55°C, and the temperature of the sampler was set at 8°C.
MS was performed with a heated ESI source in positive and negative modes, respectively. The spray voltage was set to 3.5 KV in the positive mode and 3.0 kV in the negative mode. Nitrogen was used as sheath gas and auxiliary gas and was set to 45 and 10 arbitrary units, respectively. The ion transfer capillary temperature was set at 300°C. Full-MS scan and data-dependent MS/MS (ddMS2) have resolutions of 70,000 and 17,500, respectively. The AGC target was 3 × 10⁶ ions capacity in the full-MS scan, and their value was 1 × 10⁵ ions capacity in ddMS2. The maximum IT was 100 ms in the Full-MS scan, and the value in ddMS2 was 50 ms. The TopN (N, the number of top most abundant ions for fragmentation) was 15. To capture as much informative MS/MS data as possible, three normalized collision energies (NCE) were set to 25, 35, and 45 eV in both positive and negative modes. MS data were acquired in the scan range of m/z 133.4–2,000.
2.5. Data processing and statistical analysis
Lipidomic data processing was done using lipid search software (Thermo Scientific, San Jose, CA, United States) according to our previous report (32). Then, a normalization approach (systematic error removal using random forest, SERRF) based on using quality control pool samples was performed (33). R package muma (34) was used for univariate and multivariate statistical analysis, and Shapiro–Wilk's test for normality was performed for each variable (lipid species). If the variable fits a normally distributed, then Welch's t-test was performed; otherwise, Wilcoxon–Mann–Whitney U-test was performed (35). The fold change (FC) of each variable between the two groups was also calculated. A p-value of < 0.05 was considered to be statistically significant.
2.6. Differential lipid species screening and pathway analysis
Principal component analysis (PCA) and orthogonal partial least squares-discriminant analysis (OPLS-DA) were performed using SIMCA-P software (version 13.0; Umetrics, Kinnelon, NJ, United States). PCA was used to identify the data in an unsupervised state to investigate the clustering within each group. OPLS-DA was used to analyze the data under supervised conditions to observe the separation of data between groups. Variable importance in projection (VIP) values was employed to filter variables from the OPLS-DA model. Molecular features with VIP > 1.0, fold change of >1.2 or <0.8333, and a p-value of < 0.05 were considered to be potential differential lipid species. Network analysis with potential differential lipid subclass and visualization of metabolic pathways was achieved by Metscape running on Cytoscape 3.7.2.
2.7. Model construction for biomarker discovery
Least Absolute Shrinkage and Selection Operator (LASSO)-based variable selection was performed using the Python package “sklearn” and R package “glmnet.” “Sklearn” was used for 50 times LASSO, counts the frequency of non-zero variables in 50 LASSO, and sorts them from high to low. Variables with frequencies not <30 were selected for RF classification analysis by using the R package “randomForest.” We conducted 5-fold cross-validation to get an unbiased estimate of the model performance. We randomly divided the dataset into five parts. In each fold of cross-validation, we used one part as the test set and the remaining four parts as the training set. We used this model for testing on the test set to calculate the classification accuracy. In addition, we validated our model with an independent external validation cohort as a validation set. LASSO-logistic regression analysis was conducted using the R package “glmnet.” SVM analysis was performed using the R package “e1071”.
3. Results
3.1. Demographics and serum biochemical analysis
Demographics and basic clinical information are shown in Table 1. In both cohorts, female patients were more likely to develop leucopenia compared with male patients [discovery cohort, P = 0.004, odds ratio (OR) 1.89, 95% confidence interval (CI) 0.59~6.02; validation cohort, P = 0.018, OR 2.78, 95% CI 0.72~10.53]. There was a significant association of NUDT15 C415T genotypes with leucopenia (discovery cohort, P = 0.003; validation cohort, P = 0.048). No statistical differences were found in terms of age, disease type, and drug combination between IBD patients with and without thiopurine-induced leucopenia from the discovery cohort and the validation cohort.
Table 1
| Discovery cohort ( N = 127) | Validation cohort ( N = 100) | |||||
|---|---|---|---|---|---|---|
| Racteristics | leukopenia N = 27 | Non-leukopenia N = 100 | p | leukopenia N = 26 | Non-leukopenia N = 74 | p |
| Gender, Male, n (%) | 15 (55.6) | 82 (82) | 0.004 | 15 (57.7) | 60 (81.1) | 0.018 |
| Age, n(%) | 0.30 | 0.37 | ||||
| < 18 | 1 (3.7) | 3 (3) | 1 (3.8) | 1 (1.4) | ||
| 18~40 | 22 (81.5) | 88 (88) | 19 (73.1) | 58 (78.4) | ||
| >40 | 4 (14.8) | 9 (9) | 6 (23.1) | 15 (20.2) | ||
| Diagnosis, n(%) | ||||||
| CD | 26 (96.3) | 99 (99) | 0.32 | 26 (100) | 73 (98.6) | 0.55 |
| UC | 1 (3.7) | 1 (1) | 0 (0) | 1 (1.4) | ||
| NUDT15 rs116855232, n(%) | ||||||
| CC | 19 (70.4) | 92 (92) | 0.003 | 19 (73.1) | 66 (89.2) | 0.048 |
| CT | 8 (29.6) | 8 (8) | 7 (26.9) | 8 (10.8) | ||
| Medication | ||||||
| AZA | 21 (77.8) | 91 (91) | 0.06 | 23 (88.5) | 71 (95.9) | 0.17 |
| 6-MP | 6 (22.2) | 9 (9) | 3 (11.5) | 3 (4.1) | ||
| Thiopurines dose, AZA mg/kg/day, median (IQR) | 1.2 (0.9–1.7) | 1.6 (1.1–1.9) | 1.5 (1.1–2.0) | 1.6 (1.11.9) | ||
| Co-medication | 0.052 | 0.27 | ||||
| Steroids, n (%) | 1 (3.7) | 13 (13) | 2 (7.7) | 6 (8.1) | ||
| Infliximab, n (%) | 3 (11.1) | 7 (7) | 6 (23.1) | 0 (0) | ||
| 5-aminosalicylic acid, n (%) | 1 (3.7) | 0 (0) | 0 (0) | 2 (2.7) | ||
| EEN, n (%) | 3 (11.1) | 3 (3) | 0 (0) | 0 | ||
Clinical demographics of the subjects.
AZA, azathioprine; CD, Crohn's disease; IBD, inflammatory bowel disease; IQR, interquartile range; OR, odds ratio; UC, ulcerative colitis; EEN, Exclusive Enteral Nutrition.
3.2. Lipid profiling and differential lipid species analysis between CD patients with and without thiopurine-induced leucopenia
The typical chromatograms in the positive and negative ion modes are shown in Supplementary Figure S1. In untargeted lipidomic analysis, we examined plasma samples by positive and negative ion modes with two injections and detected 1,126 lipid species including 952 in the positive ion mode and 174 in the negative ion mode from 127 patients in the discovery cohort (Figure 1A).
Figure 1
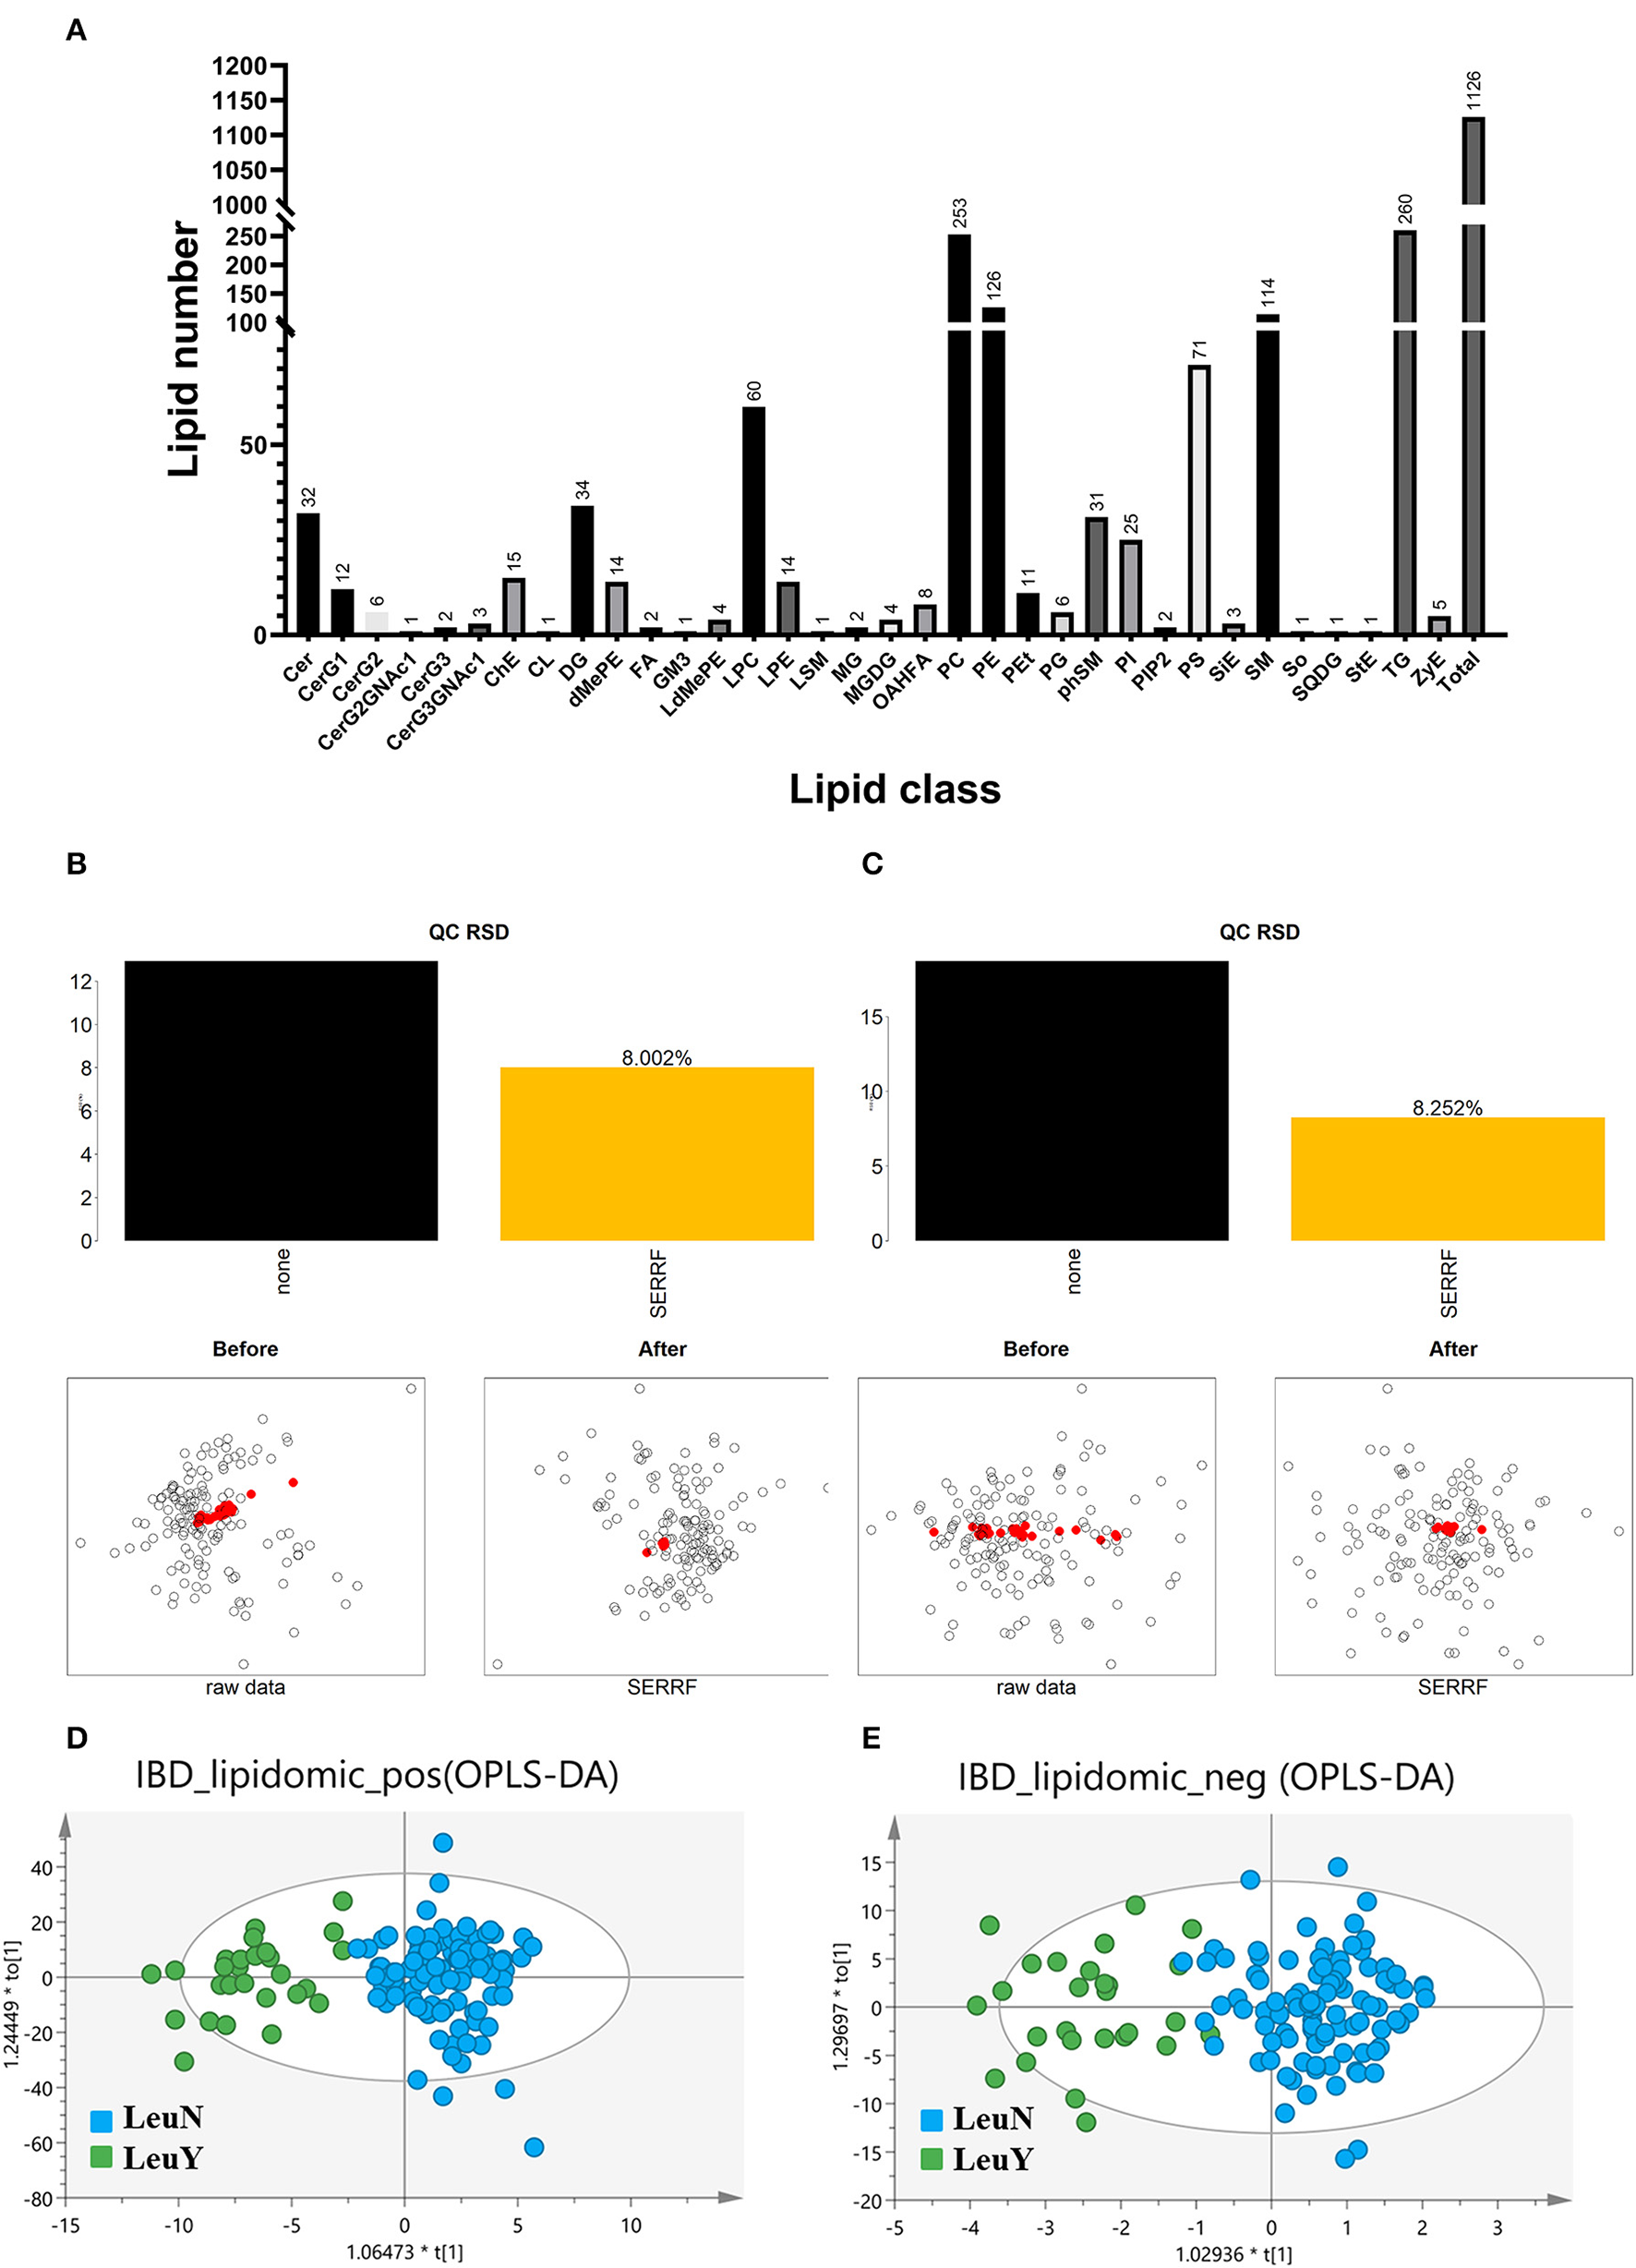
Untargeted lipidomic analysis. (A) Number of detected lipids based on a untargeted lipidomic. SERRF normalization to remove the unwanted systematic variations for positive (B) and negative (C) mode. The red dots represent QC samples, which are clustered together after SERRF normalization, indicating that systematic errors are eliminated. Scores scatter plot of OPLS-DA in both positive (D) and negative (E) mode. LeuN, the non-leukopenia group. LeuY leukopenia group.
The raw data were normalized using SERRF normalization to remove the unwanted systematic variations. The results showed that SERRF reduced the average technical errors for the positive and negative ion modes to 8.002 and 8.252% relative standard deviation (RSD), respectively (Figures 1B, C). The aggregation of QC samples was improved, and the RSD of QC was reduced after normalization by SERRF, indicating that SERRF effectively reduced the systematic variation of primary effect data.
An OPLS-DA model was developed to provide a lipid analysis profile between the leukopenia and non-leukopenia groups in positive and negative ion modes, respectively (Figures 1D, E). The key parameter R2 was applied to evaluate the discriminative power of the model. R2 is 0.779 in the positive ion mode and 0.750 in the negative ion mode. It is indicated that the OPLS-DA model established in positive and negative ion modes can distinguish the two groups well. In addition, the results of the 200-item permutation test proved that the fitted OPLS-DA model was not overfitted. Molecular features with VIP > 1.0, fold change >1.2 or <0.8333, and p < 0.05 were used as the screening criteria for potential differential lipid species. A total of 119 plasma lipid species were considered to be the main cause of differences between the leukopenia and the non-leukopenia group.
3.3. Perturbed metabolic pathway
To map the lipid species pathway of identified 119 lipid species from TIL in IBD patient study, network analysis was conducted and metabolic pathways were visualized, showing that five metabolic pathways were involved, including glycosphingolipid metabolism, glycosphingolipid biosynthesis–globoseries, glycosphingolipid biosynthesis–ganglioseries, Ggycerophospholipid metabolism, and arachidonic acid metabolism (Figure 2).
Figure 2
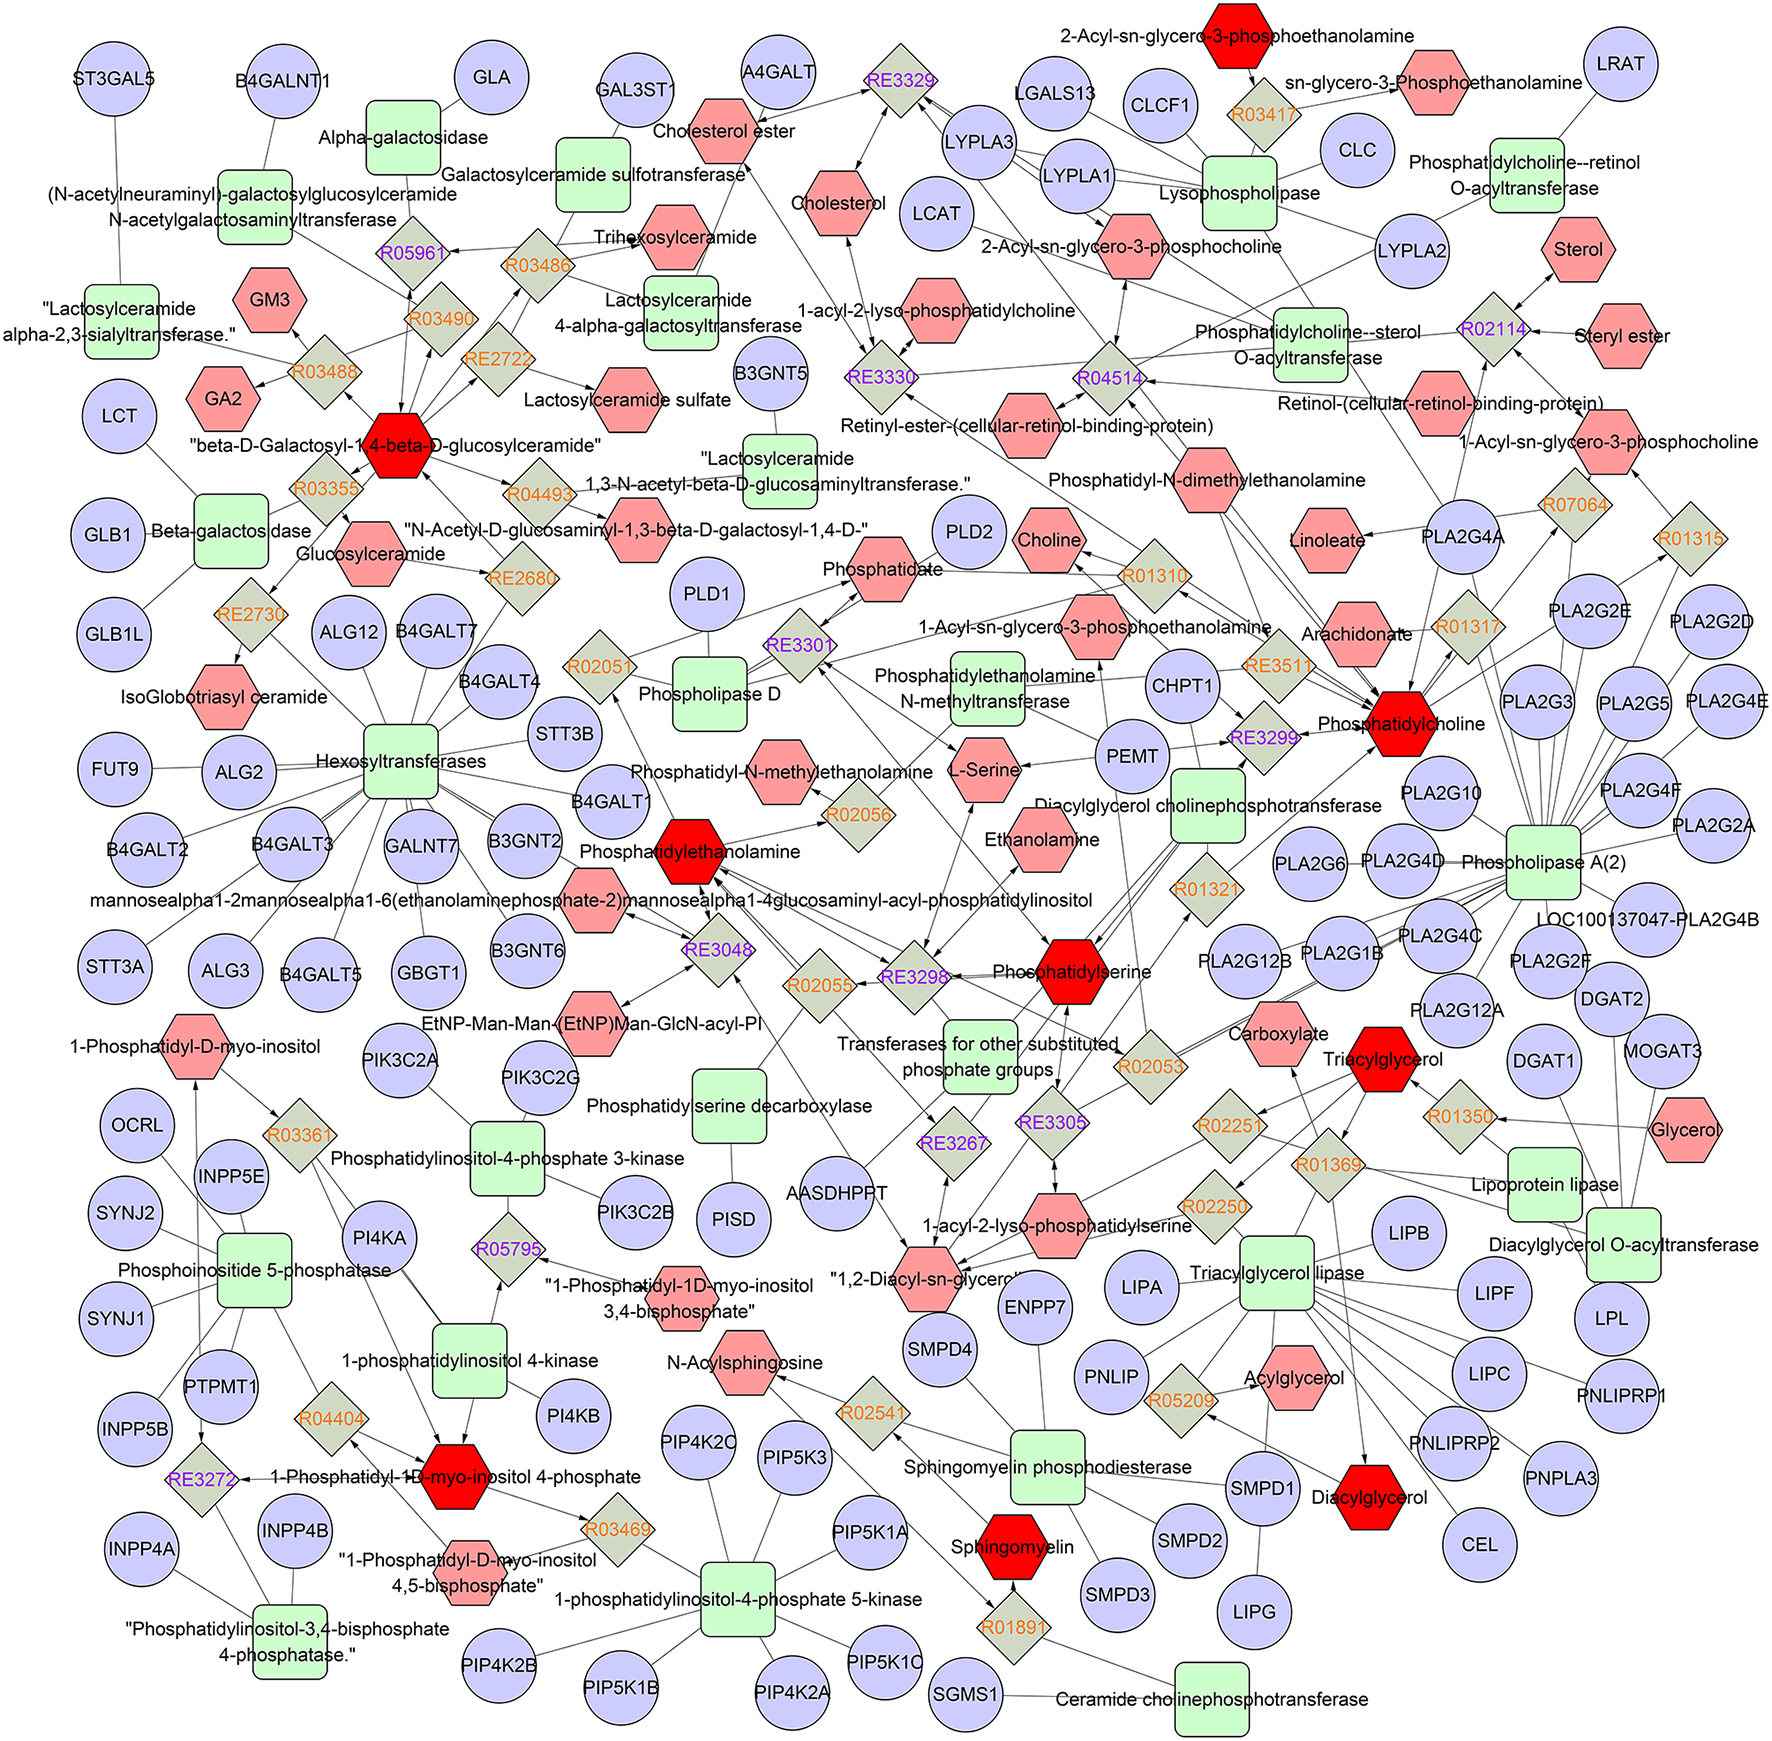
Network of the remarkably perturbed metabolic pathways by MetScape analysis. The red hexagons indicate the differential lipid metabolites identified in our study. Moreover, the pink ones are the involved metabolites that have not been identified in our study. The diamond ones are the involved reaction. The ellipse ones are the involved gene, and the round rectangle ones are the enzyme.
3.4. Independent validation of specific lipidomic signatures
We further identified lipidomic alterations in an independent validation cohort of 100 subjects, which included 74 non-leukopenia patients and 26 leukopenia patients. The findings validated that 16 of the 119 metabolites had an FDR < 0.05. These 16 lipid species, including LacCer (d18:1/16:0), TG (22:5/18:2/18:2), TG (18:1/20:5/22:4), TG (18:1/20:4/22:4), TG (15:0/16:0/16:1), TG (16:0/18:2/24:7), CerG2 (d18:1/24:1), TG (18:1/18:1/22:4), TG (18:1/17:1/20:4), TG (24:5/18:1/18:1), TG (18:1/18:1/24:6), TG (18:1/18:1/22:5), TG (18:2/18:2/20:4), phSM (d18:2/28:6), PC (20:1p/24:7), and CerG2 (d18:2/16:0), have high robustness and reproducibility and can be considered as potential biomarkers for IBD. Figure 3A demonstrates the different levels of the 16 lipid species in plasma in the leukopenia and non-leukopenia group. The ROC curves of the 16 lipid species are shown in Figure 3B.
Figure 3
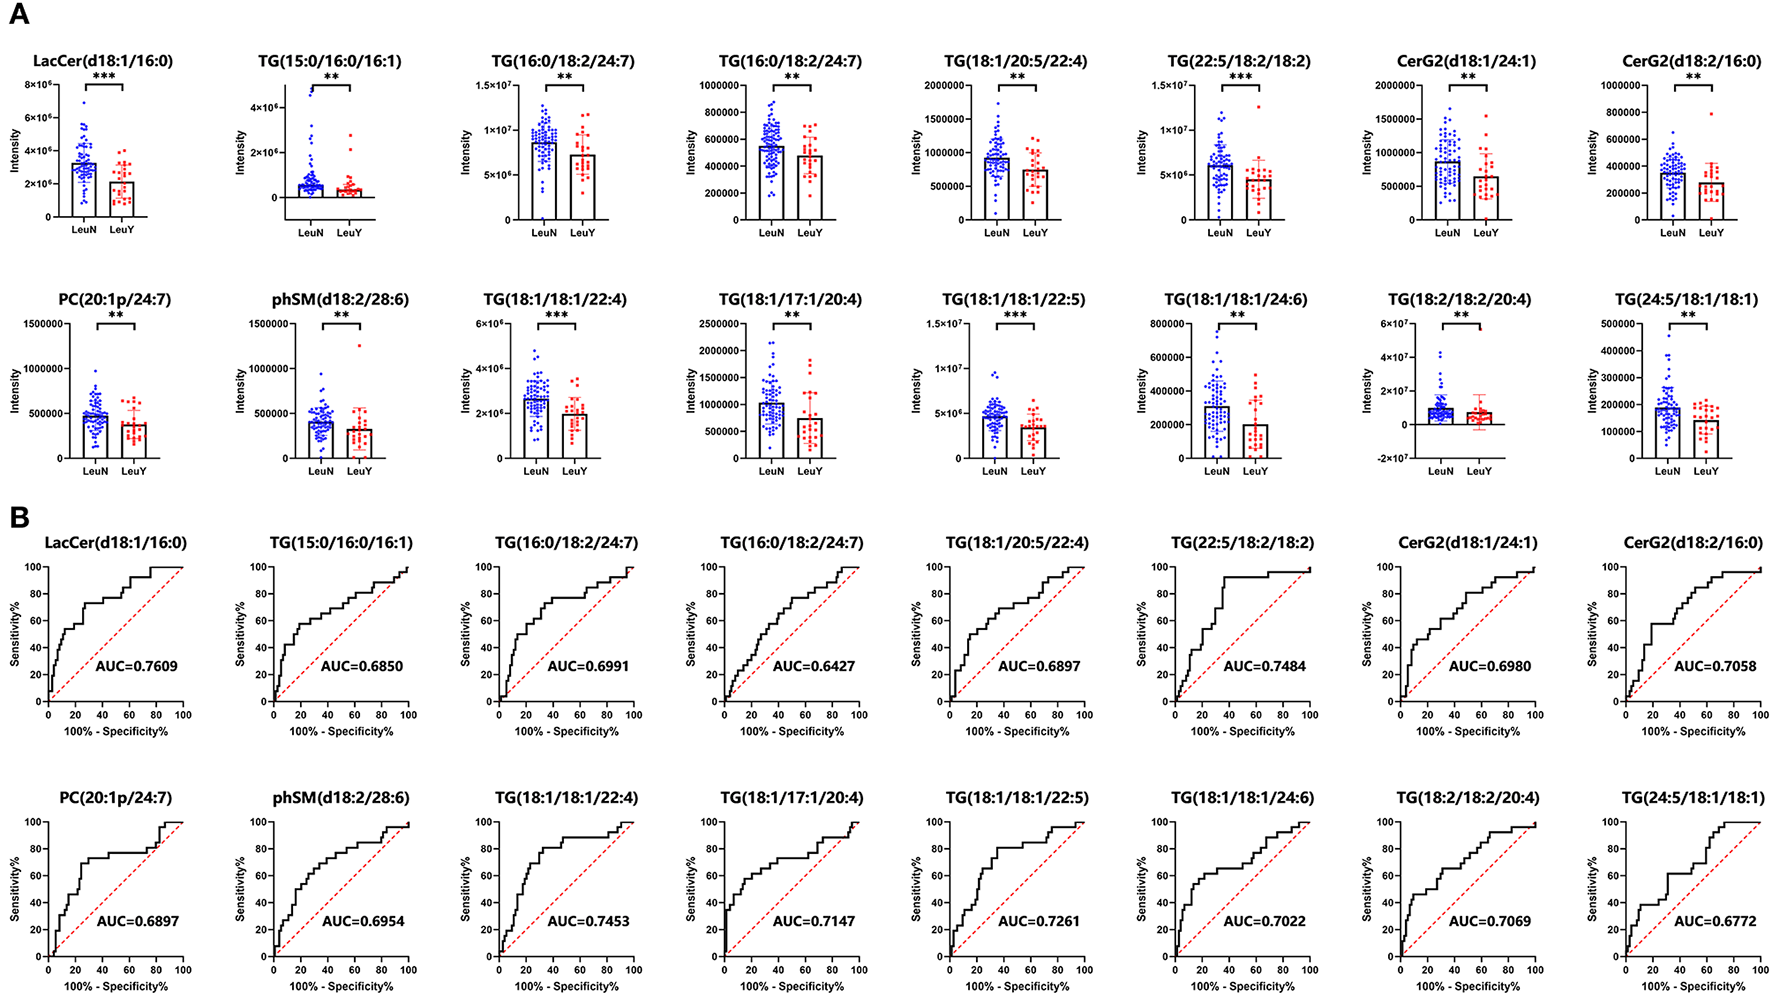
A total of 16 lipid species were further validated by a prospective, observational study. (A) Dot and bar plots of levels of 16 lipid species including LacCer (d18:1/16:0), TG (22:5/18:2/18:2), TG (18:1/20:5/22:4), TG (18:1/20:4/22:4), TG (15:0/16:0/16:1), TG (16:0/18:2/24:7), CerG2 (d18:1/24:1), TG (18:1/18:1/22:4), TG (18:1/17:1/20:4), TG (24:5/18:1/18:1), TG (18:1/18:1/24:6), TG (18:1/18:1/22:5), TG (18:2/18:2/20:4), phSM (d18:2/28:6), PC (20:1p/24:7), and CerG2 (d18:2/16:0). (B) ROC curves of the 16 lipid biomarkers in leukopenia IBD and non-leukopenia IBD patients. The AUC of each biomarker is indicated. LeuN, the non-leukopenia group. LeuY, leukopenia group. **p < 0.01, ***p < 0.001 by the t-test or Wilcoxon–Mann–Whitney U-test.
3.5. Well distinguish the leukopenia group from the non-leukopenia group by the six lipid species established models
LASSO was used to further narrow the number of differential lipid species to suit actual clinical needs. To remove the bias caused by randomly dividing the dataset, we performed 50 times LASSO-based variable selections. An RF regression model was fit by using six lipid species with a frequency more than 30 times in the 50 times LASSO-based variable selections to distinguish the leukopenia group from the non-leukopenia group (Table 2). Six lipid species including LacCer (d18:1/16:0), TG (15:0/16:0/16:1), TG (16:0/18:2/24:7), TG (18:1/20:4/22:4), TG (18:1/20:5/22:4), and TG (22:5/18:2/18:2) can clearly distinguish the two groups. In the discovery cohort, the model had a classification accuracy of 95.28%, and the 95% confidence interval (CI) is (0.9000, 0.9825). The confusion matrix of RF for the discovery cohort and validation cohort is shown in Figures 4A, B. The ROC curve showed that AUC values were equal at 0.9989 (Figure 4C). In the validation cohort, the model had a classification accuracy of 79.00%, and the 95% CI is (0.6971, 0.8651). The ROC curve showed that AUC values were equal at 0.8098 (Figure 4D). To further test the classification power of the six lipid species, we also established two classification algorithms, logistic and support vector machine classification, and obtained similar results to the random forest (Supplementary Figure S2).
Table 2
| Lipid species | Formula | RT [min] | Frequency | P | FDR | FC |
|---|---|---|---|---|---|---|
| LacCer (d18:1/16:0) | C46H88O13N1 | 11.42858 | 50 | 7.98E-05 | 0.0083 | 1.53 |
| TG (15:0/16:0/16:1) | C50H98O6N1 | 17.49223 | 45 | 0.0051 | 0.038 | 1.22 |
| TG (16:0/18:2/24:7) | C61H101O6 | 17.47783 | 43 | 0.0026 | 0.030 | 1.19 |
| TG (18:1/20:4/22:4) | C63H105O6 | 17.81924 | 49 | 0.0036 | 0.033 | 1.20 |
| TG (18:1/20:5/22:4) | C63H103O6 | 17.50232 | 50 | 0.0039 | 0.033 | 1.24 |
| TG (22:5/18:2/18:2) | C61H104O6N1 | 16.97768 | 50 | 1.72E-04 | 0.0084 | 1.35 |
Lipid metabolites distinguish IBD patients who developed leukopenia from those who do not.
Figure 4
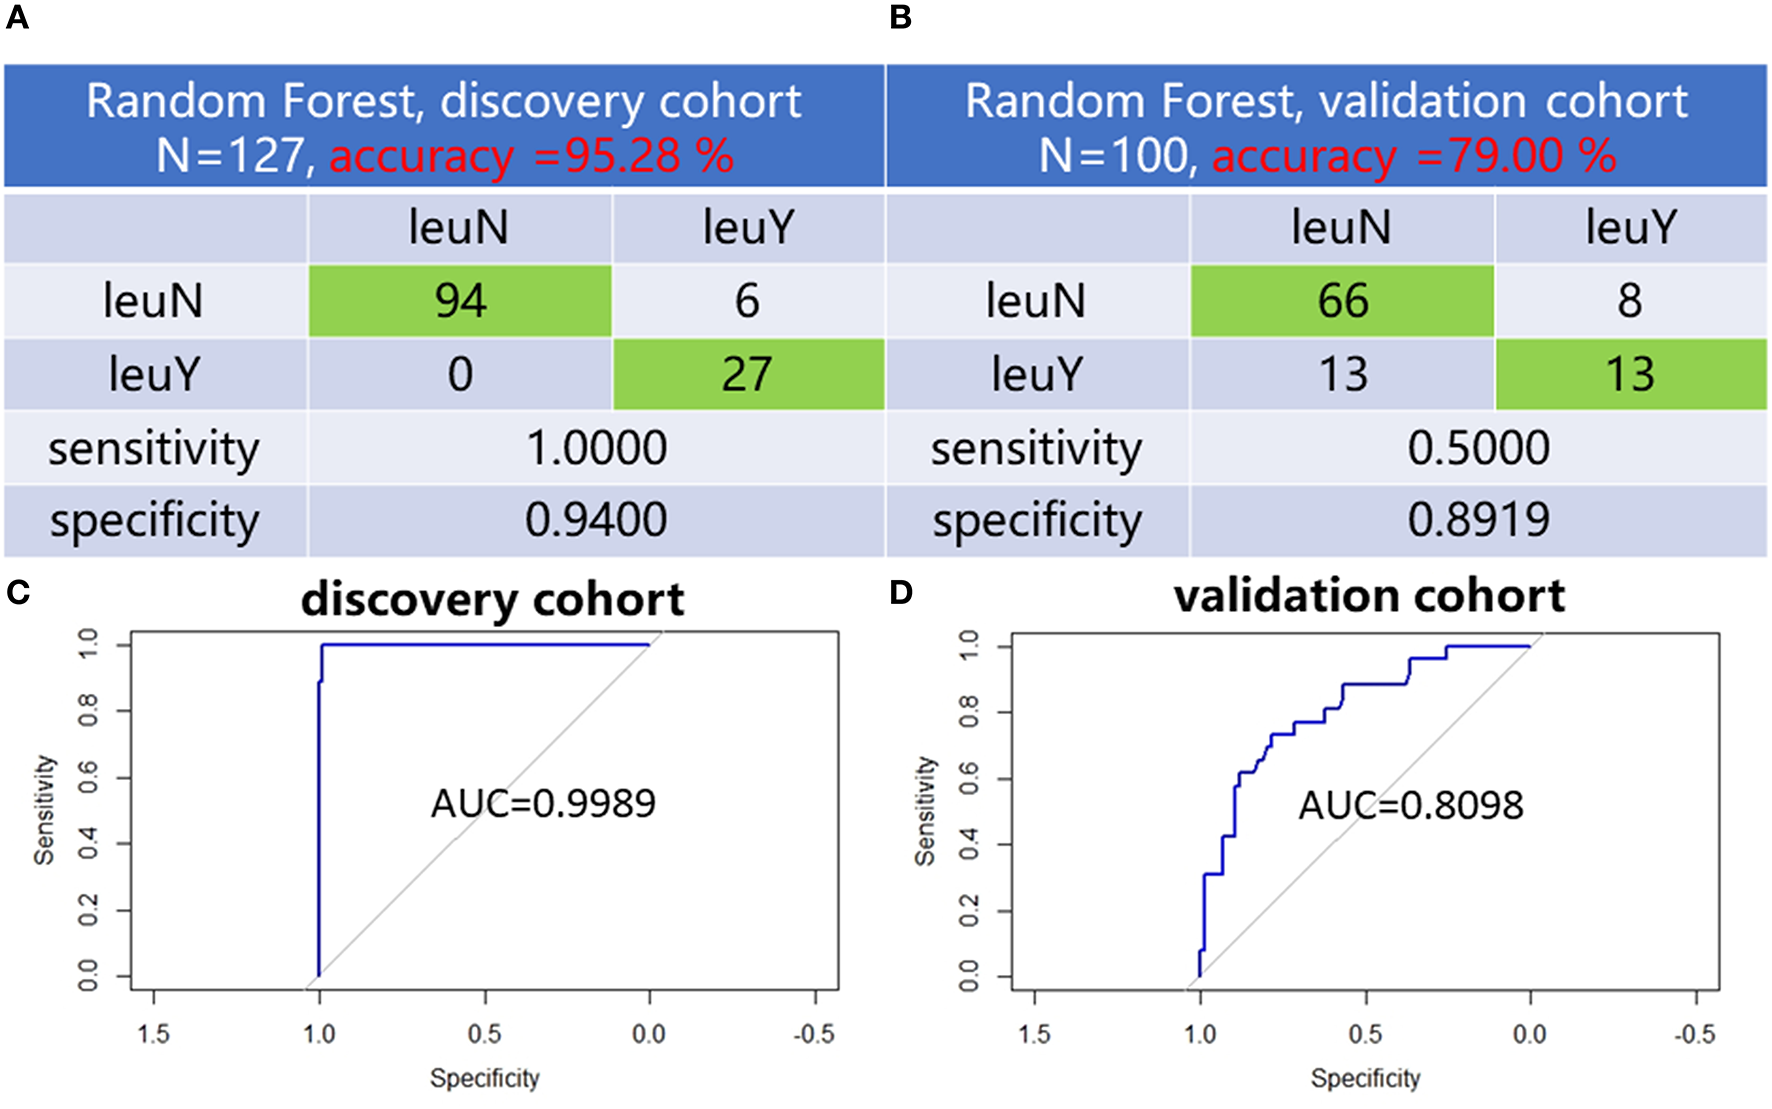
Six lipid species established distinguish models. Confusion matrix of random forest evaluation on the model from discovery cohort (A) and validation cohort (B). Analysis of RF model-based ROC curves of six lipid species in leukopenia patients and non-leukopenia patients from discovery cohort (C) and validation cohort (D). leuN, non-leukopenia group. leuY, leukopenia group.
3.6. Blood biochemical tests for lipoprotein, cholesterol, and triglyceride
We performed the t-test on total cholesterol (CH), triglycerides (TG), high-density lipoproteins (HDL), low-density lipoproteins (LDL), Apolipoprotein A1 (ApoA1), Apolipoprotein B (ApoB), and lipoprotein α(Lp(a)) levels. After the administration of thiopurines, CH (p = 0.02), HDL (p = 0.01), ApoA1 (p = 0.01), and ApoB (p = 0.03) had higher levels in the leukopenia group compared to the non-leukopenia group. TG, LDL, and Lp(a) were no different between the two groups (Figures 5A–G). Before thiopurines treatment, CH (p = 0.007), LDL (p = 0.001), and ApoB (p = 0.0003) had higher levels in the leukopenia group compared to the non-leukopenia group, and there were no differences in the others between the two groups (Figures 5H–N), that is there was no difference in blood total TG levels between two groups, either before or after the treatment.
Figure 5
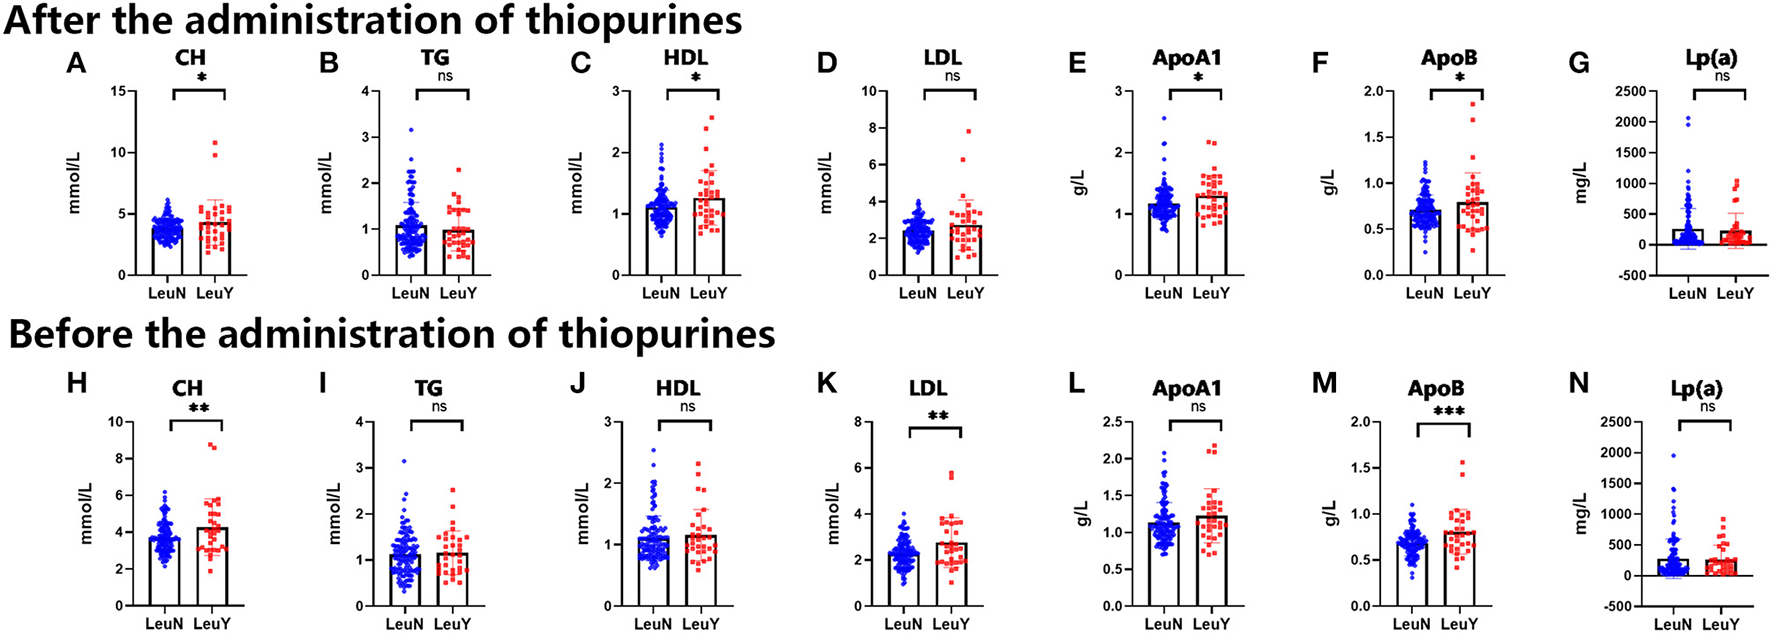
Blood biochemical tests of lipoprotein, cholesterol and triglyceride before and after administration of thiopurine in IBD patients. The level of CH, TG, HDL, LDL, ApoA1, ApoB, Lp(a) after administration of thiopurine in IBD patients (A–G). The level of CH, TG, HDL, LDL, ApoA1, ApoB, Lp(a) before administration of thiopurine in IBD patients (H–N). LeuN, non-leukopenia group. LeuY, leukopenia group. *p < 0.05, **p < 0.01, ***p < 0.001 by the t-test.
4. Discussion
IBD is a chronic inflammatory gastrointestinal disease, and MP/AZA has been widely used in IBD patients (8). However, serious adverse events, leukopenia, limit its clinical application. TPMT and NUDT15 are thought to be pivotal enzymes in thiopurine metabolism and are relevant to TIL (13). Leukopenia still occurs in about 20% of patients, even after accounting for TPMT and NUDT15 (16). The plasma lipid profiles of IBD patients with thiopurine treatment have not been systematically investigated. In this study, we for the first time characterized a detailed plasma lipid profile of TIL after NUDT15 C415T screening in Chinese IBD patients.
We performed untargeted lipidomic analysis to explore lipid level changes in vivo during TIL in two independent cohorts and finally screened out six lipid species using machine learning-related algorithms that could well distinguish patients from the leukopenia group and the normal group. These six lipid species performed excellently in the three algorithms of lasso-logistic, support vector machine, and random forest, proving the screening performance of these six lipids. In addition, it is worth noting that the random forest algorithm has the best discrimination effect with the established model, with an accuracy of 95.28% (discovery cohort) and 79.00% (validation cohort), and ROC showed that AUC value is equal at 0.9989 (discovery cohort) and 0.8098 (validation cohort).
Lactosylceramides (LacCer) are the most important and abundant type of diosylceramides and belong to the class of glycosphingolipids (36). Approximately 70% of the glycosphingolipids in human neutrophils are lactosylceramide (37, 38). The number of glycolipids changes significantly during leukocyte differentiation, indicating that these molecules are involved in biological functions (37). The previous study found that the lactosylceramide-enriched glycosphingolipid signaling domain mediates superoxide production in human neutrophils (39). Therefore, TIL may be related to the abnormal expression of LacCer on neutrophils. Further research is needed to confirm.
Five of the six lipids used for modeling belong to triglycerides, indicating that the leukopenia in IBD patients caused by thiopurine may be related to the metabolism of triglycerides. A study of the relationship between the abnormal lipid profile and inflammation and progression of myelodysplastic syndrome to acute leukemia (patients = 11,071) found that elevated triglycerides were dramatically related to the diagnosis of acute leukemia in patients with myelodysplastic syndrome (40). A retrospective study containing 1,412 cases found that patients with acute promyelocytic leukemia (APL) had higher triglyceride levels than non-APL and control subjects. There was a positive correlation between triglyceride levels and WBC, which is consistent with the findings of this study (28). Further study found that the interaction between hypertriglyceridemia and acute promyelocytic leukemia is mediated by the cooperation of peroxisome proliferator-activated receptor-alpha with PML/RAR alpha fusion protein on the super enhancer (28). However, we observed that there was no difference in blood total TG levels between the two groups, either before or after the treatment. This difference implies that the levels of individual specific TG molecules rather than total TG levels are involved in the TIL process, indicating their potential importance. In addition, our results showed that patients with leukopenia had higher blood CH and ApoB levels than normal patients before and after treatment. A study found that the lipid-lowering drug gemfibrozil induces leukopenia via PPAR-α in mice (41). Further investigation is necessary to clarify whether thiopurine-inducedleukopenia is also mediated through PPAR-α.
Our current study has several limitations. We only investigated the lipid profile of patients with IBD when leukopenia occurred, and there are limitations to single-point measurement. Although we additionally collected an independent validation cohort to ensure that our results are stable and reliable, repeating-measures across several visits on the same patient are a good way to understand the intra-subject variation at the time of diagnosis and its evolution process. In addition, the six lipid species were not validated from populations of other parts of Asia.
5. Conclusion
In conclusion, our results revealed the essential lipid species and pathways that could contribute to distinguishing the TIL in the IBD after NUDT15 C415T screening. Six lipid species including LacCer (d18:1/16:0), TG (15:0/16:0/16:1), TG (16:0/18:2/24:7), TG (18:1/20:4/22:4), TG (18:1/20:5/22:4), and TG (22:5/18:2/18:2) were screened and can clearly distinguish the two groups. The results showed a tight link between plasma lipid profiles and TIL, which was most pronounced in LacCer and TG. With powerful machine learning-based algorithms, including LASSO logistic regression, random forests, and support vector machine models, we were able to screen potential biomarkers for potential clinical applications. Our novel findings have enabled us to better understand the mechanisms of TIL and to develop models with clinical applications and new therapeutic strategies for the individualized treatment of thiopurines.
Statements
Data availability statement
The raw data supporting the conclusions of this article will be made available by the authors, without undue reservation.
Ethics statement
The studies involving human participants were reviewed and approved by the Clinical Research Ethics Committee of the Sixth Affiliated Hospital of the Sun Yat-sen University. Written informed consent to participate in this study was provided by the participants' legal guardian/next of kin.
Author contributions
PL: conceptualization, data analysis, methodology, investigation, writing—original draft, and writing—review and editing. KC: conceptualization, methodology, writing—original draft, and writing—review and editing. TY, JM, and XZ: patient enrollment and follow up and writing—review and editing. ZH: resources, software, and visualization. LQ: collecting data. PH: supervision and resources. MH: supervision, funding acquisition, and writing—review and editing. XG: project administration, resources, and writing—review and editing.
Funding
The project was sponsored by the National Nature Science Fund of China Grant Nos. 82020108031, 81700495, 81730103, 81573507, 81973398, and 81870382; the Guangdong Provincial Key of Laboratory Construction Foundation, Nos. 2017B030314030 and 2020B1212060034; the National Key Research and Development Program, No. 2016YFC0905003; the 111 Project, No. B16047.
Acknowledgments
Prof. Wen Xie and Prof. Zhong Zuo carefully revised and polished the manuscript, and provided valuable suggestions, which made a non-negligible contribution to the final publication of this study. We would like to express our gratitude.
Conflict of interest
The authors declare that the research was conducted in the absence of any commercial or financial relationships that could be construed as a potential conflict of interest.
Publisher’s note
All claims expressed in this article are solely those of the authors and do not necessarily represent those of their affiliated organizations, or those of the publisher, the editors and the reviewers. Any product that may be evaluated in this article, or claim that may be made by its manufacturer, is not guaranteed or endorsed by the publisher.
Supplementary material
The Supplementary Material for this article can be found online at: https://www.frontiersin.org/articles/10.3389/fnut.2023.1138506/full#supplementary-material
References
1.
Huang LJ Mao XT Li YY Liu DD Fan KQ Liu RB et al . Multiomics analyses reveal a critical role of selenium in controlling t cell differentiation in crohn's disease. Immunity. (2021) 54:1728–44.e7. 10.1016/j.immuni.2021.07.004
2.
Ng SC Shi HY Hamidi N Underwood FE Tang W Benchimol EI et al . Worldwide incidence and prevalence of inflammatory bowel disease in the 21st century: a systematic review of population-based studies. Lancet. (2017) 390:2769–78. 10.1016/S0140-6736(17)32448-0
3.
Peyrin-Biroulet L Sandborn WJ Panaccione R Domènech E Pouillon L Siegmund B et al . Tumour necrosis factor inhibitors in inflammatory bowel disease: the story continues. Therap Adv Gastroenterol. (2021) 14:17562848211059954. 10.1177/17562848211059954
4.
Jing W Dong S Luo X Liu J Wei B Du W et al . Berberine improves colitis by triggering ahr activation by microbial tryptophan catabolites. Pharmacol Res. (2020) 164:105358. 10.1016/j.phrs.2020.105358
5.
Chao K Huang Y Zhu X Tang J Wang X Lin L et al . Randomised clinical trial: dose optimising strategy by nudt15 genotyping reduces leucopenia during thiopurine treatment of Crohn's disease. Aliment Pharmacol Ther. (2021) 54:1124–33. 10.1111/apt.16600
6.
Matsuoka K Kobayashi T Ueno F Matsui T Hirai F Inoue N et al . Evidence-based clinical practice guidelines for inflammatory bowel disease. J Gastroenterol. (2018) 53:305–53. 10.1007/s00535-018-1439-1
7.
Lichtenstein GR Loft EV Isaacs KL Regueiro MD Gerson LB Sands BE . Acg clinical guideline: management of crohn's disease in adults. Am J Gastroenterol. (2018) 113:481–517. 10.1038/ajg.2018.27
8.
de Boer NKH Peyrin-Biroulet L Jharap B Sanderson JD Meijer B Atreya I et al . Thiopurines in inflammatory bowel disease: new findings and perspectives. J Crohn's Colitis. (2018) 12:610–20. 10.1093/ecco-jcc/jjx181
9.
Fraser AG Orchard TR Jewell DP . The Efficacy of Azathioprine for the Treatment of Inflammatory Bowel Disease: A 30 Year Review. Gut. (2002) 50:485–9. 10.1136/gut.50.4.485
10.
Moon W Loftus EV . Review Article: Recent Advances in Pharmacogenetics and Pharmacokinetics for Safe and Effective Thiopurine Therapy In inflammatory Bowel Disease. Aliment Pharmacol Ther. (2016) 43:863–83. 10.1111/apt.13559
11.
Zhu X Chao K Li M Xie W Zheng H Zhang JX et al . Nucleoside Diphosphate-Linked Moiety X-Type Motif 15 R139c Genotypes Impact 6-Thioguanine Nucleotide Cut-Off Levels to Predict Thiopurine-Induced Leukopenia in Crohn's Disease Patients. World J Gastroenterol. (2019) 25:5850–61. 10.3748/wjg.v25.i38.5850
12.
Ran ZH Wu KC Matsuoka K Jeen YT Wei SC Ahuja V et al . Asian Organization for Crohn's and Colitis and Asia Pacific Association of Gastroenterology Practice Recommendations for Medical Management and Monitoring of Inflammatory Bowel Disease in Asia. J Gastroenterol Hepatol. (2021) 36:637–45. 10.1111/jgh.15185
13.
Relling MV Schwab M Whirl-Carrillo M Suarez-Kurtz G Pui CH Stein CM et al . Clinical Pharmacogenetics Implementation Consortium Guideline for Thiopurine Dosing Based on Tpmt and Nudt15 Genotypes: 2018 Update. Clin Pharmacol Ther. (2019) 105:1095–105. 10.1002/cpt.1304
14.
Fangbin Z Xiang G Minhu C Liang D Feng X Min H et al . Should thiopurine methyltransferase genotypes and phenotypes be measured before thiopurine therapy in patients with inflammatory bowel disease?Ther Drug Monit. (2012) 34:695–701. 10.1097/FTD.0b013e3182731925
15.
Zhu Q Cao Q . Thiopurine methyltransferase gene polymorphisms and activity in chinese patients with inflammatory bowel disease treated with azathioprine. Chin Med J (Engl). (2012) 125:3665–70. 10.3760/cma.j.issn.0366-6999.2012.20.012
16.
Zhu X Wang XD Chao K Zhi M Zheng H Ruan HL et al . Nudt15 polymorphisms are better than thiopurine s-methyltransferase as predictor of risk for thiopurine-induced leukopenia in chinese patients with Crohn's disease. Aliment Pharmacol Ther. (2016) 44:967–75. 10.1111/apt.13796
17.
Yang JJ Landier W Yang W Liu C Hageman L Cheng C et al . Inherited Nudt15 variant is a genetic determinant of mercaptopurine intolerance in children with acute lymphoblastic leukemia. J Clin Oncol. (2015) 33:1235–42. 10.1200/JCO.2014.59.4671
18.
Moriyama T Nishii R Perez-Andreu V Yang W Klussmann FA Zhao X et al . Nudt15 polymorphisms alter thiopurine metabolism and hematopoietic toxicity. Nat Genet. (2016) 48:367–73. 10.1038/ng.3508
19.
Kakuta Y Naito T Onodera M Kuroha M Kimura T Shiga H et al . Nudt15 R139c Causes thiopurine-induced early severe hair loss and leukopenia in Japanese patients with Ibd. Pharmacogenomics J. (2016) 16:280–5. 10.1038/tpj.2015.43
20.
Reyes-Garces N Gionfriddo E . Recent developments and applications of solid phase microextraction as a sample preparation approach for mass-spectrometry-based metabolomics and lipidomics. Trac-Trends Analyt Chem. (2019) 113:172–81. 10.1016/j.trac.2019.01.009
21.
Xu C Rezeng C Li J Zhang L Yan Y Gao J et al . (1)H Nmr-based metabolomics study of the toxicological effects in rats induced by “renqing mangjue” pill, a traditional tibetan medicine. Front Pharmacol. (2017) 8:602. 10.3389/fphar.2017.00602
22.
Bin Masud S Jenkins C Hussey E Elkin-Frankston S Mach P Dhummakupt E et al . Utilizing machine learning with knockoff filtering to extract significant metabolites in crohn's disease with a publicly available untargeted metabolomics dataset. PLoS ONE. (2021) 16:e0255240. 10.1371/journal.pone.0255240
23.
Guan S Jia B Chao K Zhu X Tang J Li M et al . Uplc-Qtof-Ms-based plasma lipidomic profiling reveals biomarkers for inflammatory bowel disease diagnosis. J Proteome Res. (2020) 19:600–9. 10.1021/acs.jproteome.9b00440
24.
Murgia A Hinz C Liggi S Denes J Hall Z West J et al . Italian cohort of patients affected by inflammatory bowel disease is characterised by variation in glycerophospholipid, free fatty acids and amino acid levels. Metabolomics. (2018) 14:140. 10.1007/s11306-018-1439-4
25.
Klock JC Pieprzyk JK . Cholesterol, phospholipids, and fatty acids of normal immature neutrophils: comparison with acute myeloblastic leukemia cells and normal neutrophils. J Lipid Res. (1979) 20:908–11. 10.1016/S0022-2275(20)40020-3
26.
Pabst T Kortz L Fiedler GM Ceglarek U Idle JR Beyoglu D . The plasma lipidome in acute myeloid leukemia at diagnosis in relation to clinical disease features. BBA Clin. (2017) 7:105–14. 10.1016/j.bbacli.2017.03.002
27.
Stefanko A Thiede C Ehninger G Simons K Grzybek M . Lipidomic approach for stratification of acute myeloid leukemia patients. PLoS ONE. (2017) 12:e0168781. 10.1371/journal.pone.0168781
28.
Wu S Li S Jin P Zhang Y Chen L Jin W et al . Interplay between hypertriglyceridemia and acute promyelocytic leukemia mediated by the cooperation of peroxisome proliferator-activated receptor-α with the PML/RAR α fusion protein on super-enhancers. Haematologica. (2022) 107:2589–600. 10.3324/haematol.2021.280147
29.
Yu T Zhou Z Liu S Li C Zhang Z-W Zhang Y et al . The role of phosphatidylcholine 34:1 in the occurrence, development and treatment of ulcerative colitis. Acta Pharmaceutica Sinica B. (2022) 13:1231–45. 10.1016/j.apsb.2022.09.006
30.
Cebo M Dittrich K Fu X Manke MC Emschermann F Rheinlaender J et al . Platelet Ackr3/Cxcr7 favors antiplatelet lipids over an atherothrombotic lipidome and regulates thromboinflammation. Blood. (2022) 139:1722–42. 10.1182/blood.2021013097
31.
Gallagher K Catesson A Griffin JL Holmes E Williams HRT . Metabolomic analysis in inflammatory bowel disease: a systematic review. J Crohn's Colitis. (2020) 15:813–826. 10.1093/ecco-jcc/jjaa227
32.
Zhang H Gao Y Sun J Fan S Yao X Ran X et al . Optimization of lipid extraction and analytical protocols for UHPLC-ESI-HRMS-based lipidomic analysis of adherent mammalian cancer cells. Anal Bioanal Chem. (2017) 409:5349–58. 10.1007/s00216-017-0483-7
33.
Fan S Kind T Cajka T Hazen SL Tang WHW Kaddurah-Daouk R et al . Systematic error removal using random forest for normalizing large-scale untargeted lipidomics data. Anal Chem. (2019) 91:3590–6. 10.1021/acs.analchem.8b05592
34.
Gaude E Chignola F Spiliotopoulos D Spitaleri A Ghitti M García-Manteiga J et al . Muma, an R package for metabolomics univariate and multivariate statistical analysis. Current Metabolomics. (2013) 1:180–9. 10.2174/2213235X11301020005
35.
Saccenti E Hoefsloot HCJ Smilde AK Westerhuis JA Hendriks M . Reflections on univariate and multivariate analysis of metabolomics data. Metabolomics. (2014) 10:361–74. 10.1007/s11306-013-0598-6
36.
Cooling LL Zhang DS Naides SJ Koerner TA . Glycosphingolipid expression in acute nonlymphocytic leukemia: common expression of shiga toxin and parvovirus B19 receptors on early myeloblasts. Blood. (2003) 101:711–21. 10.1182/blood-2002-03-0718
37.
Ekyalongo RC Nakayama H Kina K Kaga N Iwabuchi K . Organization and functions of glycolipid-enriched microdomains in phagocytes. Biochim Biophys Acta. (2015) 1851:90–7. 10.1016/j.bbalip.2014.06.009
38.
Symington FW Hedges DL Hakomori S . Glycolipid antigens of human polymorphonuclear neutrophils and the inducible Hl-60 myeloid leukemia line. J Immunol. (1985) 134:2498–506. 10.4049/jimmunol.134.4.2498
39.
Iwabuchi K Nagaoka I . Lactosylceramide-enriched glycosphingolipid signaling domain mediates superoxide generation from human neutrophils. Blood. (2002) 100:1454–64. 10.1182/blood.V100.4.1454.h81602001454_1454_1464
40.
Qiao W Young E Feng C Liu S Jin J Noor L et al . Association between abnormal lipid profile and inflammation and progression of myelodysplastic syndrome to acute leukemia. Exp Hematol Oncol. (2022) 11:58. 10.1186/s40164-022-00309-7
41.
Estrela GR Arruda AC Torquato HFV Freitas-Lima LC Perilhão MS Wasinski F et al . Gemfibrozil induces anemia, leukopenia and reduces hematopoietic stem cells via ppar-α in mice. Int J Mol Sci. (2020) 21:5050. 10.3390/ijms21145050
Summary
Keywords
thiopurines, lipidomic, inflammatory bowel disease, biomarkers, machine learning
Citation
Li P, Chao K, Hu Z, Qin L, Yang T, Mao J, Zhu X, Hu P, Wang X, Gao X and Huang M (2023) Plasma lipidomic profiling of thiopurine-induced leukopenia after NUDT15 genotype-guided dosing in Chinese IBD patients. Front. Nutr. 10:1138506. doi: 10.3389/fnut.2023.1138506
Received
05 January 2023
Accepted
10 May 2023
Published
27 June 2023
Volume
10 - 2023
Edited by
Michele Sallese, University of Studies G. d'Annunzio Chieti and Pescara, Italy
Reviewed by
Francois-Pierre Martin, H & H Group, Switzerland; Lanzhou Li, Jilin Agricultural University, China
Updates
Copyright
© 2023 Li, Chao, Hu, Qin, Yang, Mao, Zhu, Hu, Wang, Gao and Huang.
This is an open-access article distributed under the terms of the Creative Commons Attribution License (CC BY). The use, distribution or reproduction in other forums is permitted, provided the original author(s) and the copyright owner(s) are credited and that the original publication in this journal is cited, in accordance with accepted academic practice. No use, distribution or reproduction is permitted which does not comply with these terms.
*Correspondence: Min Huang huangmin@mail.sysu.edu.cnXiang Gao gxiang@mail.sysu.edu.cn
†These authors have contributed equally to this work
Disclaimer
All claims expressed in this article are solely those of the authors and do not necessarily represent those of their affiliated organizations, or those of the publisher, the editors and the reviewers. Any product that may be evaluated in this article or claim that may be made by its manufacturer is not guaranteed or endorsed by the publisher.