 Zhao-Yan Wen1†
 Yi-Fan Wei
 Ye-Huan Sun
 Wen-Ping Ji
- 1Scientific Research Management Department, Chaohu Hospital Affiliated to Anhui Medical University, Hefei, China
- 2Department of Clinical Epidemiology, Shengjing Hospital of China Medical University, Shenyang, China
- 3Department of Epidemiology and Health Statistics, School of Public Health, Anhui Medical University, Hefei, China
Objectives: The associations of posteriori dietary patterns with the risk of hyperuricemia (HUA) are contradictory. Several fair-quality observational studies with inconsistent results have been published following a prior review. Herein, we carried out an updated systematic review and meta-analysis to quantitatively analyze the aforementioned relationships.
Methods: Our analysis protocol has been registered with PROSPEPO (Number: CRD42022376745). English publications were searched in Embase, PubMed, and Web of Science from inception to January 1, 2024. Summary odds ratio (OR) and 95% confidence intervals (CIs) were calculated by a random-effects model. We also conducted subgroup, sensitivity, and meta-regression analyses and publication bias assessments.
Results: Thirteen studies with a total of 163,192 participants were included in the current meta-analysis. Our finding revealed that the plant-based pattern was linked with a 17% decreased risk of HUA (OR = 0.83, 95%CI = 0.72–0.94, I2 = 72.9%, n = 10). There was no evidence of publication bias in the present analysis. The results of subgroup analyses were generally consistent with the main findings. In meta-regression analyses, no evidence of heterogeneity was detected in the subgroups. Furthermore, our analyses indicated that the animal-based food pattern (OR = 1.36, 95%CI = 1.25–1.47, I2 = 26.7%, n = 11) and sweet food pattern (OR = 1.24, 95%CI = 1.06–1.46, I2 = 0, n = 2) was related to an increased risk of HUA.
Conclusion: The plant-based pattern is inversely correlated with HUA risk, whereas animal-based food patterns and sweet food patterns are positively correlated with HUA risk.
Introduction
Uric acid is an end-product of purine metabolism (1). Excessive production of uric acid and reduced excretion through the kidney are the main causes of hyperuricemia (HUA) (1). Notably, HUA has been reported as the second most frequent metabolic disease after diabetes globally (2). In the United States, a nationwide survey revealed that the prevalence rate of HUA is substantial, with 20.0% of women and 20.2% of men being affected (3). A recent report from China showed that the prevalence rates of HUA increased steadily from 8.5 to 18.4% from 2000 to 2017 (4). Previous studies have suggested that lifestyle (especially diet) and history of cardiovascular disease were related to the incidence of HUA (5–8). Of particular concern is that diet might be the most important and cost-effective factor that can be used to modify the risk of HUA (9).
In nutritional epidemiology, previous studies mainly explored individual nutrient or food intake but did not consider potentially complex interactions among various foods or nutrients (10, 11). In this context, a representative of comprehensive dietary variables, dietary pattern, has emerged to reveal the impact of overall diet (12). Till now, there are two ways to determine dietary patterns, which are the priori method and the posteriori method. The former is mainly based on dietary guidelines compliance, while the latter is based on dietary data (13). During the last 5 years, a large number of studies have emerged to explore the effect of dietary patterns on the risk of hyperuricemia (14–18); however, the findings have been inconsistent. For example, in the latest cross-sectional study with 4,855 participants, a significantly inverse association between plant-based dietary patterns and HUA risk was observed (15). Conversely, the aforementioned association was non-significant in another cross-sectional study in 2022 including 2,646 subjects (16). In nearly 1 year, several fair-quality studies have been published (19–21), but the results were inconsistent. For example, two studies found that plant-based patterns and animal-food patterns were not associated with the risk of HUA (19, 20).
With the emergence of more new studies with inconsistent results exploring the correlation of dietary patterns with HUA risk, a systematic collection and assessment of the aforementioned results will provide a better understanding of the impact of overall diet on the risk of HUA. Consequently, we carried out this updated systematic review and meta-analysis of available evidence to provide a quantitative evaluation of the association between posteriori dietary patterns and HUA risk.
Methods
Protocol, registration, reporting standards, and search strategy
We reported this systematic review and meta-analysis following a standardized method with the Preferred Meta-Analysis of Observational Studies in Epidemiology guidelines (Supplementary Table S1) (22) and Reporting Items for Systemic Reviews and Meta-Analyses guidelines (Supplementary Table S2) (23). The protocol for the present review has been registered in the International Prospective Register of Systematic Reviews (registration number: CRD42022376745). All relevant works of literature were searched by two independent individuals (WZY and JWP) in three electronic databases, including Embase, PubMed, and Web of Science from inception up until January 1, 2024. Details of the search strategy are presented in Supplementary Table S3. Furthermore, all references cited in the included literature were manually searched to determine additional publications.
Study selection
Two authors (WZY and JWP) began by independently and rigorously screening titles and abstracts and then scrutinized full-text articles. Differences were settled by consensus. Articles that met the following criteria were included in the analysis (1): observational study (2); the exposure was evaluated by dietary patterns which were identified using, e.g., factor analysis, cluster analysis, reduced rank regression, and principal component analysis in primary studies (3); the outcome was the risk of hyperuricemia (4); analyses reported risk estimates such as relative risk (RR), prevalence ratio (PR), odds ratio (OR), hazard ratio (HR), and 95% confidence intervals (CIs) or provided relevant data for calculating relative risk and corresponding 95% CI. The exclusion criteria were as follows (1): non-original research like commentaries, editorial review articles, systemic reviews, meta-analyses, animal studies, and meeting abstracts (2); studies that did not report effect value or relevant data for calculation (3); publications that were written in a non-English language.
Data extraction and quality assessment
Two investigators (WZY and JWP) examined the main features of all eligible studies and extracted the following information: first author’s name, year of publication, study design, total number of subjects, dietary assessment method, dietary patterns identified and food items with high factor loading in each dietary pattern, risk estimates with 95% CIs, covariates matched in the study design, or confounding factors of adjustment in the model. Two tools were applied to evaluate the quality of the included articles. For cross-sectional studies, we applied the Agency for Healthcare Research and Quality (AHRQ) to evaluate study quality (24). This tool consists of 11 domains. Each domain is awarded 1 point for a “Yes” answer and 0 points for “No” or “Unclear” answer. We classified assessment scores of 10–11, 6–9, and < 6 for good, fair, or poor quality of included studies, respectively. For case–control studies and cohort studies, the Newcastle-Ottawa Quality Assessment Scale (NOS) was applied to assess study quality (25). Briefly, this scale was assigned a total of nine stars with three domains, including four stars for selection, two stars for comparability, and three stars for outcomes. Studies that received <4 points represent poor, 4–7 represent fair, and 8–10 represent good; discrepancies in the extracted information and quality assessment were solved by discussion.
Statistical analysis
In our meta-analysis, RR and HR were considered approximations of OR (26–28). RR was substituted for PR and the prevalence of PR was used to convert RR to OR in the original studies (26). The random-effects model was applied for this meta-analysis because the model takes into account differences between studies and provides more conservative effects than fixed models (29). We applied I2 statistics to detect heterogeneity across included studies (I2 < 50%, low heterogeneity; I2 = 50–75%, medium heterogeneity; and I2 > 75%, significant heterogeneity) (30). To recognize potential sources of heterogeneity, we carried out subgroup analyses and meta-regression analyses with the following factors: study design, sample size, study quality, and adjustment for potential confounding factors (total energy intake, education level, and physical activity). Sensitivity analyses were also performed to detect the impact of single research on the summary effect value by removing one study from the whole analysis in each turn (31). Ultimately, the risk of publication bias was examined by visual inspection through funnel plots, Egger’s linear regression test (32), and Begg’s rank correlation (33). We used Cohen’s Kappa statistics to evaluate reviewers’ consistency in data extraction and quality assessment (34). Stata version 11.0 software (StataCorp, College Station, TX) was applied for statistical analyses of our meta-analyses. A two-tailed p < 0.05 was considered significant.
Results
Search results
Initially, we retrieved 10,316 potentially eligible literature from three electronic databases, including PubMed, Embase, and Web of Science three electronic databases. After excluding duplicate literature, 5,429 records remained. Of these, 5,410 records were deemed ineligible after screening titles and abstracts. Nineteen full-text records were further reviewed. Six records were ruled out because of the following exclusion criteria: did not show 95% CI and non-English literature (35–40). The remaining 13 eligible records were included in our analysis (14–21, 41–45) (Figure 1). According to kappa coefficients, the authors’ agreement rate for data extraction, selection, and quality assessment was 20%.
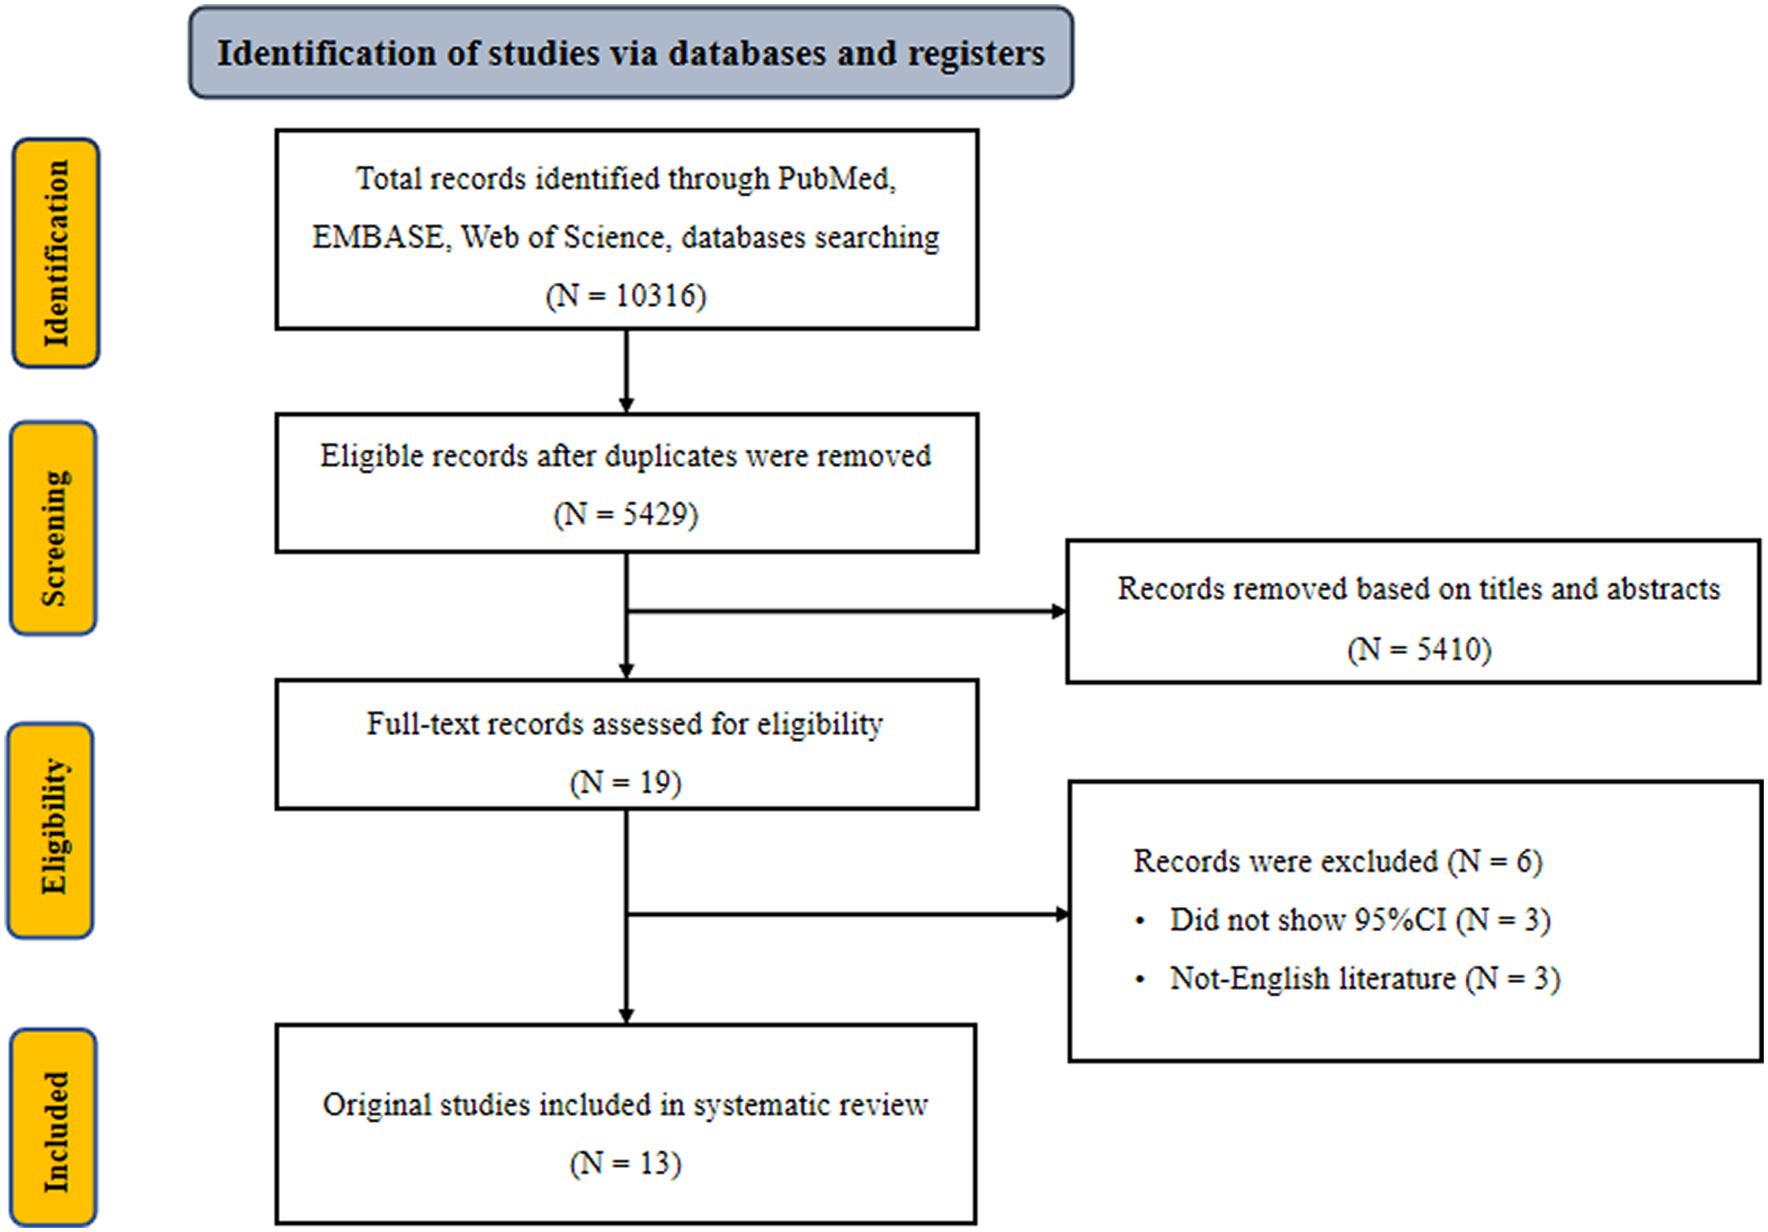
Figure 1. Flowchart of selection of studies for inclusion in meta-analysis on dietary pattern and hyperuricemia risk.
Study characteristics and quality assessment
The major characteristics of the original studies are shown in Table 1. All studies were conducted in China (14–21, 41–45). Two of these studies were cohort studies (17, 18), two were case–control studies (16, 41), and nine were cross-sectional studies (14, 15, 19–21, 42–45). All included studies were published from 2012 to 2023 and enrolled adults (18 years and over), with a total of 163,192 subjects. A validated food frequency questionnaire was used in the majority of studies (14–17, 19–21, 41–45), while the remaining studies used a 3-day 24-h food record (18). Table 2 lists the adjustment for confounders in the original studies. All included studies accounted for potentially important confounding factors like age, gender, etc. Several studies adjusted for additional confounding factors, such as education level (n = 9), total energy intake (n = 8), and physical activity (n = 7). Supplementary Tables S4–S6 summarized the results of the quality assessment of the included studies. Based on the NOS quality assessment, two cohort studies (17, 18) were rated as high quality, and two case–control studies (16, 41) were rated as medium quality. In line with the AHRQ quality evaluation, six studies were rated as good quality (16, 39, 41–44) and three studies were rated as fair quality (14, 15, 42–44).
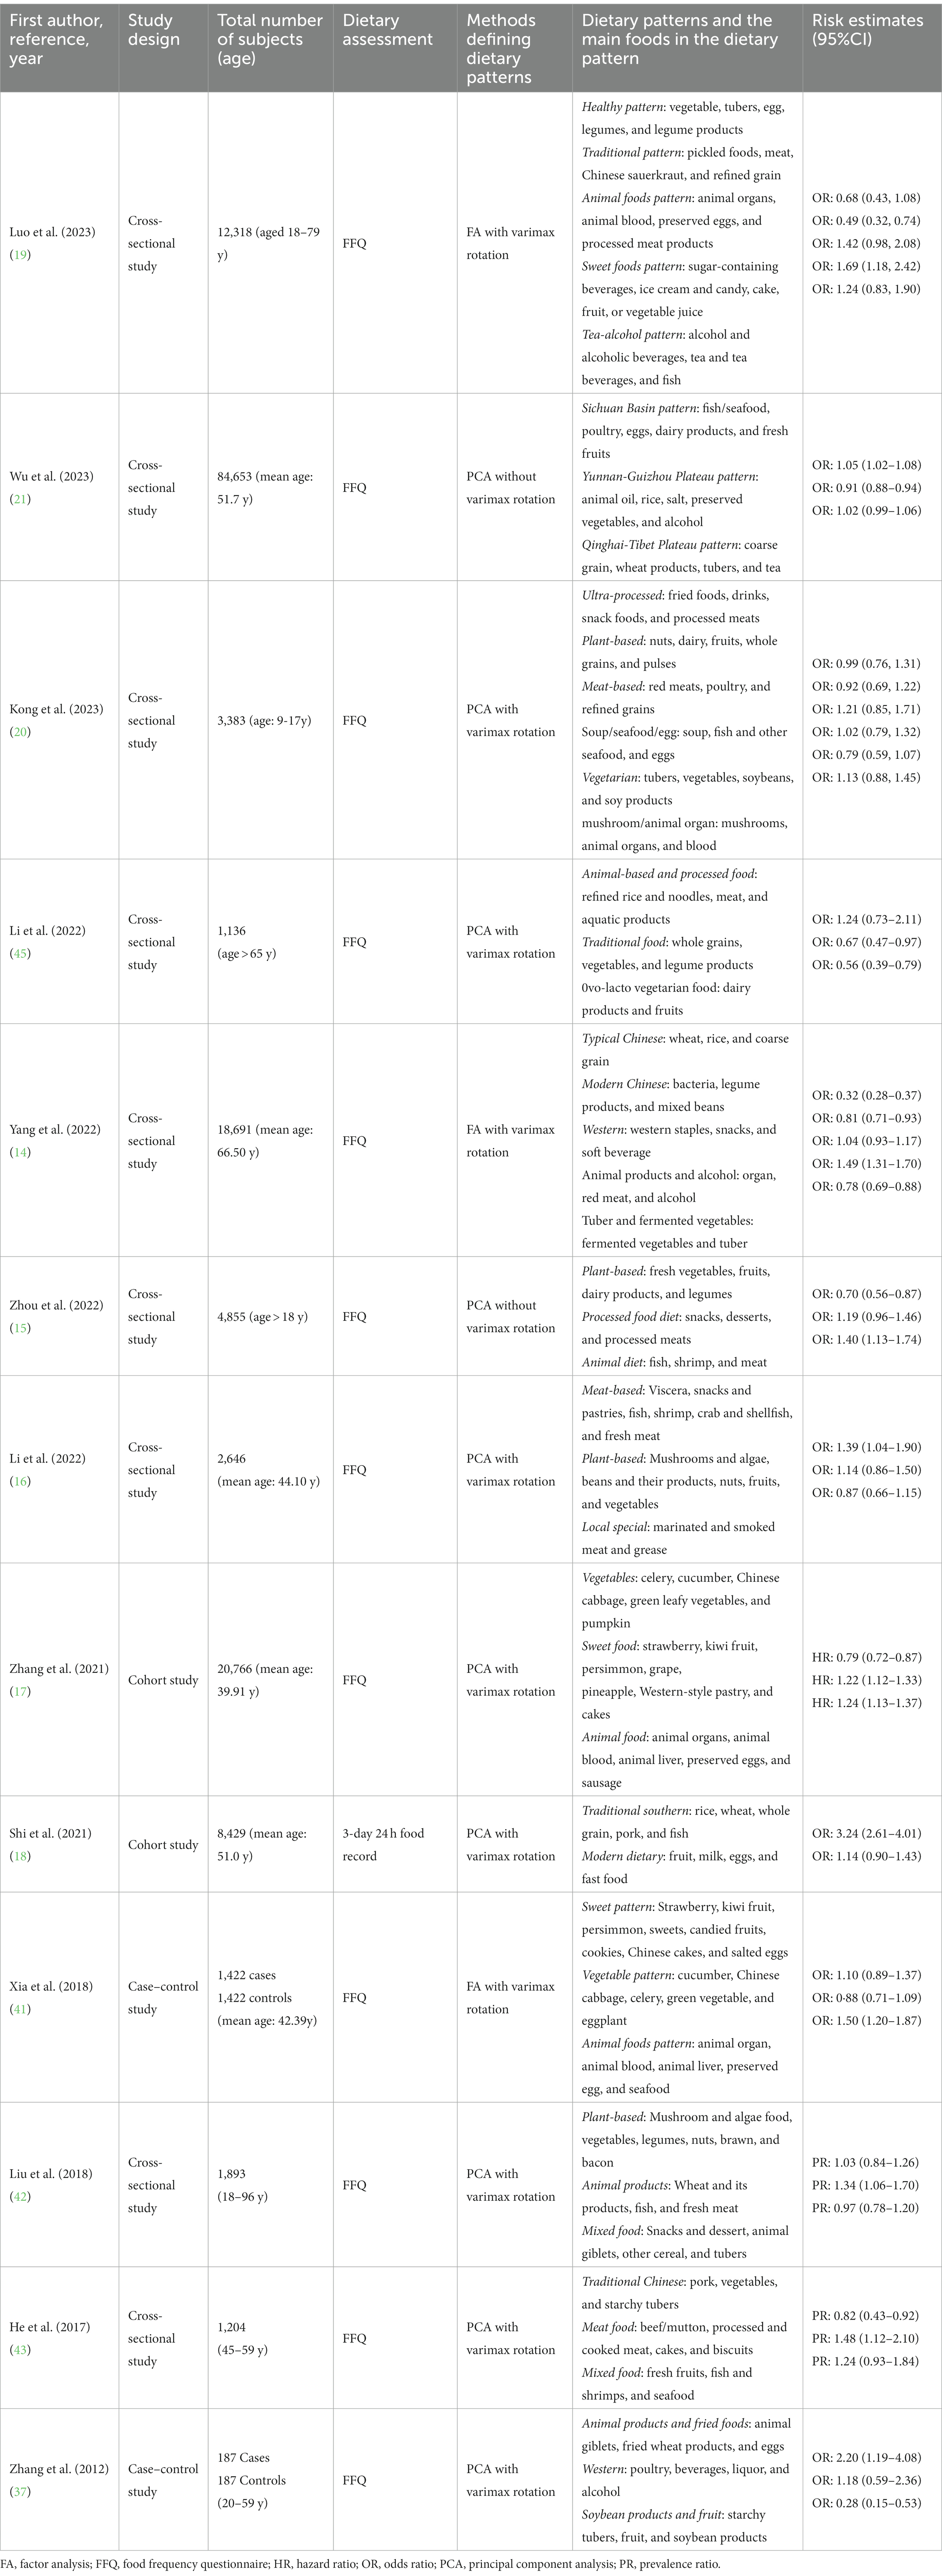
Table 1. Characteristics of included studies.
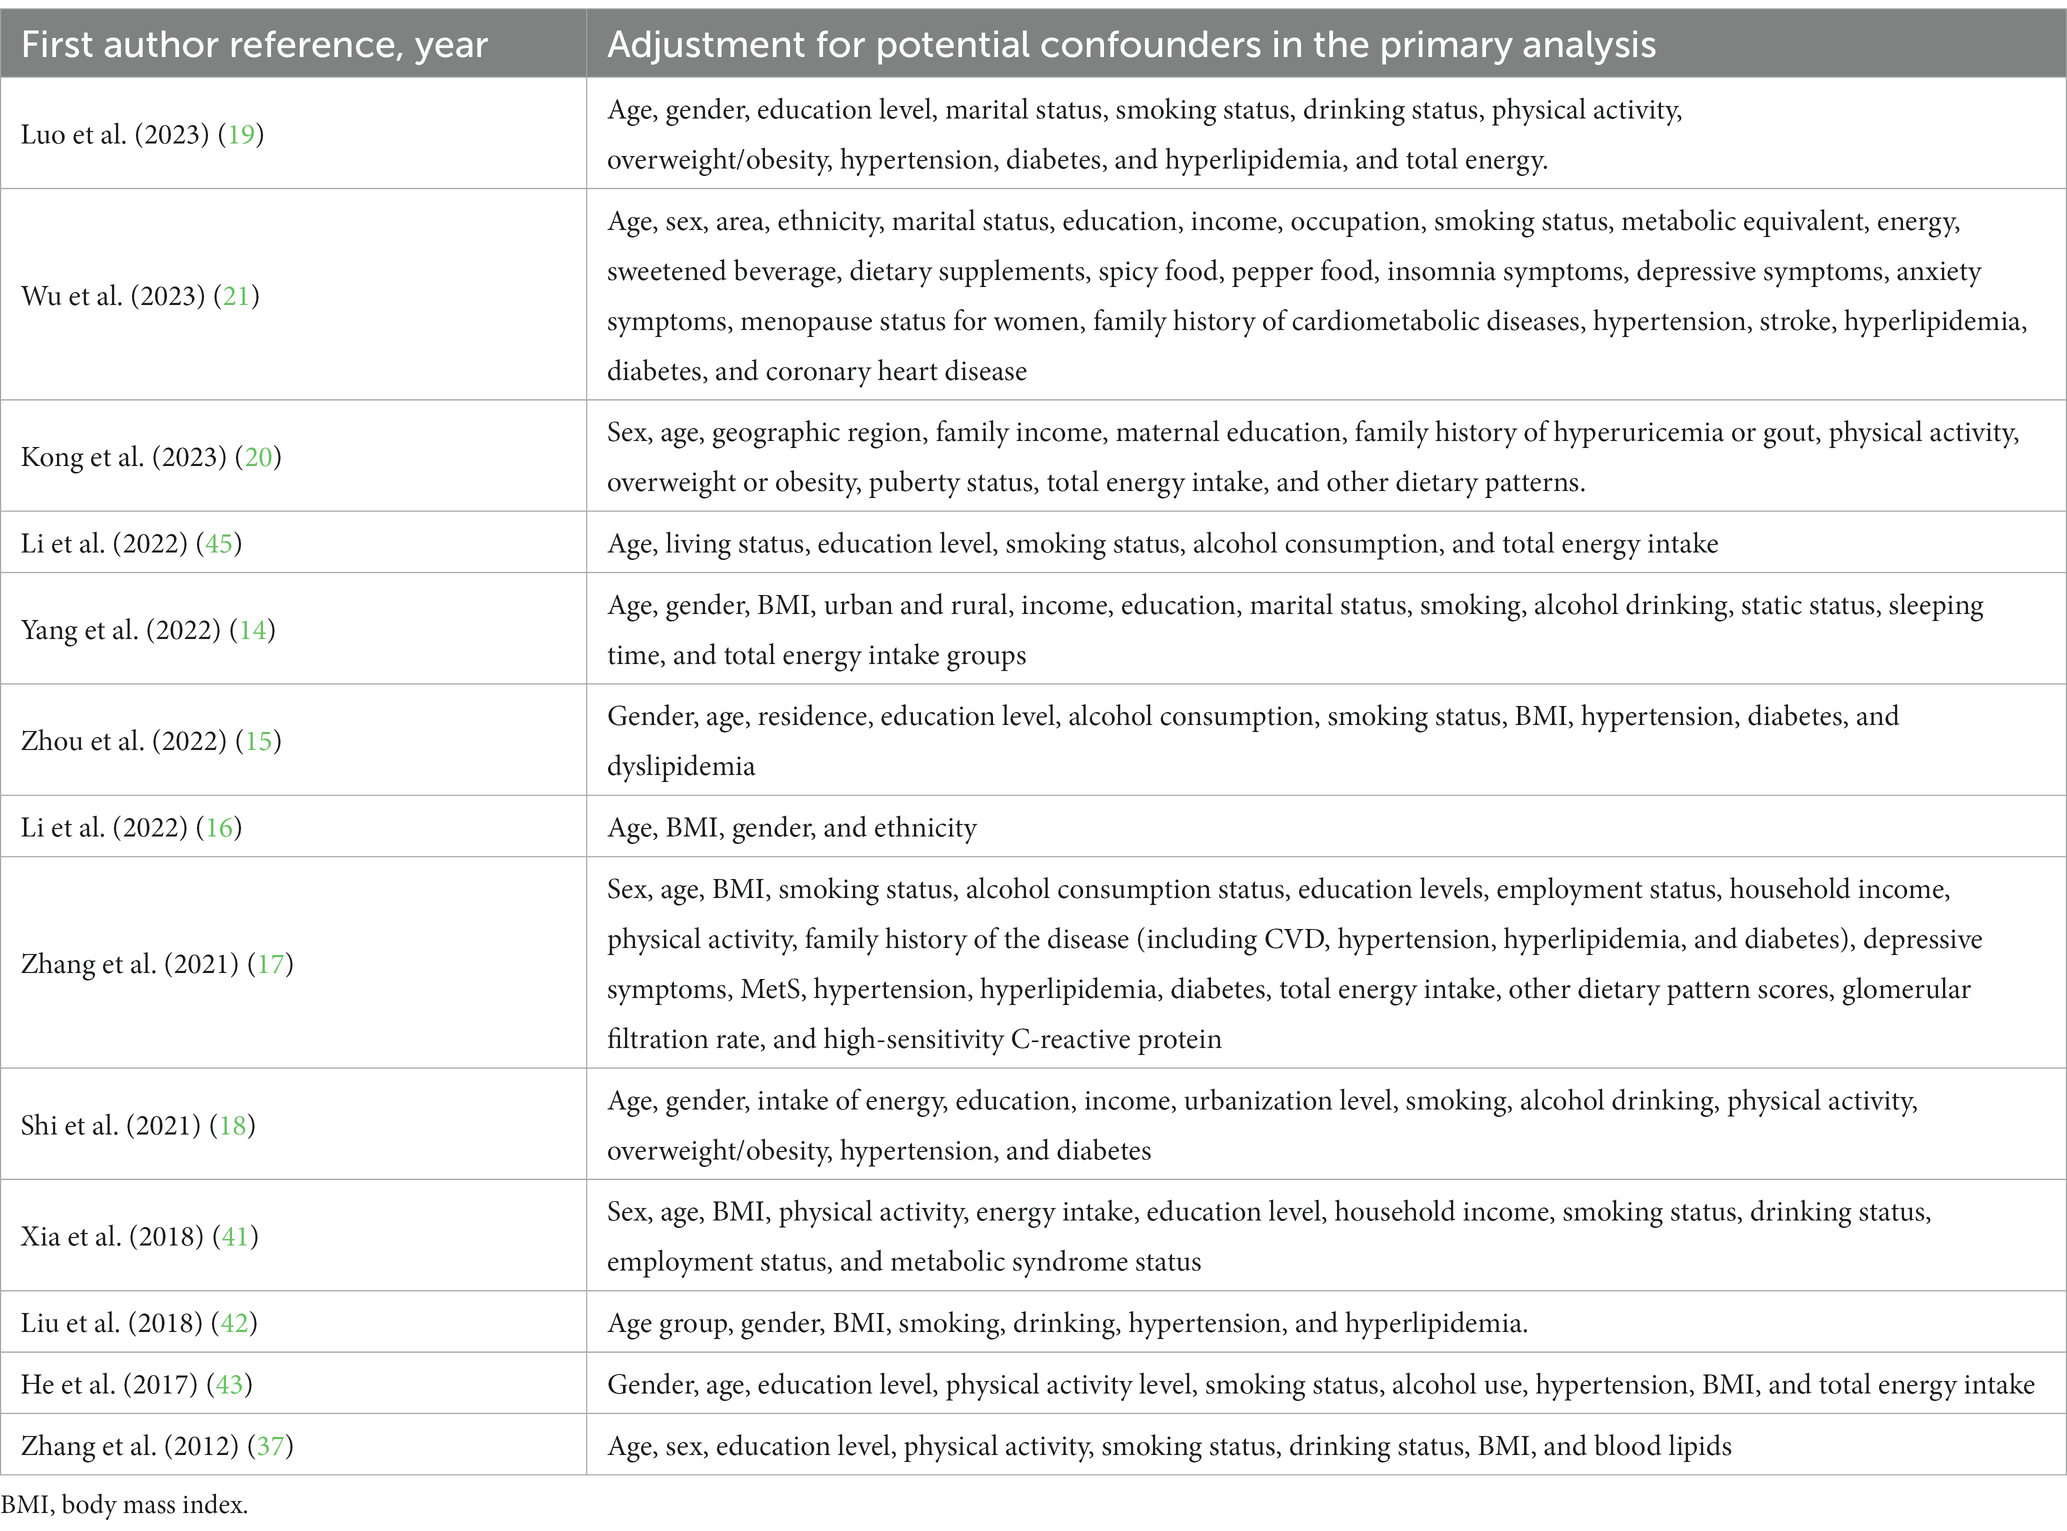
Table 2. Adjustment potential confounders of included studies.
Association between dietary pattern and hyperuricemia risk
In 11 studies (14–17, 19, 20, 41–45) assessing the association between animal-based food patterns and HUA risk, we observed that the highest adherence to animal-based food patterns was associated with the highest risk of HUA (Table 3). The overall OR was 1.36 (95%CI = 1.25–1.47) with low heterogeneity (I2 = 26.7%). Three studies (17, 19, 41) demonstrated that the highest adherence to sweet food patterns was significantly associated with an improved risk of HUA (OR = 1.24, 95%CI = 1.06–1.46, I2 = 0) (Table 3).
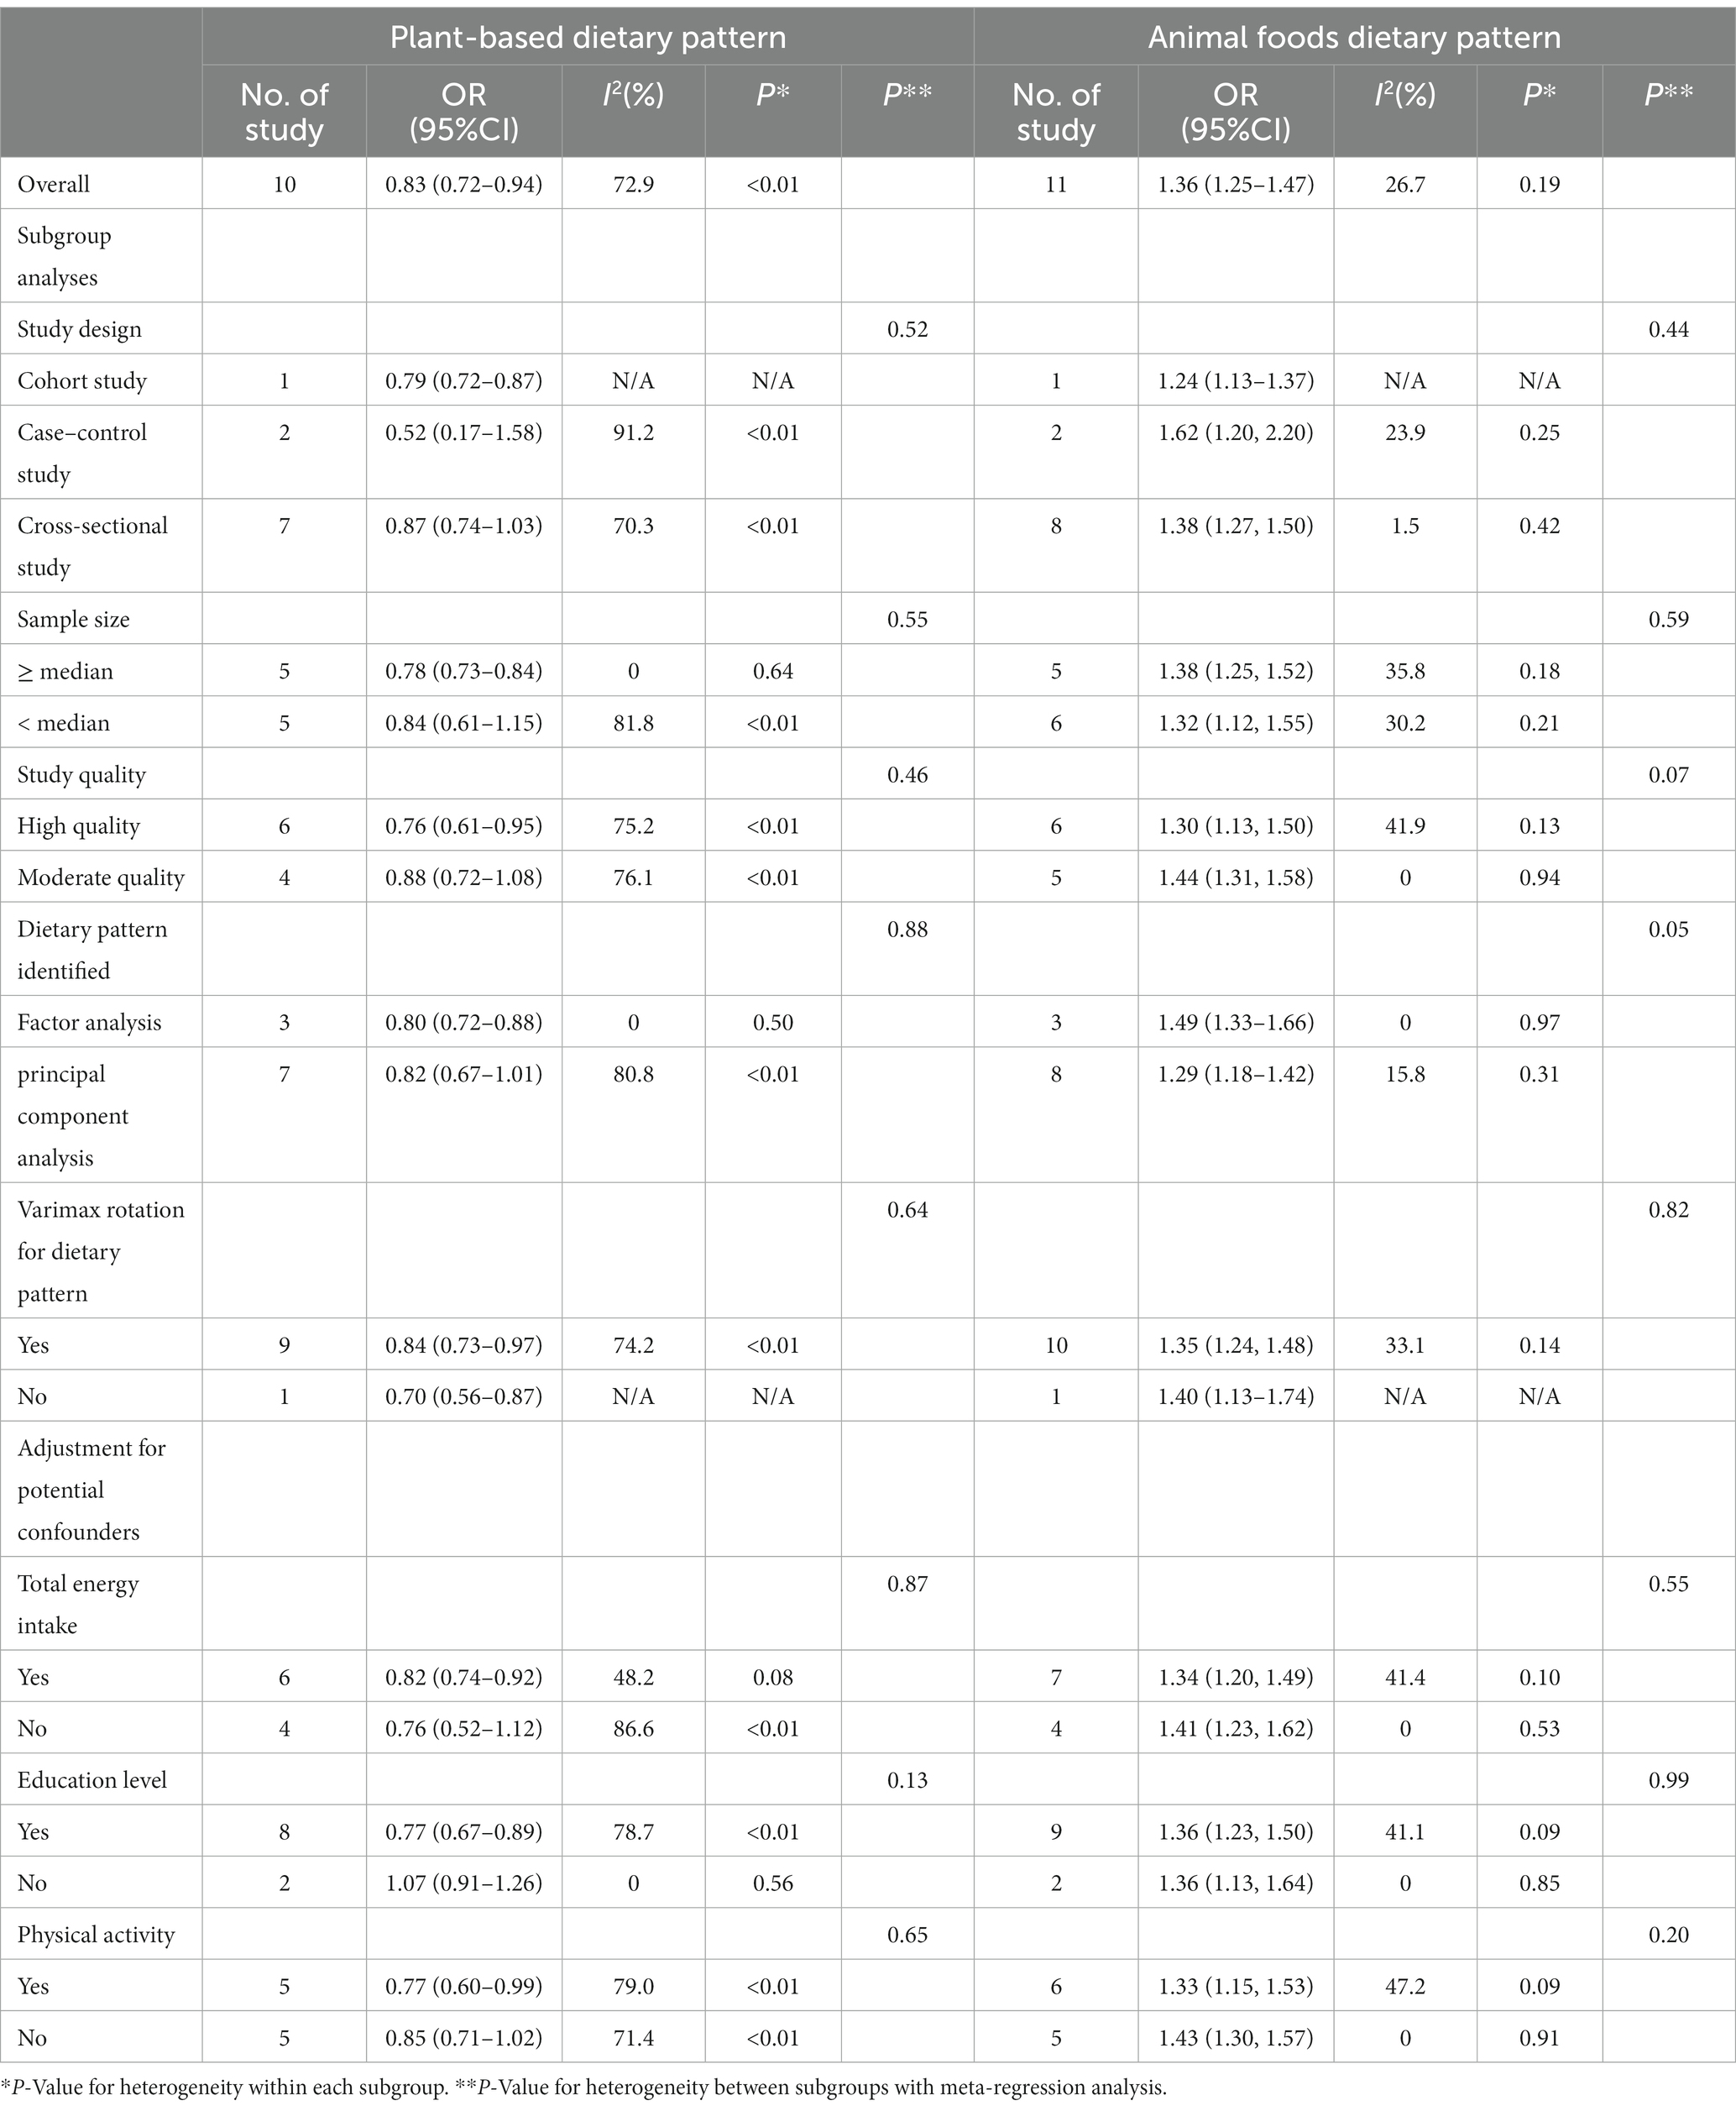
Table 3. Subgroup analyses for the association between dietary pattern and hyperuricemia risk.
Ten studies (15–17, 19, 20, 41, 42, 44, 45) were conducted to assess the association between plant-based patterns and HUA risk, and we observed that high adherence to plant-based dietary patterns was associated with a lower risk of HUA (OR = 0.83, 95% CI = 0.72–0.94, and I2 = 72.9%) (Figure 2). The comprehensive findings of subgroup analyses and meta-regression analyses of the association between plant-based patterns and HUA risk are shown in Table 3. Among the three subgroups of study design, cohort studies (OR = 0.79, 95% CI = 0.72–0.87) demonstrated an inverse association between adherence to plant-based dietary patterns and HUA risk, whereas case–control studies (OR = 0.52, 95% CI = 0.17–1.58) and cross-sectional studies (OR = 0.87, 95% CI = 0.74–1.03) indicated no statistical association. Subgroup analysis according to sample size and study quality revealed that higher adherence to plant-based patterns compared with lower adherence was associated with a lower risk of HUA in sample size ≥ median (OR = 0.78, 95%CI = 0.73–0.84) and high quality (OR = 0.76, 95%CI = 0.61–0.95) subgroup. Among subgroup analyses based on adjustment for potential confounders, we observed inverse correlations between higher adherence to plant-based dietary patterns and HUA risk in adjustment for total energy intake (OR = 0.82, 95%CI = 0.74–0.92), education level (OR = 0.77, 95%CI = 0.67–0.89), and physical activity (OR = 0.77, 95%CI = 0.60–0.99). Besides, there is no evidence of heterogeneity between the aforementioned subgroup analyses in the results of the meta-regression analysis. Furthermore, no publication bias was detected (Egger’s p = 0.83 and Begg’s p = 0.36; Figure 3). Sensitivity analysis showed no change in pooled estimates of the effect of plant-based patterns on the risk of HUA after successive exclusion of each article (Figure 4).
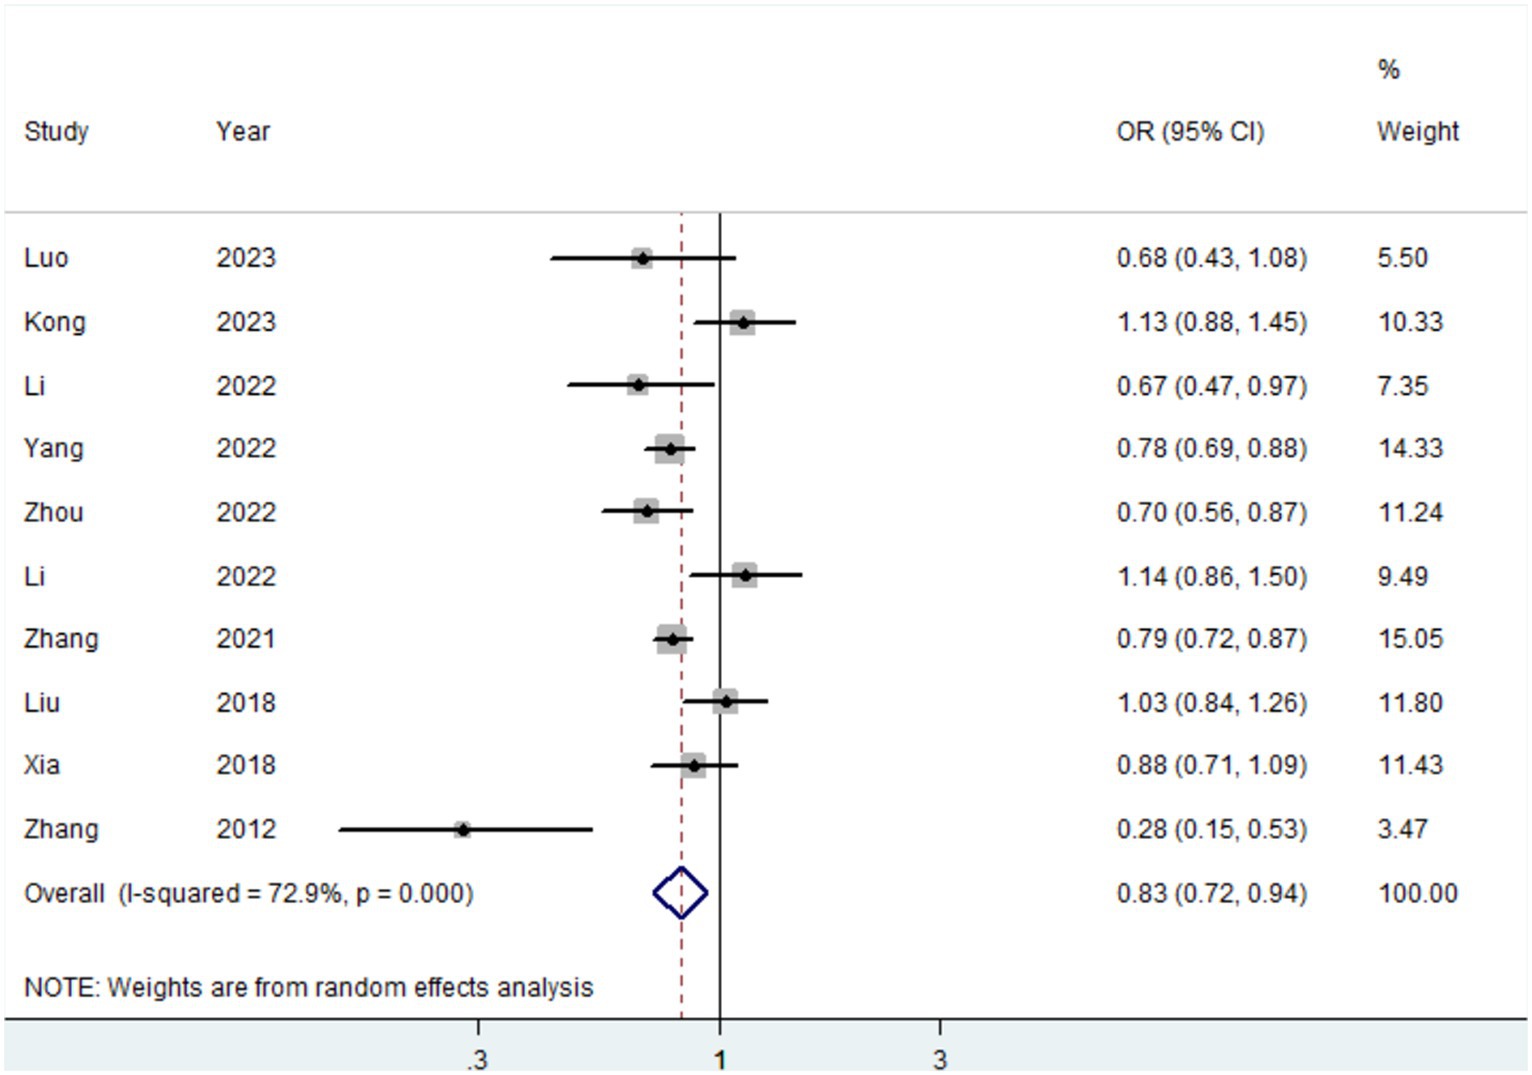
Figure 2. Forest plot (random-effects model) of dietary patterns with the risk of hyperuricemia.
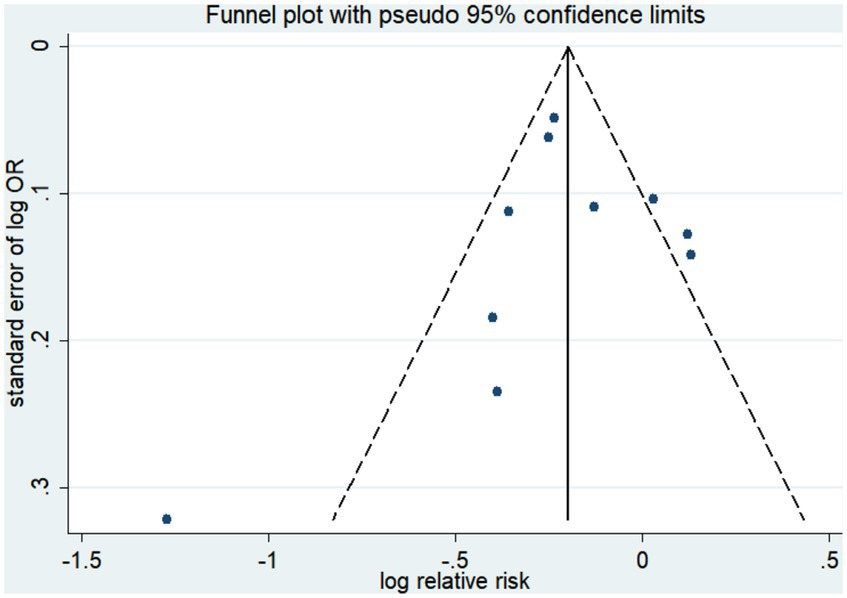
Figure 3. Funnel plot of publication biases of studies included in our meta-analysis focusing on the association between dietary patterns with the risk of hyperuricemia.
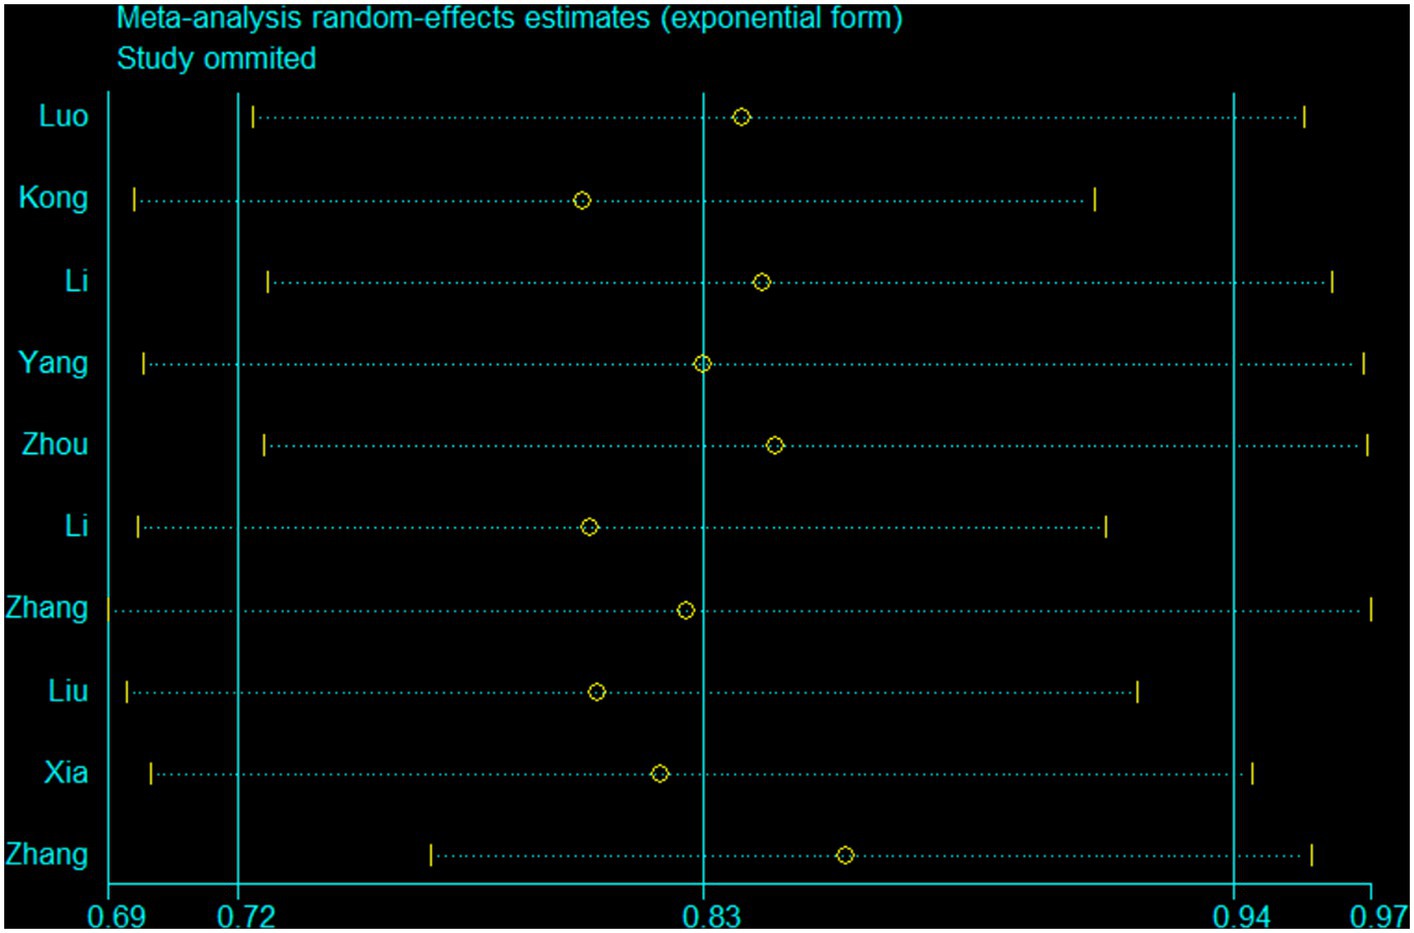
Figure 4. A sensitivity analysis was performed by removing each study in turn and recalculating the pooled odds ratio.
Discussion
Our meta-analysis with 163,192 participants was the most comprehensive topic to systematically evaluate the association between posteriori dietary patterns and HUA risk. Following the data analysis, the current evidence indicated that adherence to the plant-based pattern was associated with a reduced risk of HUA, while adherence to the animal-based food pattern and sweet food pattern was the opposite. No significant association was detected between modern dietary patterns and HUA risk.
The inverse association between the plant-based pattern and HUA risk was well established in subgroup analysis stratified by cohort study, sample size ≥ median, and dietary pattern identified in factor analysis. Some previous studies were consistent with the aforementioned findings (15, 17, 44). Furthermore, a meta-analysis of randomized controlled trials also indicated that DASH diet interventions similar to a plant-based pattern significantly reduced serum uric acid (46). However, several studies were disparate with the above inverse association (16, 41, 42). For example, a cross-sectional study including 2,646 subjects conducted by Li et al. found that plant-based pattern was not significantly associated with HUA risk (16). Another cross-sectional study performed by Liu et al. with 1,893 (42) and a case–control study including 187 cases and 187 controls performed by Xia et al. (41) had the same findings. Besides, two cross-sectional studies with large sample sizes also found that plant-based dietary patterns were not associated with the risk of HUA (19, 20). The difference in the main finding might be explained by the small sample size and poor quality of cross-sectional and case–control studies compared to cohort studies, which might be the source of heterogeneity of association between the plant-based pattern and HUA risk. Besides, in the subgroup analysis of dietary pattern identified methods, compared with factor analysis to determine dietary patterns, principal component analysis identified dietary patterns as a possible source of heterogeneity. Therefore, the aforementioned notions require stronger evidence by prospective studies with a large sample in the future.
There are a number of possible explanations or underlying biological mechanisms for the beneficial effect of the plant-based pattern in preventing HUA. Similar to the healthy Mediterranean pattern, the plant-food pattern is characterized by a high intake of fresh fruits, vegetables, legumes, and whole grains. Notably, high levels of vitamins like vitamin C, folate acid, and minerals in fruits and vegetables may be effective in preventing HUA (47–49). For example, since vitamin C and uric acid are reabsorbed via anion exchange transport in proximal tubules, the increase of vitamin C may compete with the reabsorption of uric acid (47, 48); folic acid may decrease uric acid production by deactivating the enzymes that oxidize hypoxanthine into xanthine (49). In addition, dietary fiber in fruits and vegetables and isoflavones in soy products had important benefits for a lower risk of HUA (50, 51). Dietary fiber promotes uric acid excretion by binding to uric acid in the gut (50). Soybean may decrease uric acid production by deactivating xanthine oxidoreductase, a key enzyme in the oxidation of hypoxanthine to xanthine (51). Magnesium is an essential mineral for the human body. A study conducted in 2020 found that plasma magnesium levels were inversely associated with the risk of HUA and increased uric acid concentrations (52). Therefore, we suppose that magnesium mainly reduces uric acid concentration by increasing the excretion of uric acid; however, the specific mechanism remains to be explored (52, 53). Copper is another essential trace mineral for humans. Copper and molybdenum have antagonistic effects. Therefore, the mechanism by which copper affects uric acid concentration is that copper inhibits the activity of xanthine oxidase and dehydrogenase, hindering the oxidation of purine to uric acid, and thereby reducing the concentration of serum uric acid (54).
Animal dietary patterns containing large amounts of animal organs, animal blood, and animal liver are associated with an increased risk of HUA. Overall results and subgroup analysis all supported the aforementioned findings. This association comes down to the following. First, animal-based food patterns are high in purines and the accumulation of purines leads to higher uric acid levels (41, 55). This potential mechanism was demonstrated in metabolic experiments in animals and humans that examined the effect of artificially short-term loading purified purines on serum uric acid levels (56). Second, a high intake of animal-based food patterns means a higher intake of energy, which in turn leads to obesity. It was found that in the general population, obesity or centripetal obesity were significantly positively correlated with HUA risk (57, 58). A study performed on participants with visceral fatty obesity showed that elevated uric acid levels were strongly influenced by their overproduction and reduced excretion and clearance of uric acid in the urine (59). In addition, visceral fat accumulation induces plasma-free fatty acids to flow into the living body and the hepatic portal vein, thereby stimulating triglyceride synthesis and subsequently leading to a related surge in uric acid production by activating the uric acid synthesis pathway (60, 61). Third, animal-based food patterns are high in pro-inflammatory nutrients. A previous study indicated that a high pro-inflammatory diet score was associated with an increased risk of HUA (62). HUA can be further caused by high uric acid production or abnormal excretion of uric acid under inflammatory conditions (62). Since the physiological mechanism of hyperuricemia caused by inflammation remains unclear, future studies should aim to address this topic.
The overall result demonstrated that greater adherence to sweet food patterns was significantly positively linked with an increased risk of HUA. A prospective cohort study including 20,766 subjects also revealed a positive association between greater adherence to the sweet food pattern and an increased risk of HUA (OR = 1.69, 95% CI: 1.18–2.42) (17). Moreover, Luo et al. conducted a cross-sectional study involving 12,318 subjects and observed that subjects with greater adherence to sweet food patterns had an improved risk of HUA (41). However, a case–control study (including 1,422 controls and 1,422 cases) conducted by Xia et al. indicated that there is no significant association between sweet food dietary patterns and HUA (37). We consider that the inconsistencies are mainly due to differences in overall variance. Xia et al. explained 22.6% variance, which is slightly lower than Luo et al. and Zhang et al., which, respectively, explained 38.93 and 29.2% of the overall variance. The potential mechanism by how sweet food patterns are associated with an improved risk of HUA may be brought down to fructose in sweet foods. Fructose metabolism converts adenosine triphosphate to inosine monophosphate, which activates the catabolic pathway that leads to the production of uric acid (63, 64). Experimental studies in humans and animals have indicated a short-term increase in uric acid concentrations following fructose intake or infusion (63, 65). Besides, studies have suggested that excessive fructose intake can alter the composition of the gut microbiota, which in turn affects UA metabolism (66).
Several strengths are worth to be highlighted for our meta-analysis. First, as far as we know, our topic is the most comprehensive one to systematically summarize and analyze the associations between a variety of posteriori dietary patterns and HUA risk. Moreover, we conducted a diverse array of subgroup analyses, like dietary pattern identified methods, varimax rotation for dietary pattern, and confounding factors adjustment to further explore the sources of heterogeneity. Second, a rigorous literature search, study selection, and data extraction were performed by two independent authors and the original articles included in this meta-analysis are all medium-high quality literature, which makes the results more reliable. Third, sensitivity analysis and meta-regression analyses were conducted according to the characteristics of the study and the adjustment of major confounding variables to detect the robustness of the results.
Nevertheless, some caveats deserve to be outlined for our analyses. First, our meta-analysis included a total of five cross-sectional studies, and due to the nature of cross-sectional studies, the causal relationship between dietary patterns and HUA is limited. Second, dietary assessment is done using the food frequency questionnaire or 24-h food record, so there is an inevitable recall bias. Third, in the original studies, subgroup analyses on gender, age, region, and HUA type were rarely performed, which resulted in limited secondary analysis results. Fourth, despite the protective effect observed in the plant-based pattern, there was considerable heterogeneity, and further studies need to explore the source of heterogeneity. Fifth is the inherent nature of observational studies. Although the included studies have adjusted for a large number of confounding factors, other residual confounding factors are inevitable. Lastly, only published literature was included and analyzed, while other unpublished and gray literature content that meets our criteria might be neglected.
Conclusion
Our meta-analysis reveals that adherence to the plant-based pattern is a beneficial factor for HUA risk, while adherence to the animal-based food pattern and sweet pattern is an unfavorable factor. Future high-quality studies with larger sample sizes and longer follow-up periods are needed to further validate our findings.
Author contributions
Z-YW, Y-FW, and W-PJ collection of data. Z-YW, Y-FW, Y-HS, and W-PJ wrote the first draft of the manuscript and edited the manuscript. All authors contributed to the article and approved the submitted version.
Conflict of interest
The authors declare that the research was conducted in the absence of any commercial or financial relationships that could be construed as a potential conflict of interest.
Publisher’s note
All claims expressed in this article are solely those of the authors and do not necessarily represent those of their affiliated organizations, or those of the publisher, the editors and the reviewers. Any product that may be evaluated in this article, or claim that may be made by its manufacturer, is not guaranteed or endorsed by the publisher.
Supplementary material
The Supplementary material for this article can be found online at: https://www.frontiersin.org/articles/10.3389/fnut.2024.1218912/full#supplementary-material
References
2. Chinese multidisciplinary expert consensus on the diagnosis and treatment of hyperuricemia and related diseases. Chin Med J. (2017) 130:2473–88. doi: 10.4103/0366-6999.216416
3. Chen-Xu, M, Yokose, C, Rai, SK, Pillinger, MH, and Choi, HK. Contemporary prevalence of gout and hyperuricemia in the United States and decadal trends: the National Health and nutrition examination survey, 2007-2016. Arthritis Rheumatol. (2019) 71:991–9. doi: 10.1002/art.40807
4. Li, Y, Shen, Z, Zhu, B, Zhang, H, Zhang, X, and Ding, X. Demographic, regional and temporal trends of hyperuricemia epidemics in mainland China from 2000 to 2019: a systematic review and meta-analysis. Glob Health Action. (2021) 14:1874652. doi: 10.1080/16549716.2021.1874652
5. Raja, S, Kumar, A, Aahooja, RD, Thakuria, U, Ochani, S, and Shaukat, F. Frequency of hyperuricemia and its risk factors in the adult population. Cureus J Med Sci. (2019) 11:e4198. doi: 10.7759/cureus.4198
6. Zhang, T, Gu, Y, Meng, G, Zhang, Q, Liu, L, Wu, H, et al. Genetic risk, adherence to a healthy lifestyle, and hyperuricemia: the TCLSIH cohort study. Am J Med. (2023) 136:476–483.e5. doi: 10.1016/j.amjmed.2023.01.004
7. Kostka-Jeziorny, K, Widecka, K, and Tykarski, A. Study of epidemiological aspects of hyperuricemia in Poland. Cardiol J. (2019) 26:241–52. doi: 10.5603/CJ.a2019.0034
8. Liu, JH, Ma, QH, Xu, Y, Chen, X, and Pan, CW. Metabolic syndrome and 5-year incident hyperuricemia among older Chinese adults: a community-based cohort study. Diabet Metab Synd Obes. (2020) 13:4191–200. doi: 10.2147/DMSO.S278542
9. Qiu, L, Cheng, XQ, Wu, J, Liu, JT, Xu, T, Ding, HT, et al. Prevalence of hyperuricemia and its related risk factors in healthy adults from northern and northeastern Chinese provinces. BMC Public Health. (2013) 13:664. doi: 10.1186/1471-2458-13-664
10. Zykova, SN, Storhaug, HM, Toft, I, Chadban, SJ, Jenssen, TG, and White, SL. Cross-sectional analysis of nutrition and serum uric acid in two Caucasian cohorts: the AusDiab study and the Tromso study. Nutr J. (2015) 14:49. doi: 10.1186/s12937-015-0032-1
11. Playdon, MC, Nagle, CM, Ibiebele, TI, Ferrucci, LM, Protani, MM, Carter, J, et al. Pre-diagnosis diet and survival after a diagnosis of ovarian cancer. Brit J Cancer. (2017) 116:1627–37. doi: 10.1038/bjc.2017.120
12. Thome, R, and Dias, DAM. Foreign bodies in the lower air passages in children: report of 470 cases. Rev Paul Med. (1975) 85:66–8.
13. Kant, AK. Dietary patterns and health outcomes. J Am Diet Assoc. (2004) 104:615–35. doi: 10.1016/j.jada.2004.01.010
14. Yang, Y, Piao, W, Huang, K, Fang, H, Ju, L, Zhao, L, et al. Dietary pattern associated with the risk of hyperuricemia in Chinese elderly: result from china nutrition and health surveillance 2015–2017. Nutrients. (2022) 14:844. doi: 10.3390/nu14040844
15. Zhou, M, Huang, X, Li, R, Zhang, Z, Zhang, L, Gao, X, et al. Association of dietary patterns with blood uric acid concentration and hyperuricemia in northern Chinese adults. Nutr J. (2022) 21:42. doi: 10.1186/s12937-022-00789-7
16. Li, T, Li, S, Tian, T, Nie, Z, Xu, W, Liu, L, et al. Association and interaction between dietary patterns and gene polymorphisms in Liangshan residents with hyperuricemia. Sci Rep. (2022) 12:1356. doi: 10.1038/s41598-021-04568-y
17. Zhang, T, Rayamajhi, S, Meng, G, Zhang, Q, Liu, L, Wu, H, et al. Dietary patterns and risk for hyperuricemia in the general population: results from the TCLSIH cohort study. Nutrition. (2022) 93:111501. doi: 10.1016/j.nut.2021.111501
18. Shi, Z. Cadmium intake, dietary patterns and hyperuricemia among adults in China. Expos Health. (2021) 13:219–27. doi: 10.1007/s12403-020-00375-4
19. Luo, M, Liu, T, Ju, H, Xia, Y, Ji, C, and Zhao, Y. Association between dietary patterns and chronic kidney disease combined with hyperuricemia. Food Funct. (2024) 15:255–64. doi: 10.1039/d3fo03354f
20. Kong, B, Liu, F, Zhang, S, Wu, Y, Li, Y, Xiong, J, et al. Associations between dietary patterns and serum uric acid concentrations in children and adolescents: a cross-sectional study. Food Funct. (2023) 14:9803–14. doi: 10.1039/d3fo03043a
21. Wu, X, Tang, W, Tang, D, Hu, Y, Zhang, N, Dai, S, et al. Two a posteriori dietary patterns are associated with risks of hyperuricemia among adults in less-developed multiethnic regions in Southwest China. Nutr Res. (2023) 110:96–107. doi: 10.1016/j.nutres.2022.12.012
22. Stroup, DF, Berlin, JA, Morton, SC, Olkin, I, Williamson, GD, Rennie, D, et al. Meta-analysis of observational studies in epidemiology: a proposal for reporting. Meta-analysis of observational studies in epidemiology (MOOSE) group. JAMA. (2000) 283:2008–12. doi: 10.1001/jama.283.15.2008
23. Moher, D, Liberati, A, Tetzlaff, J, and Altman, DG. Preferred reporting items for systematic reviews and meta-analyses: the PRISMA statement. PLoS Med. (2009) 6:e1000097. doi: 10.1371/journal.pmed.1000097
24. Miller, F, Vandome, A, and Mcbrewster, J. Agency for healthcare research and quality. In: International Conference of the IEEE Engineering in Medicine & Biology Society; Piscataway: IEEE (2002).
25. Wells, G, Shea, B, O'Connell, D, Peterson, J, Welch, V, and Losos, M. The Newcastle-Ottawa scale (NOS) for assessing the quality of non-randomised studies in meta-analyses. (2013).
26. Zhang, J, and Yu, KF. What's the relative risk? A method of correcting the odds ratio in cohort studies of common outcomes. JAMA. (1998) 280:1690–1. doi: 10.1001/jama.280.19.1690
27. Jiang, YT, Gong, TT, Zhang, JY, Li, XQ, Gao, S, Zhao, YH, et al. Infertility and ovarian cancer risk: evidence from nine prospective cohort studies. Int J Cancer. (2020) 147:2121–30. doi: 10.1002/ijc.33012
28. Liu, YS, Wu, QJ, Xia, Y, Zhang, JY, Jiang, YT, Chang, Q, et al. Carbohydrate intake and risk of metabolic syndrome: a dose-response meta-analysis of observational studies. Nutr Metab Cardiovas. (2019) 29:1288–98. doi: 10.1016/j.numecd.2019.09.003
29. Sofi, F, Cesari, F, Abbate, R, Gensini, GF, and Casini, A. Adherence to Mediterranean diet and health status: meta-analysis. BMJ. (2008) 337:a1344. doi: 10.1136/bmj.a1344
30. Higgins, JP, and Thompson, SG. Quantifying heterogeneity in a meta-analysis. Stat Med. (2002) 21:1539–58. doi: 10.1002/sim.1186
31. Trikalinos, TA, Salanti, G, Khoury, MJ, and Ioannidis, JP. Impact of violations and deviations in hardy-Weinberg equilibrium on postulated gene-disease associations. Am J Epidemiol. (2006) 163:300–9. doi: 10.1093/aje/kwj046
32. Egger, M, Davey, SG, Schneider, M, and Minder, C. Bias in meta-analysis detected by a simple, graphical test. BMJ. (1997) 315:629–34. doi: 10.1136/bmj.315.7109.629
33. Begg, CB, and Mazumdar, M. Operating characteristics of a rank correlation test for publication bias. Biometrics. (1994) 50:1088–101. doi: 10.2307/2533446
34. Roberts, C. Modelling patterns of agreement for nominal scales. Stat Med. (2008) 27:810–30. doi: 10.1002/sim.2945
35. Gao, Y, Cui, LF, Sun, YY, Yang, WH, Wang, JR, Wu, SL, et al. Adherence to the dietary approaches to stop hypertension diet and hyperuricemia: a cross-sectional study. Arthrit Care Res. (2021) 73:603–11. doi: 10.1002/acr.24150
36. Liu, X, Li, S, and Huang, S. Association between dietary pattern and hyperuricemia among adult residents in Liangshan prefecture of Sichuan province. China J Public Health. (2020) 36:1297–301.
37. Guasch-Ferré, M, Bulló, M, Babio, N, Martínez-González, MA, Estruch, R, Covas, MI, et al. Mediterranean diet and risk of hyperuricemia in elderly participants at high cardiovascular risk. J Gerontol. (2013) 68:1263–70. doi: 10.1093/gerona/glt028
38. Nie, J, Deng, MG, Wang, K, Liu, F, Xu, H, Feng, Q, et al. Higher HEI-2015 scores are associated with lower risk of gout and hyperuricemia: results from the national health and nutrition examination survey 2007-2016. Front Nutr. (2022) 9:921550. doi: 10.3389/fnut.2022.921550
39. Zhou, H, Ma, ZF, Lu, Y, Du, Y, Shao, J, Wang, L, et al. Elevated serum uric acid, hyperuricaemia and dietary patterns among adolescents in mainland China. J Pediatr Endocr Met. (2020) 33:487–93. doi: 10.1515/jpem-2019-0265
40. Chrysohoou, C, Skoumas, J, Pitsavos, C, Masoura, C, Siasos, G, Galiatsatos, N, et al. Long-term adherence to the Mediterranean diet reduces the prevalence of hyperuricaemia in elderly individuals, without known cardiovascular disease: the Ikaria study. Maturitas. (2011) 70:58–64. doi: 10.1016/j.maturitas.2011.06.003
41. Xia, Y, Xiang, Q, Gu, Y, Jia, S, Zhang, Q, Liu, L, et al. A dietary pattern rich in animal organ, seafood and processed meat products is associated with newly diagnosed hyperuricaemia in Chinese adults: a propensity score-matched case-control study. Brit J Nutr. (2018) 119:1177–84. doi: 10.1017/S0007114518000867
42. Liu, X, Huang, S, Xu, W, Zhou, A, Li, H, Zhang, R, et al. Association of dietary patterns and hyperuricemia: a cross-sectional study of the Yi ethnic group in China. Food Nutr Res. (2018) 62. doi: 10.29219/fnr.v62.1380
43. He, F, Wang, LL, and Yu, XL. Dietary patterns associated hyperuricemia among Chinese aged 45 to 59 years: an observational study. Medicine. (2017) 96:e9248. doi: 10.1097/MD.0000000000009248
44. Zhang, M, Chang, H, Gao, Y, Wang, X, Xu, W, Liu, D, et al. Major dietary patterns and risk of asymptomatic hyperuricemia in Chinese adults. J Nutr Sci Vitaminol. (2012) 58:339–45. doi: 10.3177/jnsv.58.339
45. Li, T, Xie, J, Shuai, P, Huang, J, and He, B. Dietary patterns, skeletal muscle mass loss, and cardiovascular risk among elderly men: a preliminary cross-sectional study in Sichuan province. Environ Res. (2022) 208:112719. doi: 10.1016/j.envres.2022.112719
46. Gohari, S, Ghobadi, S, Jafari, A, Ahangar, H, Gohari, S, and Mahjani, M. The effect of dietary approaches to stop hypertension and ketogenic diets intervention on serum uric acid concentration: a systematic review and meta-analysis of randomized controlled trials. Sci Rep. (2023) 13:10492. doi: 10.1038/s41598-023-37672-2
47. Gao, X, Curhan, G, Forman, JP, Ascherio, A, and Choi, HK. Vitamin C intake and serum uric acid concentration in men. J Rheumatol. (2008) 35:1853–8.
48. Huang, HY, Appel, LJ, Choi, MJ, Gelber, AC, Charleston, J, Norkus, EP, et al. The effects of vitamin C supplementation on serum concentrations of uric acid: results of a randomized controlled trial. Arthritis Rheum. (2005) 52:1843–7. doi: 10.1002/art.21105
49. Zhang, Y, and Folate, QH. Vitamin B6 and vitamin B12 intake in relation to hyperuricemia. J Clin Med. (2018) 7:7. doi: 10.3390/jcm7080210
50. Sun, Y, Sun, J, Zhang, P, Zhong, F, Cai, J, and Ma, A. Association of dietary fiber intake with hyperuricemia in U.S. adults. Food Funct. (2019) 10:4932–40. doi: 10.1039/c8fo01917g
51. Li, Y, Frenz, CM, Li, Z, Chen, M, Wang, Y, Li, F, et al. Virtual and in vitro bioassay screening of phytochemical inhibitors from flavonoids and isoflavones against xanthine oxidase and cyclooxygenase-2 for gout treatment. Chem Biol Drug Des. (2013) 81:537–44. doi: 10.1111/cbdd.1248
52. Cao, J, Zhang, J, Zhang, Y, Li, H, Jiang, C, Lin, T, et al. Plasma magnesium and the risk of new-onset hyperuricaemia in hypertensive patients. Brit J Nutr. (2020) 124:156–63. doi: 10.1017/S0007114520001099
53. Zou, F, Zhao, X, and Wang, F. A review on the fruit components affecting uric acid level and their underlying mechanisms. J Food Biochem. (2021) 45:e13911. doi: 10.1111/jfbc.13911
54. Li, LZ, Zhou, GX, Li, J, Jiang, W, Liu, BL, and Zhou, W. Compounds containing trace element copper or zinc exhibit as potent hyperuricemia inhibitors via xanthine oxidase inactivation. J Trace Elem Med Biol. (2018) 49:72–8. doi: 10.1016/j.jtemb.2018.04.019
55. Kaneko, K, Takayanagi, F, Fukuuchi, T, Yamaoka, N, Yasuda, M, Mawatari, KI, et al. Determination of total purine and purine base content of 80 food products to aid nutritional therapy for gout and hyperuricemia. Nucleosides Nucleotides. (2020) 39:1449–57. doi: 10.1080/15257770.2020.1748197
56. Schlesinger, N. Dietary factors and hyperuricaemia. Curr Pharm Desig. (2005) 11:4133–8. doi: 10.2174/138161205774913273
57. Ali, N, Perveen, R, Rahman, S, Mahmood, S, Rahman, S, Islam, S, et al. Prevalence of hyperuricemia and the relationship between serum uric acid and obesity: a study on Bangladeshi adults. PLoS One. (2018) 13:e0206850. doi: 10.1371/journal.pone.0206850
58. Shirasawa, T, Ochiai, H, Yoshimoto, T, Nagahama, S, Watanabe, A, Yoshida, R, et al. Cross-sectional study of associations between normal body weight with central obesity and hyperuricemia in Japan. BMC Endocr Disord. (2020) 20:2. doi: 10.1186/s12902-019-0481-1
59. Matsuura, F, Yamashita, S, Nakamura, T, Nishida, M, Nozaki, S, Funahashi, T, et al. Effect of visceral fat accumulation on uric acid metabolism in male obese subjects: visceral fat obesity is linked more closely to overproduction of uric acid than subcutaneous fat obesity. Metabolism. (1998) 47:929–33. doi: 10.1016/s0026-0495(98)90346-8
60. Nakanishi, N, Yoshida, H, Nakamura, K, Suzuki, K, and Tatara, K. Predictors for development of hyperuricemia: an 8-year longitudinal study in middle-aged Japanese men. Metabolism. (2001) 50:621–6. doi: 10.1053/meta.2001.24196
61. Fabregat, I, Revilla, E, and Machado, A. Short-term control of the pentose phosphate cycle by insulin could be modulated by the NADPH/NADP ratio in rat adipocytes and hepatocytes. Biochem Biophys Res Commun. (1987) 146:920–5. doi: 10.1016/0006-291x(87)90618-8
62. Kim, HS, Kwon, M, Lee, HY, Shivappa, N, Hebert, JR, Sohn, C, et al. Higher pro-inflammatory dietary score is associated with higher hyperuricemia risk: results from the case-controlled Korean genome and epidemiology study_Cardiovascular disease association Study. Nutrients. (2019) 11:11. doi: 10.3390/nu11081803
63. Fox, IH, and Kelley, WN. Studies on the mechanism of fructose-induced hyperuricemia in man. Metabolism. (1972) 21:713–21. doi: 10.1016/0026-0495(72)90120-5
64. Sayehmiri, K, Ahmadi, I, and Anvari, E. Fructose feeding and hyperuricemia: a systematic review and Meta-analysis. Clin Nutr Res. (2020) 9:122–33. doi: 10.7762/cnr.2020.9.2.122
65. Dalbeth, N, House, ME, Gamble, GD, Horne, A, Pool, B, Purvis, L, et al. Population-specific influence of SLC2A9 genotype on the acute hyperuricaemic response to a fructose load. Ann Rheum Dis. (2013) 72:1868–73. doi: 10.1136/annrheumdis-2012-202732
Keywords: dietary pattern, hyperuricemia, meta-analysis, risk, systematic review
Citation: Wen Z-Y, Wei Y-F, Sun Y-H and Ji W-P (2024) Dietary pattern and risk of hyperuricemia: an updated systematic review and meta-analysis of observational studies. Front. Nutr. 11:1218912. doi: 10.3389/fnut.2024.1218912
Edited by:
Abraham Wall-Medrano, Universidad Autónoma de Ciudad Juárez, MexicoReviewed by:
Til Basnet, Til Bahadur Basnet, NepalMahsa Mahjani, Shahid Beheshti University of Medical Sciences, Iran
Copyright © 2024 Wen, Wei, Sun and Ji. This is an open-access article distributed under the terms of the Creative Commons Attribution License (CC BY). The use, distribution or reproduction in other forums is permitted, provided the original author(s) and the copyright owner(s) are credited and that the original publication in this journal is cited, in accordance with accepted academic practice. No use, distribution or reproduction is permitted which does not comply with these terms.
*Correspondence: Wen-Ping Ji, aml3ZW5waW5nQGFobXUuZWR1LmNu
†These authors have contributed equally to this work