Abstract
Objective:
To investigate an optimal regimen of six drugs, including lactoferrin, probiotics, prebiotics, glutamine, arginine and erythropoietin (EPO), for the prevention of necrotizing enterocolitis (NEC) in preterm infants.
Methods:
PubMed, Embase, Ovid, The Cochrane Library, and Web of Science databases were searched for randomized controlled trials (RCTs) investigating the efficacy of lactoferrin, probiotics, prebiotics, glutamine, arginine, and EPO in preventing NEC in preterm infants, with a cutoff date of June 20, 2024. Two authors independently screened studies and extracted all the data. Network meta-analysis (NMA) was conducted to compare the outcomes of different interventions, and group rankings were determined using the surface under the cumulative ranking curve (SUCRA).
Results:
A total of 89 RCTs with 26,861 preterm infants were included. Arginine demonstrated the highest clinical efficacy in reducing the incidence of NEC, with probiotics being the next most effective and the placebo being the least effective. Lactoferrin was identified as the most effective intervention for reducing the incidence of NEC-associated sepsis. Prebiotics showed the highest effect on overall mortality, reducing the beginning of enteral feeding, and were associated with the shortest hospital stay. Glutamine significantly decreased the time to full enteral feeding.
Conclusion:
Existing literature highlights arginine as the most efficacious pharmacological agent in preventing NEC in preterm infants. It has been shown to effectively lower the rates of NEC, septicemia, and mortality, warranting its recommendation as the first-line clinical intervention. Following this, probiotics are recommended as a second option.
1 Introduction
Necrotizing enterocolitis (NEC) is among the most prevalent critical conditions affecting premature infants (1–3), found in 5–12% of very low birth weight (VLBW) infants (4–6). It presents with necrosis of the intestinal tissues in small and large bowels, which leads to a translocation of gut microbiota into the bloodstream and can also lead to sepsis (7–10). In general, in stage II, or definitive disease, there is nearly always evidence for pneumatosis intestinalis and/or portal venous gas (3, 11). Mortality rates among neonates requiring surgery are estimated to be 20–30% (3). Beyond the high mortality, NEC also carries a significant risk of morbidity in survivors, manifesting as short bowel syndrome and developmental stagnation (12). The complexity of NEC lies in its resistance to intervention once fully established, compounded by the scarcity and expense of treatment options. Use of antibiotics, gastric decompression, and parenteral nutrition are the most common (9). The etiology of NEC remains elusive, with the debate ongoing on whether it constitutes a single pathological entity or a spectrum of related disorders. Despite advancements in deciphering its pathophysiological mechanisms, substantial gaps in knowledge persist, potentially accounting for the stagnant progress in NEC therapeutics over recent decades (13). Consequently, NEC prevention is underscored as a vital strategy to mitigate premature infant mortality and morbidity rates.
Breastfeeding is recognized as a safe and effective preventive approach for NEC in preterm infants (14, 15); yet, the role of other adjunctive medications or additives is also significant. For example, probiotics, prebiotics, glutamine, arginine, lactoferrin, and EPO have been studied as a therapy to decrease the risk of NEC among preterm infants (16–22). While initial data have suggested that probiotics can reduce the incidence and mortality of NEC (23–25), efficacy and potential short-term or long-term side effects of the other therapies remain unclear. Given the unique characteristics of the gastrointestinal (GI) tract in preterm infants, the concurrent use of multiple additives is generally discouraged.
Network meta-analysis (NMA) compares three or more interventions simultaneously in a single analysis by combining direct and indirect evidence across a network of studies (26). The major advantage over traditional meta-analysis is that this approach integrates direct and indirect data, enabling a comprehensive comparison and efficacy ranking of multiple interventions to identify the optimal strategy (27).
This study employed NMA to assess and rank the preventive and therapeutic effects of probiotics, prebiotics, glutamine, arginine, lactoferrin, and EPO on NEC in preterm infants, intending to provide valuable evidence-based medical evidence for drug selection in future clinical practice.
2 Methods
2.1 Protocol and registration
This study adhered to the Preferred Reporting Items for Systematic Reviews and Meta-Analyses (PRISMA) 2020 statement (28), ensuring a structured methodology and reporting format, and A Measurement Tool to Assess systematic Reviews (AMSTAR) 2 guidelines (29). The NMA protocol has been duly registered in the PROSPERO database (the registration number: CRD42024496947).
2.2 Data sources
A comprehensive literature search was conducted independently by two researchers (the first and second authors); disparities were resolved by discussion. The search encompassed titles and abstracts, and full-text assessments were carried out as needed to determine study eligibility.
The following databases were systematically searched from their inception until June 20, 2024: PubMed, Embase, Ovid, The Cochrane Library, and Web of Science. Placebo-controlled and head-to-head RCTs examining probiotics, prebiotics, glutamine, arginine, lactoferrin, and EPO as therapy against NEC in preterm infants were included. The following relevant terms were searched: (“enterocolitis necrotizing [MeSH Terms]” OR “necrotizing enterocolitis”) AND (“lactoferrin” OR “probiotics” OR “prebiotics” OR “glutamine” OR “arginine” OR “erythropoietin”). Additionally, Google Scholar was consulted to identify potentially relevant literature. Furthermore, the reference lists of identified reports were meticulously reviewed to identify any additional pertinent studies. Only articles published in the English language were considered for inclusion. The detailed search strategy is shown in Table 1 (PubMed is used as an example).
Table 1
| #1 | Enterocolitis necrotizing [MeSH Terms] |
|---|---|
| #2 | Enterocolitis necrotizing [Title/Abstract] |
| #3 | #1 OR #2 |
| #4 | Lactoferrin [MeSH Terms] |
| #5 | Lactoferrin [Title/Abstract] |
| #6 | Probiotics [MeSH Terms] |
| #7 | Probiotics [Title/Abstract] |
| #8 | Prebiotics [MeSH Terms] |
| #9 | Prebiotics [Title/Abstract] |
| #10 | Glutamine [MeSH Terms] |
| #11 | Glutamine [Title/Abstract] |
| #12 | Arginine [MeSH Terms] |
| #13 | Arginine [Title/Abstract] |
| #14 | Erythropoietin [MeSH Terms] |
| #15 | Erythropoietin [Title/Abstract] |
| #16 | #4 OR #5 OR #6 OR #7 OR #8 OR #9 OR #10 OR #11 OR #12 OR #13 OR #14 OR #15 |
| #17 | # 3 AND #16 |
Search strategy on PubMed.
2.3 Eligibility criteria
The inclusion criteria were as follows: (1) participants: Preterm infants born <34 weeks of gestation and/or infants with birth weight < 1,500 g; (2) types of studies: RCTs; (3) interventions: administration of early lactoferrin, probiotics, prebiotics, glutamine, arginine, erythropoietin and placebo (< 8 days of postnatal age) by any route and dose continued for any duration; each study involved at least two interventions; (4) Outcomes: primary outcomes: the incidence of NEC, NEC-associated sepsis and overall mortality; secondary outcomes: time to beginning enteral feeds, time to full enteral feeds and duration of hospitalization.
The exclusion criteria were: (1) non-RCTs, including quasi-RCTs, case–control studies, cohort studies, case reports, protocols, review articles, meta-analyses, editorials, letters, animal studies, cadaveric trials, or conference abstracts; (2) studies with <20 cases; (3) studies combining drugs (e.g., a combination of lactoferrin and probiotics); (4) poor-quality research literature or studies lacking rigor in their design; (5) duplicate or similar documents published by the same author in different journals; (6) incomplete data or important research data could not be obtained through email and other contacts; (7) non-English articles.
2.4 Data extraction
A specifically designed form was employed to extract essential information from each study. The following data were extracted: (1) general information such as the lead author, year of publication, study design, and country in which the study was performed; (2) demographic information, including the number and proportion of male or female infants, gestational age, birth weight, and the number of infants involved; (3) details regarding the drugs (intervention and comparison); (4) information on clinical outcomes, including the incidence of NEC, NEC-associated sepsis, overall mortality, beginning enteral feeding (time), full enteral feeding (time), and duration of hospitalization. In instances where SD was not available from the publication, SD was imputed using the method prescribed in the Cochrane Handbook, as follows:
-
1. Obtaining SDs for a group of means were calculated from standard error of the mean (SEM) or 95% confidence intervals (CIs) by using equations from the Cochrane Handbook chapter 6.5.2.2 when the group SDs were not provided directly;
-
2. When concentrations were provided in medians and 25th – 75th percentile, we converted these into means ± SD by using the equation developed by Wan et al. (Cochrane Handbook chapter 6.5.2.5);
-
3. when not reported, change-from-baseline SDs were estimated using the equation developed by Follmann et al., assuming a correlation coefficient of 0.50 between baseline and post-intervention lipid and lipoprotein values [Cochrane Handbook chapter 6.5.2.8, 2].
2.5 Quality assessment
The Cochrane Risk of Bias Tool was employed to assess the quality. The risk of bias for the included trials was evaluated by two researchers based on the Cochrane Handbook criteria. The criteria covered randomization, allocation concealment, blinding of participants and personnel, blinding of outcome assessors, completeness of outcome data, selective reporting, and other biases. Each domain was classified as having an unclear risk, low risk, or high risk of bias. The assessment was deemed to be of high quality if most of the domains were well-described and exhibited a low risk of bias. In cases of discrepancies in the ratings, researchers reached a consensus through discussion.
2.6 Statistical analysis
To conduct a comprehensive NMA, we utilized the statistical software packages “Network” and “mvmeta” within STATA 17.0 software. Dichotomous variables, specifically the incidence of NEC, NEC-associated sepsis and overall mortality, were analyzed using relative risk (RR) with corresponding 95% confidence intervals (CI). Meanwhile, continuous variables, including time to beginning enteral feeds, time to full enteral feeds and duration of hospitalization, were analyzed using weighted mean differences (WMD) with corresponding 95% CI. The comparison was considered statistically non-significant when the 95% CI of the RR or WMD contained the value 1.
For direct comparisons, a conventional meta-analysis was conducted to aggregate the results using random-effects models, serving as sensitivity analyses. NMA employed a frequentist approach with a random-effects model to estimate direct and indirect comparisons. The primary objective of the NMA was to assess whether comparator interventions demonstrated superiority. Global inconsistency, local inconsistency (using a node-splitting approach), and loop inconsistency were used to evaluate potential inconsistencies between indirect and direct comparisons. Statistical significance for global inconsistency was determined using p-values, with p > 0.05 indicating no significant global inconsistency. Local inconsistency was assessed through node-splitting analysis, and p > 0.05 indicated no significant local inconsistency. Heterogeneity within each closed loop was estimated using the inconsistency factor (IF), with a 95% CI (IF) value of zero signifying no statistical significance. A global network diagram was employed in each pre-specified outcome to illustrate direct comparisons between interventions. The size of the nodes in the diagram corresponded to the number of participants receiving each treatment. Lines linked treatments subject to direct comparisons, and the thickness of these lines was proportional to the number of trials evaluating the specific comparison.
Within the “Results” section, the ranking probability of each intervention was presented using a cumulative probability ranking graph. The graph incorporated the Surface Under the Cumulative Ranking Curve (SUCRA) value, serving as an index summarizing the cumulative ranking probability. The SUCRA value ranged between 0 and 100%, where a larger SUCRA value indicated a higher ranking for the intervention, typically reflecting a more favorable or less favorable effect. All intervention measures were ranked based on their respective SUCRA values or the area under the curve, resulting in a comprehensive ranking of the interventions.
A comparison-adjusted funnel plot was used to assess the potential for publication bias. This analysis aimed to determine whether there was evidence of a small sample effect or publication bias within the intervention network.
3 Results
3.1 Search results
A total of 23,357 studies were initially identified, including PubMed (n = 350), Embase (n = 414), Ovid (n = 351), Web of Science (n = 606), and the Cochrane Library (n = 128) studies. To eliminate duplicate entries, the “Find duplicates” function in EndNote software was employed, removing 1,316 studies. After thoroughly screening titles and abstracts, 382 irrelevant references were excluded. Subsequently, a full text was retrieved for the remaining 151 references. Ultimately, 89 studies involving 26,861 neonates met the eligibility criteria for inclusion in this NMA. The study selection process is illustrated in Figure 1, and the baseline characteristics of the included studies are summarized in Table 2.
Figure 1
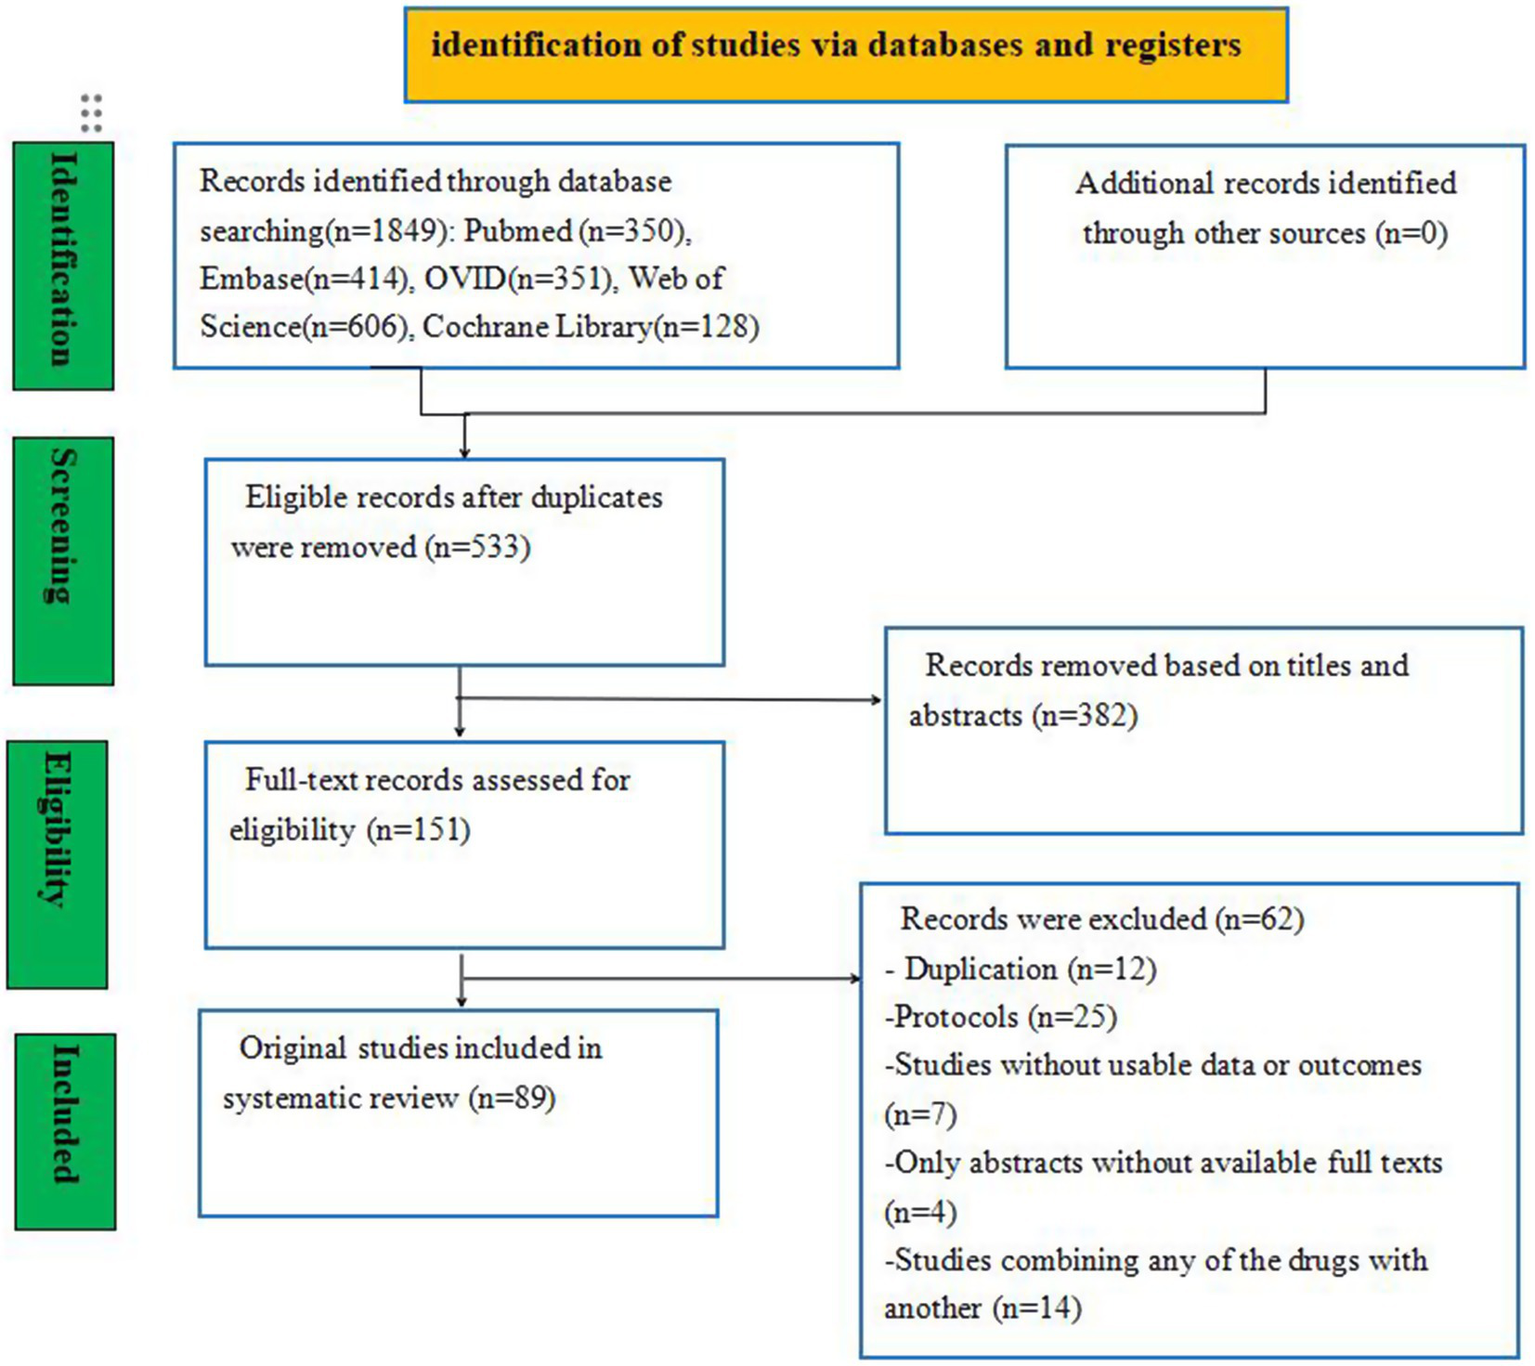
Flow diagram of the study selection process.
Table 2
| Author | Country | Study design | Group | NO | Gestational age (week) | Birth weight (g) | Outcome |
|---|---|---|---|---|---|---|---|
| Akin 2014 | Turkey | RCTs | Lactoferrin | 22 | 29.5 ± 1.6 | 1,290 ± 346.7 | (1)(2)(3) |
| Placebo | 23 | 30.3 ± 2.5 | 1,307 ± 262.1 | ||||
| Al-Hosni 2012 | United States | RCTs | Probiotic | 50 | 25.7 ± 1.4 | 778 ± 138 | (1)(2)(3) |
| Placebo | 51 | 25.7 ± 1.4 | 779 ± 126 | ||||
| Amin 2002 | Canada | RCTs | L-arginine | 75 | 27.4 ± 0.3 | 952 ± 25 | (1)(2) |
| Placebo | 77 | 27.6 ± 0.2 | 955 ± 20 | ||||
| Armanian 2014 | Iran | RCTs | Prebiotic | 25 | 30.48 ± 2.31 | 1262.80 ± 213.35 | (1)(2)(3)(4)(5)(6) |
| Placebo | 50 | 30.38 ± 2.53 | 1205.60 ± 177.23 | ||||
| Barrington 2016 | Canada | RCTs | Lactoferrin | 40 | 28.0 ± 1.7 | 1,087 ± 315 | (1)(2)(3) |
| Placebo | 39 | 28.4 ± 2.1 | 1,104 ± 320 | ||||
| Bierer 2006 | United States | RCTs | EPO | 7 | 26.0 ± 1.1 | 752 ± 150 | (1)(3) |
| Placebo | 9 | 26.9 ± 2.1 | 801 ± 103 | ||||
| Bin nun 2005 | Israel | RCTs | Probiotic | 72 | 29.8 ± 2.6 | 1,152 ± 262 | (1)(2)(3)(4)(5) |
| Placebo | 73 | 29.3 ± 4.3 | 1,111 ± 278 | ||||
| Braga 2012 | Brazil | RCTs | Probiotic | 119 | 29.5 ± 2.5 | 1194.7 ± 206.3 | (1)(2)(3)(4)(5) |
| Placebo | 112 | 29.2 ± 2.6 | 1151.4 ± 224.9 | ||||
| Chang 2022 | China | RCTs | Probiotic | 70 | 26.0 (25.0–27.0) | 780.0 (689.3–915.0) | (1)(2)(3)(4)(5)(6) |
| Placebo | 50 | 26.0 (25.0–27.0) | 815.0 (757.5–920.0) | ||||
| Chaudhuri 2014 | India | RCTs | Probiotic | 56 | 32 ± 2 | 1,192 ± 341 | (1)(2)(3)(5)(6) |
| Placebo | 56 | 32 ± 2 | 1,069 ± 365 | ||||
| Chou 2010 | China | RCTs | Probiotic | 153 | 28.5 ± 2.3 | 1103.6 ± 232.4 | (1)(2)(3)(6) |
| Placebo | 148 | 28.5 ± 2.3 | 1097.2 ± 231.4 | ||||
| Costalos 2003 | Greece | RCTs | Probiotic | 51 | 31.1 (2.5%) | 1,651 (470%) | (1)(2)(5) |
| Placebo | 36 | 31.8 (2.7%) | 1,644 (348.7%) | ||||
| Costeloe 2016 | United Kingdom | RCTs | Probiotic | 650 | 28.0 (26.1–29.4) | 1,039 ± 312 | (1)(2)(3) |
| Placebo | 660 | 28.0 (26.1–29.6) | 1,043 ± 317 | ||||
| Cui 2019 | China | RCTs | Probiotic | 45 | 32.85 ± 1.39 | 1,682 ± 109.03 | (1)(2)(6) |
| Placebo | 48 | 32.56 ± 1.41 | 1714 ± 127.11 | ||||
| Dallas 1998 | United States | RCTs | Glutamine | 34 | 24–32 | 500–1,250 | (6) |
| Placebo | 33 | 24–32 | 500–1,250 | ||||
| Dani 2002 | Italy | RCTs | Probiotic | 295 | 30.8 ± 2.4 | 1,325 ± 361 | (1)(2)(4) |
| Placebo | 290 | 30.7 ± 2.3 | 1,345 ± 384 | ||||
| Dekieviet 2014 | Netherlands | RCTs | Glutamine | 30 | 29.7 ± 1.6 | 1,270 ± 370 | (1) |
| Placebo | 35 | 29.0 ± 1.6 | 1,200 ± 330 | ||||
| Dilli 2015 | Turkey | RCTs | Probiotic | 100 | 28.8 ± 1.9 | 1,236 ± 212 | (1)(2)(3)(6) |
| Prebiotic | 100 | 29.0 ± 1.7 | 1,229 ± 246 | ||||
| Placebo | 100 | 28.2 ± 2.2 | 1,147 ± 271 | ||||
| El-Ganzoury 2014 | Egyp | RCTs | EPO | 20 | 30.2 ± 1.8 | 1,310 ± 310 | (1)(3)(4)(6) |
| Placebo | 30 | 30.5 ± 1.5 | 1,360 ± 290 | ||||
| El-Shimi 2015 | Egypt | RCTs | L-Arginine | 25 | 31.84 ± 2.29 | 1,450 ± 260 | (1)(3)(4) |
| Glutamine | 25 | 31.68 ± 1.35 | 1,450 ± 210 | ||||
| Placebo | 25 | 30.64 ± 2.34 | 1,310 ± 250 | ||||
| Fauchere 2015 | Germany | RCTs | EPO | 229 | 29.0 ± 1.0 | 1,207 ± 322 | (1)(6) |
| Placebo | 214 | 29.0 ± 1.0 | 1,215 ± 365 | ||||
| Fauchere 2008 | Germany | RCTs | EPO | 30 | 28.0 ± 2.0 | 1,112 ± 347 | (1)(2)(3)(6) |
| Placebo | 15 | 28.0 ± 2.0 | 1,081 ± 354 | ||||
| Fernandez 2012 | México | RCTs | Probiotic | 75 | 31.2 (26–35.4) | 1,090 (580–1,495) | (1)(3)(6) |
| Placebo | 75 | 31 (27–36) | 1,170 (540–1,492) | ||||
| Fujii 2006 | Japan | RCTs | Probiotic | 11 | 31.3 ± 3.16 | 1,378 ± 365 | (1)(6) |
| Placebo | 8 | 31.2 ± 1.98 | 1,496 ± 245 | ||||
| Griffiths 2018 | United Kingdom | RCTs | Lactoferrin | 1,098 | < 32 | 1125.9 ± 356.2 | (1)(2)(3)(6) |
| Placebo | 1,101 | < 32 | 1143.3 ± 367.1 | ||||
| Haiden 2004 | Austria | RCTs | EPO | 21 | 25 (23–31) | 690 (500–800) | (1)(3)(6) |
| Placebo | 19 | 25 (23–28) | 690 (467–783) | ||||
| Hays 2015 | France | RCTs | Probiotic | 145 | 29.0 (28.1–30.1) | 1,170 (1000–1,320) | (1) |
| Placebo | 52 | 29.4 (27.9–30.6) | 1,170 (1055–1,370) | ||||
| Hoyos 1999 | Colombia | RCTs | Probiotic | 918 | < 37 | Not mentioned | (1)(2)(3) |
| Placebo | 935 | < 37 | Not mentioned | ||||
| Jacobs 2013 | Australia | RCTs | Probiotic | 548 | 27.9 ± 2.0 | 1,063 ± 259 | (1)(2)(3)(5)(6) |
| Placebo | 551 | 27.8 ± 2.0 | 1,048 ± 260 | ||||
| Juul 2020 | United States | RCTs | EPO | 476 | 29.1 ± 6.2 | 806.4 ± 194.6 | (1)(2)(3) |
| Placebo | 470 | 28.8 ± 6.2 | 792.9 ± 182.2 | ||||
| Kaban 2019 | Italy | RCTs | Probiotic | 47 | 33 (28–34) | 1,520 (1035–1800) | (1)(2)(3)(6) |
| Placebo | 47 | 33 (28–34) | 1,605 (1060–1800) | ||||
| Kanic 2015 | Slovenia | RCTs | Probiotic | 40 | 28.0(27.0–30.0) | 1104.1 ± 233.2 | (1)(2)(3)(6) |
| Placebo | 40 | 29.0 (26.2–30.0) | 1024.3 ± 249.9 | ||||
| Lacey 1996 | United States | RCTs | Glutamine | 22 | 26 ± 2 | 811 ± 175 | (5)(6) |
| Placebo | 22 | 26 ± 1 | 800 ± 155 | ||||
| Lin 2005 | China | RCTs | Probiotic | 180 | 28.5 ± 2.5 | 1,104 ± 242 | (1)(2)(3) |
| Placebo | 187 | 28.2 ± 2.5 | 1,071 ± 243 | ||||
| Lin 2008 | China | RCTs | Probiotic | 217 | <34 | 1028.9 ± 246.0 | (1)(2)(3)(5) |
| Placebo | 217 | <34 | 1077.3 ± 214.4 | ||||
| Lowe 2017 | United States | RCTs | EPO | 35 | 27.37 ± 1.74 | 500–1,250 | (1)(3) |
| Placebo | 14 | 27.64 ± 1.52 | 500–1,250 | ||||
| Maier 2002 | Germany | RCTs | EPO | 68 | 26 (25–28) | 778 (660–880) | (1) |
| Placebo | 62 | 27 (26–28) | 800 (715–885) | ||||
| Manzoni 2006 | Italy | RCTs | Probiotic | 39 | 29.6 ± 5 | 1,212 ± 290 | (1)(2)(3)(5) |
| Placebo | 41 | 29.3 ± 4 | 1,174 ± 340 | ||||
| Manzoni 2009 | Italy | RCTs | Lactoferrin | 153 | 29.6 ± 2.5 | 1,142 ± 244 | (1)(2)(3)(5) |
| Placebo | 168 | 29.5 ± 3.2 | 1,109 ± 269 | ||||
| Manzoni 2014 | Italy | RCTs | Lactoferrin | 247 | 29.7 ± 2.5 | 1,158 ± 251 | (1)(3)(5) |
| Placebo | 258 | 29.6 ± 2.8 | 1,118 ± 259 | ||||
| Mihatsch 2010 | Germany | RCTs | Probiotic | 91 | 26.6 ± 1.8 | 856 ± 251 | (1)(3) |
| Placebo | 89 | 26.7 ± 1.7 | 871 ± 287 | ||||
| Modi 2010 | United Kingdom | RCTs | Prebiotic | 73 | 31 (29–32) | 1,565 (1350–1880) | (1)(2) |
| Placebo | 81 | 30 (28–31) | 1,515 (1247–1788) | ||||
| Mohamad 2011 | Malaysia | RCTs | Glutamine | 132 | Not mentioned | 2,150 ± 910 | (1)(2)(3) |
| Placebo | 138 | Not mentioned | 2,220 ± 940 | ||||
| Hosseini 2019 | Iran | RCTs | EPO | 50 | 28.7 ± 2.6 | 1065.1 ± 189.4 | (1)(2)(3) |
| Placebo | 50 | 27.7 ± 1.5 | 998.1 ± 172.9 | ||||
| Nandhini 2015 | India | RCTs | Probiotic | 108 | 31.6 ± 1.4 | 1,430 ± 209 | (1)(2)(3) |
| Placebo | 110 | 31.4 ± 1.4 | 1,444 ± 217 | ||||
| Natalucci 2016 | Switzerland | RCTs | EPO | 191 | 29.2 ± 1.6 | 1,220 ± 327 | (1)(2)(6) |
| Placebo | 174 | 29.3 ± 1.6 | 1,213 ± 357 | ||||
| Obladen 1991 | United Kingdom | RCTs | EPO | 43 | 30 ± 1 | 1,380 ± 324 | (1)(3) |
| Placebo | 50 | 30 ± 1 | 1,295 ± 323 | ||||
| Ochoa 2020 | United States | RCTs | Lactoferrin | 209 | 30.8 ± 2.8 | 1,382 ± 371 | (1)(2)(3)(4)(5) |
| Placebo | 205 | 30.8 ± 3.2 | 1,378 ± 353 | ||||
| O’Gorman 2015 | Switzerland | RCTs | EPO | 24 | 30.17 ± 1.44 | 1,337 ± 332 | (1)(2) |
| Placebo | 34 | 29.5 ± 1.44 | 1,192 ± 10 | ||||
| Ohls 2013 | United States | RCTs | EPO | 32 | 27.8 ± 1.9 | 957 ± 212 | (1)(3)(6) |
| Placebo | 30 | 27.3 ± 1.8 | 933 ± 221 | ||||
| Ohls 2001 | United States | RCTs | EPO | 59 | 29 ± 2 | 1,130 ± 70 | (1)(2)(3)(6) |
| Placebo | 59 | 28 ± 2 | 1,118 ± 72 | ||||
| Ohls 2004 | United States | RCTs | EPO | 51 | 26.3 ± 2.0 | 801 ± 139 | (1)(2) |
| Placebo | 51 | 25.8 ± 1.7 | 783 ± 112 | ||||
| Omar 2020 | Egypt | RCTs | EPO | 36 | 32 (31.00–32.00) | Not mentioned | (1)(3) |
| Placebo | 36 | 32 (30.50–32.00) | Not mentioned | ||||
| Oncel 2013 | Turkey | RCTs | Probiotic | 200 | 28.2 ± 2.4 | 1,071 ± 274 | (1)(2)(3)(5)(6) |
| Placebo | 200 | 27.9 ± 2.5 | 1,048 ± 298 | ||||
| Shannon 1995 | United States | RCTs | EPO | 77 | 26.8 ± 1.6 | 923 ± 184 | (1)(2)(3) |
| Placebo | 80 | 27.1 ± 1.7 | 925 ± 183 | ||||
| Demirel 2013 | Turkey | RCTs | Probiotic | 135 | 29.4 ± 2.3 | 1,164 ± 261 | (1)(2)(3)(5) |
| Placebo | 136 | 29.2 ± 2.5 | 1,131 ± 284 | ||||
| Dutta 2015 | India | RCTs | Probiotic | 114 | 30.64 ± 1.64 | 1286.08 ± 264.76 | (1)(2)(3) |
| Placebo | 35 | 30.82 ± 1.72 | 1252.27 ± 309.31 | ||||
| Güney-Varal 2017 | Turkey | RCTs | Probiotic | 70 | 29.7 ± 1.9 | 1728.5 ± 257 | (1)(2)(3)(6) |
| Placebo | 40 | 29.3 ± 1.7 | 1,228 ± 249 | ||||
| Singh S 2017 | Austria | RCTs | Probiotic | 37 | 32.6 ± 2.2 | <2000 | (1) |
| Placebo | 35 | 32.6 ± 2.2 | <2000 | ||||
| Patole 2014 | Australia | RCTs | Probiotic | 77 | 29 (26–30) | 1,090 (755–1,280) | (1)(2)(5)(6) |
| Placebo | 76 | 28 (26–29) | 1,025 (810–1,260) | ||||
| Peltoniemi 2017 | India | RCTs | EPO | 21 | 28.3 ± 1.6 | 1,141 ± 230 | (1)(3) |
| Placebo | 18 | 28.2 ± 1.8 | 1,169 ± 220 | ||||
| Poindexter 2004 | United States | RCTs | Glutamine | 721 | 26.0 ± 2.1 | 770 ± 141 | (1)(2)(3)(6) |
| Placebo | 712 | 25.9 ± 1.9 | 768 ± 138 | ||||
| Polycarpou 2013 | United States | RCTs | L-Arginine | 40 | 29.2 (28.9–29.4) | 1,168 (1095.1–1242.2) | (1)(3) |
| Placebo | 43 | 28.8 (28.5–29.1) | 1,127 (1047.1–1207.6) | ||||
| Riskin 2010 | Israel | RCTs | Prebiotic | 15 | 30.3 ± 2.8 | 1,523 ± 550 | (1)(2)(3)(6) |
| Placebo | 13 | 28.7 ± 2.9 | 1,207 ± 447 | ||||
| Rojas 2012 | United States | RCTs | Probiotic | 372 | 32(30–33) | 1,530(1253–1750) | (1)(3)(6) |
| Placebo | 378 | 32(29–33) | 1,516(1129–1750) | ||||
| Rouge 2009 | France | RCTs | Probiotic | 45 | 28.1 ± 1.9 | 1,115 ± 251 | (1)(2)(3)(6) |
| Placebo | 49 | 28.1 ± 1.8 | 1,057 ± 260 | ||||
| Samanta 2008 | India | RCTs | Probiotic | 91 | 30.12 ± 1.63 | 1,172 ± 143 | (1)(2)(3) |
| Placebo | 95 | 30.14 ± 1.59 | 1,210 ± 143 | ||||
| Sari 2011 | Turkey | RCTs | Probiotic | 110 | 29.5 ± 2.4 | 1,231 ± 262 | (1)(2)(3) |
| Placebo | 111 | 29.7 ± 2.4 | 1,278 ± 282 | ||||
| Sari 2012 | Turkey | RCTs | Probiotic | 86 | 29.7 ± 2.5 | 1,241 ± 264 | (1)(2) |
| Placebo | 88 | 29.8 ± 2.3 | 1,278 ± 273 | ||||
| Serce 2013 | Turkey | RCTs | Probiotic | 104 | 28.7 ± 2.1 | 1,162 ± 216 | (1)(2)(3)(6) |
| Placebo | 104 | 28.8 ± 2.2 | 1,126 ± 232 | ||||
| Sevastiadou 2011 | Greece | RCTs | Glutamine | 51 | 30.85 ± 2.36 | 1,327 ± 336 | (2) |
| Placebo | 50 | 30.07 ± 2.47 | 1,283 ± 346 | ||||
| Shashidhar 2017 | India | RCTs | Probiotic | 48 | 31.2 ± 2.1 | 1,256 ± 185 | (1)(3)(4)(5)(6) |
| Placebo | 48 | 31.2 ± 2.1 | 1,190 ± 208 | ||||
| Sherman 2016 | United States | RCTs | Lactoferrin | 59 | 28 ± 0.85 | 1,152 ± 206 | (1)(2)(3)(5)(6) |
| Placebo | 60 | 28 ± 0.85 | 1,143 ± 220 | ||||
| Song 2016 | China | RCTs | EPO | 366 | 30.39 ± 1.38 | 1,372 ± 209 | (1)(2)(3) |
| Placebo | 377 | 30.40 ± 1.46 | 1,396 ± 239 | ||||
| Sowden 2022 | South Africa | RCTs | Probiotic | 100 | 26–36 | 750–1,500 | (1)(4)(5) |
| Placebo | 100 | 26–36 | 750–1,500 | ||||
| Stratiki 2007 | Greece | RCTs | Probiotic | 41 | 31(27–37) | 1,500 (900–1780) | (1)(2)(5) |
| Placebo | 36 | 30.5(26–37) | 1,500 (700–1900) | ||||
| Strus 2018 | Poland | RCTs | Probiotic | 90 | 29.73 ± 2.26 | 1281.24 ± 281.18 | (1)(2)(3) |
| Placebo | 91 | 29.67 ± 2.32 | 1350.11 ± 292.18 | ||||
| Tanjina 2016 | United Kingdom | RCTs | Probiotic | 52 | 31.38 ± 0.93 | 1310.6 ± 110.41 | (1)(5)(6) |
| Placebo | 50 | 31.68 ± 0.84 | 1338.0 ± 97.71 | ||||
| Tarnow-Mordi 2020 | Australia | RCTs | Lactoferrin | 770 | 28.4 ± 2.4 | 1,068 (262) | (1)(2)(3) |
| Placebo | 771 | 28.4 ± 2.3 | 1,063 (261) | ||||
| Tewari 2015 | India | RCTs | Probiotic | 61 | <34 | <2,500 | (1)(2)(3) |
| Placebo | 59 | <34 | <2,500 | ||||
| Thompson 2003 | United Kingdom | RCTs | Glutamine | 12 | 27.0 ± 1.7 | 862 ± 206 | (5) |
| Placebo | 16 | 27.8 ± 1.7 | 920 ± 249 | ||||
| Totsu 2014 | Japan | RCTs | Probiotic | 153 | 28.6 ± 2.9 | 1,016 ± 289 | (1)(2)(3)(5)(6) |
| Placebo | 150 | 28.5 ± 3.3 | 998 ± 281 | ||||
| Turker 2005 | Turkey | RCTs | EPO | 42 | 30(24–33) | 1,110 (650–1,490) | (1) |
| Placebo | 51 | 31(24–33) | 1,200 (530–1,495) | ||||
| Varaporn 2014 | Thailand | RCTs | Probiotic | 31 | 31.0 + 1.82 | 1250.1 + 179.26 | (1)(2)(3)(5)(6) |
| Placebo | 29 | 30.59 + 1.76 | 1207.72 + 199.35 | ||||
| Vaughn 2003 | United States | RCTs | Glutamine | 314 | 27 ± 2 | 890 ± 200 | (2) |
| Placebo | 335 | 27 ± 2 | 900 ± 190 | ||||
| Wang 2020 | China | RCTs | EPO | 641 | 29.7 (28.9–30.9) | 1,250 (1100–1,410) | (1) |
| Placebo | 644 | 30.0 (29.0–31.0) | 1,300 (1100–1,450) | ||||
| Wejryd 2018 | Sweden | RCTs | Probiotic | 68 | 25.5 ± 1.2 | 731 ± 129 | (1)(2)(3)(5) |
| Placebo | 66 | 25.5 ± 1.3 | 740 ± 148 | ||||
| Xu 2016 | China | RCTs | Probiotic | 63 | 33 + 0.72 | 1947 ± 54 | (2)(5)(6) |
| Placebo | 62 | 33 + 1.04 | 1957 ± 51 | ||||
| Yeo 2001 | Singapore | RCTs | EPO | 54 | 28.2 ± 1.9 | 988 ± 248 | (1)(2)(3) |
| Placebo | 54 | 28.3 ± 2.1 | 988 ± 254 |
Baseline characteristics of the included studies.
EPO, erythropoietin; RCT, randomized controlled trial. (1) The incidence of NEC; (2) the incidence of sepsis; (3) the incidence of overall mortality; (4) the time to beginning enteral feeds; (5) the time to full enteral feeds; (6) duration of hospitalization.
3.2 Risk of bias and quality assessment
The quality assessment of the included RCTs was conducted using the Cochrane Collaboration’s “Risk of Bias” tool. The risk of bias assessment for the included studies is presented in Table 3.
Table 3
| Sequence generation | Allocation concealment | Blinding | Completeness of data | Selective reporting bias | Other bias | |
|---|---|---|---|---|---|---|
| Akin 2014 | Simple envelope randomization | Sealed envelope | Double-blind (participant and therapist) | Low risk | Low risk | Low risk |
| Al-Hosni 2012 | Unclear | Unclear | Double-blind (participant/therapist) | Low risk | Low risk | Low risk |
| Amin 2002 | Unclear | Unclear | Double-blind (participant and therapist) | Low risk | Low risk | Low risk |
| Armanian 2014 | Unequal Randomization as 2:1 | Unclear | Unclear | Low risk | Low risk | Low risk |
| Barrington 2016 | Computer-generated | Sealed envelope | Double-blind (participant and therapist) | Low risk | Low risk | Low risk |
| Bierer 2006 | Permuted block method | Unclear | Double-blind (participant and therapist) | Low risk | Low risk | Low risk |
| Bin nun 2005 | Unclear | Unclear | Double-blind (participant and therapist) | Low risk | Low risk | Low risk |
| Braga 2012 | Unclear | Sealed envelope | Double-blind (participant and therapist) | Low risk | Low risk | Low risk |
| Chang 2022 | Unclear | Unclear | Unclear | Low risk | Low risk | Low risk |
| Chaudhuri 2014 | Computer-generated | Unclear | Double-blind (participant and therapist) | Low risk | Low risk | Low risk |
| Chou 2010 | Random-number table Sequence | Sealed envelope | Double-blind (participant and therapist) | Low risk | Low risk | Low risk |
| Costalos 2003 | Unclear | Sealed envelope | Double-blind (participant and therapist) | Low risk | Low risk | Low risk |
| Costeloe 2016 | Minimisation algorithm | Sealed envelope | Double-blind (participant and therapist) | Low risk | Low risk | Low risk |
| Cui 2019 | Unclear | Unclear | Double-blind (participant and therapist) | Low risk | Low risk | Low risk |
| Dallas 1998 | Unclear | Unclear | Double-blind (participant and therapist) | Low risk | Low risk | Low risk |
| Dani 2002 | Unclear | Sealed envelope | Double-blind (participant and therapist) | Low risk | Low risk | Low risk |
| Dekieviet 2014 | Unclear | Unclear | Unclear | Low risk | Low risk | Low risk |
| Dilli 2015 | Unclear | Sealed envelope | Double-blind (participant and therapist) | Low risk | Low risk | Low risk |
| El-Ganzoury 2014 | Computer-generated | Sealed envelope | Double-blind (participant and therapist) | Low risk | Low risk | Low risk |
| El-Shimi 2015 | Unclear | Unclear | Unclear | Low risk | Low risk | Low risk |
| Fauchere 2015 | Computer-generated | Sealed envelope | Double-blind (participant and therapist) | Low risk | Low risk | Low risk |
| Fauchere 2008 | Computer-generated | Sealed envelope | Double-blind (participant and therapist) | Low risk | Low risk | Low risk |
| Fernandez 2012 | Random digit table | Sealed envelope | Double-blind (participant and therapist) | Low risk | Low risk | Low risk |
| Fujii 2006 | Unclear | Unclear | Unclear | Low risk | Low risk | Low risk |
| Griffiths 2018 | Computer-generated | Unclear | Double-blind (participant and therapist) | Low risk | Low risk | Low risk |
| Haiden2004 | Unclear | Sealed envelope | Double-blind (participant and therapist) | Low risk | Low risk | Low risk |
| Hays 2015 | Unclear | Unclear | Triple-blind (participant and therapist and assessor) | Low risk | Low risk | Low risk |
| Hoyos 1999 | Unclear | Unclear | Unclear | Low risk | Low risk | Low risk |
| Jacobs 2013 | Unclear | Sealed envelope | Double-blind (participant and therapist) | Low risk | Low risk | Low risk |
| Juul 2020 | Computer-generated | Sealed envelope | Double-blind (participant and therapist) | Low risk | Low risk | Low risk |
| Kaban 2019 | Alternating Randomization technique | Unclear | Double-blind (participant and therapist) | Low risk | Low risk | Low risk |
| Kanic 2015 | Unclear | Unclear | Unclear | Low risk | Low risk | Low risk |
| Lacey 1996 | Unclear | Unclear | Double-blind (participant and therapist) | Low risk | Low risk | Low risk |
| Lin 2005 | Computer-generated | Unclear | Double-blind (participant and therapist) | Low risk | Low risk | Low risk |
| Lin 2008 | Computer-generated | Unclear | Double-blind (participant and therapist) | Low risk | Low risk | Low risk |
| Lowe 2017 | Computer-generated | Unclear | Double-blind (participant and therapist) | Low risk | Low risk | Low risk |
| Maier 2002 | Unclear | Sealed envelope | Double-blind (participant and therapist) | Low risk | Low risk | Low risk |
| Manzoni 2006 | Computer-generated | Unclear | Double-blind (participant and therapist) | Low risk | Low risk | Low risk |
| Manzoni 2009 | Computer-generated | Unclear | Double-blind (participant/therapist) | Low risk | Low risk | Low risk |
| Manzoni 2014 | Computer-generated | Unclear | Double-blind (participant and therapist) | Low risk | Low risk | Low risk |
| Mihatsch 2010 | Computer-generated | Sealed envelope | Double-blind (participant and therapist) | Low risk | Low risk | Low risk |
| Modi 2010 | Unclear | Unclear | Unclear | Low risk | Low risk | Low risk |
| Mohamad 2011 | Computer-generated | Unclear | Double-blind (participant and therapist) | Low risk | Low risk | Low risk |
| Hosseini 2019 | Unclear | Unclear | Double-blind (participant and therapist) | Low risk | Low risk | Low risk |
| Nandhini 2015 | Computer-generated | Sealed envelope | Double-blind (participant and therapist) | Low risk | Low risk | Low risk |
| Natalucci 2016 | Unclear | Unclear | Double-blind (participant and therapist) | Low risk | Low risk | Low risk |
| Obladen 1991 | Unclear | Sealed envelope | Double-blind (participant and therapist) | Low risk | Low risk | Low risk |
| Ochoa 2020 | Unclear | Sealed envelope | Double-blind (participant and therapist) | Low risk | Low risk | Low risk |
| O’Gorman 2015 | Computer-generated | Sealed envelope | Triple-blind (participant and therapist and assessor) | Low risk | Low risk | Low risk |
| Ohls 2013 | Computer-generated | Sealed envelope | Double-blind (participant and therapist) | Low risk | Low risk | Low risk |
| Ohls 2001 | Computer-generated | Sealed envelope | Double-blind (participant and therapist) | Low risk | Low risk | Low risk |
| Ohls 2004 | Unclear | Unclear | Unclear | Low risk | Low risk | Low risk |
| Omar 2020 | Unclear | Unclear | Double-blind (participant and therapist) | Low risk | Low risk | Low risk |
| Oncel 2013 | Computer-generated | Sealed envelope | Double-blind (participant and therapist) | Low risk | Low risk | Low risk |
| Shannon 1995 | Unclear | Unclear | Double-blind (participant and therapist) | Low risk | Low risk | Low risk |
| Demirel 2013 | Computer-generated | Sealed envelope | Double-blind (participant and therapist) | Low risk | Low risk | Low risk |
| Dutta 2015 | Unclear | Sealed envelope | Double-blind (participant and therapist) | Low risk | Low risk | Low risk |
| Güney-Varal 2017 | Unclear | Unclear | Unclear | Low risk | Low risk | Low risk |
| Singh S 2017 | Unclear | Unclear | Double-blind (participant and therapist) | Low risk | Low risk | Low risk |
| Patole 2014 | Unclear | Unclear | Double-blind (participant and therapist) | Low risk | Low risk | Low risk |
| Peltoniemi 2017 | Random number table | Sealed envelope | Double-blind (participant and therapist) | Low risk | Low risk | Low risk |
| Poindexter 2004 | Unclear | Unclear | Double-blind (participant and therapist) | Low risk | Low risk | Low risk |
| Polycarpou 2013 | Unclear | Sealed envelope | Double-blind (participant and therapist) | Low risk | Low risk | Low risk |
| Riskin 2010 | Unclear | Sealed envelope | Double-blind (participant and therapist) | Low risk | Low risk | Low risk |
| Rojas 2012 | Computer-generated | Sealed envelope | Double-blind (participant and therapist) | Low risk | Low risk | Low risk |
| Rouge 2009 | Unclear | Unclear | Double-blind (participant and therapist) | Low risk | Low risk | Low risk |
| Samanta 2008 | Random number table | Unclear | Double-blind (participant and therapist) | Low risk | Low risk | Low risk |
| Sari 2011 | Computer-generated | Sealed envelope | Double-blind (participant and therapist) | Low risk | Low risk | Low risk |
| Sari 2012 | Computer-generated | Sealed envelope | Double-blind (participant and therapist) | Low risk | Low risk | Low risk |
| Serce 2013 | Computer-generated | Sealed envelope | Double-blind (participant and therapist) | Low risk | Low risk | Low risk |
| Sevastiadou 2011 | Unclear | Unclear | Double-blind (participant and therapist) | Low risk | Low risk | Low risk |
| Shashidhar 2017 | Computer-generated | Sealed envelope | Double-blind (participant and therapist) | Low risk | Low risk | Low risk |
| Sherman 2016 | Unclear | Unclear | Double-blind (participant and therapist) | Low risk | Low risk | Low risk |
| Song 2016 | Computer-generated | Sealed envelope | Double-blind (participant and therapist) | Low risk | Low risk | Low risk |
| Sowden 2022 | Unclear | Unclear | Double-blind (participant and therapist) | Low risk | Low risk | Low risk |
| Stratiki 2007 | Unclear | Unclear | Double-blind (participant and therapist) | Low risk | Low risk | Low risk |
| Strus 2018 | Unclear | Unclear | Double-blind (participant and therapist) | Low risk | Low risk | Low risk |
| Tanjina 2016 | Unclear | Unclear | Double-blind (participant and therapist) | Low risk | Low risk | Low risk |
| Tarnow-Mordi 2020 | Computer-generated | Sealed envelope | Double-blind (participant and therapist) | Low risk | Low risk | Low risk |
| Tewari 2015 | Unclear | Unclear | Double-blind (participant and therapist) | Low risk | Low risk | Low risk |
| Thompson 2003 | Unclear | Unclear | Double-blind (participant and therapist) | Low risk | Low risk | Low risk |
| Totsu 2014 | Computer-generated | Unclear | Double-blind (participant and therapist) | Low risk | Low risk | Low risk |
| Turker 2005 | Unclear | Unclear | Unclear | Low risk | Low risk | Low risk |
| Varaporn 2014 | Unclear | Unclear | Double-blind (participant and therapist) | Low risk | Low risk | Low risk |
| Vaughn 2003 | Unclear | Sealed envelope | Double-blind (participant and therapist) | Low risk | Low risk | Low risk |
| Wang 2020 | Unclear | Unclear | Double-blind (participant and therapist) | Low risk | Low risk | Low risk |
| Wejryd 2018 | Computer-generated | Sealed envelope | Double-blind (participant and therapist) | Low risk | Low risk | Low risk |
| Xu 2016 | Unclear | Unclear | Double-blind (participant and therapist) | Low risk | Low risk | Low risk |
| Yeo 2001 | Unclear | Unclear | No-blind | Low risk | Low risk | Low risk |
Risk of bias of the included randomized controlled trials.
3.3 Evidence network
This study encompassed 6 drugs (7 interventions), including lactoferrin, probiotics, prebiotics, glutamine, arginine, erythropoietin and placebo. Figure 2 represents the evidence network, where the lines denote direct comparisons between two directly related interventions. Interventions lacking direct connections are compared indirectly through the NMA. The width of the lines reflects the number of trials, while the size of the nodes corresponds to the total sample size across multiple treatments.
Figure 2
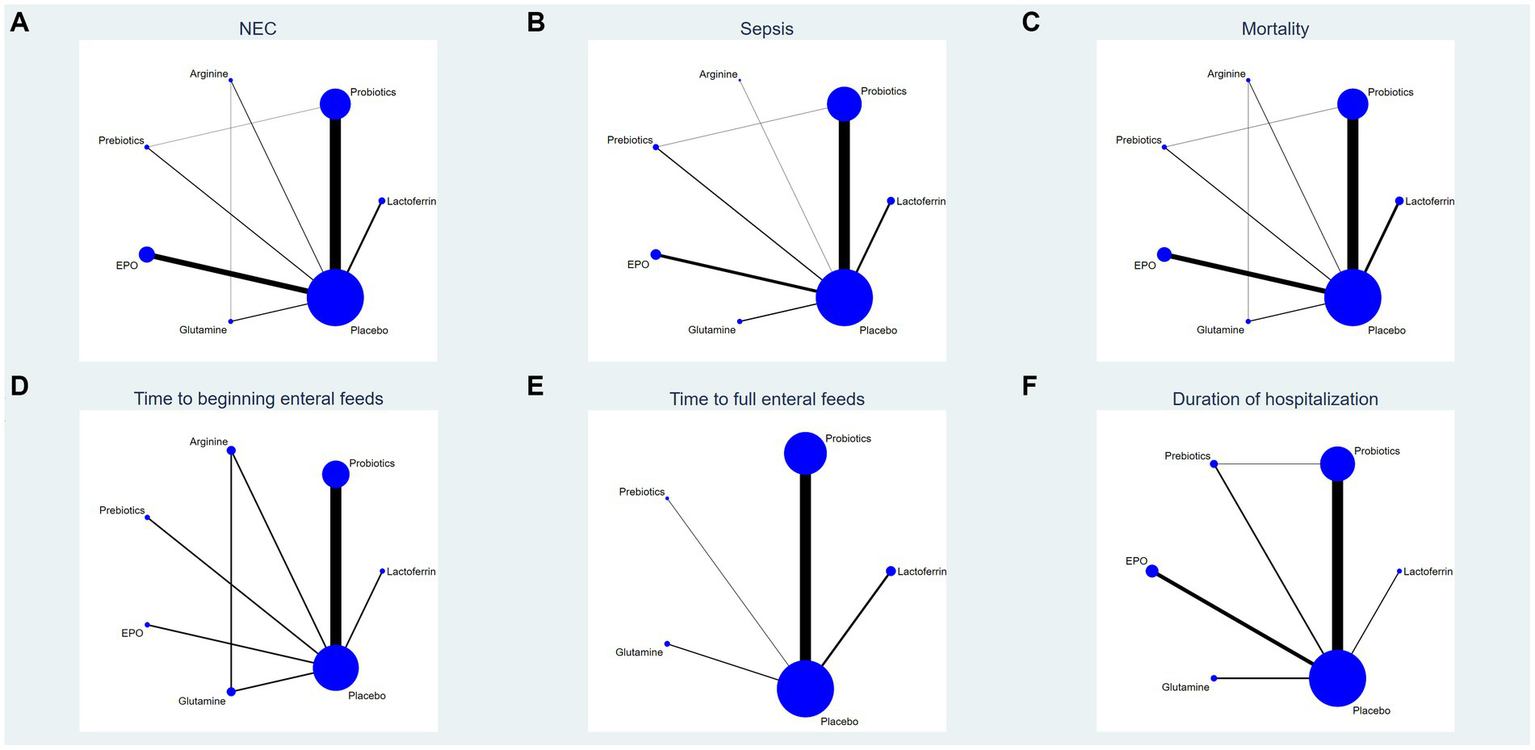
Network analysis of eligible comparison for (A) the incidence of NEC, (B) the incidence of sepsis, (C) the incidence of overall mortality, (D) time to beginning enteral feeds, (E) time to full enteral feeds and (F) duration of hospitalization. The size of each node represents the number of participants, while the thickness of the line represents the number of studies directly comparing the two interventions.
3.4 Inconsistency test
Figure 3 displays an inconsistency plot designed to assess heterogeneity among studies within the closed loops of the NMA. There were 5 closed loops for the primary outcomes including the incidence of NEC, NEC-associated sepsis and overall mortality, with IF ranging from 0.47 to 6.52. Most of these closed loops had 95% CIs that contained 0, and only one closed loops of probiotics-prebiotics-placebo had 95% CIs approaching 0. Overall, these results suggest that the data exhibited consistency.
Figure 3
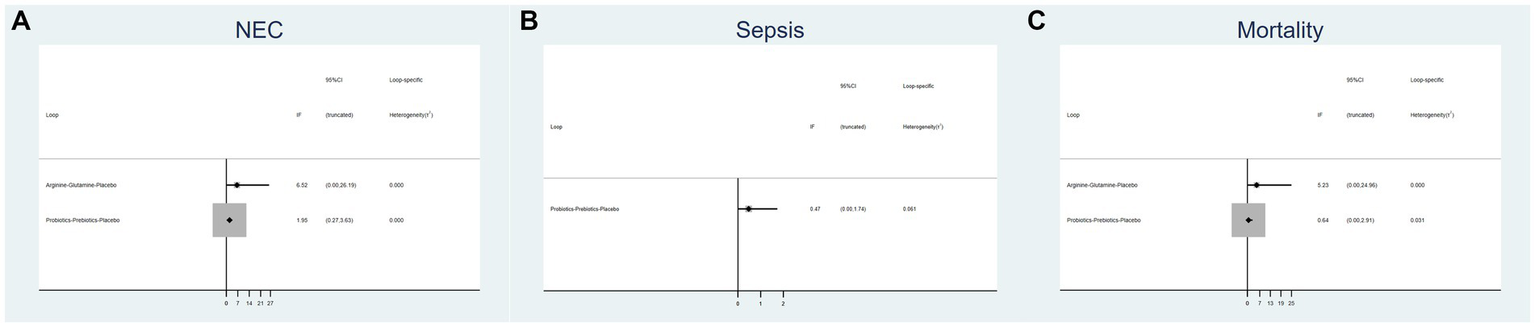
Inconsistency plot of eligible comparison for (A) the incidence of NEC, (B) the incidence of sepsis and (C) the incidence of overall mortality.
3.5 NMA results
3.5.1 Primary outcomes
3.5.1.1 The incidence of NEC
A total of 83 RCTs with 25,359 neonates reported the incidence of NEC after treatment, involving interventions of probiotics, prebiotics, glutamine, lactoferrin, EPO, arginine, and placebo. The results of the NMA revealed the following findings regarding the incidence of NEC: arginine therapy was associated with lower incidence of NEC compared lactoferrin (RR = 0.39, 95%CI: 0.18, 0.87), EPO (RR = 2.25, 95%CI: 1.07, 4.75), glutamine (RR = 3.08, 95%CI: 1.34, 7.10) and placebo (RR = 3.12, 95%CI: 1.55, 6.31). Probiotics therapy was associated with a lower incidence of NEC compared glutamine (RR = 1.78, 95%CI: 1.08, 2.94) and placebo (RR = 1.81, 95%CI: 1.45, 2.25). Other comparisons did not yield statistically significant differences (Figure 4A).
Figure 4
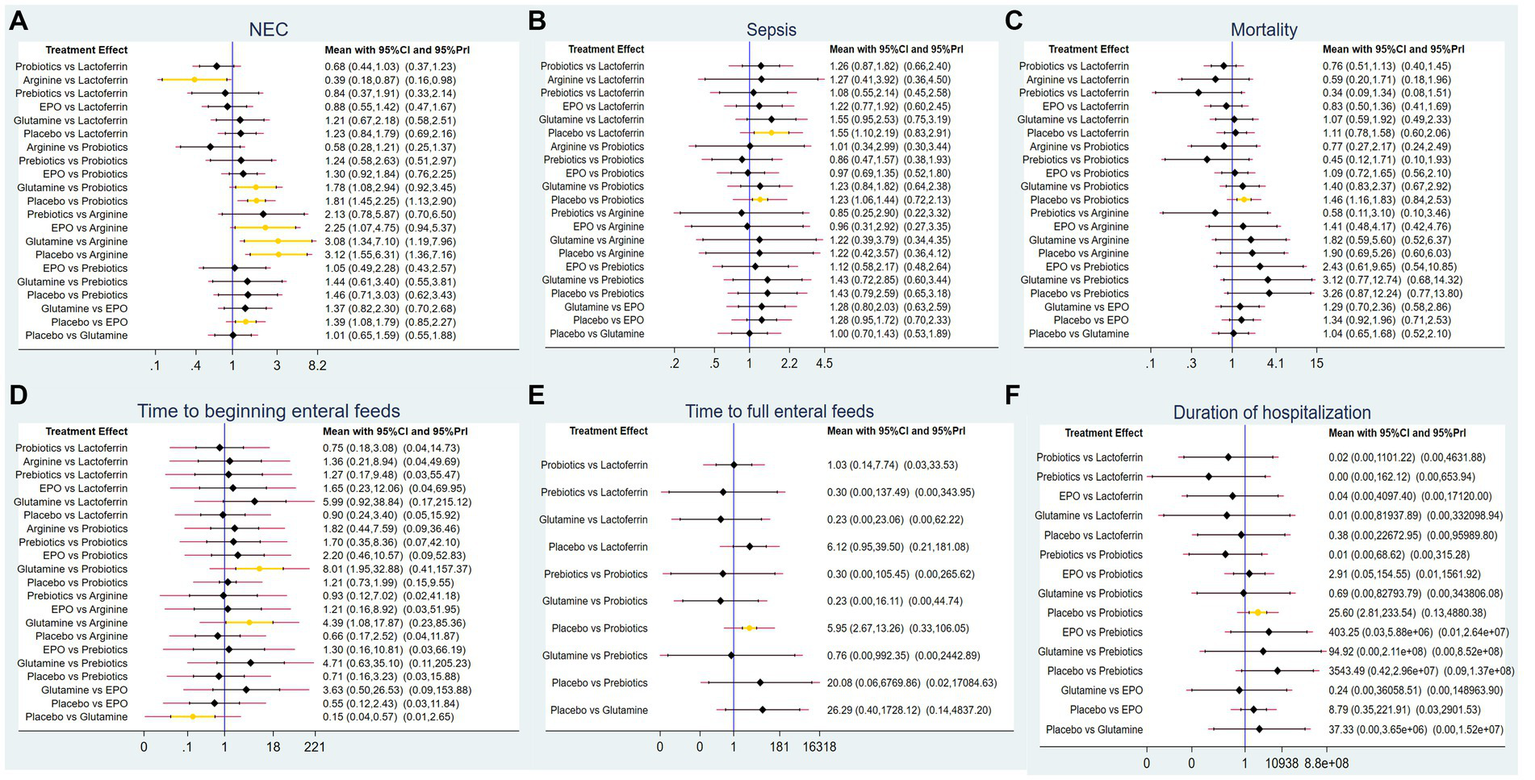
Forest plots for (A) the incidence of NEC, (B) the incidence of sepsis, (C) the incidence of overall mortality, (D) time to beginning enteral feeds, (E) time to full enteral feeds and (F) duration of hospitalization.
A ranking graph illustrating the distribution of probabilities for NEC is presented in Figure 5A. The SUCRA rankings for the incidence of NEC were as follows: arginine (3.2%) < probiotics (22.2%) < prebiotics (45.8%) < EPO (48.5%) < lactoferrin (61.7%) < glutamine (81.6%) < placebo (87.1%), which suggests that arginine is associated with the lowest probability of developing NEC while placebo has the lowest effect. Therefore, the efficacy in reducing the incidence of NEC was ranked from best to worst as follows: arginine, probiotics, prebiotics, EPO, lactoferrin, glutamine, and placebo.
Figure 5
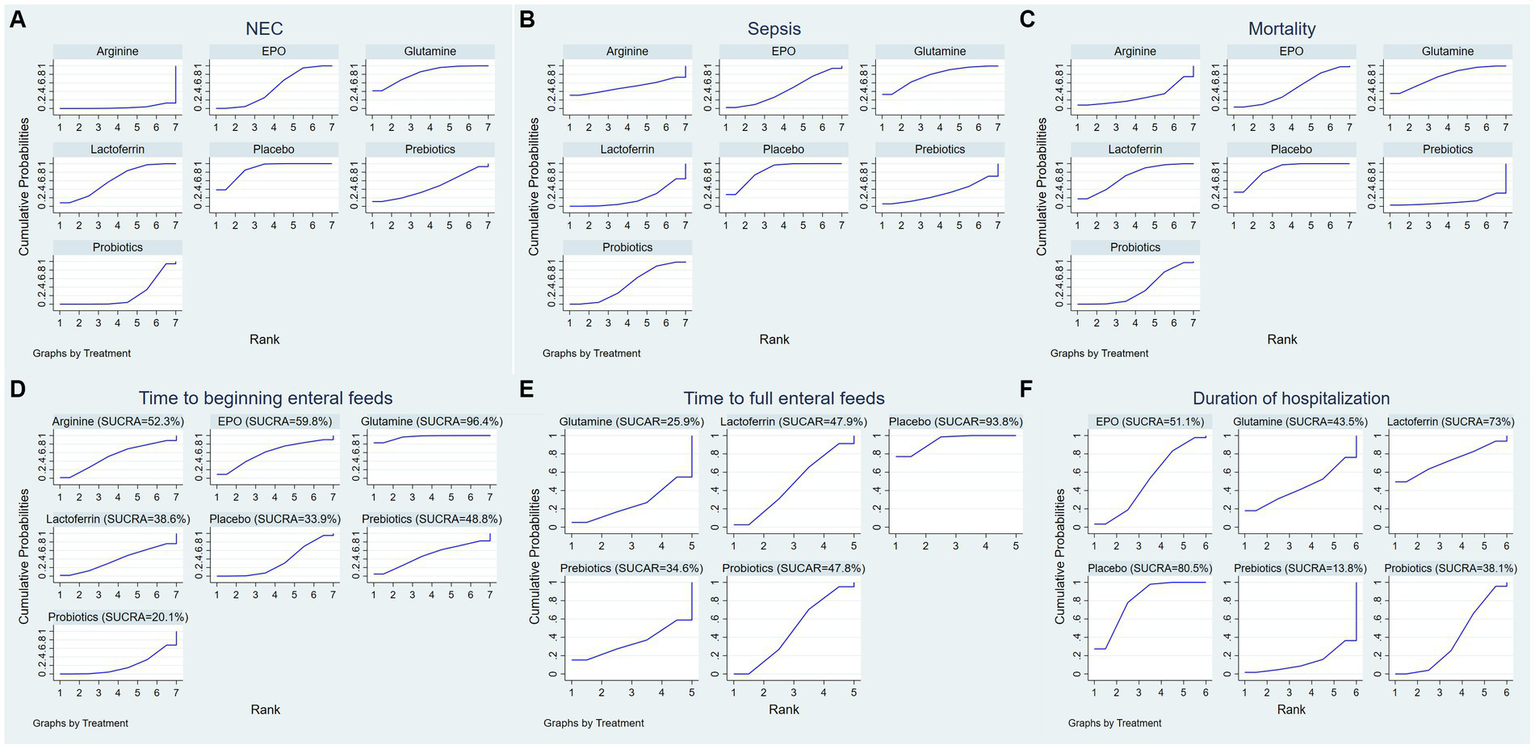
Surface under the cumulative ranking (SUCRA) for (A) the incidence of NEC, (B) the incidence of sepsis, (C) the incidence of overall mortality, (D) time to beginning enteral feeds, (E) time to full enteral feeds and (F) duration of hospitalization.
3.5.1.2 The incidence of NEC-associated sepsis
A total of 62 RCTs involving 20,994 neonates reported the incidence of post-treatment sepsis. The results of the NMA revealed that lactoferrin (RR = 1.55, 95% CI: 1.10, 2.19) and probiotics (RR = 1.23, 95% CI: 1.06, 1.44) had a higher effect on NEC-associated sepsis compared to placebo. Other comparisons did not yield statistically significant differences (Figure 4B).
A ranking graph illustrating the distribution of probabilities for NEC-associated sepsis is presented in Figure 5B. The SUCRA rankings for the incidence of NEC-associated sepsis were as follows: lactoferrin (18.7%) < prebiotics (31.3%) < EPO (42.9%) < probiotics (46.7%) < arginine (50.5%) < glutamine (77%) < placebo (83%), suggesting that lactoferrin was associated with the lowest probability of developing NEC-associated sepsis while placebo had the lowest effect. Therefore, the efficacy in reducing the incidence of NEC-associated sepsis was ranked from best to worst as follows: lactoferrin, prebiotics, EPO, probiotics, arginine, glutamine, and placebo.
3.5.1.3 The incidence of overall mortality
Sixty-two RCTs involving 20,438 neonates reported the incidence of overall mortality. The results of the NMA revealed that probiotics exhibited a lower incidence of overall mortality compared to placebo (RR = 1.46, 95%CI: 1.16, 1.83). Other comparisons did not yield statistically significant differences (Figure 4C).
A ranking graph illustrating the distribution of probabilities for overall mortality is presented in Figure 5C. The SUCRA rankings for the incidence of overall mortality were as follows: prebiotics (11.1%) < arginine (28.5%) < probiotics (35.3%) < EPO (45.9%) < lactoferrin (69.4%) < glutamine (74.9%) < placebo (84.8%), suggesting that prebiotics was associated with the lowest overall mortality while placebo had the lowest effect. Therefore, the efficacy in reducing the incidence of overall mortality was ranked from best to worst as follows: prebiotics, arginine, probiotics, EPO, lactoferrin, glutamine, and placebo.
3.5.2 Secondary outcomes
3.5.2.1 Time to beginning enteral feeds
Only 11 RCTs involving 2,144 neonates reported the time to beginning enteral feeds. The results of the NMA revealed the following findings: glutamine demonstrated a longer time compared to probiotics (WMD = 8.01, 95%CI: 1.95, 32.88), arginine (WMD = 4.39, 95%CI: 1.08, 17.87) and placebo (WMD = 0.15, 95%CI: 0.04, 0.57). Other comparisons did not yield statistically significant differences (Figure 4D).
A ranking graph illustrating the distribution of probabilities for the time to beginning enteral feeds is presented in Figure 5D. Based on the SUCRA, probiotics had the lowest SUCRA rank, indicating the lowest probability of the time to beginning enteral feeds, while glutamine had the highest probability. The SUCRA rankings for time to beginning enteral feeds were as follows: probiotics (20.1%) < placebo (33.9%) < lactoferrin (38.6%) < prebiotics (48.8%) < arginine (52.3%) < EPO (59.8%) < glutamine (96.4%). Therefore, the efficacy in shortening the time to beginning enteral feeds was ranked from best to worst as follows: probiotics, placebo, lactoferrin, prebiotics, arginine, EPO, and glutamine.
3.5.2.2 Time to full enteral feeds
A total of 27 RCTs with 5,916 neonates reported the time to full enteral feeds, involving five interventions including glutamine, prebiotics, probiotics, lactoferrin, and placebo. The NMA results revealed the following findings: probiotics demonstrated a shorter time to full enteral feeds compared to placebo (WMD = 5.95, 95%CI: 2.67, 13.26). Other comparisons did not yield statistically significant differences (Figure 4E).
A ranking graph illustrating the distribution of probabilities for the time to full enteral feeds is presented in Figure 5E. Based on the SUCRA, glutamine had the lowest SUCRA rank, indicating the lowest probability of the time to full enteral feeds, while placebo had the highest probability. The SUCRA rankings for time to full enteral feeds were as follows: glutamine (25.9%) < prebiotics (34.6%) < probiotics (47.8%) < lactoferrin (47.9%) < placebo (93.8%). Therefore, the efficacy in shortening the time to full enteral feeds was ranked from best to worst as follows: glutamine, prebiotics, probiotics, lactoferrin, and placebo.
3.5.2.3 Duration of hospitalization
A total of 34 RCTs with 9,642 neonates reported duration of hospitalization, involving six interventions, including lactoferrin, probiotics, prebiotics, glutamine, EPO, and placebo. The NMA results revealed the following: probiotics demonstrated a shorter duration of hospitalization compared to placebo (WMD = 25.6, 95%CI: 2.81, 233.54). Other comparisons did not yield statistically significant differences (Figure 4F).
A ranking graph illustrating the distribution of probabilities for duration of hospitalization is presented in Figure 5F. Based on the SUCRA, prebiotics had the lowest SUCRA rank, indicating the lowest probability of duration of hospitalization, while placebo had the highest probability. The SUCRA rankings for duration of hospitalization were as follows: prebiotics (13.8%) < probiotics (38.1%) < glutamine (43.5%) < EPO (51.1%) < lactoferrin (73%) < placebo (80.5%). Therefore, the efficacy in shortening duration of hospitalization was ranked from best to worst as follows: prebiotics, probiotics, glutamine, EPO, lactoferrin, and placebo.
3.6 Publication bias
Based on the outcomes observed for the incidence of NEC, NEC-associated sepsis, overall mortality, time to beginning enteral feeds, time to full enteral feeds and duration of hospitalization, NMA showed that the corrected funnel plots were generated to assess publication bias and potential small sample effects. The analysis revealed that most data points were well-distributed within the funnel plot, displaying relative symmetry on both sides. Additionally, the regression line closely paralleled the X-axis, indicating minimal likelihood of publication bias or small sample effects (Figure 6).
Figure 6
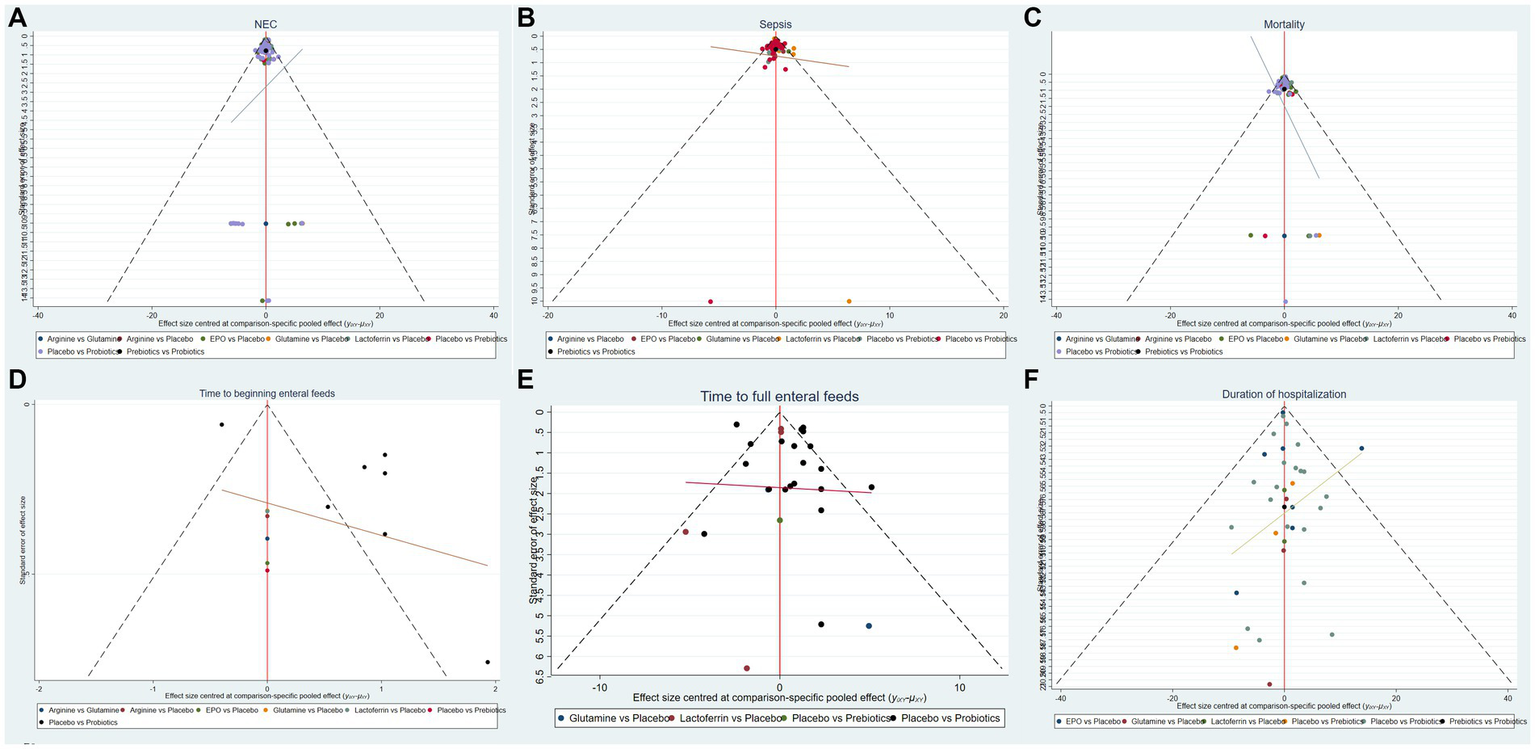
Funnel plots of (A) the incidence of NEC, (B) the incidence of sepsis, (C) the incidence of overall mortality, (D) time to beginning enteral feeds, (E) time to full enteral feeds and (F) duration of hospitalization.
4 Discussion
NEC continues to be one of the most severe acute GI afflictions in preterm and low-birth-weight infants (30). However, its precise etiology and pathogenesis are still not fully understood (31). Key factors implicated in NEC include intestinal mucosal barrier dysfunction, ischemia–reperfusion injury, inflammatory responses, and an imbalance in gut microbiota (32). Without effective treatments for NEC, research has shifted toward prevention strategies. Early initiation of breastfeeding has shown to be beneficial, particularly in preterm and low birth weight infants (5, 6, 33). However, the susceptibility to NEC is paradoxically increased (33–35) due to dysfunctional suckling and swallowing, GI reflux, and impaired motor coordination (36–38). As a result, parenteral nutrition is commonly initiated in these infants. The search for alternative NEC prevention methods has led to the discovery that probiotics, prebiotics, arginine, lactoferrin, EPO, and glutamine have significant roles in the primary prevention of NEC (17, 19, 20). With advancing insights into the pathogenesis of NEC, new avenues for prevention and treatment are continually being explored.
This study integrates data from 89 RCTs on six interventions (including probiotics, prebiotics, arginine, lactoferrin, EPO, and glutamine), utilizing NMA to evaluate their impact on NEC incidence, NEC-associated sepsis and mortality, and to rank their probabilities of efficacy. NMA indicated the following ranking from most to least effective in decreasing the incidence of NEC in preterm infants: arginine, probiotics, prebiotics, erythropoietin, lactoferrin, glutamine, placebo; for the reduction of NEC-associated sepsis events: lactoferrin, prebiotics, erythropoietin, probiotics, arginine, glutamine, placebo; and for the reduction of overall mortality: prebiotics, arginine, probiotics, erythropoietin, lactoferrin, glutamine, placebo. The ranking for time to beginning enteral feeds was: probiotics, placebo, lactoferrin, prebiotics, arginine, erythropoietin, glutamine; for time to full enteral feeds: glutamine, prebiotics, probiotics, lactoferrin, placebo; and for hospital stay duration: prebiotics, probiotics, glutamine, erythropoietin, lactoferrin, placebo. A comprehensive analysis of these six outcomes suggests an overall clinical efficacy ranking from most to least effective for the aforementioned drugs as follows: arginine, probiotics, prebiotics, lactoferrin, erythropoietin, glutamine, and placebo.
Intestinal microcirculatory perfusion is predominantly regulated by nitric oxide (NO), a vasodilator synthesized via the activity of endothelial nitric oxide synthase (eNOS) (7). Upon entry of harmful bacteria into the circulation, expression levels of eNOS are suppressed. Decreased plasma NO levels can lead to significant vasoconstriction, disrupts intestinal perfusion and result in hypoxia, a hallmark of necrosis seen in NEC. To boost eNOS activity, Moreira et al. (39) incorporated arginine into their research, an amino acid precursor to NO that is crucial for preventing tissue injury (40). A deficiency in endogenous arginine synthesis can restrict NO production and impair vasodilation in the postprandial intestinal circulation. Chen et al. (41) discovered that arginine supplementation increases blood flow within the intestinal microvasculature and can prevent NEC, whereas arginine antagonists may intensify the condition. The findings of the present study further indicate that arginine significantly reduces the incidence of NEC in premature infants, which aligns with the recent findings by Wang et al. (42). Moreover, arginine demonstrates a substantial advantage in decreasing the incidence of sepsis and overall mortality.
Compared to placebo, lactoferrin showed a statistically significant difference in efficacy in reducing the incidence of NEC and NEC-associated sepsis. Acccording to probability ranking, lactoferrin is the most effective intervention in decreasing the incidence of NEC-associated sepsis, outperforming other measures. These findings largely align with prior meta-analytic conclusions (43, 44). The broad-spectrum antimicrobial effects of lactoferrin are likely due to its multiple mechanisms of action, including cell membrane disruption, iron sequestration, immune modulation, and direct antimicrobial activity, which collectively inhibit the growth of bacteria, fungi, and viruses (45). This contributes to reducing the incidence of advanced NEC stages, specifically stages II and III NEC (44). However, there is a discrepancy with the findings of Gao’s study (46), potentially due to limited study inclusion and a small sample size.
Prebiotics showed superior efficacy in reducing overall mortality and hospital stay of NEC patients. Prebiotics naturally present in breast milk, comprising over 200 varieties of human milk oligosaccharides (HMOs) (47). These prebiotics promote the proliferation of beneficial microbes such as Bifidobacteria and Lactobacilli. Their life-saving potential is likely due to the prevention of pathogen colonization and the unchecked growth of opportunistic pathogens (48). Furthermore, prebiotics enhance gut motility and permeability in preterm infants, thus improving intestinal epithelium integrity. The synergistic effects of pathogen inhibition and the prevention of their adherence to the epithelial surface may bolster the resistance of preterm infants to endogenous infections (49, 50). This study also corroborates that probiotics expedite the initiation of postnatal enteral feeding. Aligning with the findings by Athalye-Jape et al. (51), this may be attributed to the promotion of GI maturity and motility through the extension of intestinal transit time, acceleration of gastric emptying, and augmentation of mesenteric arterial blood flow post-probiotic administration.
The present study has some limitations. First, only English-language literature was included. Secondly, the interpretability of findings is restricted due to inadequate details on randomization methods and allocation concealment in many trials. Thirdly, an economic analysis was not performed.
Despite these limitations, the key strengths of this paper are: (1) an expanded evaluation of interventional drugs based on prior research, offering a broader comparison of clinical efficacies for preventing NEC in preterm infants, with results reflecting the most comprehensive current evidence; (2) inclusion of 89 RCTs, addressing the previous meta-analyses limitations of the limited study scope and sample size, thus providing a more robust evidence base.
5 Conclusion
Existing literature highlights arginine as the most efficacious pharmacological agent in preventing NEC in preterm infants. It has been shown to effectively lower the rates of NEC, septicemia, and mortality, warranting its recommendation as the first-line clinical intervention. Following this, probiotics are recommended as a second option.
Statements
Data availability statement
The original contributions presented in the study are included in the article/supplementary material, further inquiries can be directed to the corresponding author.
Author contributions
JC: Conceptualization, Data curation, Formal analysis, Funding acquisition, Investigation, Methodology, Project administration, Resources, Software, Supervision, Validation, Visualization, Writing – original draft, Writing – review & editing. XC: Data curation, Methodology, Resources, Supervision, Writing – original draft, Writing – review & editing. XH: Investigation, Resources, Supervision, Visualization, Writing – review & editing. JL: Resources, Supervision, Writing – review & editing. QY: Resources, Supervision, Writing – review & editing.
Funding
The author(s) declare that financial support was received for the research, authorship, and/or publication of this article. This work was support by the Neijiang Science and Technology Plan Project (grant number 2024NJJCYJZYY003).
Conflict of interest
The authors declare that the research was conducted in the absence of any commercial or financial relationships that could be construed as a potential conflict of interest.
Publisher’s note
All claims expressed in this article are solely those of the authors and do not necessarily represent those of their affiliated organizations, or those of the publisher, the editors and the reviewers. Any product that may be evaluated in this article, or claim that may be made by its manufacturer, is not guaranteed or endorsed by the publisher.
References
1.
Neu J Walker WA . Necrotizing enterocolitis. Exp Biol Med (Maywood). (2011) 364:255–64. doi: 10.1056/NEJMra1005408
2.
Rich BS Dolgin SE . Necrotizing enterocolitis. Pediatr Rev. (2017) 38:552–9. doi: 10.1542/pir.2017-0002
3.
Meister AL Doheny KK Travagli RA . Necrotizing enterocolitis: It’s not all in the gut. Exp Biol Med (Maywood). (2020) 245:85–95. doi: 10.1177/1535370219891971
4.
Yee WH Soraisham AS Shah VS Aziz K Yoon W Lee SK . Incidence and timing of presentation of necrotizing enterocolitis in preterm infants. Pediatrics. (2012) 129:e298–304. doi: 10.1542/peds.2011-2022
5.
Neu J . Preterm infant nutrition, gut bacteria, and necrotizing enterocolitis. Curr Opin Clin Nutr Metab Care. (2015) 18:285–8. doi: 10.1097/mco.0000000000000169
6.
Niño DF Sodhi CP Hackam DJ . Necrotizing enterocolitis: new insights into pathogenesis and mechanisms. Nat Rev Gastroenterol Hepatol. (2016) 13:590–600. doi: 10.1038/nrgastro.2016.119
7.
Yazji I Sodhi CP Lee EK Good M Egan CE Afrazi A et al . Endothelial TLR4 activation impairs intestinal microcirculatory perfusion in necrotizing enterocolitis via eNOS-NO-nitrite signaling. Proc Natl Acad Sci USA. (2013) 110:9451–6. doi: 10.1073/pnas.1219997110
8.
Bellodas Sanchez J Kadrofske M . Necrotizing enterocolitis. Neurogastroenterol Motil. (2019) 31:e13569. doi: 10.1111/nmo.13569
9.
Neu J . Necrotizing enterocolitis: the future. Neonatology. (2020) 117:240–4. doi: 10.1159/000506866
10.
Nolan LS Wynn JL Good M . Exploring clinically-relevant experimental models of neonatal shock and necrotizing enterocolitis. Shock. (2020) 53:596–604. doi: 10.1097/shk.0000000000001507
11.
Tanner SM Berryhill TF Ellenburg JL Jilling T Cleveland DS Lorenz RG et al . Pathogenesis of necrotizing enterocolitis: modeling the innate immune response. Am J Pathol. (2015) 185:4–16. doi: 10.1016/j.ajpath.2014.08.028
12.
Duess JW Sampah ME Lopez CM Tsuboi K Scheese DJ Sodhi CP et al . Hackam: necrotizing enterocolitis, gut microbes, and sepsis. Gut Microbes. (2023) 15:2221470. doi: 10.1080/19490976.2023.2221470
13.
Zhou KZ Wu K Deng LX Hu M Luo YX Zhang LY . Probiotics to prevent necrotizing enterocolitis in very low birth weight infants: a network meta-analysis. Front Pediatr. (2023) 11:1095368. doi: 10.3389/fped.2023.1095368
14.
Wang J Zhou N Shen P Li F Zhao Q Zang D et al . Human milk-derived MANF, as an immuno-nutritional factor, maintains the intestinal epithelial barrier and protects against necrotizing enterocolitis. J Nutr Biochem. (2023) 121:109431. doi: 10.1016/j.jnutbio.2023.109431
15.
Xiong X Wang Y Chen X . Mixed feedings and necrotizing enterocolitis: the proportion of human milk matters. Breastfeed Med. (2023) 18:469–74. doi: 10.1089/bfm.2022.0268
16.
Bührer C Fischer HS Wellmann S . Nutritional interventions to reduce rates of infection, necrotizing enterocolitis and mortality in very preterm infants. Pediatr Res. (2020) 87:371–7. doi: 10.1038/s41390-019-0630-2
17.
Ananthan A Balasubramanian H . Early erythropoietin for preventing necrotizing enterocolitis in preterm neonates - an updated meta-analysis. Eur J Pediatr. (2022) 181:1821–33. doi: 10.1007/s00431-022-04394-y
18.
Nasef M Ben Turkia H Haider Ali AM Mahdawi E Nair A . To what extent does arginine reduce the risk of developing necrotizing enterocolitis?Cureus. (2023) 15:e45813. doi: 10.7759/cureus.45813
19.
Zhou J Yang M Wang F Liu S Hei M Jiang M . Assessment of food supplements for the prevention of necrotizing enterocolitis in preterm neonates: a systematic review and network meta-analysis. Comput Biol Med. (2023) 167:107601. doi: 10.1016/j.compbiomed.2023.107601
20.
Adams ED . Probiotics, prebiotics, Lactoferrin, and combination products to prevent mortality and morbidity in preterm infants. J Obstet Gynecol Neonatal Nurs. (2024) 53:101–5. doi: 10.1016/j.jogn.2024.05.140
21.
Calvo LN Greenberg RG Gray KD . Safety and effectiveness of probiotics in preterm infants with necrotizing enterocolitis. NeoReviews. (2024) 25:e193–206. doi: 10.1542/neo.25-4-e193
22.
Kruth SS Willers C Persad E Sjöström ES Lagerström SR Rakow A . Probiotic supplementation and risk of necrotizing enterocolitis and mortality among extremely preterm infants-the probiotics in extreme prematurity in Scandinavia (PEPS) trial: study protocol for a multicenter, double-blinded, placebo-controlled, and registry-based randomized controlled trial. Trials. (2024) 25:259. doi: 10.1186/s13063-024-08088-8
23.
Aceti A Gori D Barone G Callegari ML Di Mauro A Fantini MP et al . Probiotics for prevention of necrotizing enterocolitis in preterm infants: systematic review and meta-analysis. Ital J Pediatr. (2015) 41:89. doi: 10.1186/s13052-015-0199-2
24.
Beghetti I Panizza D Lenzi J . Probiotics for preventing necrotizing enterocolitis in preterm infants: a network meta-analysis. Nutrients. (2021) 13:192. doi: 10.3390/nu13010192
25.
Wang H Meng X Xing S Guo B Chen Y Pan YQ . Probiotics to prevent necrotizing enterocolitis and reduce mortality in neonates: a meta-analysis. Medicine (Baltimore). (2023) 102:e32932. doi: 10.1097/md.0000000000032932
26.
Rouse B Chaimani A Li T . Network meta-analysis: an introduction for clinicians. Intern Emerg Med. (2017) 12:103–11. doi: 10.1007/s11739-016-1583-7
27.
Puerto Nino AK Brignardello-Petersen R . How to read a network meta-analysis. Eur Urol Focus. (2023) 9:701–4. doi: 10.1016/j.euf.2023.10.018
28.
Page MJ McKenzie JE Bossuyt PM Boutron I Hoffmann TC Mulrow CD et al . The PRISMA 2020 statement: an updated guideline for reporting systematic reviews. BMJ. (2021) 372:n71. doi: 10.1136/bmj.n71
29.
Shea BJ Reeves BC Wells G Thuku M Hamel C Moran J et al . AMSTAR 2: a critical appraisal tool for systematic reviews that include randomised or non-randomised studies of healthcare interventions, or both. BMJ. (2017) 358:j4008. doi: 10.1136/bmj.j4008
30.
Mara KC Clark RH Carey WA . Necrotizing enterocolitis in very low birth weight neonates: a natural history study. Am J Perinatol. (2024) 41:e435–45. doi: 10.1055/a-1851-1692
31.
Roberts AG Younge N . Neonatal necrotizing enterocolitis: an update on pathophysiology, treatment, and prevention. Paediatr Drugs. (2024) 26:259–75. doi: 10.1007/s40272-024-00626-w
32.
Eaton S Rees CM Hall NJ . Current research on the epidemiology, pathogenesis, and Management of Necrotizing Enterocolitis. Neonatology. (2017) 111:423–30. doi: 10.1159/000458462
33.
Shulhan J Dicken B Hartling L Larsen BM . Current knowledge of necrotizing enterocolitis in preterm infants and the impact of different types of enteral nutrition products. Adv Nutr. (2017) 8:80–91. doi: 10.3945/an.116.013193
34.
Neu J Mshvildadze M Mai V . A roadmap for understanding and preventing necrotizing enterocolitis. Curr Gastroenterol Rep. (2008) 10:450–7. doi: 10.1007/s11894-008-0084-x
35.
Luig M Lui K . Epidemiology of necrotizing enterocolitis--part II: risks and susceptibility of premature infants during the surfactant era: a regional study. J Paediatr Child Health. (2005) 41:174–9. doi: 10.1111/j.1440-1754.2005.00583.x
36.
Lau C Smith EO Schanler RJ . Coordination of suck-swallow and swallow respiration in preterm infants. Acta Paediatr. (2003) 92:721–7.
37.
Ward RM Beachy JC . Neonatal complications following preterm birth. BJOG. (2003) 110:8–16. doi: 10.1016/s1470-0328(03)00012-0
38.
Moore TA Pickler RH . Feeding intolerance, inflammation, and neurobehaviors in preterm infants. J Neonatal Nurs. (2017) 23:134–41. doi: 10.1016/j.jnn.2016.09.009
39.
Moreira GA Dias A Cadena S Corrêa-Ferreira ML Ioshii SO Fachin CG . Use of sildenafil and L-arginine in an experimental rat model for the prevention of neonatal necrotizing enterocolitis. Sci Rep. (2022) 12:6206. doi: 10.1038/s41598-022-10323-8
40.
Gurbuz AT Kunzelman J Ratzer EE . Supplemental dietary arginine accelerates intestinal mucosal regeneration and enhances bacterial clearance following radiation enteritis in rats. J Surg Res. (1998) 74:149–54. doi: 10.1006/jsre.1997.5231
41.
Chen Y Koike Y Chi L Ahmed A Miyake H . Formula feeding and immature gut microcirculation promote intestinal hypoxia, leading to necrotizing enterocolitis. Dis Model Mech. (2019) 12:dmm040998. doi: 10.1242/dmm.040998
42.
Wang X Sadeghirad B Morgan RL Zeratkaar D Chang Y Crandon HN et al . Amino acids for the prevention of mortality and morbidity in preterm infants: a systematic review and network meta-analysis. Sci Rep. (2022) 12:18333. doi: 10.1038/s41598-022-21318-w
43.
He Y Cao L Yu J . Prophylactic lactoferrin for preventing late-onset sepsis and necrotizing enterocolitis in preterm infants: a PRISMA-compliant systematic review and meta-analysis. Medicine (Baltimore). (2018) 97:e11976. doi: 10.1097/md.0000000000011976
44.
Pammi M Suresh G . Enteral lactoferrin supplementation for prevention of sepsis and necrotizing enterocolitis in preterm infants. Cochrane Database Syst Rev. (2020) 3:Cd007137. doi: 10.1002/14651858.CD007137.pub6
45.
Wakabayashi H Takakura N Yamauchi K Tamura Y . Modulation of immunity-related gene expression in small intestines of mice by oral administration of lactoferrin. Clin Vaccine Immunol. (2006) 13:239–45. doi: 10.1128/cvi.13.2.239-245.2006
46.
Gao Y Hou L Lu C Wang Q Pan B Wang Q et al . Enteral Lactoferrin supplementation for preventing sepsis and necrotizing enterocolitis in preterm infants: a meta-analysis with trial sequential analysis of randomized controlled trials. Front Pharmacol. (2020) 11:1186. doi: 10.3389/fphar.2020.01186
47.
Zivkovic AM German JB Lebrilla CB Mills DA . Human milk glycobiome and its impact on the infant gastrointestinal microbiota. Proc Natl Acad Sci USA. (2011) 108:4653–8. doi: 10.1073/pnas.1000083107
48.
Chi C Buys N Li C . Effects of prebiotics on sepsis, necrotizing enterocolitis, mortality, feeding intolerance, time to full enteral feeding, length of hospital stay, and stool frequency in preterm infants: a meta-analysis. Eur J Clin Nutr. (2019) 73:657–70. doi: 10.1038/s41430-018-0377-6
49.
Di R Vakkalanka MS Onumpai C Chau HK White A Rastall RA et al . Pectic oligosaccharide structure-function relationships: prebiotics, inhibitors of Escherichia coli O157:H7 adhesion and reduction of Shiga toxin cytotoxicity in HT29 cells. Food Chem. (2017) 227:245–54. doi: 10.1016/j.foodchem.2017.01.100
50.
Vieira ADS Bedani R Albuquerque MAC Biscola V Saad SMI . The impact of fruit and soybean by-products and amaranth on the growth of probiotic and starter microorganisms. Food Res Int. (2017) 97:356–63. doi: 10.1016/j.foodres.2017.04.026
51.
Athalye-Jape G Deshpande G Rao S Patole S . Benefits of probiotics on enteral nutrition in preterm neonates: a systematic review. Am J Clin Nutr. (2014) 100:1508–19. doi: 10.3945/ajcn.114.092551
Summary
Keywords
preterm infants, necrotizing enterocolitis, drugs, network meta-analysis, randomized controlled trials
Citation
Chen J, Chen X, Huang X, Liu J and Yu Q (2024) Comparative efficacy of different single drugs to prevent necrotizing enterocolitis in preterm infants: an update systematic review and network meta-analysis. Front. Nutr. 11:1452338. doi: 10.3389/fnut.2024.1452338
Received
20 June 2024
Accepted
27 August 2024
Published
09 September 2024
Volume
11 - 2024
Edited by
Teleky Bernadette-Emoke, University of Agricultural Sciences and Veterinary Medicine of Cluj-Napoca, Romania
Reviewed by
Mesfin Abebe, Dilla University, Ethiopia
Nikolai Kolba, Cornell University, United States
Xiaohan Hu, Children’s Hospital of Soochow University, China
Updates
Copyright
© 2024 Chen, Chen, Huang, Liu and Yu.
This is an open-access article distributed under the terms of the Creative Commons Attribution License (CC BY). The use, distribution or reproduction in other forums is permitted, provided the original author(s) and the copyright owner(s) are credited and that the original publication in this journal is cited, in accordance with accepted academic practice. No use, distribution or reproduction is permitted which does not comply with these terms.
*Correspondence: Jing Chen, 983394631@qq.com
†These authors have contributed equally to this work and share first authorship
Disclaimer
All claims expressed in this article are solely those of the authors and do not necessarily represent those of their affiliated organizations, or those of the publisher, the editors and the reviewers. Any product that may be evaluated in this article or claim that may be made by its manufacturer is not guaranteed or endorsed by the publisher.