Abstract
Background:
This study aimed to identify the main dietary patterns in Hechuan and clarify how they are associated with obesity phenotypes.
Methods:
A cross-sectional study was conducted based on a baseline survey of a general population cohort study in southwest China. A semi-quantitative food frequency questionnaire (FFQ) was used to investigate the dietary habits of the participants in the past year. Principal component analysis was conducted to identify the main dietary patterns, and multinomial logistic regression analysis was conducted to describe the association between the major dietary patterns and obesity phenotypes.
Results:
Three major dietary patterns were identified. The participants who followed the wheaten food dietary pattern had a higher likelihood of having metabolically normal obesity (MHO) (odds ratio (OR) 1.05, 95% confidence interval (CI) 1.02–1.08), metabolically abnormal normal weight (MUNW) (OR 1.08, 95%CI 1.00–1.16), and metabolically abnormal obesity (MUO) (OR 1.07, 95%CI 1.04–1.11). Specifically, those with the highest wheaten food dietary pattern were 1.60 times more likely to have MHO (OR 1.60, 95%CI 1.25–2.05), 2.62 times more likely to have MUNW (OR 2.62, 95%CI 1.28–5.37), and 2.01 times more likely to have MUO (OR 2.01, 95%CI 1.51–2.69) than those with the lowest wheaten food dietary pattern.
Conclusion:
The wheaten food dietary pattern may increase the risk of obesity and metabolic abnormalities. Therefore, timely interventions should be carried out for this group of people.
Introduction
Obesity is a multifactorial, relapsing, and chronic disease (1). In 2015, global obesity reached 107.7 million in children and 603.7 million in adults (2). Since the reform and opening-up policy, the prevalence of obesity in China has been increasing at an alarming rate (3). In China, from 2014 to 2018, the prevalence of overall obesity and abdominal obesity was 15.8 and 37.6% in women and 15.0 and 36.3% in men, respectively (4). In 2022, obesity and central obesity among adults over 18 years old in Hechuan were 16.16 and 33.51%, respectively (5). Obesity is linked to a range of diseases and complications, which can complicate obesity prevention and management (6–10). The traditional definition of obesity only considers the body mass index (BMI). However, the “obesity paradox” tends to emerge in this classification (11, 12). Therefore, it is unacceptable to evaluate the risk of obesity on health only based on the BMI (13). An alternative approach is to combine the BMI and metabolic syndrome (MetS) to identify heterogeneity in obesity. Patients can be divided into four phenotypes: metabolically healthy normal weight (MHNW), metabolically normal obesity (MHO), metabolically abnormal normal weight (MUNW), and metabolically abnormal obesity (MUO). The term “metabolic health” here refers to having no presence of MetS (14). The prevalence of MHO, MUNW, and MUO in China has been reported to be 3.9, 18.1, and 9.8%, respectively (15). Different types of obesity have varying impacts on health. Therefore, it is crucial to categorize obese patients based on their phenotype, identify potential risk factors, and intervene at the right time to reduce the incidence of obesity.
Lifestyle intervention has been regarded as the cornerstone of obesity management (16). Except for individual nutrients, more attention is given to overall dietary patterns and their impact on obesity and cardiovascular metabolism (17). It is important to conduct an overall dietary pattern analysis to better understand how different dietary patterns contribute to obesity and MetS. However, there are limited studies on the relationship between dietary patterns and obesity in Hechuan, Chongqing, China. A general population cohort study in southwest China (multi-ethnic cohort study) was conducted in 2017 (18). Hechuan, as a subcohort, completed a baseline survey of local residents in 2018. Based on the baseline data, this study aimed to (1) identify the main dietary patterns of residents in Hechuan; (2) describe the socio-demographic and lifestyle characteristics of different obesity phenotypes in Hechuan; and (3) investigate the association between major dietary patterns and obesity phenotypes and identify factors influencing obesity phenotypes.
Methods
Data were derived from the baseline survey of the 2018 multi-ethnic cohort study conducted in Hechuan. A multi-stage stratified random sampling method was used to select residents aged 30–79 years in Hechuan, Chongqing, as the research participants. We have provided the STROBE checklist in the supplementary materials.
Previous studies have elucidated comprehensive methodological and research protocols (19). Using PASS software, the minimum sample size was calculated to be 500. A total of 3,009 residents were included in the cohort. All participants completed a questionnaire, anthropometric measurements, and laboratory examinations. The Medical Ethics Review Committee of Sichuan University and the local review committee approved the research protocol. All respondents participated voluntarily and signed an informed consent form. A total of 2,929 participants were included in the analysis after excluding those with a BMI of less than 18.5 kg/m2. Trained and qualified investigators used tablet computers to conduct the electronic questionnaire survey for all participants in the form of face-to-face interviews. This questionnaire was developed for the multi-ethnic cohort study and was validated (20). Standard methods were used to measure height, weight, waist circumference (WC), hip circumference, and blood pressure. Mean systolic blood pressure (SBP) and mean diastolic blood pressure (DBP) are the average of three consecutive measurements, and the BMI (kg/m2) is calculated by dividing weight (kg) by height (m) squared. The AU5800 automatic biochemical analyzer (Beckman Coulter Co, LTD) was used to test the biological samples.
The dietary habits of the participants were investigated using a semi-quantitative food frequency questionnaire (FFQ) to obtain the average consumption amount of each person for every food. Based on the Kaiser–Meyer–Olkin (KMO) result of 0.66 and the Bartlett’s test of sphericity (BTS) result of p < 0.001, it appeared that the data were appropriate for factor analysis. Eigenvalue >1 was considered the criterion for the inclusion of common factors. Three major dietary patterns were identified, namely “white meat and egg dietary pattern,” “rice and red meat dietary pattern,” and “wheaten food dietary pattern.”
According to the Expert Consensus on Obesity Prevention and Control of Chinese Residents (21), a BMI of less than 18.5 kg/m2 is considered underweight, 18.5 to 23.9 kg/m2 is considered normal weight, 24.0 to 27.9 kg/m2 is considered overweight, and 28.0 kg/m2 or above is considered obesity. According to the Unified Joint Scientific Statement (22), those who meet three or more of the following criteria are diagnosed with MetS: (1) abdominal obesity: men WC ≥90 cm and women WC ≥85 cm; (2) hyperglycemia: fasting plasma glucose (FPG) ≥6.1 mmol/L; (3) elevated blood pressure: SBP > 130 and/or DBP > 85 mmHg; (4) triglyceride (TG) ≥1.70 mmol/L; and (5) high-density lipoprotein-cholesterol (HDL-C) < 1.0 mmol/L in men and < 1.3 mmol/L in women. According to the BMI and metabolic status, the study participants could be divided into four obesity phenotypes: MHNW, MHO, MUNW, and MUO.
Continuous variables were expressed as mean ± standard deviation. Categorical variables were expressed as n (%). An ANOVA was used for the continuous variables, while a chi-square test was used for the categorical variables. The pairwise comparison was corrected using the Bonferroni method (23). The association of the major dietary patterns with the obesity phenotypes was quantified by multinomial logistic regression analysis, with MHNW as the reference group. We adjusted for the following confounding factors: age, gender, education, household income, marital status, symptoms of insomnia, symptoms of anxiety, symptoms of depression, total daily energy intake, smoking, and drinking. A linear trend test was performed by entering the median of each quartile into the model as a continuous variable (20). Statistical analysis was performed using the R Project for Statistical Computing version 4.2.3 (Vienna, Austria).
Results
Among the four phenotypes, the MHO phenotype accounted for 37.97% of the total population and 61.74% of the overweight/obese population. The MHNW phenotype accounted for 35.78% of the total population and 92.90% of the normal-weight population. The MUO phenotype accounted for 23.52% of the total population and 38.26% of the overweight/obese population. The MUNW phenotype accounted for 2.73% of the total population and 7.09% of the normal-weight population. The population-based sociological characteristics of the different phenotypes are shown in Table 1. MHNW was the reference group, while the other three groups were different in age, and the individuals with unhealthy metabolism were more likely to be elderly. Regardless of metabolism, the obese individuals were more likely to be those with junior high school education or below and premenopausal women. The MUO group was more likely to include widows, smokers, spicy eaters, individuals with depressive symptoms, and those with a family history of cardiovascular disease. The MHO group was more likely to include those with low income and beverage consumers.
Table 1
| Characteristics | MHNW | MHO | MUNW | MUO | p-value |
|---|---|---|---|---|---|
| N (%) | 1,048 (35.78) | 1,112 (37.97) | 80 (2.73) | 689 (23.52) | <0.001 |
| Gender (%) | <0.001 | ||||
| Men (%) | 382 (36.45) | 481 (43.26) | 30 (37.50) | 361 (52.40) | |
| Women (%) | 666 (63.55) | 631 (56.74) | 50 (62.50) | 328 (47.61) | |
| Age | 49.73 ± 11.70 | 51.07 ± 10.87 | 59.59 ± 9.53 | 56.10 ± 11.03 | <0.001 |
| Marital status (%) | <0.001 | ||||
| Married/cohabiting (%) | 939 (89.60) | 1,024 (92.09) | 67 (83.75) | 611 (88.68) | |
| Separated/divorced (%) | 59 (5.63) | 45 (4.05) | 6 (7.50) | 26 (3.77) | |
| Widowed (%) | 39 (3.72) | 33 (2.97) | 7 (8.75) | 50 (7.26) | |
| Spinsterhood (%) | 11 (1.05) | 10 (0.90) | 0 (0.00) | 2 (0.29) | |
| Education (%) | <0.001 | ||||
| No schooling (%) | 74 (7.06) | 105 (9.44) | 9 (11.25) | 94 (13.64) | |
| Primary school (%) | 298 (28.44) | 377 (33.90) | 30 (37.50) | 206 (29.90) | |
| Middle school (%) | 358 (34.16) | 362 (32.55) | 20 (25.00) | 233 (33.82) | |
| High school (%) | 167 (15.94) | 160 (14.39) | 15 (18.75) | 97 (14.08) | |
| College/university (%) | 151 (14.41) | 108 (9.71) | 6 (7.50) | 59 (8.56) | |
| Household income (Yuan/year, %) | 0.05 | ||||
| <59,999 | 640 (61.07) | 743 (66.82) | 56 (70.00) | 435 (63.13) | |
| 60,000–99,999 | 207 (19.75) | 199 (17.90) | 18 (22.50) | 140 (20.32) | |
| 100,000–199,999 | 164 (15.65) | 148 (13.31) | 5 (6.25) | 94 (13.64) | |
| ≥200,000 | 37 (3.53) | 22 (1.98) | 1 (1.25) | 20 (2.90) | |
| Agricultural work (%) | 236 (22.52) | 298 (26.80) | 21 (26.25) | 169 (24.53) | 0.14 |
| Smoke (%) | 236 (22.52) | 298 (26.80) | 21 (26.25) | 169 (24.53) | <0.001 |
| Drinks (%) | 564 (53.82) | 602 (54.14) | 34 (42.50) | 395 (57.33) | 0.07 |
| Beverages (%) | 19 (1.81) | 40 (3.60) | 2 (2.50) | 14 (2.03) | 0.05 |
| Dietary supplement intake (%) | 174 (16.60) | 191 (17.18) | 14 (17.50) | 112 (16.26) | 0.95 |
| Spicy food eaters (%) | 892 (85.11) | 928 (83.45) | 65 (81.25) | 591 (85.78) | 0.43 |
| Peppery food eaters (%) | 890 (84.92) | 936 (84.17) | 62 (77.50) | 612 (88.82) | <0.001 |
| Total energy intake (kcal/day) | 1909.32 (590.57) | 1915.38 (617.25) | 1816.30 (612.55) | 1935.36 (613.60) | 0.57 |
| Physical activity (MET-hours/day) | 2.15 (3.38) | 2.28 (3.35) | 3.17 (4.52) | 2.66 (3.66) | 0.07 |
| Insomnia symptoms (%) | 436 (41.60) | 479 (43.08) | 38 (47.50) | 328 (47.61) | 0.08 |
| Depressive symptoms (%) | 297 (28.34) | 305 (27.43) | 30 (37.50) | 227 (32.95) | 0.02 |
| Anxiety symptoms (%) | 344 (32.82) | 353 (31.74) | 26 (32.50) | 234 (33.96) | 0.81 |
| Family history of cardiovascular disease (%) | 61 (5.82) | 51 (4.59) | 3 (3.75) | 55 (7.98) | 0.02 |
| Menopausal status in women (%) | <0.001 | ||||
| Perimenopausal | 393 (59.01) | 331 (52.46) | 8 (16.00) | 56 (17.07) | |
| Postmenopausal | 44 (6.61) | 40 (6.34) | 0 (0.00) | 17 (5.18) | |
| Premenopausal | 229 (34.38) | 260 (41.20) | 42 (84.00) | 255 (77.74) |
Demographic characteristics of different obesity phenotypes.
Bold numbers in the table represent p < 0.05. MET, metabolic equivalent of task.
The MHO, MUNW, and MUO phenotypes had lower mean concentrations of HDL cholesterol compared to the MHNW phenotype. However, other metabolic parameters in the three phenotypes were higher than in the MHNW phenotype. The proportion of abnormalities in the biochemical parameters defining metabolic health was higher in the MHO, MUNW, and MUO phenotypes than in the MHNW phenotype (Table 2).
Table 2
| Characteristics | MHNW | MHO | MUNW | MUO | p-value |
|---|---|---|---|---|---|
| Metabolic parameters | |||||
| BMI (kg/m2) | 22.03 (1.35) | 26.32 (1.97) | 22.63 (1.16) | 28.19 (2.52) | < 0.001 |
| Glucose (mmol/l) | 5.19 (0.83) | 5.30 (0.91) | 6.88 (2.16) | 6.38 (1.91) | < 0.001 |
| SBP (mmHg) | 125.91 (18.47) | 131.32 (18.52) | 145.03 (16.53) | 145.42 (17.83) | < 0.001 |
| DBP (mmHg) | 73.59 (10.40) | 76.95 (10.62) | 80.77 (11.73) | 82.98 (11.14) | < 0.001 |
| Triglycerides (mmol/l) | 1.12 (0.75) | 1.32 (0.72) | 2.49 (1.53) | 2.30 (1.37) | < 0.001 |
| HDL-C (mmol/L) | 1.79 (0.42) | 1.61 (0.38) | 1.34 (0.41) | 1.30 (0.36) | < 0.001 |
| Abdominal obesity defined by WHR (%)a | 341 (32.54) | 713 (64.12) | 59 (73.75) | 637 (92.45) | < 0.001 |
| Abdominal obesity defined by WC (%)b | 18 (1.72) | 378 (34.00) | 16 (20.00) | 569 (82.58) | < 0.001 |
| Elevated triglycerides (%)c | 102 (9.73) | 183 (16.46) | 56 (70.00) | 453 (65.75) | < 0.001 |
| Elevated BP (%)d | 339 (32.35) | 493 (44.33) | 71 (88.75) | 585 (84.91) | < 0.001 |
| Lowered HDL-cholesterol (%)e | 51 (4.87) | 76 (6.83) | 38 (47.50) | 266 (38.61) | < 0.001 |
| Elevated glucose (%)f | 136 (12.97) | 179 (16.10) | 65 (81.25) | 442 (64.15) | < 0.001 |
| Other variables | |||||
| LDL-C (mmol/l) | 2.65 (0.80) | 2.87 (0.84) | 2.79 (0.89) | 2.94 (0.85) | < 0.001 |
| Total cholesterol (mmol/L) | 4.97 (0.94) | 5.09 (0.97) | 5.27 (1.06) | 5.29 (0.99) | < 0.001 |
| UA (μmol/L) | 283.81 (71.88) | 307.27 (80.52) | 312.28 (89.60) | 349.32 (87.56) | < 0.001 |
Metabolic status of different obesity phenotypes.
Bold numbers in the table represent p < 0.05.
Central obesity was defined by WHR: ≥0.9 in the men and ≥ 0.85 in the women.
Central obesity was defined by waist circumference: ≥90 cm in the men and ≥ 85 cm in the women.
Elevated triglycerides: ≥1.7 mmol/L.
Elevated BP: SBP ≥ 130 mmHg or DBP ≥ 85 mmHg.
Lowered HDL cholesterol: <1.0 mmol/L in the men and < 1.3 mmol/L in the women.
Elevated glucose: ≥5.6 mmol/L.
Three major dietary patterns in Hechuan were identified by principal component analysis. The first dietary pattern was named “white meat and egg dietary pattern,” which mainly included poultry (0.56), eggs (0.53), sea/aquatic products (0.50), dairy products (0.48), and fresh fruits (0.47). The second dietary pattern was named “rice and red meat dietary pattern,” which mainly included rice (0.55) and red meats (0.46). The third dietary pattern was named “wheaten food dietary pattern,” which mainly included wheaten food (0.83).
Multinomial logistic regression analysis was used to detect the association between the three major dietary patterns and the obesity phenotypes (Figure 1). After correcting for the confounding factors mentioned above, it was found that the more the participants followed the wheaten food dietary pattern, the higher the likelihood of having MHO (odds ratio (OR) 1.05, 95% confidence interval (CI) 1.02–1.08), MUNW (OR 1.08, 95%CI 1.00–1.16), and MUO (OR 1.07, 95%CI 1.04–1.11). Specifically, those with the highest wheaten food dietary pattern were 1.60 times more likely to have MHO (OR 1.60, 95%CI 1.25–2.05), 2.62 times more likely to have MUNW (OR 2.62, 95%CI 1.28–5.37), and 2.01 times more likely to have MUO (OR 2.01,95%CI 1.51–2.69) than those with the lowest wheaten food pattern. The participants adhering to the wheaten food dietary pattern were at a higher risk of developing obesity, experiencing metabolic abnormalities, and having a combination of metabolic abnormalities and obesity. In addition, no significant association was observed between the white meat and egg dietary pattern and the white rice and red meat dietary pattern with the obesity phenotypes.
Figure 1
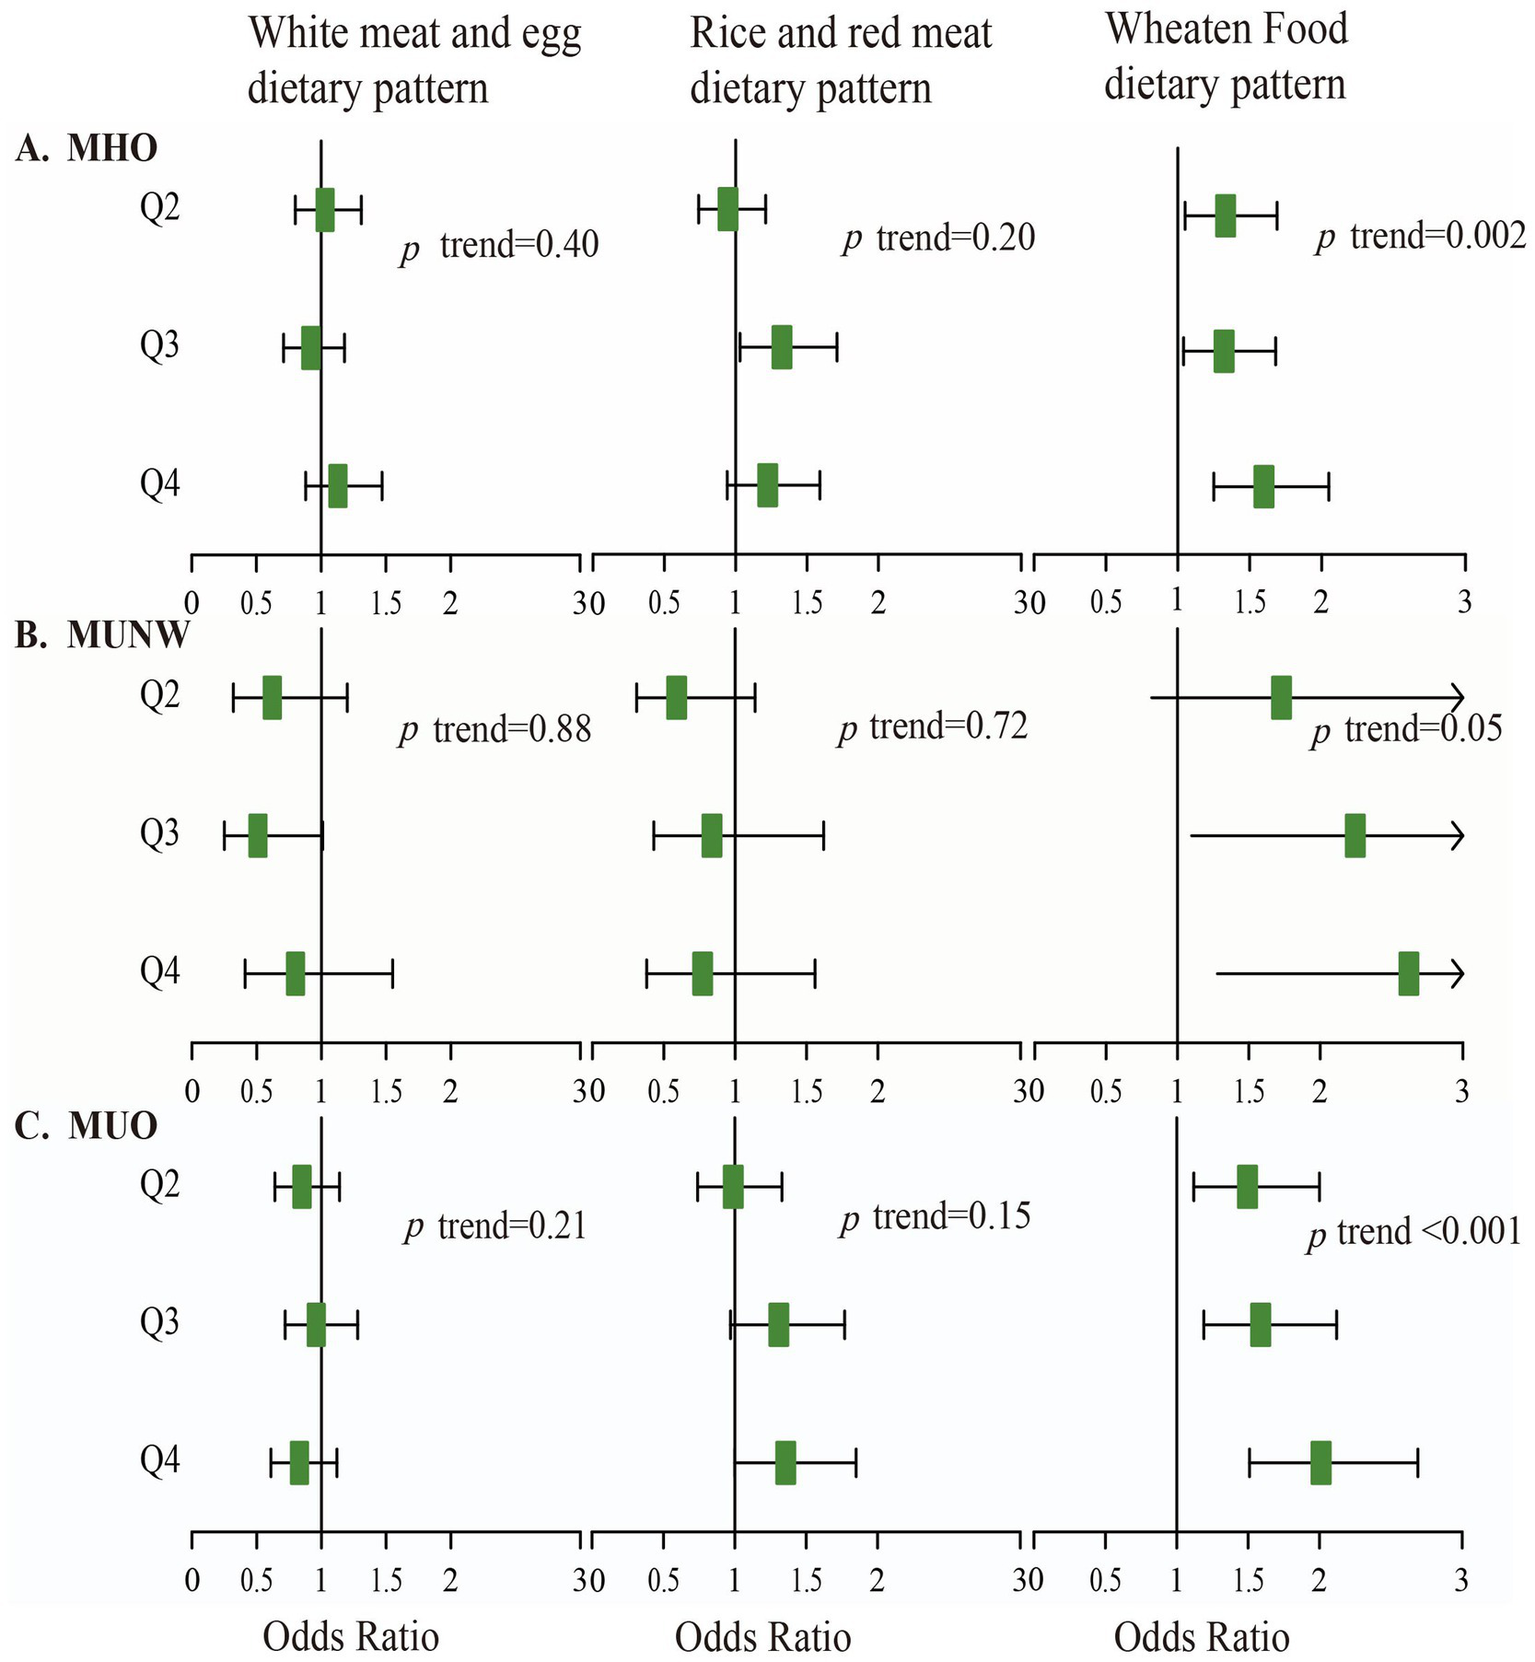
Association of three main dietary patterns with the MHO, MUNW, and MUO phenotypes. All models were adjusted for the confounding factors, with MHNW as the reference group. (A) Represents the correlation between the MHO phenotype and the three dietary patterns. (B) Represents the correlation between the MUNW phenotype and the three dietary patterns. (C) Represents the correlation between the MUO phenotype and the three dietary patterns.
Discussion
The prevalence of overweight/obesity in Hechuan was 61.49% (1801/2929), which is higher than the average level in China (42.8%) (24). Studies have shown that smoking, insufficient physical activity, unhealthy diet, and drinking increase the risk of obesity (25, 26). In Hechuan, the rates of smoking, drinking, and insufficient physical activity were 29.84, 54.07, and 12.79%, respectively (27). Apart from smoking and insufficient physical activity, the rate of drinking was higher than the national average level (28–30). Alcohol is a beverage with high calories. Each gram (g) of alcohol provides 7 kilocalories (kcal), which is slightly lower than that of fats (9 kcal/g) but nearly twice the amount of calories provided by carbohydrates or proteins (both contain 4 kcal/g) (31, 32). Moreover, alcohol can hinder the oxidative decomposition of fat, causing fat to accumulate in the liver and abdomen and leading to obesity (33, 34). Hechuan is popular for its Sichuan cuisine, which is characterized by abundant oil and salt, resulting in excessive intake of fat and sodium and eventually leading to obesity. Hechuan is a less developed city located in the southwest of China. The per capita disposable income of the residents is 39,286 yuan, and the Engel coefficient is 30.3% (35), which is higher than the national average level of 29.8% (36). Compared with the rest of the country, there may be a higher proportion of residents in Hechuan inclined to buy cheaper and unhealthier foods, such as fast foods, which results in excessive intake of fat and causes obesity.
Among the four obesity phenotypes, the prevalence of MHO and MUNW was 37.97 and 2.73%, respectively, which is similar to the results of previous studies (37–41). However, the prevalence of MUO was found to be higher at 23.52% compared to previous research results (15, 42, 43). Studies have shown that overweight, obesity, high-fat diet, and insufficient physical activity are the risk factors for MetS (44). Overweight and obesity can promote the development of MetS. The awareness rates of the recommended intakes of salt and oil in the Dietary Guidelines for Chinese Residents among the residents in Hechuan are quite low, at 24.50 and 15.45%, respectively, which may lead to excessive fat and sodium intakes (5). People with low educational levels have a higher BMI and WC, and there is a negative correlation with obesity (45). The average years of education for the population aged 15 and above in Hechuan are 9.21 years (46), which are lower than the national average level (9.91 years) (47). The high prevalence of MUO may be due to the fact that people with low educational levels do not pay enough attention to obesity and cannot intervene in time, as well as the lack of standardized management. When obese patients have normal metabolism, they are more likely to be overlooked, which can lead to the development of abnormal metabolism.
Compared with MHNW, the MHO phenotype has a higher proportion of men (43), older age (48), lower education (49), lower household income (50, 51), and a greater proportion of people who like to drink beverages (52). Perhaps due to a higher proportion of men having an adverse lifestyle compared to women, the smoking and drinking rates of men (74.30 and 53.80%) were significantly higher than those of women (3.20 and 12.20%) (28). The obesity prevalence shows a rapid increase among people over 25 years old and peaks at between 45 and 74 years old (53). Compared with MHNW, MUO had a higher proportion of individuals with low literacy, widows (54), smokers (55), individuals with depressive symptoms (56), and individuals with a family history of cardiovascular disease (43). The MUNW phenotype primarily included older populations (43, 57). These results are consistent with previous studies.
The metabolic parameters of the individuals with the other three obesity phenotypes tended to be less healthy compared to those of the individuals with the MHNW phenotype. Even under the premise of metabolic health, the metabolic parameters of the obese patients were more unhealthy than those of the non-obese patients, which is consistent with the results of previous studies (15, 58). Specifically, the MUNW and MUO phenotypes had a higher risk of chronic disease, cardiovascular events, and all-cause mortality when compared to the MHNW phenotype (37, 43, 59, 60). Thus, it is evident that in the efforts directed toward obesity prevention and control, attention should be paid to individuals with high-risk factors, such as the elderly, smokers, and those with low education levels. In addition, attention should be given to the promotion and education regarding obesity prevention and control, and the popularization of health knowledge should be strengthened to transform high-risk groups into individuals with healthy lifestyles. The government and medical institutions should intervene and manage obese patients in advance, establish a set of effective obesity management models, establish public facilities suitable for residents to engage in physical exercise, create a safe and hygienic eating environment, reduce the prevalence of obesity, reduce metabolic abnormalities, reduce the incidence of obesity complications, and reduce the burden of the disease. In addition, we also observed that a considerable proportion of the participants with normal weight, as determined by the BMI, had abdominal obesity, and an increasing number of studies have shown that visceral fat is closely related to the development of cardiovascular diseases (61–64). Therefore, it is essential to keep an eye on individuals who may appear healthy but have a high risk of developing cardiovascular disease due to the presence of visceral fat. Meanwhile, it is crucial to focus on high-risk populations and prompt them to adopt a healthy lifestyle to reduce the risk of obesity.
Our findings suggested that the wheaten food dietary pattern is strongly associated with the MHO, MUNW, and MUO phenotypes, which is consistent with previous research (65–67). Carbohydrates, which are a major component of the wheaten food dietary pattern, and high carbohydrates are positively correlated with obesity (68). The potential explanation for the increased risk of carbohydrate-related obesity is that carbohydrate intake may alter lipid profiles, such as increased triglycerides and/or decreased HDL cholesterol, leading to increased obesity (69). In addition, experiments based on animal models have shown that wheat gluten, a protein, promotes weight gain by reducing heat production and energy expenditure (70). Most of the time, noodles are used as the main course of a meal, with almost no vegetables, little meat, more oil, and heavy Sichuan pepper and other spices, such as “Chongqing noodles” (71–73), which is quite popular in Hechuan. However, no significant association was observed between other dietary patterns and the obesity phenotypes. This may require further investigation with larger sample sizes and more diverse data, and the potential association may need to be further explored.
In summary, the prevalence of MHO and MUNW in Hechuan was found to be at the average level, while the prevalence of MUO was found to be higher than that of other studies. Their negative effects on health, especially on metabolism, should not be overlooked. The risk factors of each metabolic phenotype should be taken into account, and classified interventions should be carried out for high-risk populations to reduce the incidence of obesity, complications, and the burden of diseases. The wheaten food dietary pattern was positively correlated with the MHO、MUNW and MUO phenotypes. Therefore, it is necessary to follow the 2022 Dietary Guidelines for Chinese Residents (74) to achieve a balanced and healthy diet, as well as a healthy lifestyle.
The collection of the data from a multi-ethnic cohort study and the selection of the participants through multi-stage stratified random sampling were considered the strengths of the study. However, there are also some limitations to this study, which include a small sample size and no follow-up data. In addition, the study’s ability to infer causality is limited due to the natural defects of cross-sectional research. Moreover, the dietary data were collected using the simplified FFQ scale to recall the participants’ eating habits, which could only provide a rough estimate of the food intake and led to recall bias. However, the investigation tried to control this bias by using standard bowls, spoons, and other tools to assist in the investigation of quantifying food. Future studies with larger population sample sizes and follow-up data are needed to further analyze the association between dietary patterns and obesity phenotypes while overcoming the limitations of causal inference in cross-sectional studies.
Conclusion
In conclusion, different obesity phenotypes vary with demographic characteristics and metabolic parameters. In Hechuan, we identified three main dietary patterns and found that the wheaten food dietary pattern is positively correlated with the MHO, MUNW, and MUO phenotypes. The more the wheaten food dietary pattern was followed, the higher the risk of obesity and metabolic abnormalities was observed, while no correlation was observed between the other two dietary patterns and the obesity phenotypes. Therefore, in view of the two aspects of the obesity phenotypes, focus should be placed on the risk factors of obesity and MetS. It is crucial to take into account both socio-demographic risk factors and dietary risk factors when it comes to understanding and addressing obesity. Medical institutions should actively disseminate health knowledge to the masses so that they can choose healthy lifestyles, choose healthy foods according to dietary guidelines, and avoid excessive intake of fats and carbohydrates. The government should pay more attention to obesity and establish a set of effective obesity management models to effectively decrease the incidence of obesity and metabolic abnormalities and its complications, ultimately reducing the burden of the disease.
Statements
Data availability statement
The raw data supporting the conclusions of this article will be made available by the authors, without undue reservation.
Ethics statement
The studies involving humans were approved by Sichuan University Medical Ethical Review Board [ID: K2016038]. The studies were conducted in accordance with the local legislation and institutional requirements. The participants provided their written informed consent to participate in this study.
Author contributions
WS: Conceptualization, Data curation, Formal analysis, Investigation, Methodology, Project administration, Software, Visualization, Writing – original draft, Writing – review & editing. JD: Data curation, Project administration, Writing – original draft. LM: Data curation, Investigation, Writing – original draft. DH: Data curation, Investigation, Resources, Writing – original draft. DX: Conceptualization, Methodology, Resources, Writing – original draft. PJ: Data curation, Investigation, Writing – original draft. LX: Data curation, Investigation, Writing – original draft. ZY: Data curation, Investigation, Validation, Writing – original draft.
Funding
The author(s) declare that financial support was received for the research, authorship, and/or publication of this article. This work was primarily supported by the National Natural Science Foundation of China (Grant No. 82273740, 81903415). The multi-ethnic cohort study was funded by the National Key Research and Development Program of China (Grant No. 2017YFC0907305, 2017YFC0907300).
Acknowledgments
We sincerely appreciate all the staff and participants who participated in the cohort study.
Conflict of interest
The authors declare that the research was conducted in the absence of any commercial or financial relationships that could be construed as a potential conflict of interest.
Publisher’s note
All claims expressed in this article are solely those of the authors and do not necessarily represent those of their affiliated organizations, or those of the publisher, the editors and the reviewers. Any product that may be evaluated in this article, or claim that may be made by its manufacturer, is not guaranteed or endorsed by the publisher.
References
1.
Bray GA Kim KK Wilding JPH . World obesity federation. Obesity: a chronic relapsing progressive disease process. A position statement of the world obesity federation. Obes Rev. (2017) 18:715–23. doi: 10.1111/obr.12551
2.
GBD 2015 Obesity Collaborators Afshin A Forouzanfar MH Reitsma MB Sur P Estep K et al . Health effects of overweight and obesity in 195 countries over 25 years. N Engl J Med. (2017) 377:13–27. doi: 10.1056/NEJMoa1614362
3.
Wu Y Benjamin EJ MacMahon S . Prevention and control of cardiovascular disease in the rapidly changing economy of China. Circulation. (2016) 133:2545–60. doi: 10.1161/CIRCULATIONAHA.115.008728
4.
Mu L Liu J Zhou G Wu C Chen B Lu Y et al . Obesity prevalence and risks among Chinese adults: findings from the China PEACE million persons project, 2014–2018. Circ Cardiovasc Qual Outcomes. (2021) 14:e007292. doi: 10.1161/CIRCOUTCOMES.120.007292
5.
Health Commission of Hechuan, Chongqing . Report on the Health Status of Residents in Hechuan in 2022. [EB/OL]. (2023). Available at: http://www.hc.gov.cn/bmjd/bm_100475/wsjkw/zwxx_101424/gsgg/202309/t20230912_12918212.html (Accessed September 12, 2023).
6.
Kahn SE Hull RL Utzschneider KM . Mechanisms linking obesity to insulin resistance and type 2 diabetes. Nature. (2006) 444:840–6. doi: 10.1038/nature05482
7.
Martyn JA Kaneki M Yasuhara S . Obesity-induced insulin resistance and hyperglycemia: etiologic factors and molecular mechanisms. Anesthesiology. (2008) 109:137–48. doi: 10.1097/ALN.0b013e3181799d45
8.
Blood Pressure Lowering Treatment Trialists' Collaboration Ying A Arima H Czernichow S Woodward M Huxley R et al . Effects of blood pressure lowering on cardiovascular risk according to baseline body-mass index: a meta-analysis of randomised trials. Lancet. (2015) 385:867–74. doi: 10.1016/S0140-6736(14)61171-5
9.
Klop B Elte JW Cabezas MC . Dyslipidemia in obesity: mechanisms and potential targets. Nutrients. (2013) 5:1218–40. doi: 10.3390/nu5041218
10.
Perdomo CM Cohen RV Sumithran P Clément K Frühbeck G . Contemporary medical, device, and surgical therapies for obesity in adults. Lancet. (2023) 401:1116–30. doi: 10.1016/S0140-6736(22)02403-5
11.
Iliodromiti S Celis-Morales CA Lyall DM Anderson J Gray SR Mackay DF et al . The impact of confounding on the associations of different adiposity measures with the incidence of cardiovascular disease: a cohort study of 296 535 adults of white European descent. Eur Heart J. (2018) 39:1514–20. doi: 10.1093/eurheartj/ehy057
12.
Tutor AW Lavie CJ Kachur S Milani RV Ventura HO . Updates on obesity and the obesity paradox in cardiovascular diseases. Prog Cardiovasc Dis. (2023) 78:2–10. doi: 10.1016/j.pcad.2022.11.013
13.
Després JP . BMI versus obesity subtypes in the era of precision medicine. Lancet Diabetes Endocrinol. (2023) 11:382–4. doi: 10.1016/S2213-8587(23)00088-8
14.
Stefan N Häring HU Hu FB Schulze MB . Metabolically healthy obesity: epidemiology, mechanisms, and clinical implications. Lancet Diabetes Endocrinol. (2013) 1:152–62. doi: 10.1016/S2213-8587(13)70062-7
15.
Wei Y Wang J Han X Yu C Wang F Yuan J et al . Metabolically healthy obesity increased diabetes incidence in a middle-aged and elderly Chinese population. Diabetes Metab Res Rev. (2020) 36:e3202. doi: 10.1002/dmrr.3202
16.
Gadde KM Martin CK Berthoud HR Heymsfield SB . Obesity: pathophysiology and management. J Am Coll Cardiol. (2018) 71:69–84. doi: 10.1016/j.jacc.2017.11.011
17.
Mozaffarian D . Dietary and policy priorities for cardiovascular disease, diabetes, and obesity: a comprehensive review. Circulation. (2016) 133:187–225. doi: 10.1161/CIRCULATIONAHA.115.018585
18.
Zhao X Hong F Yin JZ Tang W Zhang G Liang X . Introduction of general population cohort study in southwestern China. Chin J Epidemiol. (2023) 44:40–7. doi: 10.1001/jamanetworkopen.2020.28627
19.
Wang SM Ding XB He L Duan H Zhu YF . Family history of diabetes and dyslipidemia combination of diabetes. China Chronic Dis Prev Control. (2022) 30:768–71. doi: 10.16386/j.cjpccd.issn.1004-6194.2022.10.011
20.
Xiao X Qin Z Lv X Dai Y Ciren Z Yangla Y et al . Dietary patterns and cardiometabolic risks in diverse less-developed ethnic minority regions: results from the China multi-ethnic cohort (CMEC) study. Lancet Reg Health West Pac. (2021) 15:100252. doi: 10.1016/j.lanwpc.2021.100252
21.
Chinese Nutrition Society Obesity Prevention and Control Section; Chinese Nutrition Society Clinical Nutrition Section; Chinese Preventive Medicine Association Behavioral Health Section; Chinese Preventive Medicine Association Sports and Health Section (2022).
22.
Alberti KG Eckel RH Grundy SM Zimmet PZ Cleeman JI Donato KA et al . International diabetes federation task force on epidemiology and prevention; Hational heart, lung, and blood institute; American Heart Association; world heart federation; international atherosclerosis society; International Association for the Study of obesity. Harmonizing the metabolic syndrome: a joint interim statement of the international diabetes federation task force on epidemiology and prevention; National Heart, Lung, and Blood Institute; American Heart Association; world heart federation; international atherosclerosis society; and International Association for the Study of obesity. Circulation. (2009) 120:1640–5. doi: 10.1161/CIRCULATIONAHA.109.192644
23.
Bland JM Altman DG . Multiple significance tests: the Bonferroni method. BMJ. (1995) 310:170. doi: 10.1136/bmj.310.6973.170
24.
Pang YJ Yu CQ Guo Y Lv J Li LM . Association between lifestyle and major chronic diseases in Chinese adults: evidence from a prospective study of chronic diseases in China. Chin J Epidemiol. (2021) 42:369–75. doi: 10.3760/cma.j.cn112338-20210111-00024
25.
Xiao MF Liu SH Zhou W Wang M Zeng C . Correlation between sedentary behavior, physical activity and abdominal obesity in 5789 patients. Chin J Health Manag. (2021) 15:5. doi: 10.3760/cma.j.cn115624-20200509-00369
26.
Zhang Q Yan BG Tang TH Fan H Zhao Y Wang Y et al . Prevalence of different types of obesity and its influencing factors in Han and Tibetan middle-aged and elderly residents in Gansu Province. Chin J Public Health. (2018) 40:912–8. doi: 10.11847/zgggws1143143
27.
Li MF Ding XB Duan HA He L Peng J . Analysis on health lifestyle status and influencing factors of 30-79 year old residents in Hechuan of Chongqing. Chongqing Med. (2023) 52:2024–9. doi: 10.3969/j.iSSN.1671-8348.2023.13.021
28.
Chan KH Wright N Xiao D Guo Y Chen Y du H et al . China Kadoorie biobank collaborative group. Tobacco smoking and risks of more than 470 diseases in China: a prospective cohort study. Lancet Public Health. (2022) 7:e1014–26. doi: 10.1016/S2468-2667(22)00227-4
29.
Gao XX Wang LM Zhang X Zhao ZP Li C Huang ZJ et al . Prevalence and influencing factors of physical inactivity in Chinese adult residents in 2018. Chin J Epidemiol. (2023) 44:1190–7. doi: 10.3760/cma.j.cn112338-20221125-01000
30.
Li YR Wang J Zhao LY Wang ZH Yu DM He YN et al . Drinking habits and influencing factors of Chinese adults. Chin J Epidemiol. (2018) 39:898–903. doi: 10.3760/cma.j.issn.0254-6450.2018.07.007
31.
Fong M Scott S Albani V Adamson A Kaner E . “Joining the Dots”: individual, sociocultural and environmental links between alcohol consumption, dietary intake and body weight – a narrative review. Nutrients. (2021) 13:2927. doi: 10.3390/nu13092927
32.
Traversy G Chaput JP . Alcohol consumption and obesity: an update. Curr Obes Rep. (2015) 4:122–30. doi: 10.1007/s13679-014-0129-4
33.
Golzarand M Salari-Moghaddam A Mirmiran P . Association between alcohol intake and overweight and obesity: a systematic review and dose -response meta-analysis of 127 observational studies. Crit Rev Food Sci Nutr. (2022) 62:8078–98. doi: 10.1080/10408398.2021.1925221
34.
Jeon S Carr R . Alcohol effects on hepatic lipid metabolism. J Lipid Res. (2020) 61:470–9. doi: 10.1194/jlr.R119000547
35.
Statistics Bureau of Hechuan, Chongqing . The national economic and social development in 2023 in chongqing on statistical bulletin [EB/OL]. (2024). Available at: http://www.hc.gov.cn/bmjd/bm_100475/tjj/zwgk_101491/fdzdgknr_101493/tjxx/tjgb/202405/t2024050113175581.html,2024-03-29 (Accessed March 29, 2024).
36.
National Bureau of Statistics of the People's Republic of China . The People's Republic of China in 2023 the national economic and social development statistical bulletin [EB/OL]. (2024). Available at: https://app.www.gov.cn/govdata/gov/202403/01/512478/article.html (Accessed February 29, 2024).
37.
Gao M Lv J Yu C Guo Y Bian Z Yang R et al . China Kadoorie biobank (CKB) collaborative group. Metabolically healthy obesity, transition to unhealthy metabolic status, and vascular disease in Chinese adults: a cohort study. PLoS Med. (2020) 17:e1003351. doi: 10.1371/journal.pmed.1003351
38.
Ortega FB Lavie CJ Blair SN . Obesity and cardiovascular disease. Circ Res. (2016) 118:1752–70. doi: 10.1161/CIRCRESAHA.115.306883
39.
Ye J Guo K Li X Yang L Zhou Z . The prevalence of metabolically unhealthy Normal weight and its influence on the risk of diabetes. J Clin Endocrinol Metab. (2023) 108:2240–7. doi: 10.1210/clinem/dgad152
40.
Wang WQ Wei B Song YP Guo H Zhang XH Wang XP et al . Metabolically healthy obesity and unhealthy normal weight rural adults in Xinjiang: prevalence and the associated factors. BMC Public Health. (2021) 21:1940. doi: 10.1186/s12889-021-11996-y
41.
Zhang Y Li B Liu Y Gao W Chen K Wang A et al . Association between metabolic phenotype and urinary albumin-creatinine ratio in Chinese community adults: a cross-sectional study. J Diabetes. (2022) 14:541–50. doi: 10.1111/1753-0407.13302
42.
Liu C Wang C Guan S Liu H Wu X Zhang Z et al . The prevalence of metabolically healthy and unhealthy obesity according to different criteria. Obes Facts. (2019) 12:78–90. doi: 10.1159/000495852
43.
Tian Q Wang A Zuo Y Chen S Hou H Wang W et al . All-cause mortality in metabolically healthy individuals was not predicted by overweight and obesity. JCI Insight. (2020) 5:e136982. doi: 10.1172/jci.insight.136982
44.
Xie W Zhao ZG Lv DL Xie FZ Shang QG Wu XY et al . Epidemic status and influencing factors of adult metabolic syndrome in Shenzhen. South China Prev Med. (2019) 50:701–5. doi: 10.12183/j.scjpm.2024.0701
45.
Tan YL Shen ZW Yu CQ Guo Y Bian Z Pei P et al . Long-term relationship between educational attainment and physical indexes in Chinese adults. Chin J Epidemiol. (2019) 40:26–32. doi: 10.3760/cma.j.issn.0254-6450.2019.01.007
46.
Hechuan People's Government of Chongqing . On area the seventh national census bulletin [EB/OL]. (2021). Available at: http://www.hc.gov.cn/xxgk/qzfwj/tjxx/pcsj/202111/t20211115_9972585_wap.html (Accessed June 04, 2021).
47.
National Bureau of Statistics, People's Republic of China . The seventh national census bulletin [EB/OL]. (2021). Available at: https://www.stats.gov.cn/xxgk/sjfb/zxfb2020/202105/t20210511_1817201.html (Accessed May 11, 2021).
48.
Chen TP Lin WY Chiang CH Shen TH Huang KC Yang KC . Metabolically healthy obesity and risk of non-alcoholic fatty liver disease severity independent of visceral fat. J Gastroenterol Hepatol. (2021) 36:2903–10. doi: 10.1111/jgh.15544
49.
Koyanagi A Veronese N Vancampfort D Stickley A Jackson SE Oh H et al . Association of bullying victimization with overweight and obesity among adolescents from 41 low- and middle-income countries. Pediatr Obes. (2020) 15:e12571. doi: 10.1111/ijpo.12571
50.
Kubo T . Common approach to childhood obesity in Japan. J Pediatr Endocrinol Metab. (2014) 27:581–92. doi: 10.1515/jpem-2014-0047
51.
Cai Y Zhu X Wu X . Overweight, obesity, and screen-time viewing among Chinese school-aged children: national prevalence estimates from the 2016 physical activity and fitness in China-the youth study. J Sport Health Sci. (2017) 6:404–9. doi: 10.1016/j.jshs.2017.09.002
52.
Rasaei N Hosseininasab D Shiraseb F Gholami F Noori S Ghaffarian-Ensaf R et al . The association between healthy beverage index and healthy and unhealthy obesity phenotypes among obese women: a cross-sectional study. Int J Clin Pract. (2022) 2022:1–10. doi: 10.1155/2022/7753259
53.
Alexander Bentley R Ruck DJ Fouts HN . U.S. obesity as delayed effect of excess sugar. Econ Hum Biol. (2020) 36:100818. doi: 10.1016/j.ehb.2019.100818
54.
Zoghi G Shahbazi R Mahmoodi M Nejatizadeh A Kheirandish M . Prevalence of metabolically unhealthy obesity, overweight, and normal weight and the associated risk factors in a southern coastal region, Iran (the PERSIAN cohort study): a cross-sectional study. BMC Public Health. (2021) 21:2011. doi: 10.1186/s12889-021-12107-7
55.
Rahmanian K Shojaei M Sotoodeh JA . Prevalence and clinical characteristics of metabolically unhealthy obesity in an Iranian adult population. Diabetes Metab Syndr Obes. (2019) 12:1387–95. doi: 10.2147/DMSO.S197476
56.
Moazzami K Lima BB Sullivan S Shah A Bremner JD Vaccarino V . Independent and joint association of obesity and metabolic syndrome with depression and inflammation. Health Psychol. (2019) 38:586–95. doi: 10.1037/hea0000764
57.
Hajian-Tilaki K Heidari B . Metabolically healthy obese and unhealthy normal weight in Iranian adult population: prevalence and the associated factors. Diabetes Metab Syndr. (2018) 12:129–34. doi: 10.1016/j.dsx.2017.11.005
58.
Zhao M López-Bermejo A Caserta CA Medeiros CCM Kollias A Bassols J et al . International childhood vascular structure evaluation consortium. Metabolically healthy obesity and high carotid intima-media thickness in children and adolescents: international childhood vascular structure evaluation consortium. Diabetes Care. (2019) 42:119–25. doi: 10.2337/dc18-1536
59.
Kramer CK Zinman B Retnakaran R . Are metabolically healthy overweight and obesity benign conditions?: a systematic review and meta-analysis. Ann Intern Med. (2013) 159:758–69. doi: 10.7326/0003-4819-159-11-201312030-00008
60.
Song Z Gao M Lv J Yu C Guo Y Bian Z et al . China Kadoorie biobank (CKB) collaborative group. Metabolically healthy obesity, transition to unhealthy phenotypes, and type 2 diabetes in 0.5 million Chinese adults: the China Kadoorie biobank. Eur J Endocrinol. (2022) 186:233–44. doi: 10.1530/EJE-21-0743
61.
Britton KA Massaro JM Murabito JM Kreger BE Hoffmann U Fox CS . Body fat distribution, incident cardiovascular disease, cancer, and all-cause mortality. J Am Coll Cardiol. (2013) 62:921–5. doi: 10.1016/j.jacc.2013.06.027
62.
Figueroa AL Takx RA MacNabb MH Abdelbaky A Lavender ZR Kaplan RS et al . Relationship between measures of adiposity, arterial inflammation, and subsequent cardiovascular events. Circ Cardiovasc Imaging. (2016) 9:e004043. doi: 10.1161/CIRCIMAGING.115.004043
63.
Nicklas BJ Penninx BW Cesari M Kritchevsky SB Newman AB Kanaya AM et al . Health, aging and body composition study. Association of visceral adipose tissue with incident myocardial infarction in older men and women: the health, aging and body composition study. Am J Epidemiol. (2004) 160:741–9. doi: 10.1093/aje/kwh281
64.
Fujimoto WY Bergstrom RW Boyko EJ Chen KW Leonetti DL Newell-Morris L et al . Visceral adiposity and incident coronary heart disease in Japanese-American men. The 10-year follow-up results of the Seattle Japanese-American community diabetes study. Diabetes Care. (1999) 22:1808–12. doi: 10.2337/diacare.22.11.1808
65.
Xu K Zhang B Liu Y Mi B Wang Y Shen Y et al . Staple food preference and obesity phenotypes: the regional ethnic cohort study in Northwest China. Nutrients. (2022) 14:5243. doi: 10.3390/nu14245243
66.
Zhang JG Wang ZH Wang HJ du WW Su C Zhang J et al . Dietary patterns and their associations with general obesity and abdominal obesity among young Chinese women. Eur J Clin Nutr. (2015) 69:1009–14. doi: 10.1038/ejcn.2015.8
67.
Yuan YQ Li F Meng P You J Wu M Li SG et al . Gender difference on the association between dietary patterns and obesity in Chinese middle-aged and elderly populations. Nutrients. (2016) 8:448. doi: 10.3390/nu8080448
68.
Park SH Lee KS Park HY . Dietary carbohydrate intake is associated with cardiovascular disease risk in Korean: analysis of the third Korea National Health and nutrition examination survey (KNHANES III). Int J Cardiol. (2010) 139:234–40. doi: 10.1016/j.ijcard.2008.10.011
69.
Lin H Bermudez OI Tucker KL . Dietary patterns of Hispanic elders are associated with acculturation and obesity. J Nutr. (2003) 133:3651–7. doi: 10.1093/jn/133.11.3651
70.
Mittendorfer B Sidossis LS . Mechanism for the increase in plasma triacylglycerol concentrations after consumption of short-term, high-carbohydrate diets. Am J Clin Nutr. (2001) 73:892–9. doi: 10.1093/ajcn/73.5.892
71.
Freire RH Fernandes LR Silva RB Coelho BSL de Araújo LPT Ribeiro LS et al . Wheat gluten intake increases weight gain and adiposity associated with reduced thermogenesis and energy expenditure in an animal model of obesity. Int J Obes. (2016) 40:479–86. doi: 10.1038/ijo.2015.204
72.
Yaojian Y . The history of Chongqing noodles. Citizen Guide. (2015) 4:50–1.
73.
Zhou ZF . Study on optimization and influencing factors of seasoning amount of Chongqing noodles. China Condiments. (2016) 41:43–6. doi: 10.3969/j.issn.1000-9973.2016.12.010
74.
Xiaoguang Y Xiaoli W . Dietary guidelines for Chinese residents 2022| guideline 1 variety of foods and reasonable mix. China Food Nutr. (2022) 28:2. doi: 10.19870/j.cnki.11-3716/ts.2022.08.010
Summary
Keywords
dietary pattern, obesity phenotype, metabolic syndrome, factor analysis, China
Citation
Shaomei W, Dezhi J, Mengfen L, Huaan D, Xianbin D, Juan P, Xia L and Yanfeng Z (2024) Association between major dietary patterns and obesity phenotypes in southwest China: baseline survey results from Hechuan. Front. Nutr. 11:1467025. doi: 10.3389/fnut.2024.1467025
Received
19 July 2024
Accepted
15 October 2024
Published
01 November 2024
Volume
11 - 2024
Edited by
Ren Zhou, Shanghai Jiaotong University School of Medicine, China
Reviewed by
Haseeb Sattar, Huazhong University of Science and Technology, China
Salvatore Vaccaro, IRCCS Local Health Authority of Reggio Emilia, Italy
Updates
Copyright
© 2024 Shaomei, Dezhi, Mengfen, Huaan, Xianbin, Juan, Xia and Yanfeng.
This is an open-access article distributed under the terms of the Creative Commons Attribution License (CC BY). The use, distribution or reproduction in other forums is permitted, provided the original author(s) and the copyright owner(s) are credited and that the original publication in this journal is cited, in accordance with accepted academic practice. No use, distribution or reproduction is permitted which does not comply with these terms.
*Correspondence:Zhu Yanfeng, cmczhuyanfeng@163.com
Disclaimer
All claims expressed in this article are solely those of the authors and do not necessarily represent those of their affiliated organizations, or those of the publisher, the editors and the reviewers. Any product that may be evaluated in this article or claim that may be made by its manufacturer is not guaranteed or endorsed by the publisher.