Abstract
Introduction:
A comprehensive understanding of gene–diet interactions is necessary to establish proper dietary guidelines for the prevention and management of type 2 diabetes mellitus (T2DM). We examined the roles of genetic variants and their interactions with T2DM-associated nutrients in a large-scale genome-wide association study of Korean adults.
Methods:
A total of 50,808 participants from a Korean genome and epidemiology study were included. Dietary intake was assessed using a food frequency questionnaire. Dietary nutrient intake was classified based on the Korean Dietary Reference Intakes (DRIs). Odds ratio (OR) and 95% confidence interval were calculated after adjusting for age, sex, exercise, smoking, alcohol consumption, total energy consumption, principal component 1, and principal component 2.
Results:
Among the individuals consuming vitamin A (retinol equivalent) above the DRI, the carriers of the melanotransferrin (MELTF) rs73893755 minor allele (T) had a higher risk of T2DM than the non-carriers (OR = 1.85, p-value = 1.66 × 10⁻⁸; interaction p-value = 7.61 × 10⁻⁸). Similarly, among the individuals consuming cholesterol (mg/day) above the DRI, the carriers of the tripartite motif-containing protein 25 (TRIM25) rs139560285 minor allele (A) had a higher risk of T2DM than the non-carriers (OR = 2.02, p-value = 4.06 × 10⁻⁸; interaction p-value = 4.28 × 10⁻⁸).
Discussion:
Our results suggest that interactions between specific polymorphisms and certain nutrients may influence T2DM development.
1 Introduction
Type 2 diabetes mellitus (T2DM) is a global public health challenge owing to its widespread prevalence and the associated risks of various complications, making it a leading cause of disability and mortality among adults (1, 2). Individuals with T2DM typically incur approximately 2.6 times higher medical costs than those without T2DM (3). The prevalence of T2DM has been on the rise globally, increasing from 4.7% in 1980 to 9.3% in 2019, with projections estimating a further increase to 10.2% (578 million) by 2030 and 10.9% (700 million) by 2045 (4, 5). In South Korea, the prevalence of T2DM has rapidly increased from 8.6% in 2001 to 16.7% in 2020 (6, 7). Currently, T2DM is the sixth leading cause of death in South Korea (8). Thus, identifying high-risk individuals and optimizing interventions are of importance.
Dietary habits, including the excessive intake of certain nutrients, are critical modifiable determinants that can reduce T2DM risk and progression (9). Health authorities have established dietary reference values such as the recommended dietary allowance, adequate intake, tolerable upper intake level, and estimated average requirement to help prevent chronic diseases (10). Previous research has explored the relationship between dietary factors and T2DM incidence by examining diet quality, food groups, specific foods, and various nutrients (11). However, a consensus on the optimal nutritional strategy for patients with T2DM remains to be reached. Therefore, dietary strategies should be personalized according to individual risk factors, eating preferences, and metabolic goals.
Genetic factors substantially influence the susceptibility to T2DM, a polygenic disease with high heritability (12). Genome-wide association studies (GWAS) have identified over 40 loci related to glycemic traits in Korea, including CDKAL1 (rs7754840), SLC30A8 (rs13266634), and TCF7L2 (rs7903146); however, these genetic variations explain less than 10% of T2DM heritability (13). Therefore, the interactions between genetic factors and lifestyle, particularly diet, are subject of intense research on T2DM development (14). Dietary components such as carbohydrates and fiber can influence the effects of specific T2DM-associated genetic variants. For instance, variants such as ADAMT59 (rs4607103), CDKN2A/2B (rs1801282), and FTO (rs8050136) in non-Hispanic white people and ADAMT59 (rs4607103) and THADA (rs7578597) in non-Hispanic black people show significant interactions with dietary intake (15). These findings highlight the complex interplay between genetics and diet in T2DM pathogenesis and suggest that personalized dietary recommendations based on genetic profiles could improve T2DM management and prevention. However, most previous studies have focused on a limited number of genetic variants and dietary factors, restricting the comprehensive understanding of these interactions.
Here, we aimed to investigate a broad spectrum of nutrients, including micronutrients, along with gene variability and gene–nutrient interactions in T2DM. Our specific goal was to identify novel genetic variants that influence T2DM through significant gene–nutrient interactions using data from a large-scale GWAS of the Korean population.
2 Methods
2.1 Study population
The Korean Genome and Epidemiology Study (KoGES) is a government-funded genome epidemiological study platform designed to identify the genetic and environmental etiology of common complex diseases in South Koreans (National Research Institute of Health, Korea Disease Control and Prevention Agency, and the Ministry of Health and Welfare). The KoGES enrolls community dwellers and participants from the national health examinee registry, which includes men and women aged ≥40 years at baseline. Data of 58,701 participants for whom genome-wide single-nucleotide polymorphism (SNP) genotype data were available were included in the KoGES dataset. The GWAS data have been deposited at https://biobank.nih.go.kr/cmm/main/mainPage.do. Researchers can access the GWAS data after obtaining permission from relevant authorities. We excluded 295 samples with missing covariate values, including age, sex, smoking status, drinking status, exercise status, and calories as well as 63 samples with missing values required for T2DM diagnosis, including fasting plasma glucose level and T2DM history. Among them, 7,535 people were excluded from treatment for cancer, thyroid disease, or surgical menopause. Finally, 50,808 participants, 4,921 (9.7%) patients with T2DM and 45,887 (90.3%) controls, were included. A flowchart of the study population is shown in Figure 1. The study protocol adhered to the ethical guidelines of the 1975 Declaration of Helsinki, as reflected in an a priori approval by the Institutional Review Board of Theragen Bio (approval number: 700062-20190819-GP-006-02). All participants voluntarily signed an informed consent form before participating in the study.
Figure 1
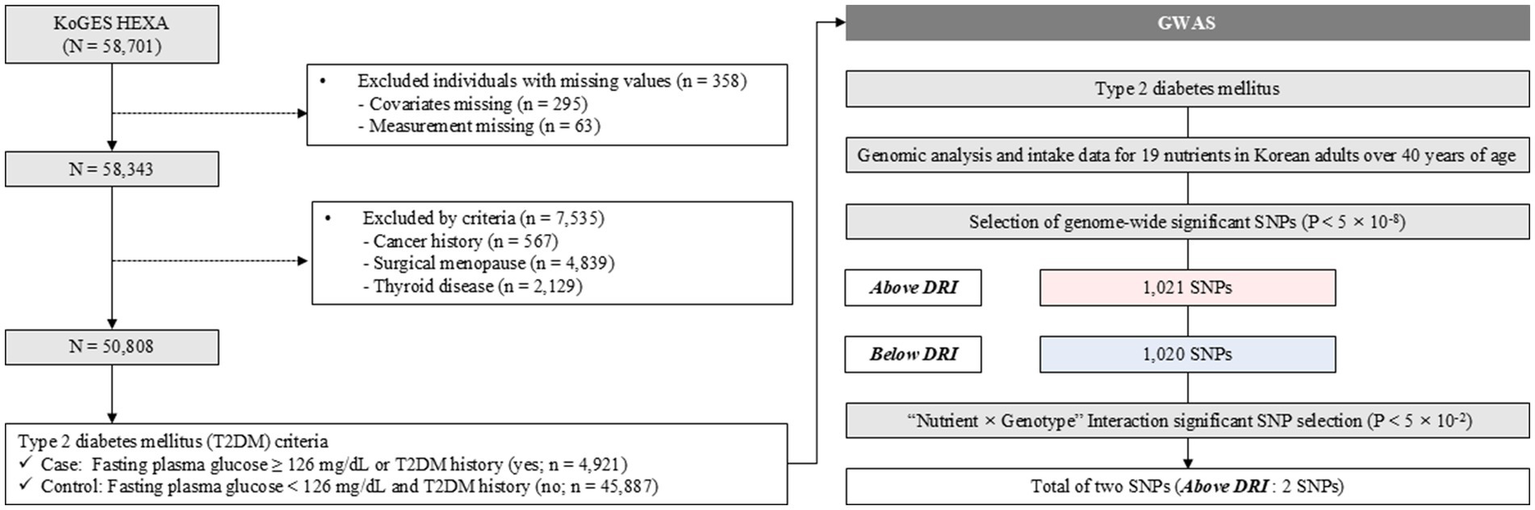
Scheme of the study. GWAS, genome-wide association study; SNP, single-nucleotide polymorphism; DRI, daily reference intake.
2.2 Genotyping and covariates
The dataset comprises a wide range of phenotypic and environmental measures, biological samples (i.e., serum, plasma, and urine), genome-wide genotype information, and links to health and administrative records. After collecting blood DNA samples according to standard protocols, all samples were transported to the National Biobank of Korea and stored for future research purposes. Genomic DNA was extracted from peripheral blood samples. The extracted genomic DNA was genotyped using Korea Biobank Arrays (KoreanChip). Detailed information regarding KoreanChip has been reported previously (16). We applied the following criteria in the analysis of KoreanChip data to control the quality of genotyping results: call rate > 97%, missing genotype > 0.01, minor allele frequency > 0.01, and Hardy–Weinberg equilibrium (HWE) p > 0.000001. HWE was assessed using the standard equation: p + q = 1 and p2 + 2pq + q2 = 1, where p and q represent the frequencies of the dominant and recessive alleles, respectively. Genotype frequencies were calculated as p2 (homozygous dominant), 2pq (heterozygous), and q2 (homozygous recessive). We applied an HWE filter using the --hwe 0.00001 option in PLINK v1.9 to exclude SNPs that significantly deviated from equilibrium.
Trained technicians performed the anthropometric measurements, with participants wearing light clothes and being barefoot. All measurements were taken to the nearest 0.1 cm in height and 0.1 kg in weight. The body mass index was calculated as weight (kg) divided by height (m) squared. Waist circumference was measured midway between the lowest rib and top of the iliac crest. Samples for the measurement of blood glucose, total cholesterol, triglycerides, and high-density lipoprotein cholesterol levels were obtained after at least 8 h of fasting. Trained interviewers questioned the participants about their lifestyles. Based on smoking status, the participants were categorized into non-smokers, former smokers, and current smokers.
Trained interviewers collected alcohol consumption data using an alcoholic beverage questionnaire. Participants were asked to report their drinking status (current, past, or non-drinkers) and their drinking habits in case of current drinkers, such as the average frequency of drinking during the previous year. To estimate the amount of alcohol consumed by current drinkers, the participants were asked how frequently they consumed each alcoholic beverage and how many drinks they consumed per occasion. Alcohol consumption (g/day) was calculated based on the alcohol content of each alcoholic beverage. According to the questionnaire, regular exercise was defined as routine performance of ≥30-min exercise/day. Systolic blood pressure (SBP) and diastolic blood pressure (DBP) were measured at least twice in the sitting position. Hypertension was defined as SBP ≥ 140 mg/dL or DBP ≥ 90 mg/dL or an intake of any antihypertensive medication. T2DM was defined as fasting serum glucose ≥ 126 mg/dL or a history of the presence of one or more of the following conditions: fasting glucose level ≥ 126 mg/dL, HbA1c ≥ 6.5%, and 2-h plasma glucose level in oral glucose tolerance test ≥ 200 mg/dL, based on the American Diabetes Association, or ongoing treatment with oral antidiabetic medications or insulin therapy.
2.3 Determination of nutrition intake reference
To assess the usual dietary intake of the participants, a semi-quantitative food frequency questionnaire (FFQ) including 103 items was developed for the KoGES (17, 18). Participants reported the frequency and amount of food consumed in the past year. Nutritional intake criteria were set based on the 2020 Korean Dietary Reference Intakes (KDRIs; Ministry of Health and Welfare’s Research Project, 2020). The DRI is a general term for a set of reference values used to plan and assess the nutrient intake of healthy people. For macronutrients (carbohydrates, proteins, and fat), an acceptable macronutrient distribution range (AMDR), which is the range of intake for energy sources, was considered. The AMDR for carbohydrates, proteins, and fat was 55–65%, 7–20%, and 15–30%, respectively (19). We determined the upper limit of each macronutrient’s AMDR as the macronutrient intake reference criteria. The DRI for potassium (K), sodium (Na), fiber, and vitamin E was set based on adequate intake, which is the recommended average daily nutrient intake level based on experimentally derived intake levels or approximations of the observed mean nutrient intake considered adequate by a group (or groups) of apparently healthy people (20). The DRI for cholesterol was set based on chronic disease endpoints, which are the reference values for intake that affect chronic disease outcomes (21). The DRI of other nutrients was set based on the recommended nutrient intake, which is the average daily level of nutrient intake sufficient to meet the nutrient requirements of approximately all (97–98%) healthy people. The DRI of nutrients varied according to age and sex. As the KoGES included participants aged 40 years and older, we calculated the mean values of the DRI of the population aged over 40 years according to sex. The specific criteria for DRI are shown in Supplementary Table 1 (22).
2.4 Statistical analysis
Data are presented as mean ± standard deviation or number (percentage). To compare differences between the groups based on the presence of DM, we used an independent two-sample t-test for continuous variables and a chi-squared test for categorical variables. We performed principal component (PC) analysis to reduce the bias of genomic data according to the region where samples were collected and used PC1 and PC2 as covariates in the statistical analyses. For each nutrient group (above or below the DRI), we conducted a genome-wide scan to identify the specific genetic variants associated with DM. We analyzed the GWAS results for the DM and control groups. All GWAS were conducted using logistic regression analysis after adjusting for age, sex, exercise, smoking, alcohol intake, total energy consumption, PC1, and PC2 using PLINK version 1.9. Significant associations were defined by genome-wide p values of <5.00 × 10⁻⁸. A regional association plot confirmed the surrounding SNPs and nearby genes that were in linkage disequilibrium with the SNPs. For each genome-wide significant region (p < 5 × 10⁻⁸), the lead SNP was defined as the variant with the most significant p-value within a ±500 kilobase (kb) window. After selecting the lead SNPs, we also selected unique SNPs that were significant only in the nutrient group, and conducted further interaction analysis using the generalized linear model of R statistics (Version 4.0.3; R Foundation for Statistical Computing, Vienna, Austria). Finally, we selected SNPs with interaction p-values < 0.05 as the important SNPs that can significantly interact with nutrients related to disease susceptibility.
To further explore the physiological relevance of the selected SNPs, mean hemoglobin and total cholesterol levels were compared across rs73893755 and rs139560285 genotypes, respectively, within nutrient intake strata (above or below the DRI), using general linear models adjusted for age and sex. In addition, differences in dietary vitamin A and cholesterol intake across genotypes were assessed.
3 Results
Table 1 shows the general characteristics of the study population. The mean age ± standard deviation of the total population was 53.6 ± 8.1 years, and 61.4% were women. Of the 50,808 participants, 4,921 (9.7%) had T2DM. The participants with T2DM were older and had a higher body mass index, SBP, DBP, total cholesterol level, and triglyceride level than those without T2DM. The proportions of men and current smokers were greater among participants with T2DM than among those without. The participants with T2DM consumed more alcohol than those without T2DM. Regarding nutritional intake, carbohydrate intake (%) was significantly higher in participants with T2DM. The total calorie intake (kcal/day) and the intake of fat (%), calcium (mg/day), phosphorus (mg/day), iron (mg/day), potassium (mg/day), vitamin B1 (mg/day), vitamin B2 (mg/day), niacin (mg/day), vitamin C (mg/day), zinc (mg/day), vitamin B6 (mg/day), folate (mcg/day), fiber (g/day), vitamin E (mg/day), and cholesterol (mg/day) were significantly lower in participants with T2DM than in those without. The intake of protein (%), vitamin A (retinol equivalent; R.E.), and sodium (mg/day) was not significantly different between the groups.
Table 1
| Variables | Total | With diabetes | Without diabetes | P-value |
|---|---|---|---|---|
| N | 50,808 | 4,921 | 45,887 | |
| Age, years | 53.6 ± 8.1 | 57.8 ± 7.5 | 53.1 ± 8.1 | <0.001 |
| Sex, n (%) | <0.001 | |||
| Male | 19,595 (38.6) | 2,661 (54.1) | 16,934 (36.9) | |
| Female | 31,213 (61.4) | 2,260 (45.9) | 28,953 (63.10) | |
| Smoking status, n (%) | <0.001 | |||
| None | 35,796 (70.5) | 2,811 (57.2) | 32,985 (71.9) | |
| Former smoker | 8,806 (17.3) | 1,279 (26.0) | 7,527 (16.4) | |
| Current | 6,170 (12.2) | 825 (16.8) | 5,345 (11.7) | |
| Alcohol intake, g/day | 57.2 ± 176.4 | 77.7 ± 188.1 | 55.01 ± 175.0 | <0.001 |
| Regular exerciser, n (%) | 27,672 (54.4) | 2,852 (58.0) | 24,820 (54.1) | <0.001 |
| Body mass index, kg/m2 | 23.9 ± 2.9 | 25.1 ± 3.1 | 23.77 ± 2.8 | <0.001 |
| Waist circumference, cm | 80.9 ± 9.0 | 85.6 ± 9.0 | 80.4 ± 8.9 | <0.001 |
| Systolic blood pressure, mmHg | 122.5 ± 15.0 | 127.4 ± 15.2 | 121.9 ± 14.9 | <0.001 |
| Diastolic blood pressure, mmHg | 75.8 ± 9.9 | 77.4 ± 9.7 | 75.6 ± 9.9 | <0.001 |
| Glucose, mg/dL | 95.3 ± 19.9 | 133.4 ± 39.2 | 91.1 ± 9.8 | <0.001 |
| Total cholesterol, mg/dL | 197.0 ± 35.6 | 188.21 ± 40.5 | 197.9 ± 34.9 | <0.001 |
| Triglycerides, mg/dL | 126.0 ± 86.7 | 160.5 ± 121.8 | 122.3 ± 81.1 | <0.001 |
| High-density lipoprotein cholesterol, mg/dL | 53.5 ± 13.1 | 48.8 ± 11.9 | 54.0 ± 13.2 | <0.001 |
| Total energy, kcal/day | 1,738.2 ± 570.4 | 1,699.9 ± 558.8 | 1,742.3 ± 571.5 | <0.001 |
| Carbohydrate (%) | 71.0 ± 10.0 | 71.3 ± 10.6 | 70.9 ± 10.0 | 0.006 |
| Protein (%) | 13.2 ± 3.2 | 13.2 ± 3.4 | 13.2 ± 3.2 | ns |
| Fat (%) | 13.8 ± 5.8 | 13.1 ± 5.9 | 13.9 ± 5.8 | <0.001 |
| Calcium, mg/day | 438.7 ± 256.2 | 415.6 ± 246.0 | 441.2 ± 257.1 | <0.001 |
| Phosphorus, mg/day | 883.9 ± 359.3 | 860.4 ± 351.4 | 886.4 ± 360.0 | <0.001 |
| Iron, mg/day | 9.83 ± 5.12 | 9.59 ± 5.11 | 9.86 ± 5.12 | <0.001 |
| Potassium, mg/day | 2,210.9 ± 1,045.1 | 2,118.1 ± 1012.3 | 2,220.9 ± 1048.1 | <0.001 |
| Vitamin A (R.E.) | 473.9 ± 340.0 | 465.1 ± 341.1 | 474.8 ± 339.9 | ns |
| Na, mg/day | 2,431.2 ± 1395.9 | 2,416.9 ± 1432.4 | 2,432.7 ± 1391.9 | ns |
| Vitamin B1, mg/day | 0.92 ± 1.00 | 0.88 ± 1.06 | 0.93 ± 0.99 | 0.001 |
| Vitamin B2, mg/day | 0.82 ± 0.99 | 0.76 ± 1.01 | 0.83 ± 0.98 | <0.001 |
| Niacin, mg/day | 14.36 ± 6.47 | 13.96 ± 6.30 | 14.41 ± 6.49 | <0.001 |
| Vitamin C, mg/day | 104.1 ± 67.0 | 96.7 ± 61.4 | 104.9 ± 67.5 | <0.001 |
| Zinc, mg/day | 7.84 ± 3.90 | 7.68 ± 3.64 | 7.86 ± 3.92 | 0.001 |
| Vitamin B6, mg/day | 1.50 ± 1.17 | 1.44 ± 1.22 | 1.50 ± 1.16 | <0.001 |
| Folate, mcg/day | 214.2 ± 120.1 | 206.1 ± 117.3 | 215.0 ± 120.3 | <0.001 |
| Fiber, g/day | 5.58 ± 3.19 | 5.41 ± 3.06 | 5.60 ± 3.10 | <0.001 |
| Vitamin E, mg/day | 7.99 ± 4.62 | 7.59 ± 4.65 | 8.03 ± 4.62 | <0.001 |
| Cholesterol, mg/day | 168.6 ± 124.5 | 154.6 ± 119.9 | 170.1 ± 124.9 | <0.001 |
Characteristics of the study population.
R.E., retinol equivalent.
Data are presented as mean ± standard deviation for continuous variables or number (%) for categorical variables.
p-values were obtained via independent two-sample t-test for continuous variables and chi-squared test for categorical variables.
Figure 1 illustrates the overall study scheme. Nineteen target nutrients were investigated during the KoGES. A total of 50,808 participants were included in the GWAS and subsequent analyses, categorized into T2DM cases (n = 4,921) and controls (n = 45,887). After the initial GWAS, 2,041 SNPs (1,021 SNPs above and 1,020 SNPs below the DRI) showed genome-wide significance. Among these significant SNPs, we identified two SNPs related to T2DM in the DRI groups, with significant nutrition-by-gene interactions.
Two SNPs were identified as uniquely significant (i.e., not showing widespread significance over nutrients and showing unilateral significance either above or below the DRI) in each of the two nutrient groups (cholesterol and vitamin A). Results of the two significant SNPs are depicted in Figure 2 as Miami plots using log10 transformed p-values. Figure 3 shows the surrounding association signals and genes located in the lead SNP region at the positions of the two SNPs identified. A few SNPs showed a significant association with T2DM, located around the SNP rs73893755, with the functional gene at that location of melanotransferrin (MELTF; Figure 3A). There were relatively few SNPs with a significant association with T2DM around rs139560285; however, tripartite motif-containing protein 25 (TRIM25) was at that location (Figure 3B). GWAS and gene–nutrient interaction analysis results are shown in Supplementary materials 1, 2.
Figure 2
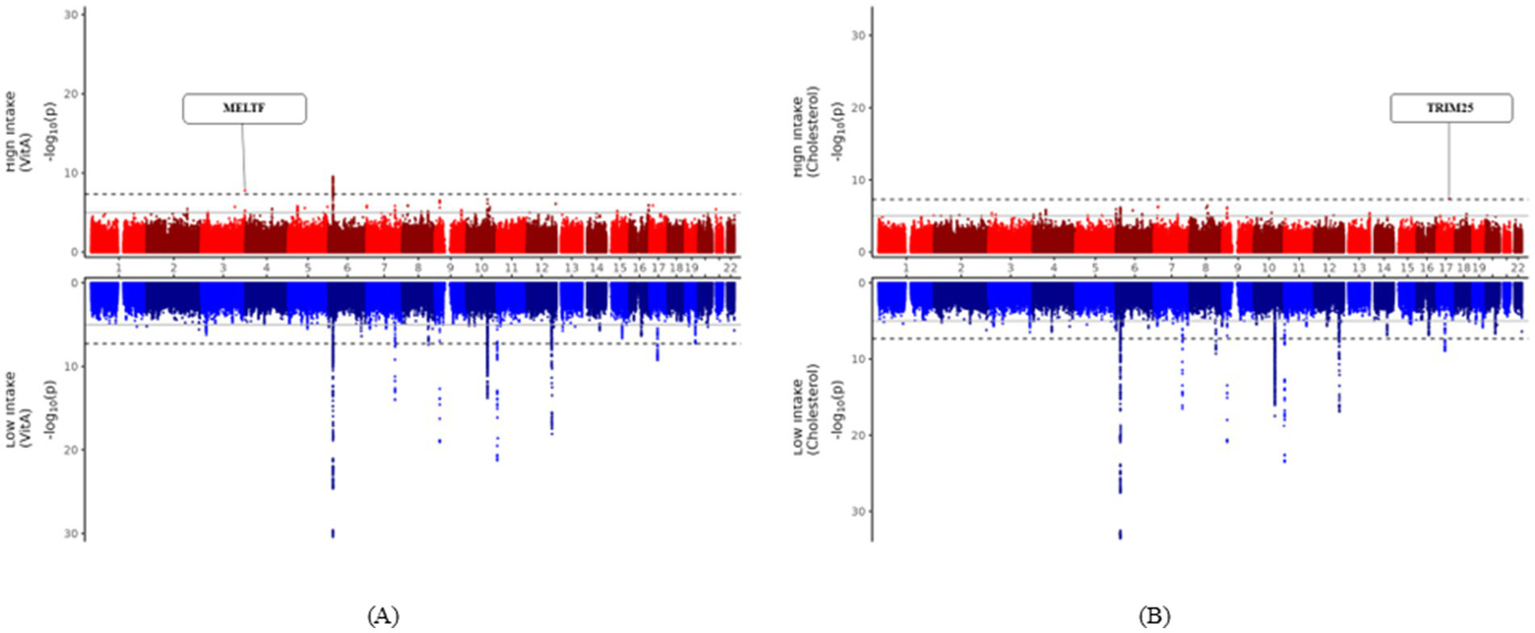
Miami plots presenting the results of the GWAS. Miami plots presenting the results of the GWAS on the risk of T2DM prevalence in the high nutrient-intake group (red graph) and low nutrient-intake group (blue graph). The horizontal axis of each graph is the SNP position from chromosomes 1 to 22 and the vertical axis is the −log10 transformation of the statistical significance (p-value) for T2DM. The solid line in the graph is the genome-wide suggestive level (p-value < 1 × 10⁻⁵) and the dotted line is the genome-wide significance level (p-value < 5 × 10⁻⁸). (A) Miami plot highlighting the MELTF region that is specifically significant in the vitamin A high-intake group. (B) Miami plot highlighting the TRIM25 region that is specifically significant in the cholesterol high-intake group. GWAS, genome-wide association study; SNP, single-nucleotide polymorphism.
Figure 3
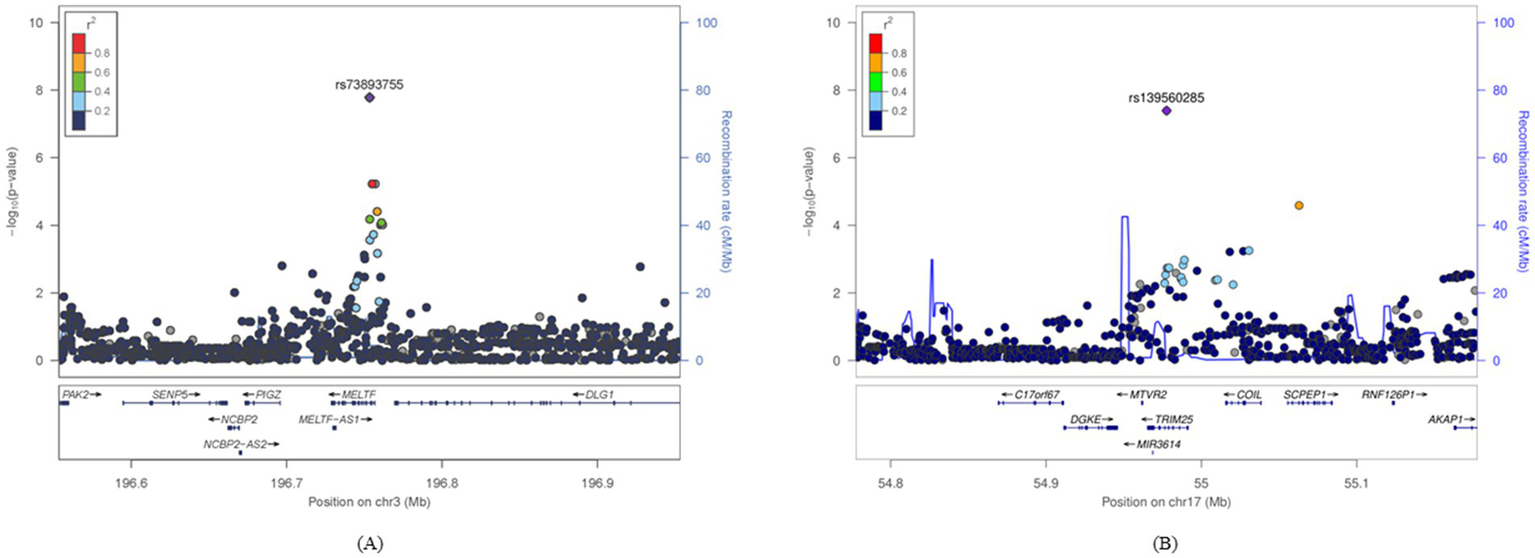
Signal plots for the statistically significant SNP regions confirmed in a specific diet group. The lead SNPs identified in the GWAS and the ±400-kbp region were plotted. The horizontal axis represents the base pair position on the chromosome where the SNPs are located and the left vertical axis represents the p-value transformed into −log10. The vertical axis on the right represents the region where recombination can occur during cell division. (A) The genomic region around rs3893755 in the group with high vitamin A intake and (B) the genomic region around rs139560285 in the group with high cholesterol intake. GWAS, genome-wide association study; SNP, single-nucleotide polymorphism.
Table 2 presents SNPs with significant nutrient-by-gene interactions associated with T2DM. Two gene-by-nutrient interactions were associated with T2DM prevalence. Among the individuals consuming vitamin A (R.E.) above the DRI, carriers of the MELTF rs73893755 minor allele (T) had a higher risk of T2DM than the non-carriers (odds ratio [OR] = 1.85, p-value = 1.66 × 10⁻⁸; interaction p-value = 7.61 × 10⁻⁸). Similarly, among the individuals consuming cholesterol (mg/day) above the DRI, carriers of the TRIM25 rs139560285 minor allele (A) had a higher risk of T2DM than the non-carriers (OR = 2.02, p-value = 4.06 × 10⁻⁸; interaction p-value = 4.28 × 10⁻⁸).
Table 2
| Chr | SNP | BP | Positional candidate gene | Alleles | Alternative allele frequency | Other Ethnicities | Coding allele | Coding allele frequency | Nutrient Intake | Gene association result | Gene and nutrient association results | ||||||
|---|---|---|---|---|---|---|---|---|---|---|---|---|---|---|---|---|---|
| Reference | Alternative | EAS | EUR | AMR | OR (95% CI) | P-value | OR (95% CI) |
Interaction P value |
Top P value |
||||||||
| 3 | rs73893755 | 196753267 | MELTF | C | T | 0.043 | 0.038 | 0 | 0.033 | T | 0.043 | Above Vitamin A | 1.08 (0.97–1.19) |
0.168 | 1.85 (1.61–2.77) |
7.61 × 10⁻⁸ | 1.66 × 10⁻⁸ |
| 17 | rs139560285 | 54977570 | TRIM25 | G | A | 0.059 | 0.047 | 0 | 0.003 | A | 0.051 | Above Cholesterol | 1.02 (0.93–1.13) |
0.628 | 2.02 (1.73–3.17) |
4.28 × 10⁻⁸ | 4.06 × 10⁻⁸ |
Single-nucleotide polymorphisms (SNPs) showing significant interactions with nutrients associated with diabetes.
AMR, American; BP, base pair; Chr, chromosome; EAS, East Asian; EUR, European; OR, odds ratio; CI, confidence interval.
p-value was calculated using logistic regression analysis adjusted for age, sex, exercise, smoking, alcohol intake (g/day), total calorie consumption, PC1, and PC2.
As an indirect indicator of iron status, we further examined hemoglobin levels according to rs73893755 genotypes stratified by vitamin A intake level (Supplementary Table 2). Hemoglobin levels decreased with the T allele among individuals consuming vitamin A above the DRI, while the opposite trend was observed in those below the DRI, suggesting a potential gene–nutrient interaction. Similarly, to explore the physiological relevance of the TRIM25 rs139560285 variant, we assessed total cholesterol levels across genotypes stratified by dietary cholesterol intake (Supplementary Table 3). No statistically significant differences were observed. These results suggest that the observed gene–diet interaction associated with T2DM risk may not be directly explained by circulating cholesterol levels.
4 Discussion
Nutrition can influence T2DM development by directly altering the expression of genes involved in critical metabolic pathways or indirectly affecting the incidence of genetic mutations at the base sequence or chromosomal level (23). The present study showed that certain dietary factors interact with genetic variants in T2DM. We identified significant interactions between vitamin A and the rs73893755 variant near the MELTF region in those who consumed vitamin A above the DRI. A similar significant interaction was noted for the genetic variant rs139560285 near the TRIM25 region in those who consumed cholesterol above the DRI. Interestingly, there was no significant difference in the T2DM risk attributed to these genetic variants when nutrition was not considered.
Several studies have examined gene–diet interactions in T2DM using the genetic risk score (GRS). The Airwave Health Monitoring study of 3,733 white British participants reported a significant interaction between the GRS and whole grain intake (P for interaction = 0.04). The effect of gene–diet (whole-grain) interactions on HbA1c level was greater in high-genetic-risk individuals (24). In a study using data from the UK Biobank, there was a negative interaction of blood HbA1c with the GRS and diet quality score. A higher diet quality score is associated with a greater reduction in T2DM risk among individuals with a higher genetic risk (25). Fruit intake interacts with the T2DM-GRS (P for interaction = 0.04) and related glucose metabolic traits (P for interaction ≤ 0.03). The association between fruit intake and a lower T2DM risk is more prominent in populations with a stronger genetic predisposition to T2DM (25). Here, we utilized nutritional reference values based on DRI to plan and evaluate nutrient intake in healthy individuals, considering potential deficiencies, inadequacies, and toxicities. We assessed a wide range of nutrient and gene variabilities using a comprehensive approach. Consequently, we identified novel SNPs that significantly interacted with specific nutrients related to T2DM.
Individuals with the MELTF variant rs73893755 who consumed vitamin A above the DRI level were found to have a higher risk of T2DM. The exact mechanisms underlying this association remain unclear. Nevertheless, it should be noted that high iron levels are a well-known risk factor for T2DM (26), and iron overload related to vitamin A consumption may play a critical pathophysiological role in this context. Vitamin A influences iron metabolism, including iron absorption and erythropoiesis (27, 28). MELTF encodes a protein similar to transferrin, which is involved in iron transport and metabolism (29, 30). Therefore, excessive vitamin A intake can lead to increased iron absorption, potentially overwhelming the regulatory capacity of MELTF and elevating T2DM risk due to iron overload.
The second main finding of our study is the interaction between cholesterol intake and an SNP in TRIM25 (rs139560285) contributing to T2DM risk. Individuals carrying rs139560285 who consumed cholesterol above the DRI had a higher risk of T2DM, suggesting that such individuals could be more vulnerable to T2DM when consuming more dietary cholesterol. Dietary cholesterol is abundant in various foods such as egg yolk, red meat, butter, and animal viscera. Although the relationship between cholesterol consumption and T2DM is still debated, studies have suggested a positive dose–response relationship (31, 32). One potential mechanism linking cholesterol intake to T2DM is chronic low-grade inflammation, which plays a role in disease pathogenesis (33). Dietary cholesterol exacerbates obesity-induced macrophage accumulation in adipose tissue, contributing to systemic inflammation (34). It also increases the levels of serum amyloid A, an inflammatory marker, activating pro-inflammatory signaling cascades upon consumption (35, 36). These findings suggest that excessive cholesterol intake significantly affects inflammation-induced diabetes. TRIM25 is a crucial regulator of lipid metabolism by suppressing adipocyte differentiation and a regulator of glucose metabolism by decreasing the expression of tricarboxylic acid cycle enzymes (37, 38). TRIM25 also plays a role in modulating inflammatory responses. TRIM25 has been reported to enhance NF-κB activation; moreover, it can directly regulate TNF-α-induced NF-κB signaling, thereby stimulating the production of pro-inflammatory cytokines such as IL-1β and TNF-α (39–41). This finding suggests that the interaction between cholesterol intake and TRIM25 variants may affect T2DM development through chronic low-grade inflammation.
Higher cholesterol intake is generally associated with greater consumption of animal-derived foods, including red meat, organ meats, and egg yolks (42). Likewise, higher vitamin A intake may reflect frequent consumption of liver, eggs, and full-fat dairy products, which are rich sources of preformed vitamin A (43). These patterns suggest that controlling specific food groups may benefit T2DM prevention efforts, especially in individuals with susceptible genotypes.
Although direct iron biomarkers were not available, hemoglobin concentration was analyzed as a proxy for iron status. Hemoglobin levels showed opposite trends across rs73893755 genotypes depending on vitamin A intake level: they decreased with T allele dosage in the high-intake group but increased slightly in the low-intake group. This pattern supports the possibility of a gene–nutrient interaction between MELTF and vitamin A influencing iron metabolism and T2DM risk. Furthermore, while vitamin A intake did not differ significantly across genotypes in the high-intake group, a modest increase was observed among T allele carriers in the low-intake group, providing partial biological plausibility for the observed interaction. In contrast, total cholesterol levels did not differ significantly across rs139560285 genotypes, regardless of dietary cholesterol intake. Given that the primary aim of this study was to examine interactions between dietary cholesterol and genetic variation, the absence of significant differences in circulating cholesterol levels suggests that other biological mechanisms may underlie the observed association with T2DM. Genetic influences on T2DM risk may not necessarily be mediated through serum cholesterol levels, particularly within the context of complex metabolic regulation.
These findings have potential implications for personalized nutrition in the Korean population. As interactions between specific genetic variants and dietary components may influence T2DM risk, incorporating genetic screening alongside dietary assessment could enhance the effectiveness of prevention and management strategies. For example, individuals with risk alleles that exhibit adverse responses to high cholesterol or vitamin A intake may benefit from more targeted nutritional guidance. In the context of Korea’s rapidly aging population and rising diabetes prevalence, such gene-informed approaches may support more precise public health interventions. Our results are consistent with the emerging field of nutrigenetics and precision nutrition, which seek to integrate genomic information into individualized dietary recommendations for chronic disease prevention (44, 45). Given the population-specific nature of dietary patterns and genetic profiles, gene–diet interaction studies in Koreans are particularly valuable for developing culturally appropriate personalized interventions for T2DM.
There were some limitations to consider when interpreting our findings. First, our study was conducted exclusively in Korean adults aged 40–69 years, necessitating further research in other ethnic groups or countries for broader applicability. Second, most variables were self-reported, which may have affected accuracy due to recall bias. Although the FFQ method used in the KoGES is reliable and validated, it is prone to inaccuracies in absolute nutrient values and lacks specificity for food details (46). Additionally, T2DM results from complex interactions between genetic susceptibility and various environmental factors (47). Therefore, gene–nutrient interactions alone cannot fully explain T2DM development, necessitating comprehensive approaches to understand the multifactorial nature of the disease.
Nevertheless unlike most previous studies that focused on the relationship between specific genetic variants and a limited number of dietary patterns, our study comprehensively evaluated a wide range of nutrients, including micronutrients and other minor dietary factors, in addition to genetic variability. Such an approach has not been previously employed. Additionally, this study provides novel evidence of gene–nutrient interactions in T2DM based on the comprehensive GWAS of a large, representative real-world database of the Korean population.
Understanding gene–nutrient interactions based on genotype allows for tailored dietary advice to optimize individual nutrient intake. Although dietary reference values are designed for the general population, the biological “dose” may vary among individuals due to genetic variability affecting the absorption, distribution, elimination, biotransformation, and metabolism of nutrients (23). These genetic differences can significantly influence nutrient processing in the body. Therefore, personalized dietary recommendations can be implemented, potentially improving health outcomes and preventing T2DM more effectively.
Our GWAS provides novel insights into gene–nutrient interactions in T2DM. We found that dietary vitamin A and cholesterol intake above the DRI significantly interacted with T2DM with genome-wide significance. These results suggest that the accumulation of specific polymorphisms at specific loci may influence T2DM development in carriers exposed to certain types and amounts of nutrients.
Statements
Data availability statement
Publicly available datasets were analyzed in this study. This data can be found: https://www.kdca.go.kr/contents.es?mid=a40504010000.
Ethics statement
The studies involving humans were approved by Institutional Review Board of Theragen Bio (approval number: 700062-20190819-GP-006-02). The studies were conducted in accordance with the local legislation and institutional requirements. The participants provided their written informed consent to participate in this study.
Author contributions
J-MP: Conceptualization, Investigation, Methodology, Validation, Visualization, Writing – original draft. J-EC: Data curation, Formal analysis, Resources, Software, Visualization, Writing – original draft. YS: Data curation, Investigation, Writing – original draft. Y-JK: Methodology, Validation, Writing – original draft. J-WL: Conceptualization, Funding acquisition, Methodology, Project administration, Supervision, Writing – review & editing. K-WH: Formal analysis, Funding acquisition, Project administration, Resources, Supervision, Writing – review & editing.
Funding
The author(s) declare that financial support was received for the research and/or publication of this article. This work was supported by the Korea Institute of Planning and Evaluation for Technology in Food, Agriculture, and Forestry (IPET) through a high-value-added food technology development program funded by the Ministry of Agriculture, Food, and Rural Affairs (MAFRA; grant number 321030051HD030) and a National Research Foundation of Korea (NRF) grant funded by the Korean Government (MSIT; grant number RS-2024-00354524).
Acknowledgments
We extend our gratitude to the Korean Genome and Epidemiology Study (KoGES) for their valuable cooperation. This study was conducted using bioresources provided by the National Biobank of Korea and was supported by the Centers for Disease Control and Prevention, Republic of Korea (2023-031).
Conflict of interest
J-EC and K-WH were employed by Advanced Institute of Technology, Theragen Health Co., Ltd.
The remaining authors declare that the research was conducted in the absence of any commercial or financial relationships that could be construed as a potential conflict of interest.
Generative AI statement
The authors declare that no Gen AI was used in the creation of this manuscript.
Publisher’s note
All claims expressed in this article are solely those of the authors and do not necessarily represent those of their affiliated organizations, or those of the publisher, the editors and the reviewers. Any product that may be evaluated in this article, or claim that may be made by its manufacturer, is not guaranteed or endorsed by the publisher.
Supplementary material
The Supplementary material for this article can be found online at: https://www.frontiersin.org/articles/10.3389/fnut.2025.1538813/full#supplementary-material
Abbreviations
AMDR, acceptable macronutrient distribution range; DBP, diastolic blood pressure; FFQ, food frequency questionnaire; GRS, genetic risk score; GWAS, genome-wide association studies; KDRIs, Korean Dietary Reference Intakes; KoGES, Korean Genome and Epidemiology Study; MELTF, melanotransferrin; OR, odds ratio; K, potassium; PC, principal component; SNP, single-nucleotide polymorphism; Na, sodium; SBP, systolic blood pressure; TRIM25, tripartite motif-containing protein 25; T2DM, type 2 diabetes mellitus.
References
1.
Khunti K Chudasama YV Gregg EW Kamkuemah M Misra S Suls J et al . Diabetes and multiple long-term conditions: a review of our current global health challenge. Diabetes Care. (2023) 46:2092–101. doi: 10.2337/dci23-0035
2.
Khan MAB Hashim MJ King JK Govender RD Mustafa H Al KJ . Epidemiology of type 2 diabetes – global burden of disease and forecasted trends. J Epidemiol Glob Health. (2020) 10:107–11. doi: 10.2991/jegh.k.191028.001
3.
Parker ED Lin J Mahoney T Ume N Yang G Gabbay RA et al . Economic costs of diabetes in the U.S. in 2022. Diabetes Care. (2024) 47:26–43. doi: 10.2337/dci23-0085
4.
World Health Organization . Global report on diabetes. Available online at: https://apps.who.int/iris/handle/10665/204871 (2016) (Accessed August 8, 2024).
5.
Saeedi P Petersohn I Salpea P Malanda B Karuranga S Unwin N et al . Global and regional diabetes prevalence estimates for 2019 and projections for 2030 and 2045: results from the international diabetes federation diabetes atlas, 9th edition. Diabetes Res Clin Pract. (2019) 157:107843. doi: 10.1016/j.diabres.2019.107843
6.
Bae JH Han KD Ko SH Yang YS Choi JH Choi KM et al . Diabetes fact sheet in Korea 2021. Diabetes Metab J. (2022) 46:417–26. doi: 10.4093/dmj.2022.0106
7.
Ha KH Kim DJ . Trends in the diabetes epidemic in Korea. Endocrinol Metab. (2015) 30:142–6. doi: 10.3803/EnM.2015.30.2.142
8.
Noh H Seo J Lee S Yi N Park S Choi Y-J et al . Cause-of-death statistics in 2020 in the Republic of Korea. J Korean Med Assoc. (2023) 66:132–42. doi: 10.5124/jkma.2023.66.2.132
9.
O'Hearn M Lara-Castor L Cudhea F Miller V Reedy J Shi P et al . Incident type 2 diabetes attributable to suboptimal diet in 184 countries. Nat Med. (2023) 29:982–95. doi: 10.1038/s41591-023-02278-8
10.
Murphy SP Poos MI . Dietary reference intakes: summary of applications in dietary assessment. Public Health Nutr. (2002) 5:843–9. doi: 10.1079/PHN2002389
11.
Minari TP Tácito LHB Yugar LBT Ferreira-Melo SE Manzano CF Pires AC et al . Nutritional strategies for the management of type 2 diabetes mellitus: a narrative review. Nutrients. (2023) 15:5096. doi: 10.3390/nu15245096
12.
Geng T Huang T . Gene-environment interactions and type 2 diabetes. Asia Pac J Clin Nutr. (2020) 29:220–6. doi: 10.6133/apjcn.202007_29(2).0002
13.
Park KS . The search for genetic risk factors of type 2 diabetes mellitus. Diabetes Metab J. (2011) 35:12–22. doi: 10.4093/dmj.2011.35.1.12
14.
Dietrich S Jacobs S Zheng JS Meidtner K Schwingshackl L Schulze MB . Gene-lifestyle interaction on risk of type 2 diabetes: a systematic review. Obes Rev. (2019) 20:1557–71. doi: 10.1111/obr.12921
15.
Villegas R Goodloe RJ McClellan BE Jr Boston J Crawford DC . Gene-carbohydrate and gene-fiber interactions and type 2 diabetes in diverse populations from the National Health and nutrition examination surveys (NHANES) as part of the epidemiologic architecture for genes linked to environment (EAGLE) study. BMC Genet. (2014) 15:69. doi: 10.1186/1471-2156-15-69
16.
Moon S Kim YJ Han S Hwang MY Shin DM Park MY et al . The Korea biobank array: design and identification of coding variants associated with blood biochemical traits. Sci Rep. (2019) 9:1382. doi: 10.1038/s41598-018-37832-9
17.
Kim Y Han BG KoGES group . Cohort profile: the Korean genome and epidemiology study (KoGES) consortium. Int J Epidemiol. (2017) 46:e20. doi: 10.1093/ije/dyv316
18.
Ahn Y Kwon E Shim JE Park MK Joo Y Kimm K et al . Validation and reproducibility of food frequency questionnaire for Korean genome epidemiologic study. Eur J Clin Nutr. (2007) 61:1435–41. doi: 10.1038/sj.ejcn.1602657
19.
Hwang J-Y Kim Y Lee HS Park E Kim J Shin S et al . The development of resources for the application of 2020 dietary reference intakes for Koreans. J Nutr Health. (2022) 55:21–35. doi: 10.4163/jnh.2022.55.1.21
20.
Institute of Medicine (US) Subcommittee on Interpretation and Uses of Dietary Reference Intakes; Institute of Medicine (US) . Standing committee on the scientific evaluation of dietary reference intake, subcommittee on interpretation and uses of dietary reference intake In: Dietary reference intake: applications in dietary assessment. Washington, DC: National Academies Press (US). (2000). doi: 10.17226/9956
21.
Yetley EA MacFarlane AJ Greene-Finestone LS Garza C Ard JD Atkinson SA et al . Options for basing dietary reference intakes (DRIs) on chronic disease endpoints: report from a joint US-/Canadian-sponsored working group. Am J Clin Nutr. (2017) 105:249S–85S. doi: 10.3945/ajcn.116.139097
22.
Kwon YJ Park DH Choi JE Lee D Hong KW Lee JW . Identification of the interactions between specific genetic polymorphisms and nutrient intake associated with general and abdominal obesity in middle-aged adults. Clin Nutr. (2022) 41:543–51. doi: 10.1016/j.clnu.2021.12.040
23.
Fenech M El-Sohemy A Cahill L Ferguson LR French TAC Tai ES et al . Nutrigenetics and nutrigenomics: viewpoints on the current status and applications in nutrition research and practice. J Nutrigenet Nutrigenomics. (2011) 4:69–89. doi: 10.1159/000327772
24.
Eriksen R Gibson R Aresu M Heard A Chan Q Evangelou E et al . Gene-diet quality interactions on haemoglobin A1c and type 2 diabetes risk: the airwave health monitoring study. Endocrinol Diabetes Metab. (2019) 2:e00074. doi: 10.1002/edm2.74
25.
Zhuang P Liu X Li Y Wan X Wu Y Wu F et al . Effect of diet quality and genetic predisposition on hemoglobin A1c and type 2 diabetes risk: gene-diet interaction analysis of 357,419 individuals. Diabetes Care. (2021) 44:2470–9. doi: 10.2337/dc21-1051
26.
Harrison AV Lorenzo FR McClain DA . Iron and the pathophysiology of diabetes. Annu Rev Physiol. (2023) 85:339–62. doi: 10.1146/annurev-physiol-022522-102832
27.
Hurrell R Egli I . Iron bioavailability and dietary reference values. Am J Clin Nutr. (2010) 91:1461S–7S. doi: 10.3945/ajcn.2010.28674F
28.
Michelazzo FB Oliveira JM Stefanello J Luzia LA Rondó PHC . The influence of vitamin a supplementation on iron status. Nutrients. (2013) 5:4399–413. doi: 10.3390/nu5114399
29.
Brown JP Hewick RM Hellström I Hellström KE Doolittle RF Dreyer WJ . Human melanoma-associated antigen p97 is structurally and functionally related to transferrin. Nature. (1982) 296:171–3. doi: 10.1038/296171a0
30.
Suryo Rahmanto Y Bal S Loh KH Yu Y Richardson DR . Melanotransferrin: search for a function. Biochim Biophys Acta. (2012) 1820:237–43. doi: 10.1016/j.bbagen.2011.09.003
31.
Li Y Pei H Zhou C Lou Y . Dietary cholesterol consumption and incidence of type 2 diabetes mellitus: a dose-response meta-analysis of prospective cohort studies. Nutr Metab Cardiovasc Dis. (2023) 33:2–10. doi: 10.1016/j.numecd.2022.07.016
32.
Gao F Cui CY . Dietary cholesterol intake and risk of gestational diabetes mellitus: a meta-analysis of observational studies. J Am Nutr Assoc. (2022) 41:107–15. doi: 10.1080/07315724.2020.1844605
33.
Park JM Lee HS Park JY Jung DH Lee JW . White blood cell count as a predictor of incident type 2 diabetes mellitus among non-obese adults: a longitudinal 10-year analysis of the Korean genome and epidemiology study. J Inflamm Res. (2021) 14:1235–42. doi: 10.2147/JIR.S300026
34.
Subramanian S Han CY Chiba T McMillen TS Wang SA Haw A 3rd et al . Dietary cholesterol worsens adipose tissue macrophage accumulation and atherosclerosis in obese LDL receptor-deficient mice. Arterioscler Thromb Vasc Biol. (2008) 28:685–91. doi: 10.1161/ATVBAHA.107.157685
35.
Björkbacka H Kunjathoor VV Moore KJ Koehn S Ordija CM Lee MA et al . Reduced atherosclerosis in MyD88-null mice links elevated serum cholesterol levels to activation of innate immunity signaling pathways. Nat Med. (2004) 10:416–21. doi: 10.1038/nm1008
36.
Lewis KE Kirk EA Mcdonald TO Wang S Wight TN O'Brien KD et al . Increase in serum amyloid a evoked by dietary cholesterol is associated with increased atherosclerosis in mice. Circulation. (2004) 110:540–5. doi: 10.1161/01.CIR.0000136819.93989.E1
37.
Lee JM Choi SS Lee YH Khim KW Yoon S Kim BG et al . The E3 ubiquitin ligase TRIM25 regulates adipocyte differentiation via proteasome-mediated degradation of PPARγ. Exp Mol Med. (2018) 50:1–11. doi: 10.1038/s12276-018-0162-6
38.
Li C Dou P Lu X Guan P Lin Z Zhou Y et al . Identification and validation of TRIM25 as a glucose metabolism regulator in prostate cancer. Int J Mol Sci. (2022) 23:9325. doi: 10.3390/ijms23169325
39.
Lee NR Kim HI Choi MS Yi CM Inn KS . Regulation of MDA5-MAVS antiviral signaling axis by TRIM25 through TRAF6-mediated NF-κB activation. Mol Cells. (2015) 38:759–64. doi: 10.14348/molcells.2015.0047
40.
Liu Y Liu K Huang Y Sun M Tian Q Zhang S et al . TRIM25 promotes TNF-α-induced NF-κB activation through potentiating the K63-linked ubiquitination of TRAF2. J Immunol. (2020) 204:1499–507. doi: 10.4049/jimmunol.1900482
41.
Park HS Lu Y Pandey K Liu G Zhou Y . NLRP3 inflammasome activation enhanced by TRIM25 is targeted by the NS1 protein of 2009 pandemic influenza a virus. Front Microbiol. (2021) 12:778950. doi: 10.3389/fmicb.2021.778950
42.
Soliman GA . Dietary cholesterol and the lack of evidence in cardiovascular disease. Nutrients. (2018) 10:780. doi: 10.3390/nu10060780
43.
Tanumihardjo SA Russell RM Stephensen CB Gannon BM Craft NE Haskell MJ et al . Biomarkers of nutrition for development (BOND)-vitamin a review. J Nutr. (2016) 146:1816s–48s. doi: 10.3945/jn.115.229708
44.
Zeevi D Korem T Zmora N Israeli D Rothschild D Weinberger A et al . Personalized nutrition by prediction of glycemic responses. Cell. (2015) 163:1079–94. doi: 10.1016/j.cell.2015.11.001
45.
Choi WJ Jin HS Kim SS Shin D . Dietary protein and fat intake affects diabetes risk with CDKAL1 genetic variants in Korean adults. Int J Mol Sci. (2020) 21:5607. doi: 10.3390/ijms21165607
46.
Resnicow K Odom E Wang T Dudley WN Mitchell D Vaughan R et al . Validation of three food frequency questionnaires and 24-hour recalls with serum carotenoid levels in a sample of African-American adults. Am J Epidemiol. (2000) 152:1072–80. doi: 10.1093/aje/152.11.1072
47.
Tremblay J Hamet P . Environmental and genetic contributions to diabetes. Metabolism. (2019) 100:153952. doi: 10.1016/j.metabol.2019.153952
Summary
Keywords
nutrient, single-nucleotide polymorphism, type 2 diabetes mellitus, gene–diet interaction, genome-wide association study
Citation
Park J-M, Choi J-E, Song Y, Kwon Y-J, Lee J-W and Hong K-W (2025) Genome-wide approach to study gene–nutrient intake interactions in type 2 diabetes mellitus in a large Korean cohort. Front. Nutr. 12:1538813. doi: 10.3389/fnut.2025.1538813
Received
03 December 2024
Accepted
10 April 2025
Published
07 May 2025
Volume
12 - 2025
Edited by
Sonia Roman, University of Guadalajara, Mexico
Reviewed by
Ricardo Adrian Nugraha, Faculty of Medicine Universitas Airlangga - Dr. Soetomo General Hospital, Indonesia
Karina Gonzalez-Aldaco, University of Guadalajara, Mexico
Updates
Copyright
© 2025 Park, Choi, Song, Kwon, Lee and Hong.
This is an open-access article distributed under the terms of the Creative Commons Attribution License (CC BY). The use, distribution or reproduction in other forums is permitted, provided the original author(s) and the copyright owner(s) are credited and that the original publication in this journal is cited, in accordance with accepted academic practice. No use, distribution or reproduction is permitted which does not comply with these terms.
*Correspondence: Ji-Won Lee, indi5645@yuhs.ac; Kyung-Won Hong, kyungwon.hong@theragenhealth.com
†These authors have contributed equally to this work
Disclaimer
All claims expressed in this article are solely those of the authors and do not necessarily represent those of their affiliated organizations, or those of the publisher, the editors and the reviewers. Any product that may be evaluated in this article or claim that may be made by its manufacturer is not guaranteed or endorsed by the publisher.