 Molian Tang1,2†
 Jialu Wang
 Renying Xu
- 1Department of Clinical Nutrition, Ren Ji Hospital, Shanghai Jiao Tong University School of Medicine, Shanghai, China
- 2Department of Nutrition, College of Health Science and Technology, Shanghai Jiao Tong University School of Medicine, Shanghai, China
- 3Department of Clinical Nutrition, Xin Hua Hospital Affiliated to Shanghai Jiao Tong University School of Medicine, Shanghai, China
Objective: Metabolic adaption (MA) might be of clinical relevance in weight loss management. However, it is unclear whether resting metabolic rate (RMR) reduction in weight loss reflects true MA or fat free mass (FFM) loss.
Methods: We re-analyzed the data based on a weight loss trial of 131 patients (aged 33.3 ± 6.7 years) with overweight/obesity. Anthropometric data, body composition, daily physical activity, sleep hour and dietary intake were collected for every 4 weeks (baseline, week 4, 8, 12, and 16). The linear mixed model was used to evaluate the absolute change in RMR and adjusted RMR [aRMR = RMR (kcal) divided by FFM (kg)] with two different equations (Katch-McArdle-determined vs. BIA-determined) for every 4 weeks after adjustment of age, sex, daily physical activity, sleep hours, dietary intake, and baseline FFM and fat mass (FM).
Results: Following the 16-week intervention, a significant reduction was observed in body weight [β: −5.6 kg; 95% Confidence Interval (CI): −6.3 kg, −5.0 kg], BMI (β: −2.3 kg/m2; 95%CI: −2.5 kg/m2, −2.0 kg/m2), FM (β: −4.7 kg; 95%CI: −5.2 kg, −4.1 kg), and FFM (β: −0.9 kg; 95%CI: −1.2 kg, −0.7 kg). Both Katch-McArdle-determined RMR and BIA-determined RMR presented a significant decrease between baseline and the end of the intervention (week 16). A small but statistically significant increase in Katch-McArdle-determined aRMR (β: 0.19 kcal/kg; 95%CI: 0.14 kcal/kg, 0.23 kcal/kg; adjusted p-value <0.0001) was confirmed by linear mixed models. While BIA-determined aRMR generally showed decreasing trends across the follow-up periods, only Week 12 demonstrated a statistically significant inverse association compared with the baseline (β: −0.21 kcal/kg; 95% CI: −0.29 kcal/kg, −0.13 kcal/kg, adjusted p-value = 0.01).
Conclusion: The use of different prediction equations might account for variations in MA in this study. The results highlight the importance of preserving FFM during weight loss, thus to prevent reductions in RMR.
Introduction
Metabolic adaptation (MA) is a contentious concept in which the body reduces resting metabolic rate (RMR) to facilitate weight regain after intentional weight loss (1). Since RMR accounts for ~70% of total daily energy expenditure, it is hypothesized that establishing the importance of MA would facilitate strategies to prevent body weight regain (2).
To date, the nature of MA remains unclear, with some studies underscore the importance (3–7) while others not (8, 9), establishing its existence facilitates different strategies and nutritional interventions, thus preventing body weight regain.
Moreover, it is important to distinguish whether the reduction in RMR was caused by MA or by the decrease in fat free mass (FFM). Müller et al. demonstrated that the decline in FFM (~65%) and MA (~35%) in combine could contribute to a reduction in RMR during the early phase of calorie restriction (10). FFM, consisting of metabolically active tissues and low-metabolic-rate tissues or organs (11), is primary determinant of RMR (12), a large reduction in FFM is contributed to slow the metabolic rate. However, intentional weight loss in people with obesity primarily decreases body fat, but also decreases FFM (13). Increasing protein intake from 0.8 g/kg/day to 1.2 g/kg/day reduced the weight loss-induced decline in FFM by ~45% (14). Hence, it is important to maintain the FFM with a higher daily protein intake (15). Another critical issue is the variability in RMR prediction equations across the studies (3, 6, 7), which may account for the observed subtle RMR changes (~50 kcal/day after a 12 kg weight loss) (16). Therefore, overestimation of RMR may lead to excessive caloric restriction, potentially compromising treatment adherence and lean mass preservation. On the other hand, underestimation of RMR may increase the likelihood of early treatment termination. Given accurate RMR estimation is clinically critical, verifying the accuracy of MA represents a fundamental research priority.
Herein, we conducted a secondary analysis based on our previous 16-week randomized clinical trial in Chinese overweight/obesity adults (17). The purpose of this study is to determine the differences in RMR and FFM adjusted RMR (aRMR = RMR/FFM) (15) during weight loss by comparing two prediction RMR equation (Katch-McArdle and BIA-derived equations) used in the study.
Methods
Study protocol
This was a secondary analysis based on an open-label, randomized, parallel clinical trial performed in two teaching hospitals (Clinical Registration Number: ChiCTR2100042637). All the participants were Chinese adults (18–65 years old) with overweight and obesity [Body mass index (BMI) between 24.0 kg/m2 to 35.0 kg/m2 (18) and waist circumference (WC) ≥90 cm for males and 80 cm for females]. The inclusive and exclusive criteria was described in the previous study (17) and in the Supplementary material. Briefly, a screening (week −1), a baseline (week 0), and four follow-up visits (week 4, 8, 12, and 16) were performed for all the participants (19). The study was performed by both the Ethics Committee, Ren Ji Hospital (KY2020-204) and Xin Hua Hospital (XHEC-C-2020-014-3), Shanghai Jiao Tong University School of Medicine. Written consents were obtained from each participant.
Data collection
Anthropometric data and body composition were evaluated at baseline (Week 0) and every four weeks (week 4, 8, 12, and 16) throughout the study. Body weight and composition [fat mass (FM) and FFM] were evaluated using bioelectric impedance analysis (BIA) (20) (Tanita Corporation, MC-180, Tokyo, Japan). To test whether changes in RMR were caused by the prediction model, we used Katch-McArdle equation (21) to calculate RMR and compared it with BIA-determined RMR.
The target of daily energy intake was generated by RMR (based on the Katch-McArdle equation) multiple the factor of physical activity (=1.25), then minus 500 kcal, and the daily protein recommendation was ≈2.0 g/kg FFM. The Katch-McArdle prediction equation was shown as follows: RMR = [370 + 21.6*lean body mass (kg)]. All the participants received two servings of a commercial meal replacement product (Herbalife China Protein Drink Mix dry powder, the nutrient composition in Supplementary Table 1), with one serving at breakfast and one at either lunch or dinner. An online (WeChat app) 3-day dietary recall was used to record daily food intake at each follow-up visit. Daily physical activity (quantified as step counts) and sleep hours were monitored by an electronic wearable device (the Mi Smart Band 4, Xiaomi Technology Co. LTD, Beijing, China). A total number of 10,000 steps per day was recommended for all the participants.
Outcome assessment
The primary outcome was the absolute change in RMR and adjusted RMR [aRMR = RMR (kcal) divided by FFM (kg)] from baseline (Week 0) to the end of the trial (Week 16). The residuals (rRMR) between the measured RMR (BIA-determined) and the prediction RMR (Katch-McArdle equation) were calculated as well (22). The secondary outcomes were absolute changes in body weight, FM, FFM, waist and hip circumferences before and after the trial.
Statistical analyses
Initial power calculation was conducted using parameters from previous published studies (23, 24). A total number of 16–28 participants is determined enough to provide 80% power to detect statistically significant change in body weight at a two-tailed significance level of 0.05. However, 100 participants were proposed for the study because the Chinese regulation required at least 100 participants for a weight loss clinical trial to substantiate the effectiveness. Assuming that the attrition rate was 35% after the intervention, the final estimated sample size was 154 while 100 of them remained at the end of the intervention (17).
Continuous variables were reported as mean and standard deviation (SD), after testing for normality with the Kolmogorov-Smirnov test. Categorical variables were presented as counts and percentages.
We used linear mixed models with time as a fixed effect and patients as a random effect to evaluate absolute changes in both RMR and adjusted RMR (aRMR = RMR [kcal]/FFM [kg]) (15) derived from two prediction equations (Katch-McArdle equation vs. BIA-based equation) at 4-week intervals. Models were adjusted for age, sex, daily physical activity, sleep hours, dietary intake, and baseline FFM and fat mass (FM) (2). A Tukey-Kramer correction was applied for post hoc comparisons.
Interaction effects between sex and week were tested by incorporating cross-product terms in the multivariable model. The association between changes in aRMR and FM was assessed using generalized linear modeling. Assumption of linearity of RMR and FFM at 4-week intervals were confirmed (Supplementary Figure 1). To verify the robustness of our primary findings, we performed three sensitivity analyses: exclusion of outliers identified by Tukey's fences (± 2.7 interquartile range); sex-stratified analysis (males vs. females) and age-stratified analysis (18–35 years vs. 36–65 years). All statistical analyses were conducted using Statistical Analysis System (SAS) 9.4 software (SAS Institute, Inc, Cary, NC). A two-tailed p < 0.05 was considered as statistical significance.
Results
Basic characteristics
A total number of 131 (38 males and 93 females) participants was included. The average age was 33.3 ± 6.7 years while the average BMI, WC, and hip circumference were 28.4 kg/m2, 97.3 cm and 101.9 cm. The age, baseline BMI, and WC were not significant between males and females while females had a higher proportion of FM and a lower proportion of FFM than males (Table 1).
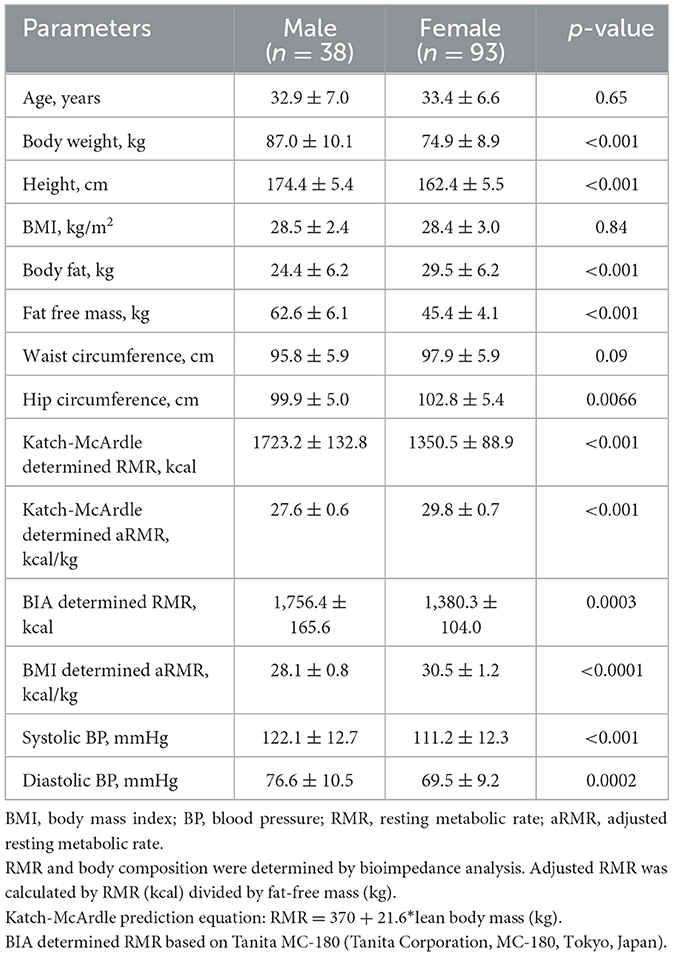
Table 1. Baseline characteristics of 131 participants with overweight and obesity.
Change in body composition
There was a significant decrease in body weight [β: −5.6 kg; 95% Confidence Interval (CI): −6.3 kg, −5.0 kg], BMI (β: −2.3 kg/m2; 95%CI: −2.5 kg/m2, −2.0 kg/m2), FM (β: −4.7 kg; 95%CI: −5.2 kg, −4.1 kg), and FFM (β: −0.9 kg; 95%CI: −1.2 kg, −0.7 kg).
Change in RMR and aRMR
A significant decrease in Katch-McArdle-determined RMR (β: −20.4; 95%CI: −26.4 kcal, −14.5 kcal; adjusted p-value < 0.001) while a small but statistically significant increase in aRMR (β: 0.19 kcal/kg; 95%CI: 0.14 kcal/kg, 0.23 kcal/kg; adjusted p-value < 0.0001) was confirmed by linear mixed models (Table 2). While BIA-determined aRMR generally showed decreasing trends across follow-up periods, only Week 12 demonstrated a statistically significant inverse association (β: −0.21; 95% CI: −0.29, −0.13, adjusted p-value = 0.01; Table 2).
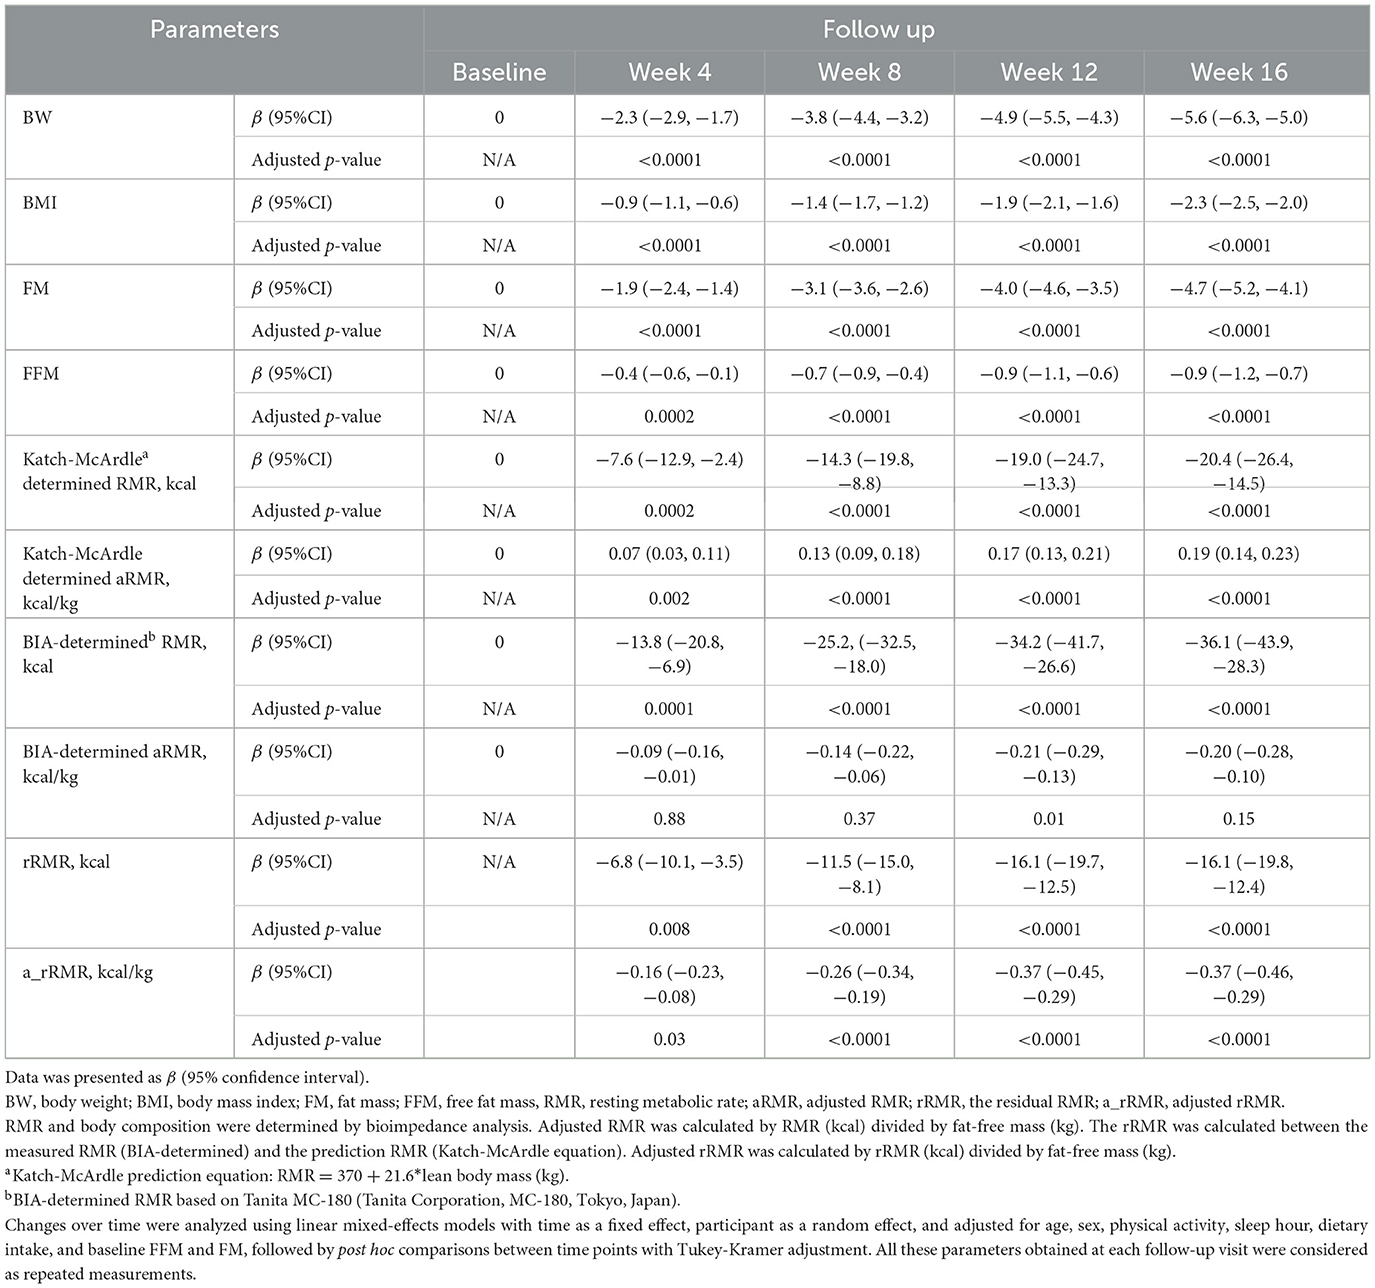
Table 2. Differences in body weight, body mass index, body composition, and resting metabolic rate before and after the study.
Residual RMR (rRMR) showed progressive and significant decrease from baseline across all follow-ups (all adjusted p-value < 0.05), with similar significant reduction observed for FFM-adjusted rRMR (adjusted p-value < 0.05; Table 2).
Sensitivity analysis
Sensitivity analysis consistently demonstrated significant reduction in both absolute and FFM-adjusted RMR across follow-ups (adjusted p-value < 0.05 for Katch-McArdle determined), except for BIA-determined FFM-adjusted RMR (Supplementary Table 2).
The association between the difference in body composition and aRMR
The difference in FFM was significantly associated with the difference in aRMR (by Katch-McArdle equation) at week 4, 8, 12, and 16. In contrast, changes in fat mass (FM) were negligible in the early stages but reached statistical significance by Week 16, though the effect size remained small, indicating the greater decrease in FFM, the greater reduction in aRMR (Supplementary Table 3).
Discussions
In the current study, we observed significant decreases in body weight, BMI, FM, FFM, and RMR after 16-week intervention. However, RMR per kilogram of FFM (Katch-McArdle determined) increased while both residual RMR and FFM-adjusted rRMR (a_rRMR) decreased.
FFM [consisting of metabolically active FFM and low-metabolic-rate tissues or organs (11)] is a primary determinant of RMR. A substantial loss of FFM leads to a decreased metabolic rate. However, reductions in FFM are commonly observed in weight-loss studies, contributing to 25%−40% of total body weight reduction (13, 25). Our findings demonstrated a significant increase in RMR per kilogram of FFM (β = 0.19 kcal/kg, 95%CI:0.14 kcal/kg, 0.23 kcal/kg) after 16-week intervention, indicating greater metabolic efficiency of FFM components—most notably skeletal muscle [account for 50% of FFM (13)] (12). However, the residual RMR and a_rRMR significantly decreased after intervention, indicating substantial MA was present. The underlying mechanism why MA happens during weight loss remains unclear. First of all, MA might be caused by different statistical methods, in other words, discrepancies among different regression prediction equations (26). Further, thyroid suppression, disproportionate loss of high metabolic-rate organs, and altered adiponectin signaling during weight loss are possible reasons for MA (12).
The key point in managing obesity and its related chronic diseases is loss of body fat, but not FFM, especially skeletal muscle. The loss of FFM is obviously associated with a series of negative symptoms, including fatigue, osteoporosis, and high risk of fall as well as worsen insulin resistance (27). Maintaining or increasing skeletal muscle is crucial because it is the main organ responsible for uptake of serum glucose after meal. On the other hand, more muscle mass is helpful to maintain insulin sensitivity by alleviating the workload on pancreatic β-cells and to lower free fatty acid levels (28). Optimizing body composition through muscle quality not only helps preserve active physical function but also promotes better metabolic regulation, leading to long-term health benefits (29).
Strength and limitation
The main strength lies in controlling for important confounding variables affecting weight loss, including dietary intake, daily physical activities, as well as age, sex and baseline FFM/FM (2). The primary limitation of this study is that RMR was estimated using two prediction equations rather than measured via indirect calorimetry. Further, BIA has some known limitations, including applicability only to specific populations, vulnerability to hydration fluctuations, and less precise in skeletal muscle quantification than gold-standard methods (30). These factors could explain, in part, the divergent outcomes between prediction equations in our analysis. Secondly, the inclusion and exclusion criterion for the current study were adapted from an established research protocol (as stated in the methodology section), therefore, the generalizability of our conclusions is limited. Future studies need to be performed in different populations to reduplicate our results. Further, the intensity and type of exercise were unavailable, which was closely associated with the strength of muscle mass.
Conclusions
The results of the current study showed that different prediction equations might lead to discrepancies in predicted RMR after adjustment of FFM. A relatively high protein diet combined with moderate exercise could be helpful to maintain both muscle mass and mass strength during weight loss.
Data availability statement
The raw data supporting the conclusions of this article will be made available by the authors, without undue reservation.
Ethics statement
The studies involving humans were approved by the Ethics Committee, Ren Ji Hospital, Shanghai Jiao Tong University School of Medicine the Ethics Committee, Xin Hua Hospital Affiliated to Shanghai Jiao Tong University School of Medicine. The studies were conducted in accordance with the local legislation and institutional requirements. The participants provided their written informed consent to participate in this study.
Author contributions
MT: Data curation, Investigation, Methodology, Writing – original draft, Writing – review & editing. JW: Investigation, Methodology, Writing – review & editing. YX: Investigation, Methodology, Writing – review & editing. RX: Conceptualization, Supervision, Writing – review & editing.
Funding
The author(s) declare that financial support was received for the research and/or publication of this article. The clinical trial was supported by the Herbalife Nutrition Product Innovation Center (NTR-1901) and supervised by the Contract Research Organization (Merieux NutriSciences, China).
Conflict of interest
The authors declare that the research was conducted in the absence of any commercial or financial relationships that could be construed as a potential conflict of interest.
Generative AI statement
The author(s) declare that no Gen AI was used in the creation of this manuscript.
Any alternative text (alt text) provided alongside figures in this article has been generated by Frontiers with the support of artificial intelligence and reasonable efforts have been made to ensure accuracy, including review by the authors wherever possible. If you identify any issues, please contact us.
Publisher's note
All claims expressed in this article are solely those of the authors and do not necessarily represent those of their affiliated organizations, or those of the publisher, the editors and the reviewers. Any product that may be evaluated in this article, or claim that may be made by its manufacturer, is not guaranteed or endorsed by the publisher.
Supplementary material
The Supplementary Material for this article can be found online at: https://www.frontiersin.org/articles/10.3389/fnut.2025.1543263/full#supplementary-material
Abbreviations
aRMR, adjusted resting metabolic rate; a_rRMR, adjusted residual resting metabolic rate; BIA, bioimpedance analysis; BMI, body mass index; FFM, fat free mass; FM, fat mass; REE, resting energy expenditure; RMR, resting metabolic rate; rRMR, residual between measured and predicted resting metabolic rate.
References
1. Argyrakopoulou G, Fountouli N, Dalamaga M. Kokkinos A. Revisiting resting metabolic rate: what is the relation to weight fluctuations? Curr Obes Rep. (2023) 12:502–13. doi: 10.1007/s13679-023-00528-x
2. Martins C, Roekenes J, Gower BA, Hunter GR. Metabolic adaptation is associated with less weight and fat mass loss in response to low-energy diets. Nutr Metab. (2021) 18:60. doi: 10.1186/s12986-021-00587-8
3. Fothergill E, Guo J, Howard L, Kerns JC, Knuth ND, Brychta R, et al. Persistent metabolic adaptation 6 years after “The Biggest Loser” competition. Obesity. (2016) 24:1612–9. doi: 10.1002/oby.21538
4. Rachakonda VP, DeLany JP, Kershaw EE, Behari J. Impact of hepatic steatosis on resting metabolic rate and metabolic adaptation in response to intentional weight loss. Hepatol Commun. (2019) 3:1347–55. doi: 10.1002/hep4.1414
5. Hall KD. Energy compensation and metabolic adaptation: “The Biggest Loser” study reinterpreted. Obesity. (2022) 30:11–3. doi: 10.1002/oby.23308
6. Martin A, Fox D, Murphy CA, Hofmann H, Koehler K. Tissue losses and metabolic adaptations both contribute to the reduction in resting metabolic rate following weight loss. Int J Obes. (2022) 46:1168–75. doi: 10.1038/s41366-022-01090-7
7. Rocha G, Podestá I, Canales A. Effect of diet and physical exercise on weight, body composition, and resting metabolic rate in obese chilean adults. Rev Med Chil. (2022) 150:575–83. doi: 10.4067/s0034-98872022000500575
8. Paoli A, Cenci L, Pompei P, Sahin N, Bianco A, Neri M, et al. Effects of two months of very low carbohydrate ketogenic diet on body composition, muscle strength, muscle area, and blood parameters in competitive natural body builders. Nutrients. (2021) 13:374. doi: 10.3390/nu13020374
9. Martins C, Roekenes J, Salamati S, Gower BA, Hunter GR. Metabolic adaptation is an illusion, only present when participants are in negative energy balance. Am J Clin Nutr. (2020) 112:1212–8. doi: 10.1093/ajcn/nqaa220
10. Müller MJ, Enderle J, Pourhassan M, Braun W, Eggeling B, Lagerpusch M, et al. Metabolic adaptation to caloric restriction and subsequent refeeding: the Minnesota Starvation Experiment revisited. Am J Clin Nutr. (2015) 102:807–19. doi: 10.3945/ajcn.115.109173
11. Müller MJ, Bosy-Westphal A, Kutzner D, Heller M. Metabolically active components of fat-free mass and resting energy expenditure in humans: recent lessons from imaging technologies. Obes Rev. (2002) 3:113–22. doi: 10.1046/j.1467-789X.2002.00057.x
12. Johannsen DL, Knuth ND, Huizenga R, Rood JC, Ravussin E, Hall KD. Metabolic slowing with massive weight loss despite preservation of fat-free mass. J Clin Endocrinol Metab. (2012) 97:2489–96. doi: 10.1210/jc.2012-1444
13. Conte C, Hall KD, Klein S. Is weight loss-induced muscle mass loss clinically relevant? JAMA. (2024) 332:9–10. doi: 10.1001/jama.2024.6586
14. Smith GI, Yoshino J, Kelly SC, Reeds DN, Okunade A, Patterson BW, et al. High-protein intake during weight loss therapy eliminates the weight-loss-induced improvement in insulin action in obese postmenopausal women. Cell Rep. (2016) 17:849–61. doi: 10.1016/j.celrep.2016.09.047
15. Goele K, Bosy-Westphal A, Rumcker B, Lagerpusch M, Muller MJ. Influence of changes in body composition and adaptive thermogenesis on the difference between measured and predicted weight loss in obese women. Obes Facts. (2009) 2:105–9. doi: 10.1159/000210369
16. Martins C, Gower BA, Hill JO, Hunter GR. Metabolic adaptation is not a major barrier to weight-loss maintenance. Am J Clin Nutr. (2020) 112:558–65. doi: 10.1093/ajcn/nqaa086
17. Wang J, Xiang Y, Chen Z, Lu W, Zhou Y, Mao X, et al. Timing of meal replacement on body weight: a multicenter open-labeled randomized trial. Endocrine. (2025) 88:91–8. doi: 10.1007/s12020-024-04118-2
18. Group of China Obesity Task Force. Guidelines for prevention and control of overweight and obesity in Chinese adults. Acta Nutrimenta Sinica. (2004) 26:1–4. doi: 10.3321/j.issn:0512-7955.2004.01.001
19. Wang J, Song A, Tang M, Xiang Y, Zhou Y, Chen Z, et al. The applicability of a commercial 3DO body scanner in measuring body composition in Chinese adults with overweight and obesity: a secondary analysis based on a weight-loss clinical trial. J Int Soc Sports Nutr. (2024) 21:2307963. doi: 10.1080/15502783.2024.2307963
20. Jin M, Du H, Zhang Y, Zhu H, Xu K, Yuan X, et al. Characteristics and reference values of fat mass index and fat free mass index by bioelectrical impedance analysis in an adult population. Clin Nutr. (2019) 38:2325–32. doi: 10.1016/j.clnu.2018.10.010
21. McArdle WD, Katch FI, Katch VL. Exercise Physiology: Energy, Nutrition, and Human Performance. 3rd ed. Philadelphia: Wolters Kluwer Health/Lippincott Williams & Wilkins (1991). doi: 10.1249/00005768-199112000-00013
22. Wolfe BM, Schoeller DA, McCrady-Spitzer SK, Thomas DM, Sorenson CE, Levine JA. Resting metabolic rate, total daily energy expenditure, and metabolic adaptation 6 months and 24 months after bariatric surgery. Obesity. (2018) 26:862–8. doi: 10.1002/oby.22138
23. Chen W, Liu Y, Yang Q, Li X, Yang J, Wang J, et al. The effect of protein-enriched meal replacement on waist circumference reduction among overweight and obese chinese with hyperlipidemia. J Am Coll Nutr. (2016) 35:236–44. doi: 10.1080/07315724.2014.989625
24. Flechtner-Mors M, Boehm BO, Wittmann R, Thoma U, Ditschuneit HH. Enhanced weight loss with protein-enriched meal replacements in subjects with the metabolic syndrome. Diabetes Metab Res Rev. (2010) 26:393–405. doi: 10.1002/dmrr.1097
25. Wilding JPH, Batterham RL, Calanna S, Davies M, Van Gaal LF, Lingvay I, et al. Once-weekly semaglutide in adults with overweight or obesity. N Engl J Med. (2021) 384:989–1002. doi: 10.1056/NEJMoa2032183
26. Wang X, Mao D, Xu Z, Wang Y, Yang X, Zhuo Q, et al. Predictive equation for basal metabolic rate in normal-weight chinese adults. Nutrients. (2023). 15:4185. doi: 10.3390/nu15194185
27. Stefanakis K, Kokkorakis M, Mantzoros CS. The impact of weight loss on fat-free mass, muscle, bone and hematopoiesis health: implications for emerging pharmacotherapies aiming at fat reduction and lean mass preservation. Metabolism. (2024) 161:156057. doi: 10.1016/j.metabol.2024.156057
28. Srikanthan P, Karlamangla AS. Relative muscle mass is inversely associated with insulin resistance and prediabetes. Findings from the third National Health and Nutrition Examination Survey. J Clin Endocrinol Metab. (2011) 96:2898–903. doi: 10.1210/jc.2011-0435
29. Naimo MA, Varanoske AN, Hughes JM, Pasiakos SM. Skeletal muscle quality: a biomarker for assessing physical performance capabilities in young populations. Front Physiol. (2021) 12:706699. doi: 10.3389/fphys.2021.706699
Keywords: metabolic adaption (MA), resting metabolic rate (RMR), Katch-McArdle, bioelectric impedance analysis (BIA), weight management
Citation: Tang M, Wang J, Xiang Y and Xu R (2025) Metabolic adaptation fluctuates with different prediction equations: a secondary analysis based on a weight-loss clinical trial. Front. Nutr. 12:1543263. doi: 10.3389/fnut.2025.1543263
Received: 13 December 2024; Accepted: 11 August 2025;
Published: 29 August 2025.
Edited by:
María Fernanda Zerón-Rugerio, University of Barcelona, SpainReviewed by:
Isabella Parilli, University of Barcelona, SpainAlicia Calleja Fernández, Open University of Catalonia, Spain
Copyright © 2025 Tang, Wang, Xiang and Xu. This is an open-access article distributed under the terms of the Creative Commons Attribution License (CC BY). The use, distribution or reproduction in other forums is permitted, provided the original author(s) and the copyright owner(s) are credited and that the original publication in this journal is cited, in accordance with accepted academic practice. No use, distribution or reproduction is permitted which does not comply with these terms.
*Correspondence: Renying Xu, NzIxMDAxNzM1QHNoc211LmVkdS5jbg==
†ORCID: Molian Tang orcid.org/0009-0002-2390-1728
Renying Xu orcid.org/0000-0003-2608-5586