 Mimansa Cholera1
 Rowena Cape
 Jodi D. Stookey
- 1Pediatric Dentistry, Department of Orofacial Sciences, University of California, San Francisco, San Francisco, CA, United States
- 2Maternal, Child & Adolescent Health, Epidemiology Unit, San Francisco Department of Public Health, San Francisco, CA, United States
Objective: To inform drinking water guidance and intervention, this randomized controlled trial tested the hypothesis that a standard serving of drinking water would normalize saliva insulin and improve caries risk factors to a greater extent, within 60 min, than no beverage or a standard serving of apple juice.
Methods: After baseline saliva collection, 105 healthy children (5–10y), attending routine dental check-ups, were randomly assigned to receive 500 mL water, 200 mL apple juice, or no drink. Simple unblinded randomization was stratified by age-and-sex-specific BMI percentile (5–85th or >85th). Follow-up saliva was collected at 45–60 min and classified with respect to insulin<170 pg/mL, pH > 7.0, buffering>5.0, osmolality<70 mmol/kg, amylase<60 μ/mL, IgG > 10 μg/mL, IgA < 112 μg/mL, and the sum of protective factors. In intention-to-treat analyses, quantile regression models tested for drinking water effects on median oral health factors and logistic regression models tested for greater relative odds of normalized saliva insulin and protective factors after drinking water.
Results: Drinking water instead of apple juice resulted in a significantly lower median saliva insulin (172 vs. 364 pg/mL), 10 times greater relative odds of saliva insulin below 170 pg/mL (OR = 10.84, 95%CI: 3.86–30.49, p < 0.001), and 5 times greater relative odds of 4 to 7 co-occurring saliva factors that protect against tooth decay (OR = 4.98, 95%CI: 1.42–17.48, p < 0.012). Drinking water instead of apple juice significantly increased the relative odds of pH > 7.0, buffering capacity>5.0, alpha-amylase<60 u/mL, and IgG > 10 μg/mL. Drinking water instead of no drink resulted in significantly lower median saliva insulin (172 vs. 266 pg/mL), significantly greater odds of saliva osmolality <70 mmol/kg, IgA < 112 μg/mL, and 4 to 7 co-occurring protective factors (OR = 4.63, 95%CI: 2.90–7.34, p < 0.001).
Conclusion: Drinking water instead of apple juice or no drink significantly improved 4 to 7 caries risk factors, simultaneously, within 60 min. The results warrant drinking water intervention to promote oral health.
1 Introduction
Health authorities, including the World Health Organization (1), United States Centers for Disease Control (2), and American Dental Association (3), recommend drinking water to promote oral health (1–5). Although tooth decay is preventable (2), caries experience affects an estimated 2 billion people, including over 500 million children (1). Dental pain accounts for millions of school absences, annually, and reduced academic performance (6, 7). For children, the WHO recommends promotion of drinking water instead of sugar sweetened beverages (SSB) and school-based intervention (4). Health authority guidance lacks details, however, that would be useful for specifying intervention dose of drinking water, target outcomes, and potential effect size.
Drinking water instead of SSB may conceivably prevent caries by reducing carbohydrate exposure. Carbohydrate is fermented in the mouth by bacteria (mainly Streptococcus mutans), producing acid, which gradually demineralizes tooth enamel and causes dental caries (8). Bacteria produce acid, meal by meal, every time fermentable carbohydrates are consumed (8). Drinking water instead of no drink can dilute carbohydrate concentrations in the mouth and/or rinse carbohydrate, from any source, off of the teeth. Drinking water does not contain carbohydrate, so reduces teeth exposure to carbohydrate relative to other beverages, such as SSB, juice, and milk, which contain carbohydrate. Caries risk is magnified when saliva flow is reduced (suboptimal hydration) (9) and carbohydrate intake is high (10).
Drinking water may block tooth decay in several other ways beyond reducing SSB exposure. Compared to other beverages, drinking water has a higher pH and buffering capacity to neutralize acid (11, 12). With neutral pH, Streptococcus mutans is only weakly competitive against other microbiota (13). Drinking water contains minerals, such as fluoride or calcium (14, 15), which can strengthen tooth enamel (16) and facilitate enamel remineralization (12, 17, 18). Drinking water may improve immune defense against oral bacteria, by increasing saliva immunoglobin G (IgG) or reducing saliva IgA-mediated adhesion of bacteria on teeth (19, 20). Drinking water can also reduce insulin resistance and inflammation, which are associated with increased caries risk (21–23).
Despite hypothesized benefits of drinking water for caries prevention, there are gaps in evidence about effects of drinking water, in children, under conditions that generalize to the school day. Effects of drinking water have been tested in adults and children relative to sports drinks and/or dehydration, during or after exercise, heat exposure, 24-to 48-h fluid restriction, or intravenous exposures (24–31). Effects of drinking water remain to be tested relative to a range of beverages and underhydration induced by non-extreme conditions of daily life. No randomized clinical trials (RCT) in children report simultaneous effects of drinking water on multiple saliva parameters, e.g., carbohydrate, pH, buffering capacity, fluoride exposure, and immune parameters, at the same time.
In meta-analysis of RCTs, in adults, drinking water instead of 100% orange or apple juice has consistent beneficial effects on tooth decay. The volume of drinking water that is reportedly effective in adults (250 mL 4 times/day or 1 L/d over 1–2 weeks) (32), is far greater, however, than the typical beverage change achieved in children. Meta-analysis of 24 controlled interventions involving children report an average induced increase in drinking water of 29 mL/d (33). Based on one randomized crossover study, in adolescents, replacing one serving of 500 mL orange juice with drinking water may be possible and enough to effectively lower carbohydrate intake and insulin levels (34).
To inform effective drinking water intervention and guidance for caries prevention in children, this RCT aimed to test for short-term effects of a standard serving of drinking water on multiple caries risk factors in saliva. The goal of this study was to describe what happens in children’s mouths in the hour after a typical beverage choice, assuming that the real-life beverage choice during the school day is neither isocaloric, isovolumetric, nor always happening after overnight fast. Public health professionals may use the results to plan and evaluate drinking water interventions to improve oral health. Dentists may use the results to unambiguously explain to families why and how each decision to drink water instead of juice, or no drink, makes a difference.
The primary hypothesis of this study was that a standard serving (500 mL) of drinking water would normalize saliva insulin to a greater extent, within 60 min, than no beverage or a standard serving (200 mL) of apple juice. Secondary hypotheses were that 500 mL drinking water would reduce caries risk factors, i.e., improve saliva osmolality, pH, buffering capacity and immune response to a greater extent, within 60 min, than no beverage or 200 mL apple juice.
2 Methods
2.1 Study design
This weight-status stratified, parallel group, RCT compared three drink treatments. Immediately after in-person enrollment and baseline data collection, study participants were randomly assigned to drink water, apple juice, or no drink, and followed for primary and secondary outcomes over 60 min. Neither the study participants, nor the staff who collected the saliva and tested the saliva pH and buffering capacity, were blind to the intervention treatment. Laboratory and epidemiologist staff who analyzed the saliva for insulin, osmolality, alpha-amylase, and immunoglobin G (IgG) and IgA, and analyzed the data were blind to the treatment allocation.
2.2 Participant recruitment
This study aimed to recruit 120 children, ages 5–10 years, who live in San Francisco and are eligible for local school-based oral health screenings and services, between October 2022 and June 2023. The recruitment target of 120 participants was selected to allow for up to 30 children to drop out. The sample size was informed by power calculations to have 80% chance of detecting between-group differences in mean saliva insulin at follow-up, of magnitude comparable to published literature [e.g., 2.5 (1.1) vs. 4.8 (2.2) mU/I (34, 35)], with 95% confidence. Recruitment ended with only 105 participants because dental clinic staff-time ran out in June 2023.
Study participants were recruited from one pediatric dental clinic, which serves a large share of children with public dental insurance in San Francisco, in addition to children with private insurance, and is connected to a large community-wide referral and health record system (EPIC systems corporation). All pediatric patients, who were scheduled or due to have a new or recall dental exam, based on the dental clinic roster or patient lists from EPIC, were informed about the research opportunity, and invited to participate. Recruitment outreach, pre-screening, and scheduling of all study participants were done by phone by one pediatric dental clinician (initials MC).
Potential participants were excluded if they did not have an address eligible for San Francisco Unified School District (SFUSD) school-based services. Children were excluded if they or their caregiver did not speak or read English, Spanish, or Chinese, the languages of 97% of students enrolled in SFUSD, and languages of CavityFree SF intervention efforts. Children were excluded from participation if they were presenting to the dental clinic for an operative procedure, underweight (age-and-sex-specific BMI percentile<5), not healthy enough to attend school (fever or systemic conditions), unable or unwilling to drink water or apple juice, or unable or unwilling to give saliva.
Participants who were interested in study participation and met eligibility criteria were scheduled to arrive at the dental clinic 60 min before their standard preventive dental service. At the clinic, study staff confirmed participant eligibility by checking the child’s BMI percentile and remaining space in the weight-appropriate study group (maximum 20 children per group). Study staff calculated the child’s age-and-sex-specific BMI percentile using weight and height measured on the clinic scale and stadiometer. Using CDC cutoffs (36), children were enrolled into the group with BMI percentile between 5 and 85 (Normal weight) or the group with BMI percentile above 85 (Overweight or Obesity).
2.3 Protocol
Study staff assisted children to collect unstimulated saliva by the passive drool method. Next, study staff opened a sealed envelope to find out, and immediately administer, the drink treatment. After confirming that the study participant finished the assigned drink, the study staff and dental clinician, together, determined the baseline saliva pH and buffering capacity, by aliquoting a few drops of saliva onto test strips (Plastic pH Test Strips, Universal Application, pH 0–14, LabRat Supplies, Parkton, NC, United States; Saliva-Check Buffer Kit GC America Inc. Alsip, IL, United States) and agreeing about the results. Saliva, remaining in the collection cup, was transferred by pipette to labelled cryogenic tubes for-80 storage within an hour after collection. Approximately 10 min after administration of the drink treatment, the study participant and parent completed a study questionnaire about demographics, determinants of saliva insulin, and determinants of oral health. Study staff collected follow-up saliva 45–60 min after the drink treatment, determined the post-drink saliva pH and buffering capacity, and prepared the post-drink aliquots for storage. Each study participant received $40 for completing the protocol and handouts about caries risk factors, before proceeding to their scheduled dental service.
2.4 Randomization
Participants were assigned to one of the three drink treatment groups with equal probability by simple unblinded randomization. Randomization was stratified by measured weight status to account for potential effect modification by overweight or obesity-related hyperinsulinemia (37). Within each weight status group, participants had an equal chance of assignment to each of the three drink treatments. In advance of the study launch, a research assistant (initials MG), who was not involved in participant recruitment, study coordination, or data analyses, used randomizer.org to generate two sequences of 60 randomly scrambled numbers, one for the normal weight group, and one for the group with overweight or obesity. The two sets of computer-generated, unique, scrambled numbers, each ranged from 1 to 60. In their scrambled order, MG put each number in a sealed envelope. MG then numbered the outside of the sealed envelopes in consecutive order from 1 to 60 for the group with normal weight and from 1 to 60 for the group with overweight or obesity. The numbers remained sealed inside the envelopes until the moment each participant was randomized. After completing baseline data collection for each participant, the study coordinator (initials RC) opened one envelope for that participant. RC interpreted the treatment assignment for the participant to be water, apple juice, or no drink if the number inside the envelope fell in the range of 1–20, 21–40, or 41–60, respectively. The allocation was concealed to all study staff except MG until the moment when the participant found out their assignment. No changes were made to the randomized assignments or protocol after trial commencement.
2.5 Drink treatments
The aim of this study was to compare standard servings of drinking water and apple juice, which are not equivalent in volume, to facilitate guidance about the health impact of real-life beverage options. The study compared 500 mL tap water with 200 mL apple juice, or no drink. Tap water in San Francisco has an average pH of 9.2, is considered moderately hard (9 ppm dissolved minerals; 9.3 ppm calcium, 2.9 ppm magnesium, 0.7 ppm potassium, 14 ppm sodium) and contains fluoride (0.3 ppm) (38). A standard water bottle size in San Francisco schools is about 500 mL (16–18 oz) (39, 40). Nationwide United States Department of Agriculture (USDA) nutrition standards for beverages, which apply to Child and Adult Care Food Program (CACFP)-funded schools in San Francisco, allow elementary schools to offer 8 oz. of 100% fruit juice (41). Study participants assigned to the apple juice group received a commercially available 200 mL apple juice box, which according to the label, contained 100% fruit juice with no ‘added’ sugar, 94 kcal, 23 g of carbohydrate (a mixture of fructose, glucose, sucrose, oligosaccharides, and polysaccharides), 0.4 g of protein, 2.1 mg vitamin C, 8.0 mg calcium, 9.2 mg magnesium, 215 mg potassium, 11.0 mg of phosphorus, and 18 mg of sodium. The apple juice had a pH of 3.5 (11) and an osmolality of 754 mmol/kg, measured by freezing point depression osmometer. Participants, who were randomly chosen to have no drink, received no drink.
2.6 Specimen processing
As noted above, saliva pH and buffering capacity were measured on fresh samples within 5 min of collection. Fresh saliva samples, which were stored refrigerated or iced for less than 12 h, were next used to measure saliva osmolality in triplicate by freezing point depression osmometer (Osmo1, Advanced Instruments, MA). Aliquots of saliva were stored frozen at-80 degrees Celsius for less than 6 months by the University of California San Francisco Clinical & Translational Sciences Biospecimen Processing Lab,1 which has redundant and remote 24/7 temperature monitoring. Samples were shipped frozen, on dry ice, in batches of 60, to Salimetrics lab (Carlsbad, CA, United States), for determination of saliva insulin, IgG, IgA, and alpha-amylase. To minimize freeze/thaw cycles, Salimetrics tests for multiple analytes on the same day and performs replicate assays.2
Each saliva parameter was expressed as a dichotomous variable to group participants with respect to the primary outcome, fasting/normalized insulin (<170 pg/mL) (34, 35), and each secondary outcome, beneficial oral health risk factors: saliva pH above 7.0, which is associated with low incidence of dental decay, little or no calculus, and oral health (42); saliva buffering capacity above the “very low” cutoff of 5.0 described by Bechir et al. (43); saliva osmolality below 70 mmol/kg, which is associated with underhydration (44); lower saliva alpha-amylase, below the median value of 60 u/mL at follow-up for this study population, given reports of significantly lower alpha-amylase in caries free, as opposed to caries active individuals (45, 46); lower saliva IgA, defined as the lowest tertile for the study population at follow-up (112 μg/mL), given that higher saliva IgA can reflect higher insulin (47) and is associated with early childhood caries (48); and higher saliva IgG, above the 75th percentile for the study population at follow-up (10 μg/mL), because saliva IgG is inversely related with subsequent two-year caries increment (19). The dichotomous variables were specified as 0,1 numeric dummy variables, with “1” assigned for the protective value. A variable representing the total number of protective risk factors was calculated as the sum of the dummy variables.
2.7 Study questionnaire
Each study participant’s parent or guardian completed a questionnaire on behalf of the child, with input from the child. The study questionnaire captured information about factors that can confound effects of drinking water on insulin and/or oral health. The questionnaire asked about the date, time, quality and quantity of the last food consumed, last drinks other than water consumed, and last vitamins, gum, mint, cough drops, antacid or medicine consumed. Following NHANES survey methods, participants were considered fasted if they had not consumed anything other than drinking water for 8 h or more before study participation (49). To support inferences for SFUSD oral health screening and intervention planning, caregivers were asked if the study participant attended a public or private school, and about how many days per week the child usually gets a school lunch, consistent with the National Health and Nutrition Examination Survey (NHANES) survey question DBD381 (50).
The questionnaire asked when the study participant last consumed drinking water to index acute hydration condition. The questionnaire asked about the usual frequency of drinking water, modifying a question from Onufrak et al. (51): “In the past month, about how often did your child drink a glass or bottle of plain water? Include tap, water fountain, bottled, and unflavored sparkling water.” To gauge exposure to local fluoridated tap water, caregivers were asked how long the study participant had lived in San Francisco.
To index the usual background consumption of caloric beverages, the questionnaire included validated (52) questions about beverage frequency on an average day, which are used by the Women Infants & Children (WIC) program in Los Angeles, California, in English, Spanish and Chinese (53). Caregivers were asked to report how many days their child was physically active for at least 60 min per day, a key indicator for physical activity (54, 55).
All study participants self-reported no acute illness and confirmed that they were healthy enough to go to school. With respect to chronic health conditions, the caregiver and child were asked if a doctor or other health professional had ever told them that the child has diabetes, and if a doctor or health professional had ever told them that the child has asthma. The response options for the chronic health questions were: Yes, No, Borderline or pre-, Do not want to say, and Do not know.
The questionnaire asked about past year dental visits, aligned with the California Health Information Survey (56). After the clinic visit ended, the dental clinician abstracted oral health variables from the dental chart, to define dichotomous indices of high caries risk, caries experience, and caries burden. High caries risk was defined following the ADA Caries Risk Assessment guidance, which reflects risk related to sugary foods or drinks, eligibility for Medi-Cal (proxy for low income), family history of caries, special health care needs that limit oral health care, lesions in the last 24 months, teeth extracted due to caries and low salivary flow (57). Caries experience was defined as having either untreated tooth decay or treated (restored or filled) tooth decay (58). Greater caries burden was arbitrarily defined as having 5 or more DMFT. Clinical measurements, answers to the questionnaire, data from the dental chart, and laboratory test results were recorded in Redcap software.
2.8 Statistical analyses
Intention-to-treat analyses were conducted using data for 105 participants. STATA SE 15.1 software (StataCorp LLC, College Station, TX, United States) was used to describe the data, test the primary and secondary hypotheses, and conduct sensitivity analyses. To account for weight-stratified randomization, all statistical models included control for weight classification and robust standard errors. p-values below 0.05 were considered statistically significant.
2.8.1 Missing data
Missing follow-up data for one participant, who was assigned to the Apple juice group, were replaced by carrying forward the participant’s baseline values. The last observation carried forward (LOCF) approach was chosen, because of the short follow-up interval of 45–60 min, small amount of missing data (<1% of participants), direction of potential bias toward the null for the primary outcome, no change in risk classification for any saliva parameter for the majority of participants, who had no drink, with similar weight status (overweight or obesity), and assumption of data missing at random (no reason to expect that the value of the missing data was related to the value of each variable). Two out of range high saliva IgG values were set to the maximum value for the lab.
2.8.2 Descriptive analyses
Logistic regression models compared the randomly assigned drink treatment groups with respect to participant characteristics at baseline. Kernel density plots described the distribution of each saliva parameter by drink treatment. Noting the non-normal distributions of the saliva parameters, quantile regression models (qreg2) were used to compare the saliva parameters by drink treatment. For each saliva parameter, the median baseline value, median change over time, and median value at follow-up were predicted for each drink treatment group from the qreg2 models.
The proportion of study participants with co-occurring protective factors was determined by cross-tabulation of each pair of risk factors. Incident change in risk factors was defined as absence of the protective factor at baseline with presence of the factor at follow-up. Co-occurring incident change was defined as both factors in a pair newly observed at follow-up. Logistic regression models described the relative odds of concurrent change. The suest command in stata was used to adjust the logistic regression model results for simultaneous covariance.
2.8.3 Hypothesis testing
Quantile and logistic regression models tested if, compared to apple juice or no drink, drinking water resulted in improvement in each oral health factor, alone, and/or in combination with other factors. Quantile regression models tested for differences in the median value of each saliva factor at follow-up. Logistic regression models tested for differences in the relative odds of having each saliva factor above or below a protective cutoff at follow-up. The magnitudes of effect were expressed in terms of odds ratios (OR) with 95% confidence intervals (CI). A first set of models included control for body weight classification and robust standard errors. A second set of models additionally controlled for baseline status, to account for factors that differed across groups at baseline, despite randomization. Lastly, logistic regression models tested for the overall effects of drinking water instead of apple juice or no drink on the relative odds of having 4 to 7 saliva factors that protect against caries at the same time. Robust standard errors for each saliva factor were obtained using the suest command in Stata, which account for simultaneous covariance across factors. Robust standard errors for the relative odds of having 4 to 7 protective factors at the same time were obtained using the cluster command in Stata. Logistic regression model goodness of fit was checked using the Pearson chi-squared test, with p-values over 0.05 accepted as good fit.
2.8.4 Sensitivity analyses
Alternative methods for handling missing data were checked in sensitivity analyses that replaced the unobserved data points for the participant in the Apple juice group, who dropped out, with the mean values observed at follow-up for participants with similar weight status (overweight or obesity), who were assigned to the no drink group. Additional sensitivity analyses also repeated hypothesis testing for effects of drinking water instead of apple juice for a restricted sample of participants with complete data (n = 104).
3 Results
3.1 Participant characteristics
The Consolidated Standards of Reporting Trails (CONSORT) diagram in Figure 1 describes the number of children who were invited to participate, screened, enrolled, assessed at baseline, randomized, administered the drink treatment, and followed for change in saliva parameters. Each randomly assigned group had 35 participants, including 20 with normal weight and 15 (43% of participants) with overweight or obesity. One participant, who was randomly assigned to the apple juice group, declined to drink the apple juice and did not complete follow-up data collection.
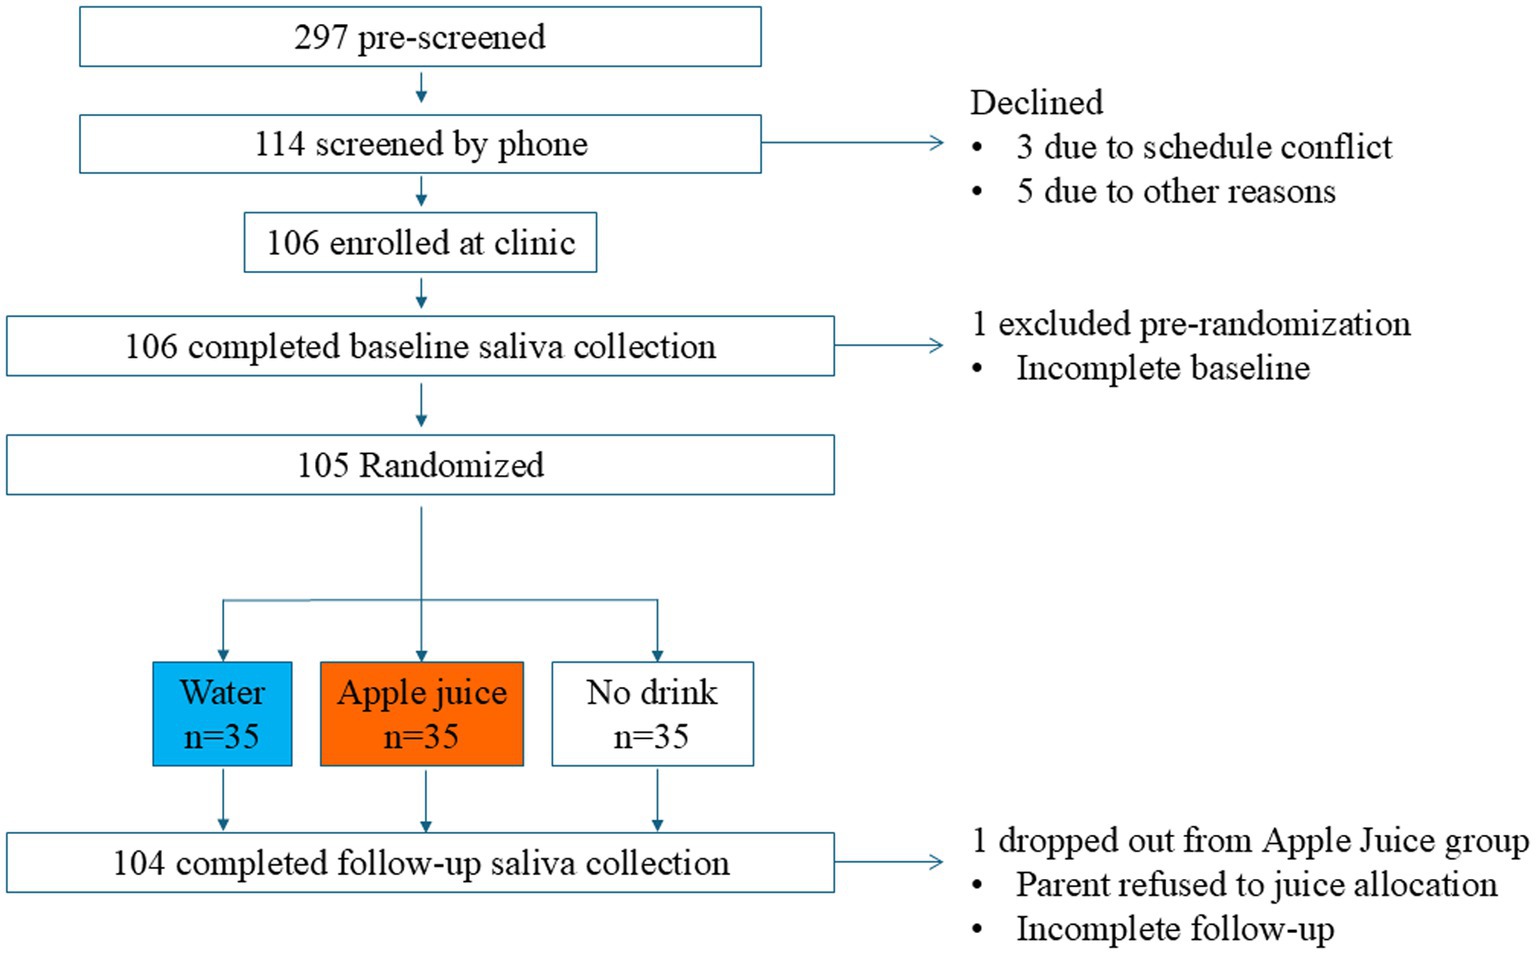
Figure 1. CONSORT diagram of the flow of study participants through enrollment, allocation, follow-up, and analysis.
Table 1 describes the 105 participants (58 girls and 47 boys) who completed baseline data collection and were randomized. All participants were between the ages of 5–10 years, with 58% under age 8. All study participants were residents of the San Francisco Bay Area and were scheduled for a dental clinic appointment in the mid-morning or mid-afternoon on a weekday school day. All participants had public insurance (Denti-Cal). About 90% had eaten something within 8 h of the clinic visit and were not fasting. About three quarters of the study participants had lived in San Francisco for their whole lives (73%). The majority of study participants self-identified as Asian or Hispanic race-ethnicity (82%), attended a public school (91%), and reported consuming at least one school lunch each week (63%). About one third of participants reported consuming juice daily (39%). A minority of study participants self-reported multi-racial (8%), Black or African American (5%), Native American (2%), White (1%), or Other (2%) race-ethnicity.
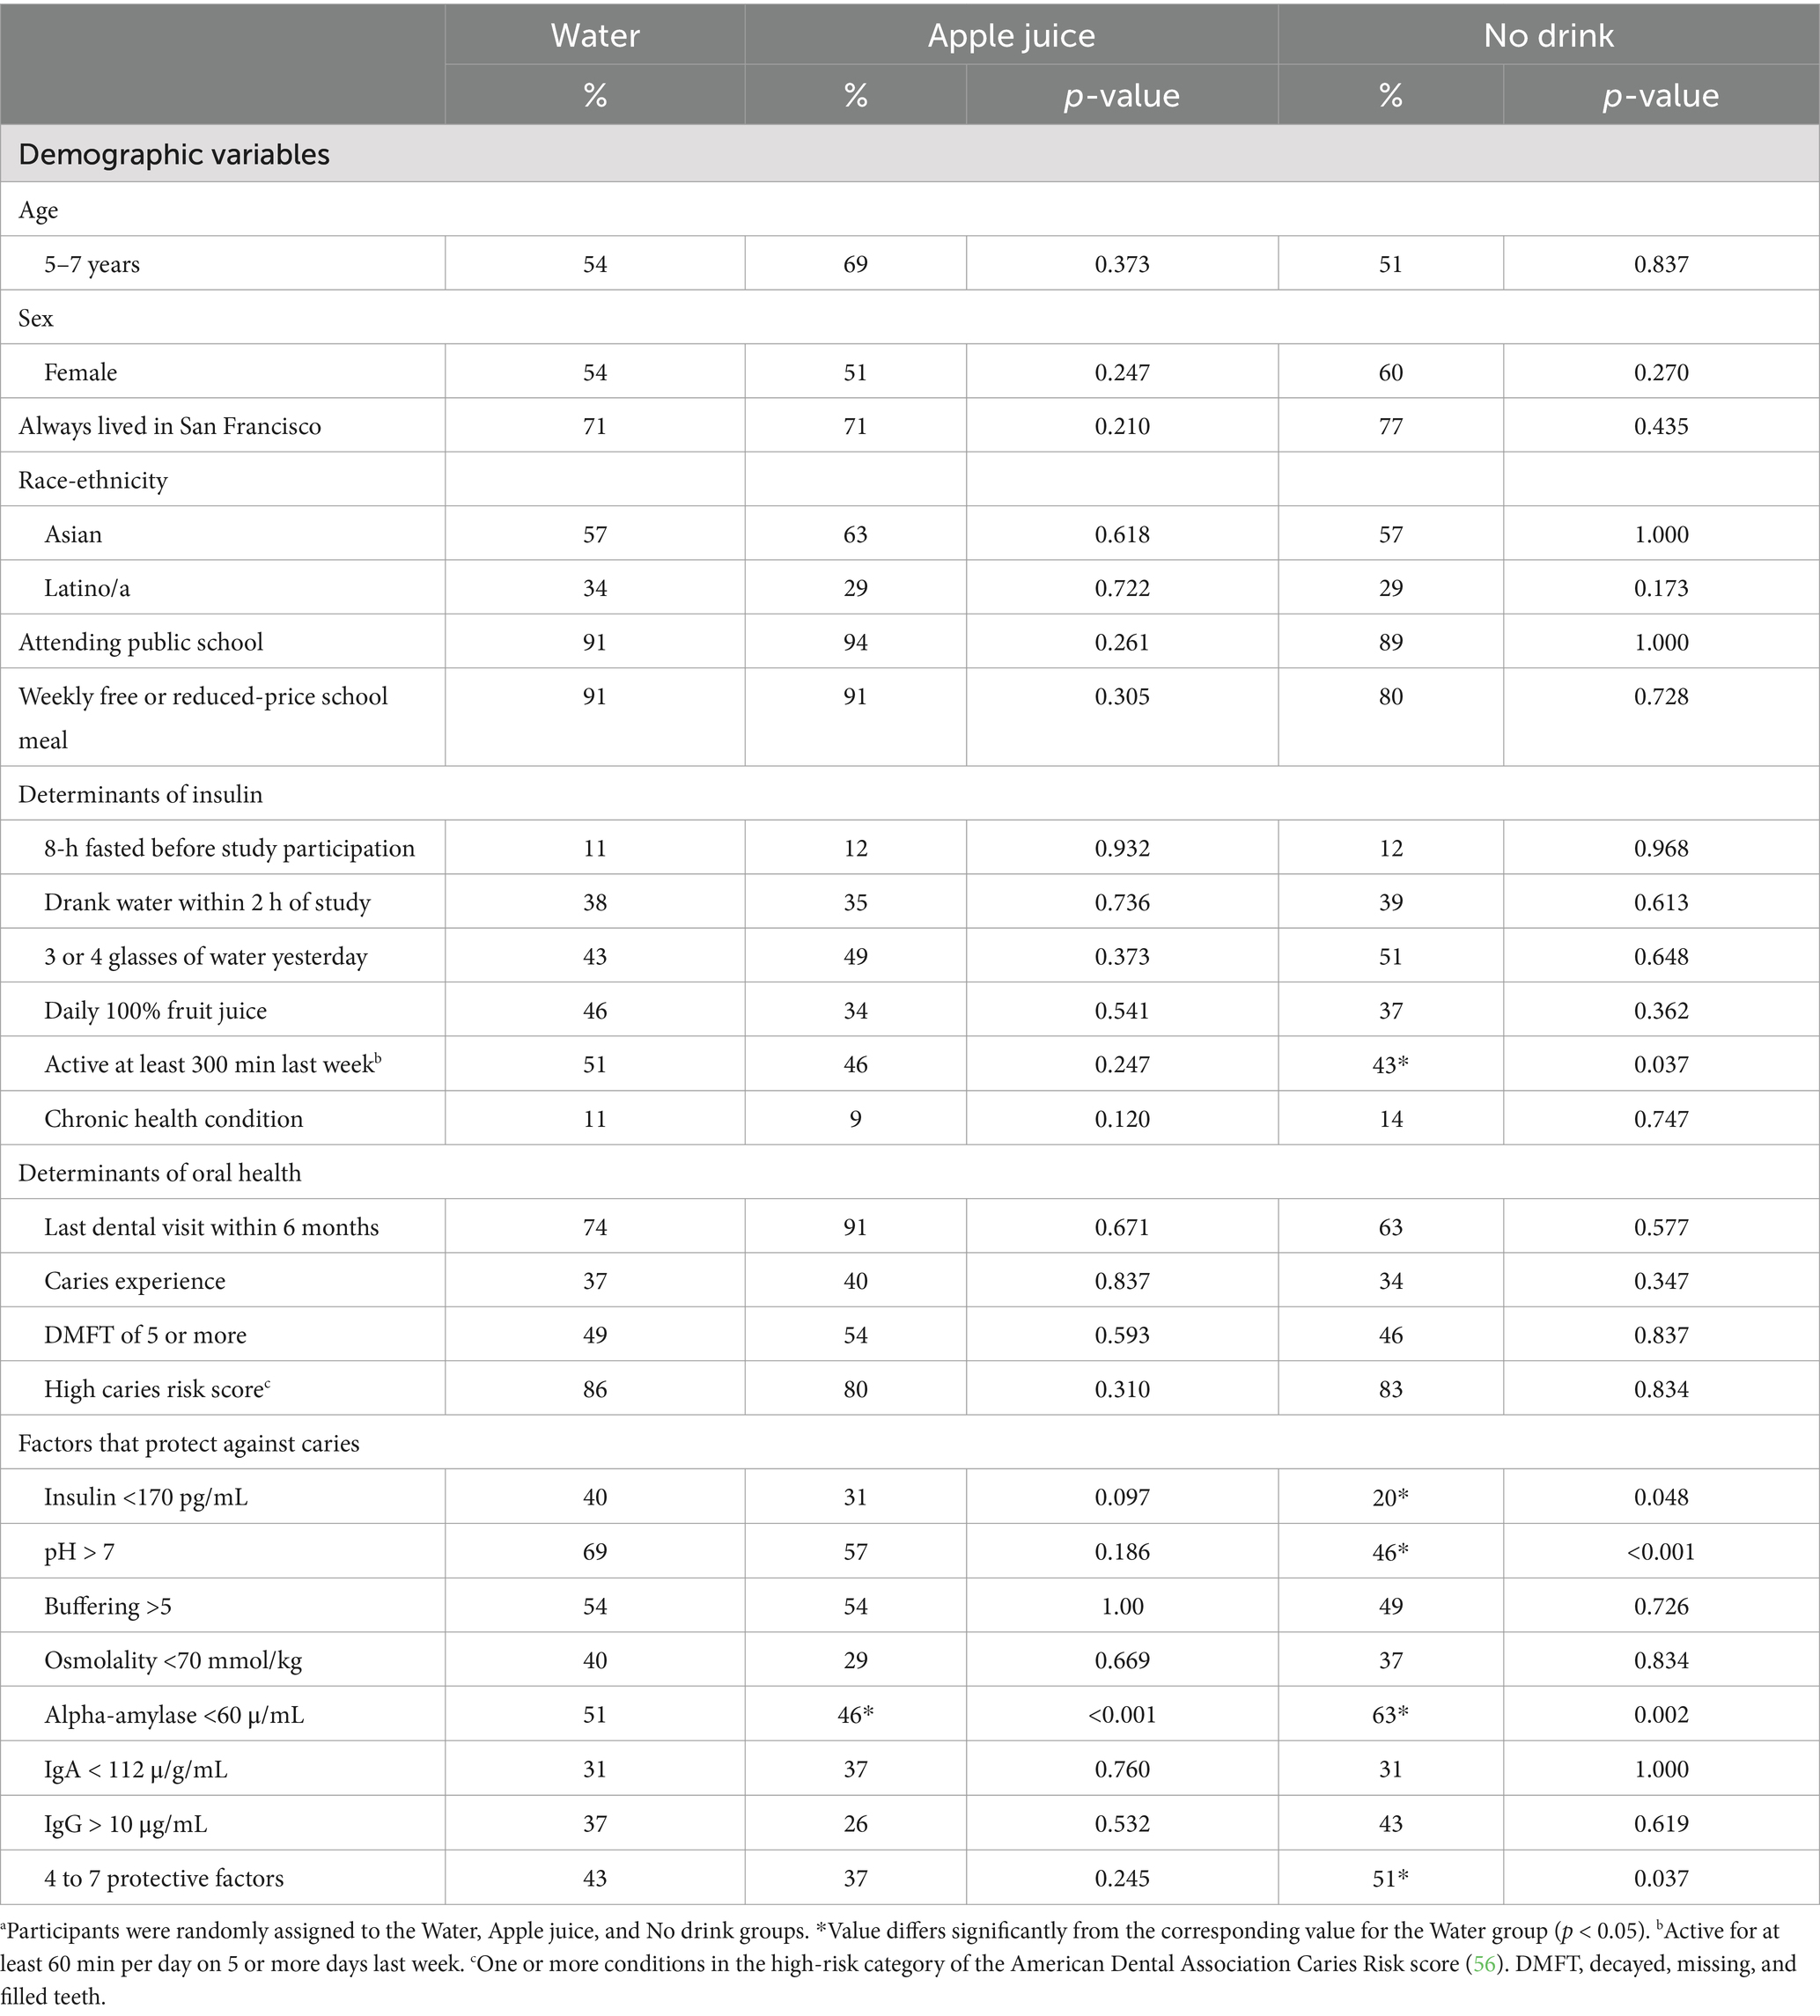
Table 1. Study participant characteristics at baseline by randomly assigned drink treatmenta.
3.2 Baseline
The Water, Apple juice, and No drink groups did not differ significantly with respect to demographic variables, weight status, daily juice intake, access to dental care, oral health status, or fasting condition when they arrived at the clinic (see Table 1). At baseline, despite randomization, compared to the Water group, the No drink group was significantly less likely to report 300 min or more physical activity in the week prior to study participation, and less likely to have saliva insulin below 170 pg/mL, or saliva pH above 7. The No drink group was significantly more likely to have saliva alpha-amylase below 60 μ/mL than the Water group. At baseline, the Apple juice group differed from the Water group only with respect to the proportion of participants with saliva alpha-amylase below 60 μ/mL.
At baseline, in the Water and Apple juice groups, the proportion of participants with at least 4 protective oral health risk factors did not differ significantly. The proportion with 4 to 7 protective factors was significantly higher in the No drink compared to the Water group (51% vs. 43%), at baseline. Supplementary Appendix 1 (top) describes the within-person co-occurrence of oral health parameters at baseline. People with saliva insulin below 170 pg/mL at baseline were 10% more likely to also have saliva osmolality below 70 mmol/kg, 2 times more likely to also have saliva alpha-amylase below 60 u/mL, and over 4 times more likely to also have saliva IgA below 100 μg/mL than people with saliva insulin above this cutoff (see Supplementary Appendix 2). Saliva pH above 7.0 was associated with significantly greater relative odds of also having saliva buffering capacity above 5.0, saliva osmolality below 70 mmol, and saliva IgG above 10 g/mL. Saliva osmolality below 70 mmol/kg was associated with significantly greater likelihood of saliva IgG over 10 g/mL. At baseline, the study population had a median combined total of 3 factors that protect against caries.
3.3 Change in caries risk factors from baseline to 45–60 min
Multiple changes in saliva parameters co-occurred within 45–60 min of the drink treatment. Supplementary Appendix 1 (bottom) describes co-occurrent incident changes. All study participants, who had a pH below 7.0 at baseline, who decreased their saliva insulin from above to below 170 pg/mL between baseline and 45–60 min, experienced an incident increase in pH to a level above 7.0. All participants with saliva buffering below 5.0 at baseline, who decreased saliva insulin, experienced incident increases in buffering. All participants with saliva alpha-amylase over 60 u/mL, at baseline, who decreased saliva insulin, experienced decreases in alpha-amylase.
As it was not possible to estimate incident rate ratios for outcomes where 100% of participants who were eligible to improve (e.g., pH, buffering or alpha-amylase) did improve (i.e., zero in the denominator), Supplementary Appendix 2 reports odds ratios, representing the relative odds of change vs. no change, regardless of baseline eligibility to improve, estimated by logistic regression. A decrease in saliva insulin, from above to below 170 pg/mL, was associated with significantly greater likelihood of a concurrent decrease in saliva alpha-amylase, from above to below 60 u/mL, and/or concurrent increase in saliva IgG, from below to above 10 g/mL. Change in saliva buffering capacity was associated with change in saliva pH and osmolality.
3.4 Effects of drinking water instead of apple juice
Figure 2 describes the distribution of change in each saliva parameter, relative to baseline, for the Water and Apple juice groups, respectively. Blue lines represent changes for the Water group. Orange lines represent changes for the Apple juice group. The median increase in insulin was significantly greater in the Apple juice group compared to the Water group (see Table 2). The median increases in pH and buffering capacity were significantly greater in the Water compared to the Apple juice group. The median decrease in saliva osmolality was significantly smaller in the Apple juice group. The median total sum of protective risk factors did not change in the Apple Juice group but increased by 1 in the Water group.
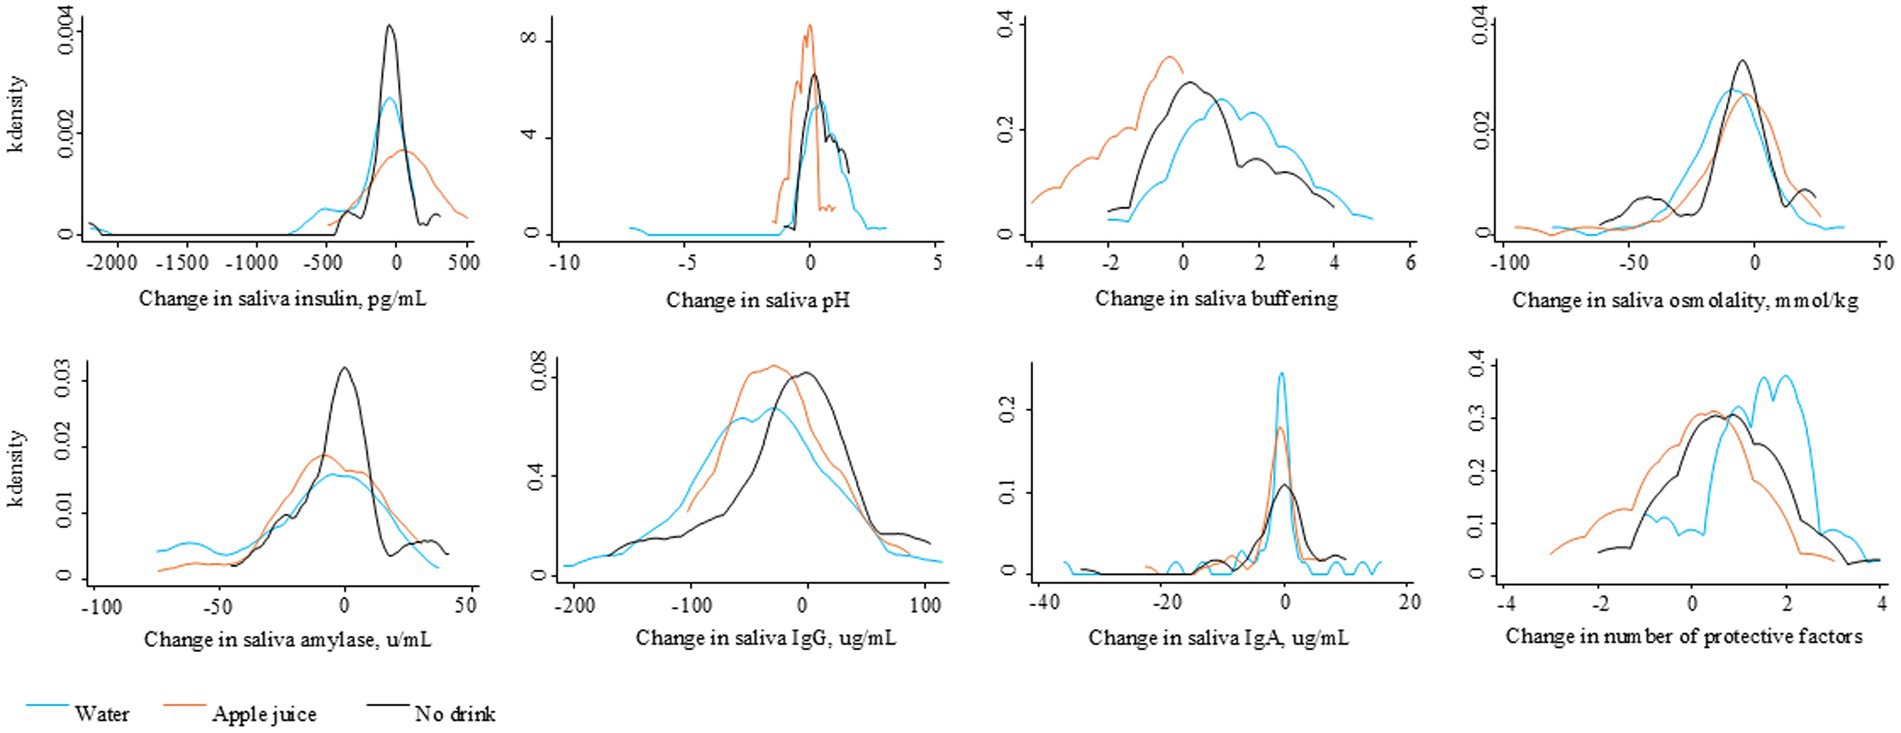
Figure 2. Distribution of the change in saliva factors over 45–60 minutes after the randomly assigned drinking water, apple juice, or no drink.
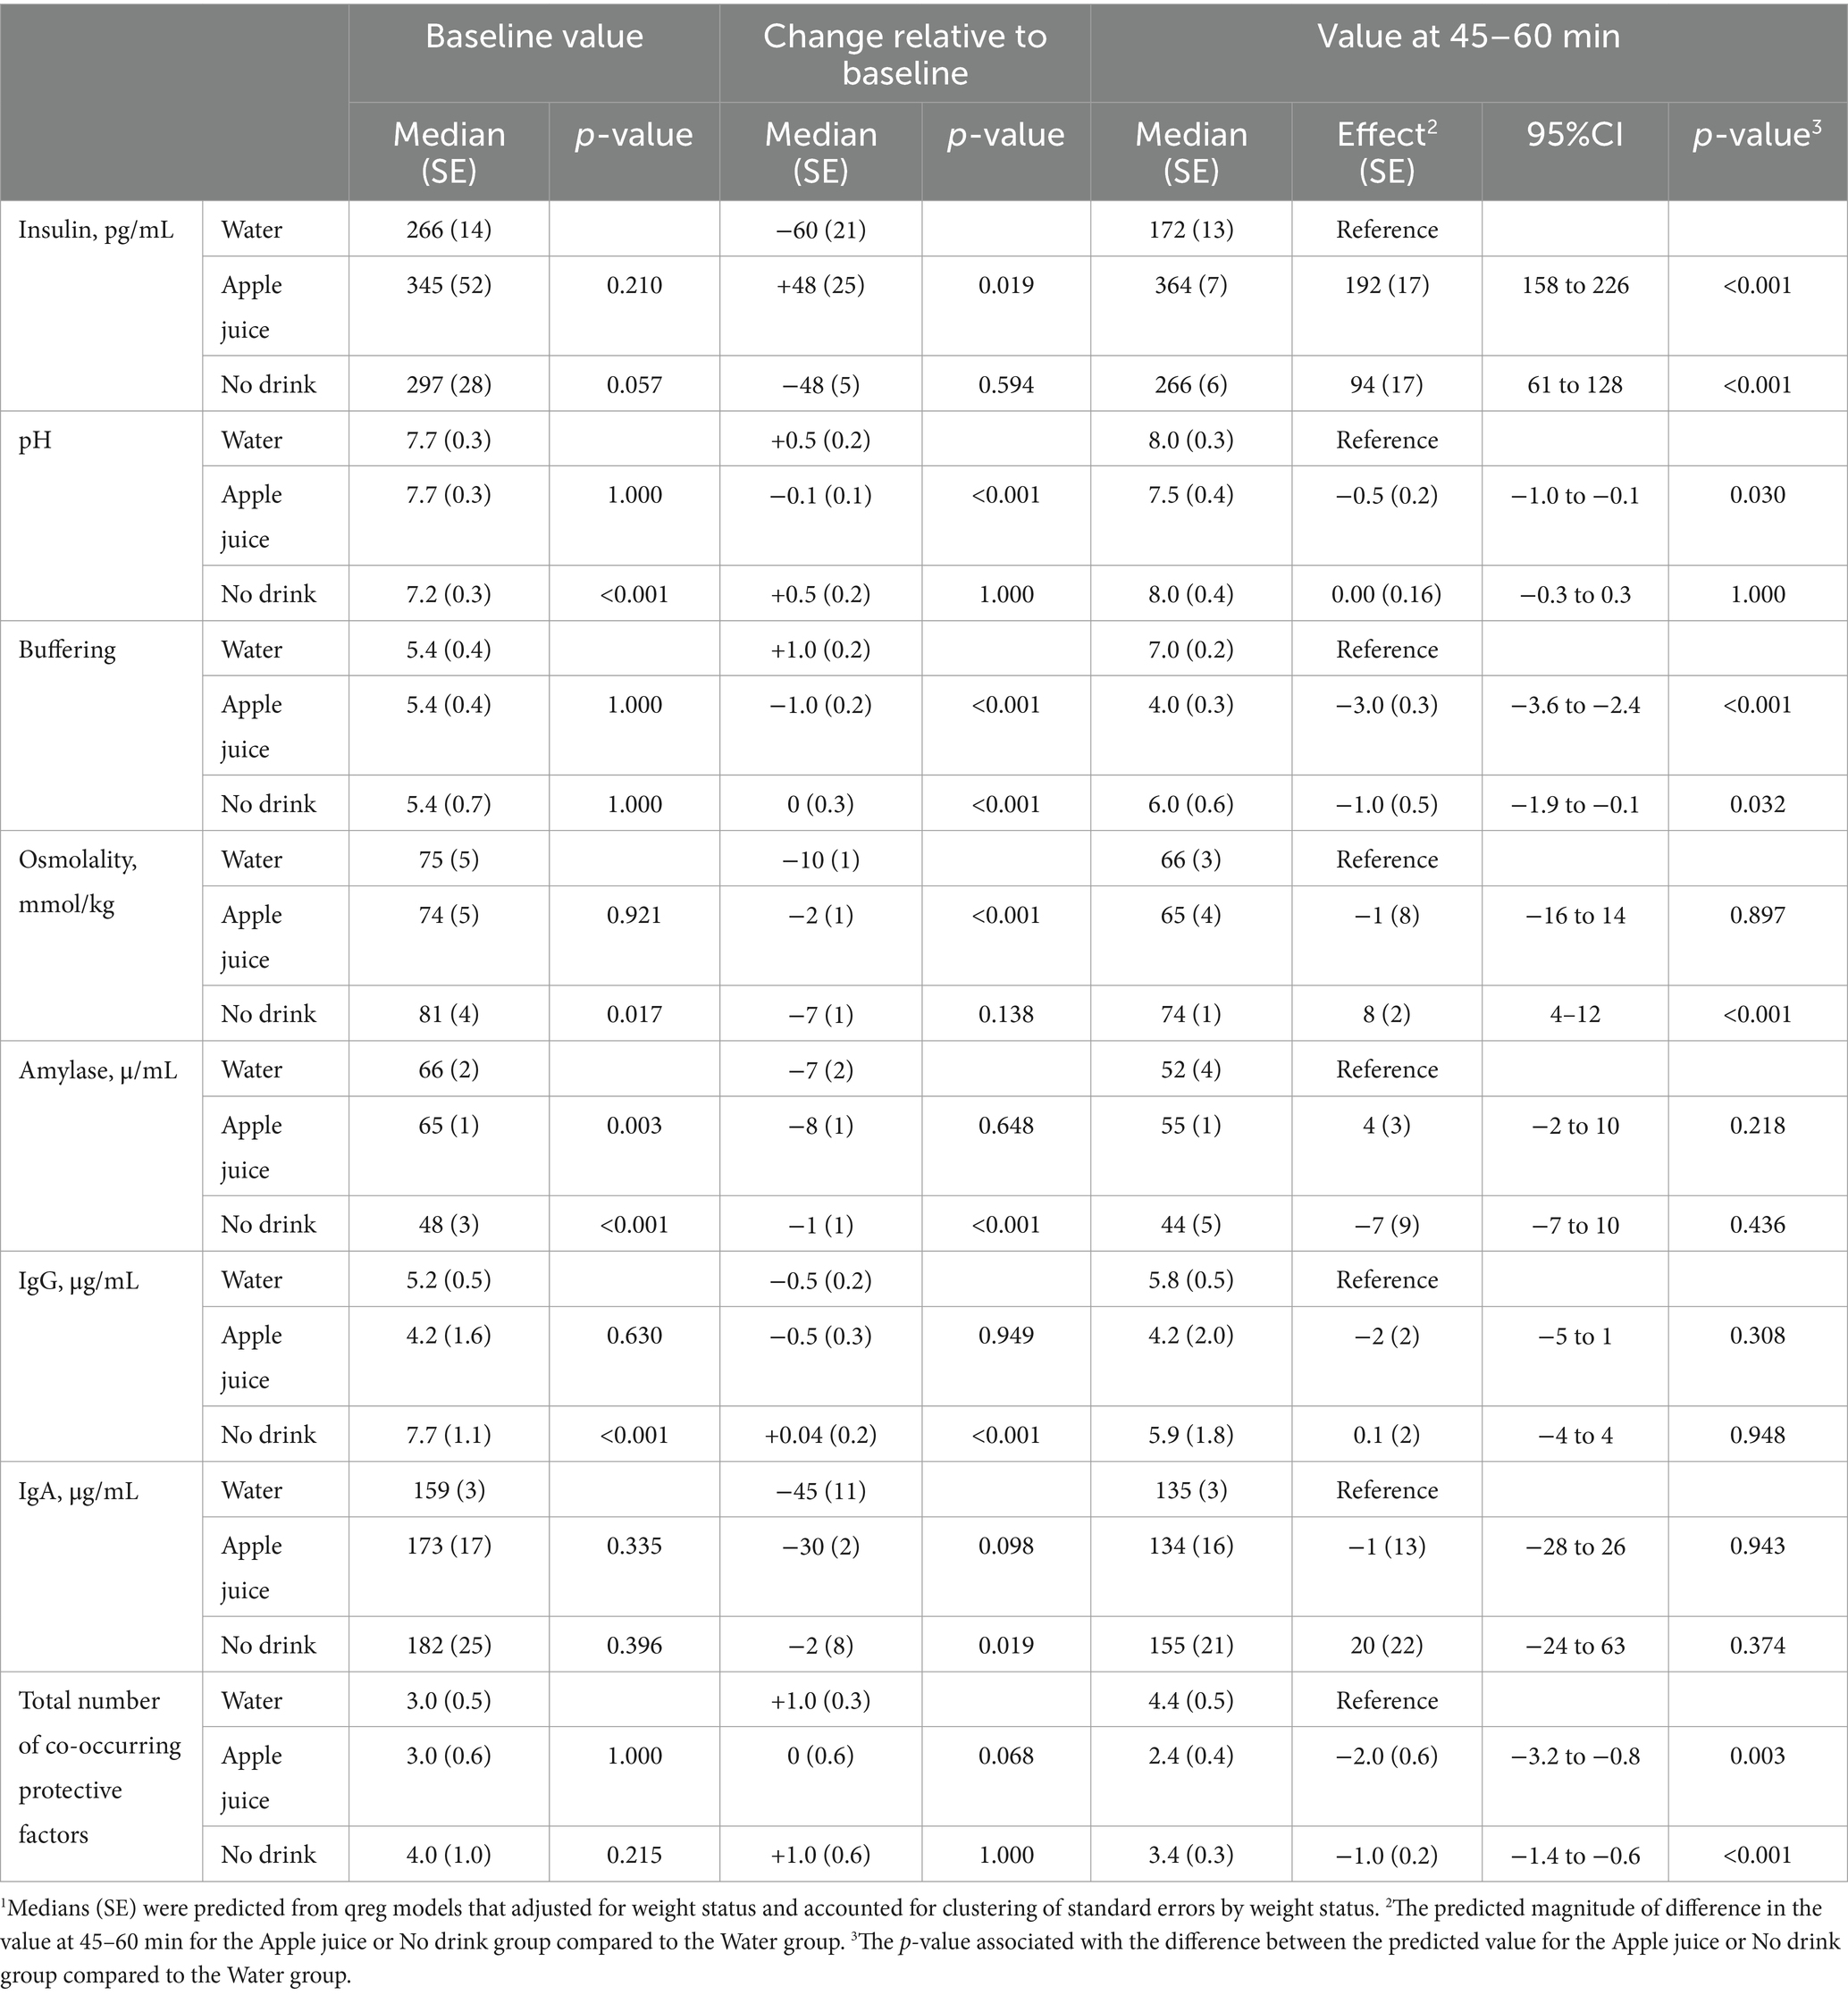
Table 2. Predicted median1 saliva factors before and after drinking water, apple juice, or no drink.
Figure 3 illustrates the level of saliva parameters observed at 45–60 min after the drink treatment. Figure 4 illustrates the distribution of protective oral health factors by drink treatment group. Without accounting for differences at baseline, the median saliva insulin was significantly lower, and the median pH, buffering, and total protective factors were significantly higher in the Water group than in the Apple juice group, with no apparent between-group difference in median saliva osmolality, alpha-amylase, IgG, or IgA (see Table 2).
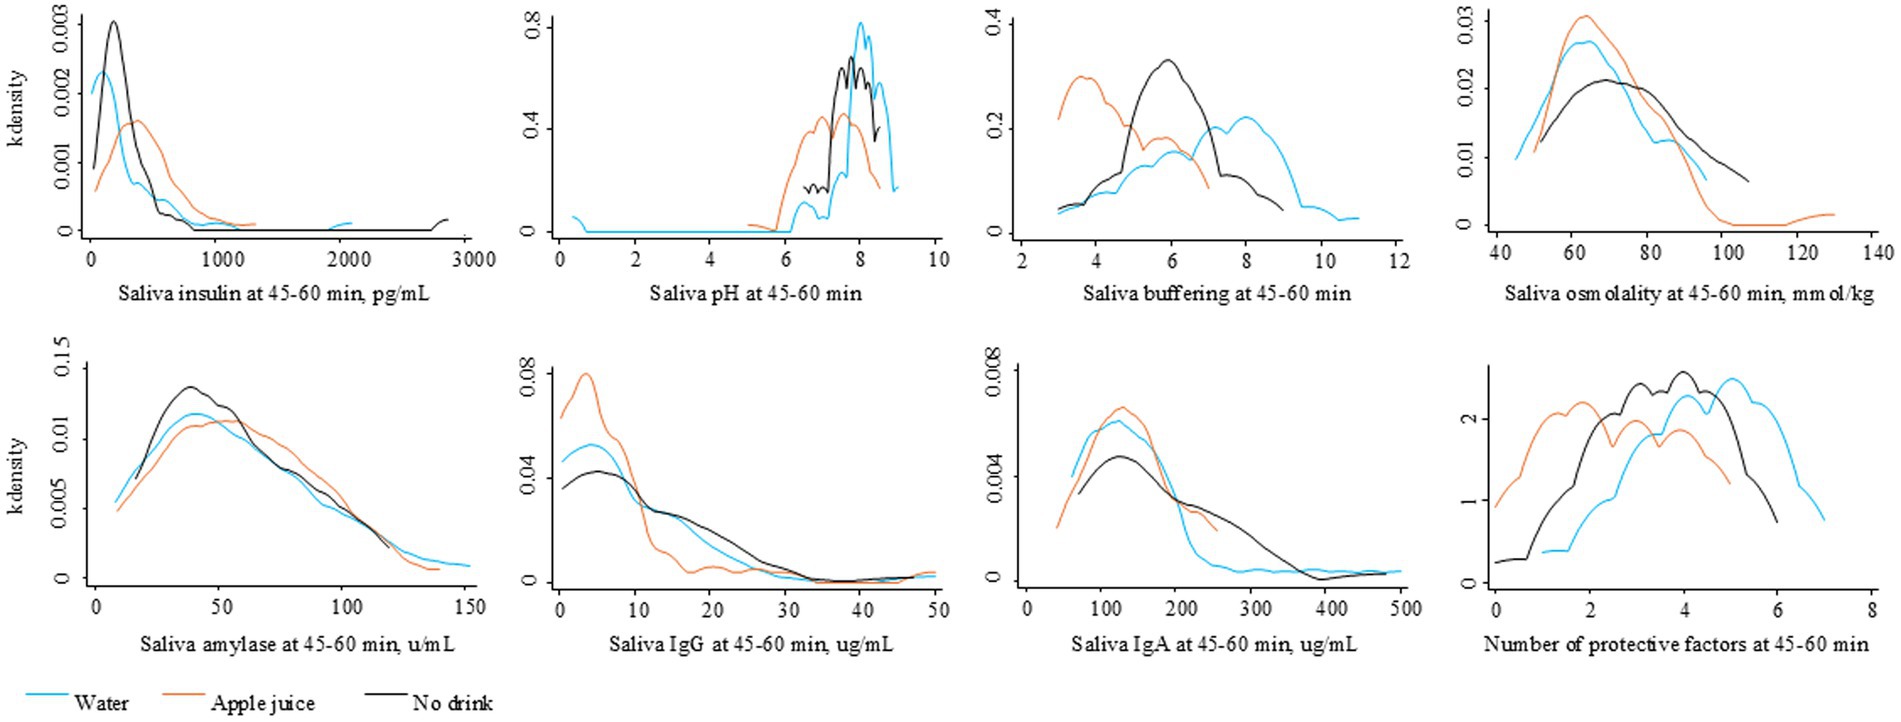
Figure 3. Distribution of saliva factors at 45–60 minutes after the randomly assigned drinking water, apple juice, or no drink.
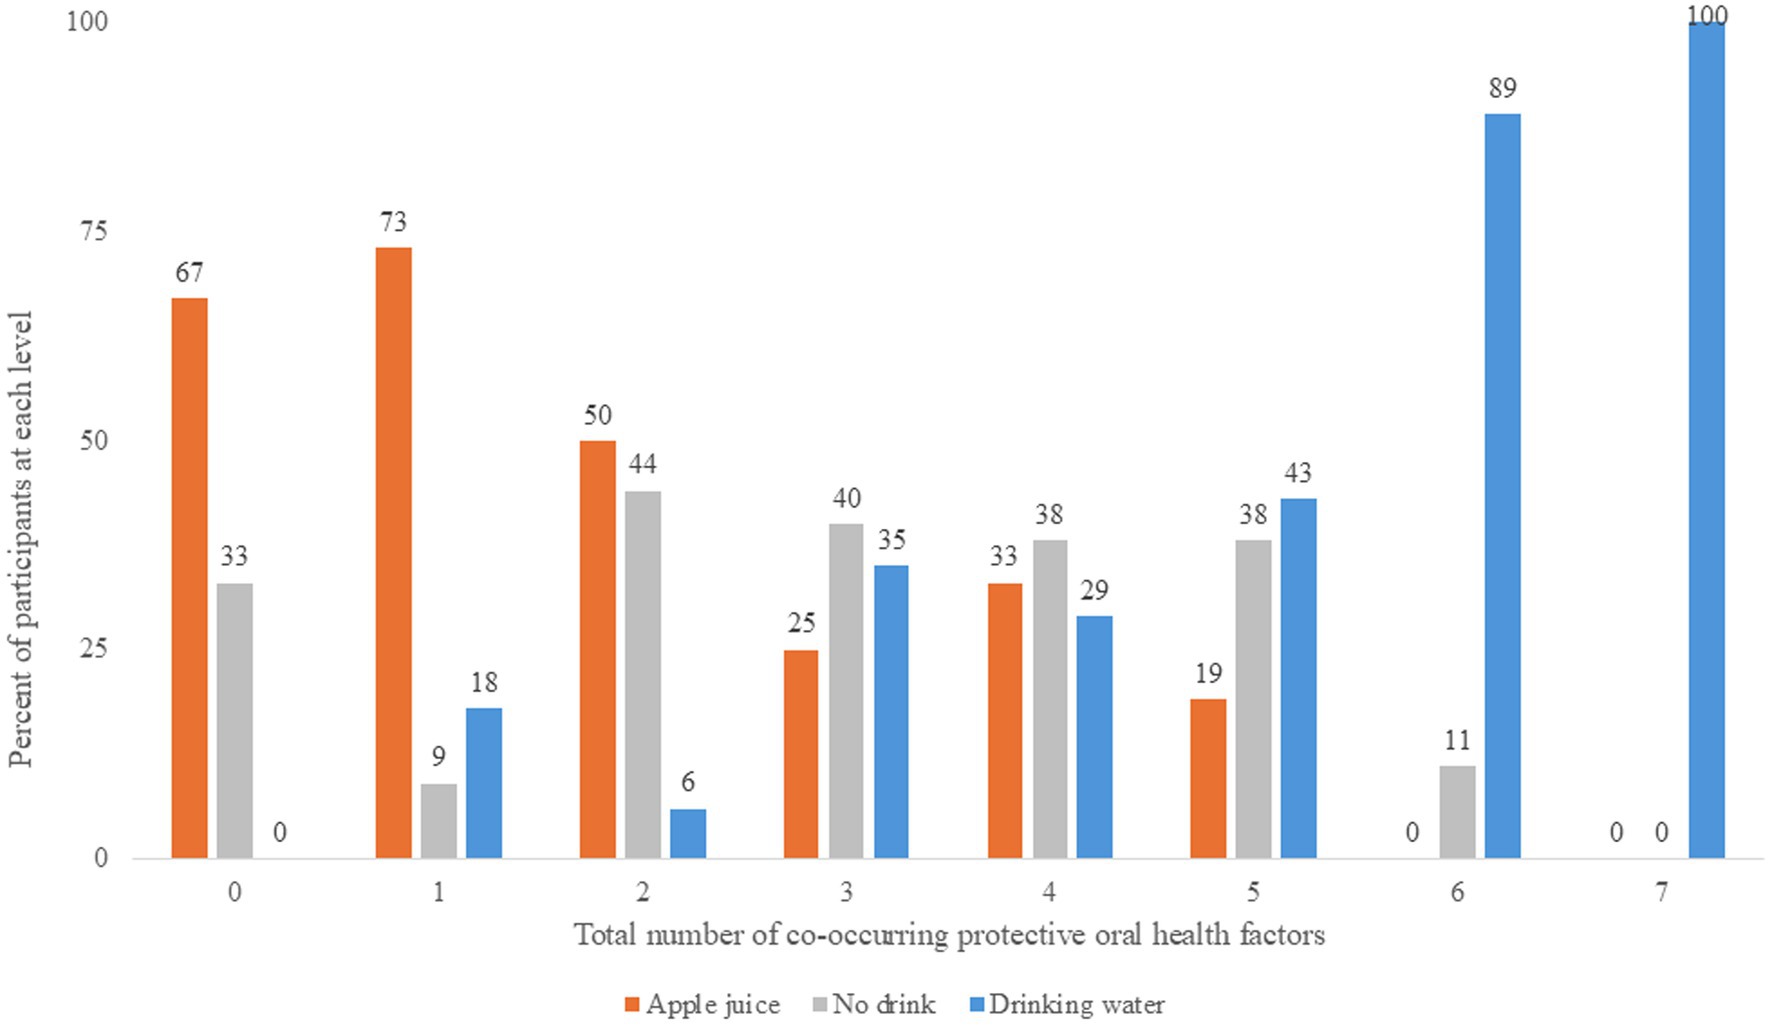
Figure 4. Number of co-occurring protective oral health factors at 45-60 minutes after the randomly assigned drinking water, apple juice, or no drink.
Table 3 describes the effects of drinking water instead of juice in terms of magnitude of effect (odds ratios, 95% confidence intervals) and statistical significance (p-values). With and without control for baseline, drinking water instead of apple juice resulted in significantly greater relative odds of saliva insulin below 170 pg/mL, pH over 7.0, buffering capacity above 5.0, and IgG over 10 μg/mL. Controlling for baseline, drinking water instead of apple juice was associated with significantly greater odds of lower saliva IgA.
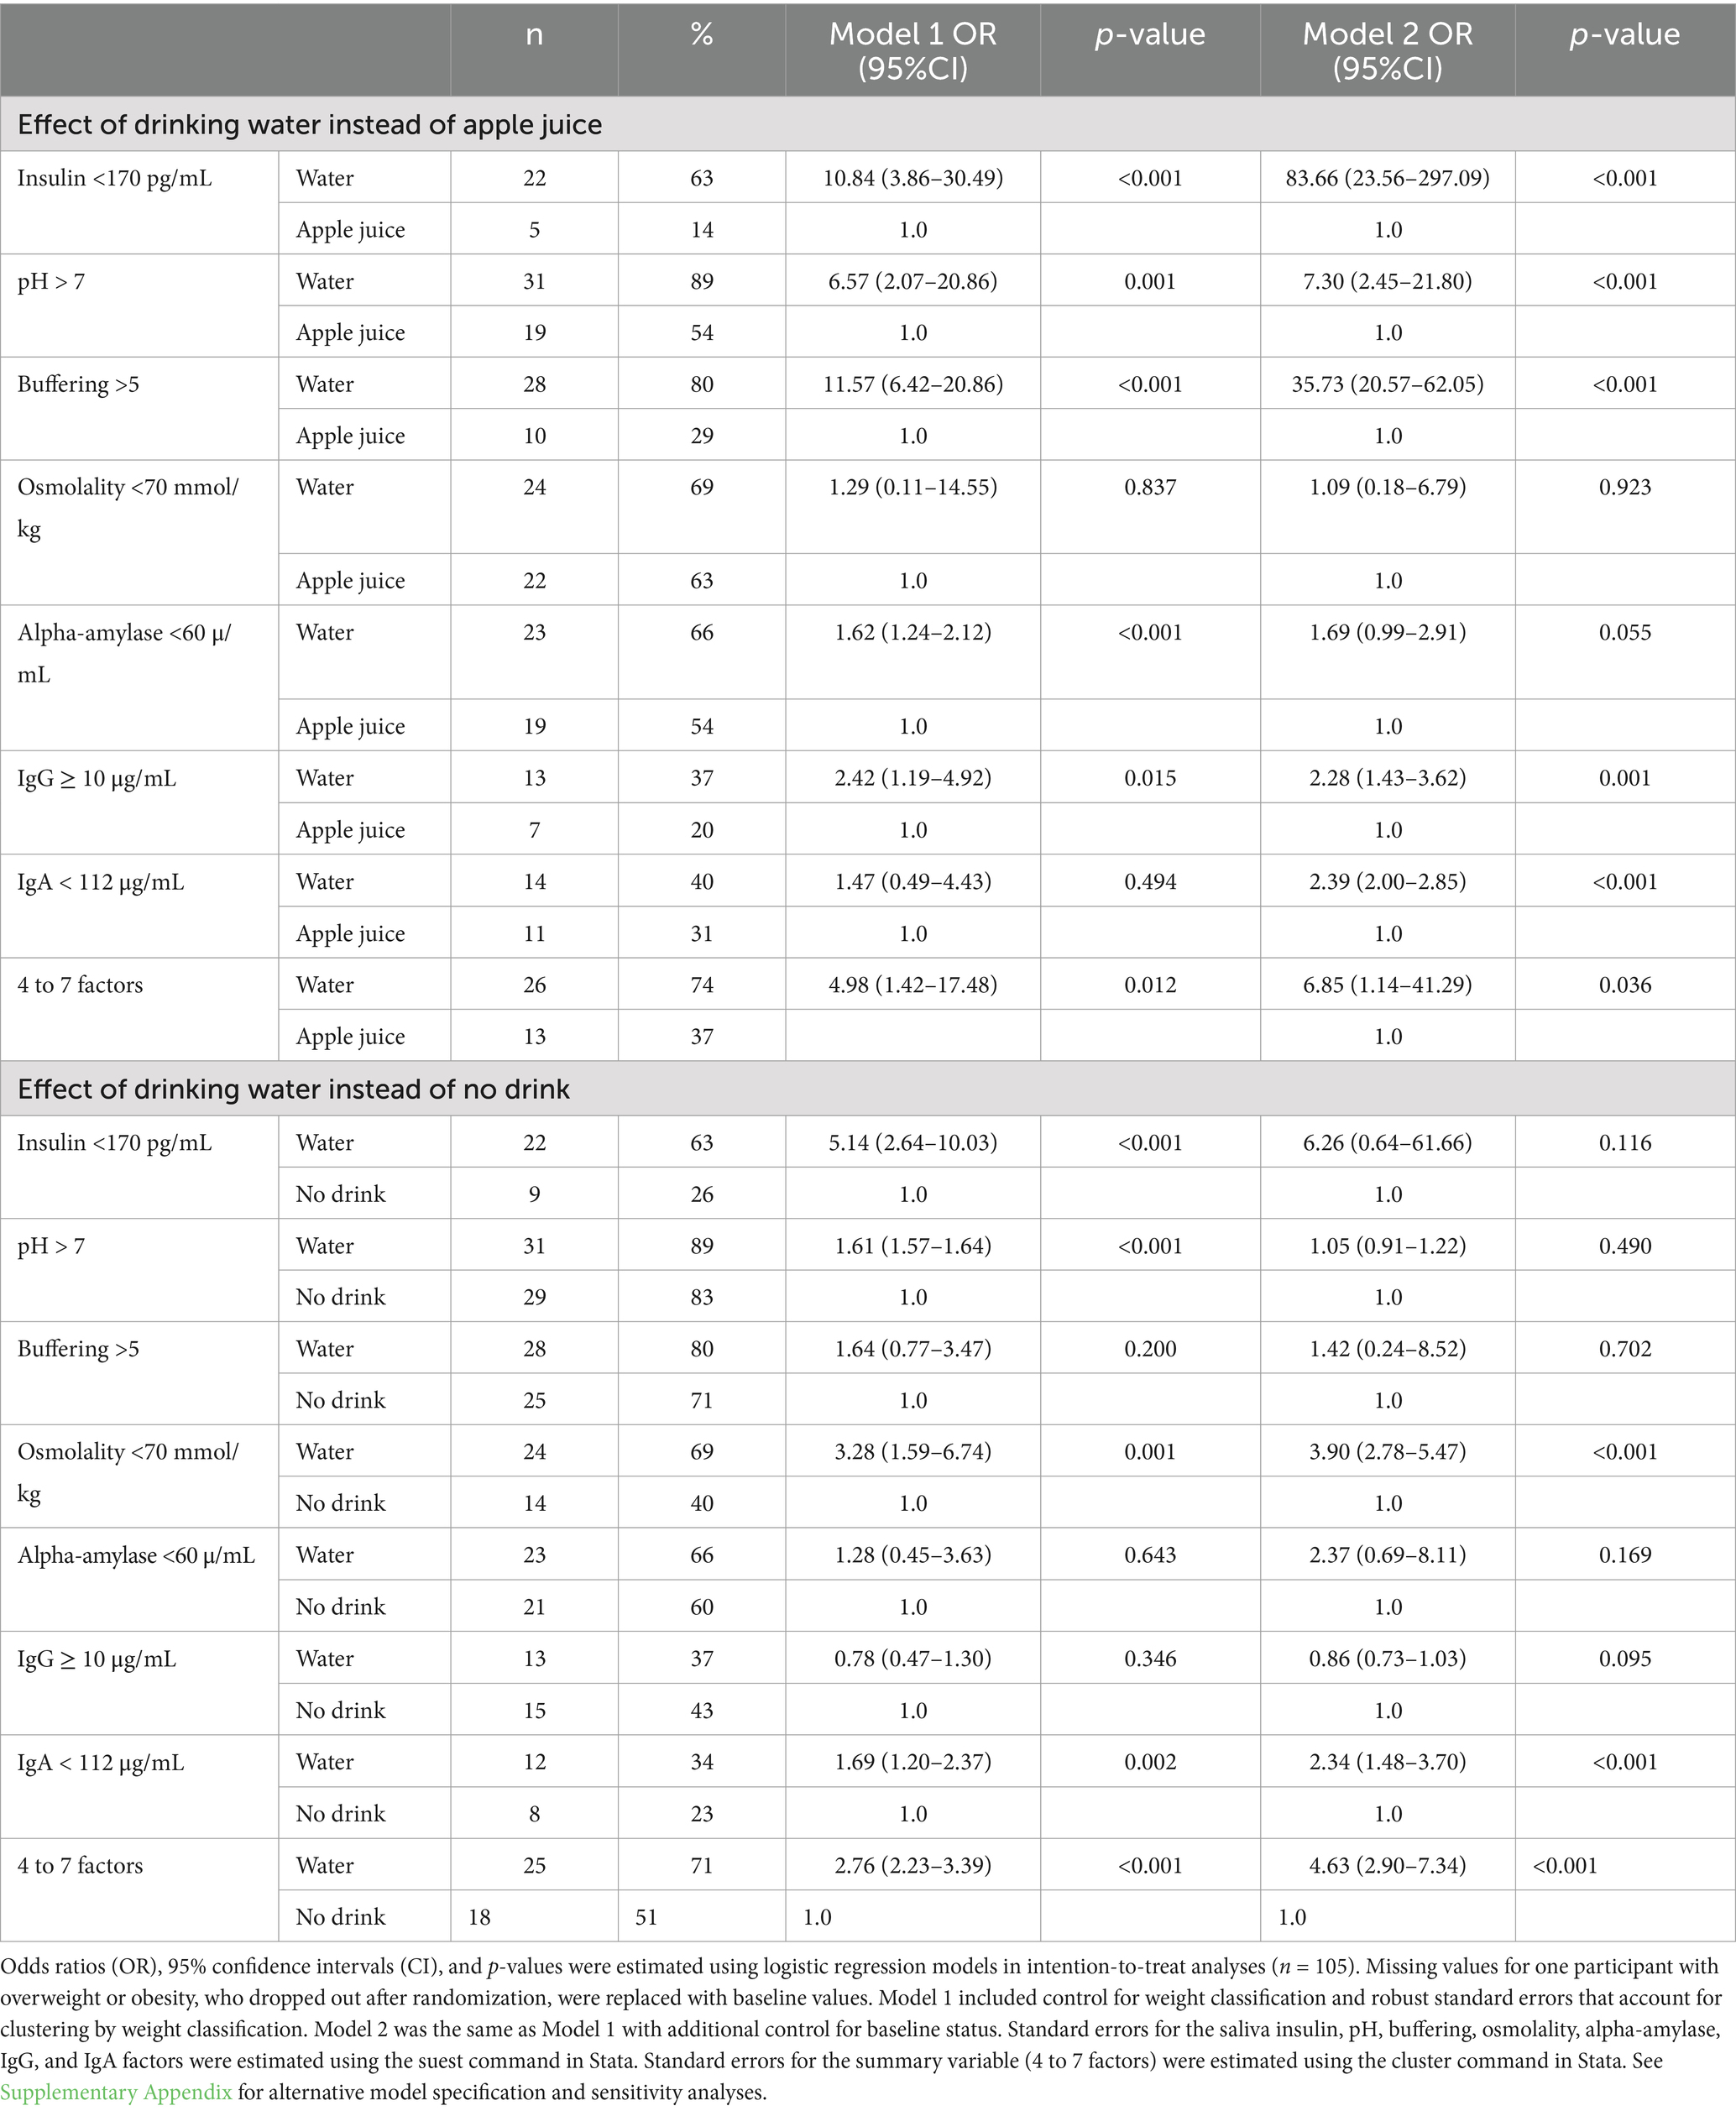
Table 3. Relative odds of saliva factors that protect against caries 45–60 min after drinking water instead of apple juice or no drink.
With and without control for baseline, the relative odds of 4 to 7 co-occurring protective factors was at least 5 times higher 45–60 min for the 35 study participants who were randomly assigned drinking water compared to the 35 participants assigned apple juice. Supplementary Appendix 3 summarizes results from the same models with reference categories switched for readers interested in the effect of drinking apple juice instead of water. The direction, magnitude, and statistical significance of effects remained essentially unchanged in sensitivity analyses with missing values for one participant replaced with the mean value for participants with overweight or obesity in the No drink group (see Supplementary Appendix 4). Magnitudes of effect in the completer analysis were within 10% of the LOCF estimates or greater than the LOCF estimates.
3.5 Effects of drinking water instead of no drink
The distribution of change in saliva parameters for the No drink group are shown in Figure 2. The No drink group experienced significantly less improvement in saliva buffering, lowering of alpha-amylase, and decreases in IgA, compared to the Water group (see Table 2). The median saliva IgG increased in the No drink group but decreased in the Water group. At 45–60 min, the median saliva insulin and osmolality were significantly lower and the median saliva buffering capacity was significantly higher in the Water group compared to the No drink group (Figure 4).
Significantly greater relative odds of saliva insulin below 170 pg/mL for the Water group compared to the No drink group (see Table 3) were explained away by control for differences in saliva insulin at baseline. With and without control for differences at baseline, drinking water instead of no drink resulted in significantly greater relative odds of saliva osmolality below 70 mmol/kg, greater relative odds of saliva IgA under 112 μg/mL, and over 2 times greater relative odds of 4 to 7 co-occurring protective risk factors (logistic regression model goodness-of-fit p-value = 0.65). Supplementary Appendix 3 summarizes results from the same models with reference categories switched for readers interested in the effect of no drink instead of water.
4 Discussion
In this RCT, random assignment to drink water instead of apple juice or no drink was significantly associated with beneficial changes in caries risk factors. The study provides information about an effective dose of drinking water, types of outcomes impacted by drinking water, and magnitudes of effect that can guide decisions and expectations about drinking water interventions in San Francisco. When combined with evidence from other studies and communities, in systematic reviews, results from this RCT may also inform drinking water recommendations and interventions by dentists and health professionals, globally.
4.1 Generalizability
The results of this study pertain to children, ages 5–10 years, who live in San Francisco, speak English, Spanish, or Chinese, and meet low-income qualifications for public insurance coverage (Denti-Cal). The study population was deliberately selected to inform school-based drinking water interventions in San Francisco, by the CavityFree SF collaborative, which includes the school district (SFUSD), Department of Public Health (SFDPH), and local dentists and pediatricians. The children who participated in this study were eligible for SFUSD and SFDPH oral health screenings and intervention services, as well as publicly subsidized CACFP-funded school meals and beverages. In SFUSD, 97% of students speak English, Spanish or Chinese. With caries experience evident in 37% of the study participants, the study population reflects the at-risk group that is prioritized for intervention by the CavityFree SF collaborative (59). Citywide in San Francisco, 34% of all SFUSD kindergarteners have caries experience (60).
In so far as one third of the study participants reported daily consumption of juice, the study population reflects children who can be expected to benefit from drinking water instead of juice. The study population also included some children who did not drink anything before arriving at the dental clinic, who could conceivably benefit from drinking water instead of no drink. It is reasonable to anticipate that school-based interventions in San Francisco will include a mix of children, some of whom are regular juice consumers and some who habitually have no drink.
4.2 Effective dose of drinking water
This study tested for absolute effects of drinking water (500 mL vs. 0 mL) as well as relative effects of drinking water instead of 100% apple juice, defined as: one standard serving (200 mL) juice box replaced by one standard water bottle (500 mL). The relative dose, which was neither isocaloric nor isovolumetric, was chosen to test for the kinds of effects that might be observed in school-based interventions, with beverage options that would likely be available to children on school days. The results suggest that if interventions target and achieve a 500 mL increase in drinking water, either as an absolute or relative effect, significant oral health benefit can be anticipated, at least over the short-term. Both the absolute and relative exposures tested were associated with statistically significant increases in factors that protect against tooth decay in the hour after drinking water.
Based on meta-analyses, drinking water interventions achieve, on average, a small mean increase in water intake of 29 mL/d (33). In the present study, a much larger volume, 500 mL, was associated with statistically significant impact with the small sample size of 105 children. While it is possible that a smaller target volume of drinking water, such as 29 mL/d, may effectively promote oral health in large population groups, with greater statistical power, a minimum threshold for effect remains to be determined. Intervention benefits may not be realized if the dose of drinking water is insufficient. Instead of reporting the daily mean or median change in drinking water, information about the number and proportion of children who consume at least 500 mL drinking water, with/without a decrease of 200 mL or more juice, may be important process measures for drinking water interventions. The categorical outcome accounts for potential thresholds of effect, as well as the non-normal distributions of drinking water and other beverages.
4.3 Significantly impacted oral health outcomes
This RCT aimed to determine if drinking water instead of apple juice or no drink caused changes in one or more oral health risk factors. Oral health risk factors, measured in saliva, were considered individually, as well as a combined set. Each risk factor was considered in categorical terms, relative to a cutoff, to account for non-normal distributions and possible threshold effects, facilitate calculation of a summary score, and enable comparison of results across studies.
The present results provide evidence to hypothesize that community-based drinking water interventions may significantly improve saliva insulin, pH, buffering, osmolality, alpha-amylase, IgG and IgA. Intervention planners looking to specify target oral health outcomes for evaluation and quality improvement purposes could track these measures. The present results do not exclude possible effects on other oral health risk factors, such as saliva flow rate, bacterial count, adhesion, or activity, or tooth mineralization, which were not measured in this study, but could be useful for understanding the mechanism(s) of effect.
The results indicate that drinking water may block several etiological paths to tooth decay, at the same time. Drinking water instead of apple juice was significantly associated with concurrent changes in saliva insulin, pH, buffering capacity, IgG and IgA. Drinking water instead of no drink was significantly associated with concurrent improvement in saliva osmolality and IgA. These results were observed on top of, or in addition to, effects of local water fluoridation, which can be expected to strengthen tooth enamel. In this RCT, drinking water reduced exposure to saliva acid precursors (carbohydrate) in the mouth, reduced insulin response, reduced saliva acid, increased buffering capacity against saliva acid, and improved hydration, which can be expected to correlate with increases in saliva flow rate. By lowering saliva alpha-amylase, decreasing saliva IgA, and increasing saliva IgG, consistent with lower insulin (61, 62), drinking water conceivably also decreased alpha-amylase breakdown of polysaccharides into sugar molecules that are substrate for acid production by bacteria, decreased IgA binding of bacteria to the tooth surface (10, 63), and increased IgG defense against bacteria. The multiple co-occurring changes warrant drinking water interventions that target change in risk factor profiles, as opposed to single risk factors. Indeed, given the many factors involved in tooth decay and the difficulty in singling out individual risk factors (17), a priori targeting of multiple factors simultaneously may be essential. Increased saliva pH, saliva buffering capacity, and saliva flow rate, together, predict decreased caries incidence (17).
4.4 Magnitudes of effect
4.4.1 Drinking water instead of apple juice
Based on the present results, and assuming midday random saliva collection, interventions that focus on replacing juice with drinking water might anticipate between-group (intervention vs. control) differences in pre-post changes of magnitude of 100 pg/mL for median insulin. In this RCT, the observed difference in median saliva insulin (172 vs. 364 pg/mL) was consistent with the two-fold difference in mean peak saliva insulin (5.7 vs. 10.8 mU/L) reported by Myette-Côté et al. (35) following a low carbohydrate meal (500 kcal, 10% carbohydrate, 65% fat, 25% protein, from whole eggs, egg whites, avocado, red peppers and onions) instead of a high carbohydrate meal (500 kcal, 55% carbohydrate, 20% fat, 25% protein, from plain rolled oats, blueberries, raspberries, strawberries, stevia sweetened whey protein isolate). The magnitude of difference in this RCT, given only the difference in test beverages, was consistent with, if not slightly larger than, the difference in mean change in saliva insulin of 60 vs. 97 pmol/L at 60 min after 500 mL drinking water instead of 500 mL orange juice with breakfast foods (460 kJ, 22 g carbohydrate from cereal with 2% milk, bagel with cream cheese) (34).
Interventions that replace apple juice with drinking water, which target change in saliva pH and/or buffering capacity, may aim for the change in median pH to differ by 0.5 and the change in median buffering capacity to differ by 2.0, between the intervention and control groups. These differences, though seemingly small, may be clinically relevant. Studies that compare healthy children with and without caries report differences in the mean pH and buffering capacity of only 0.2 and 0.4, respectively (64).
Noting that caries may develop only when risk factors fall above or below a threshold for effect, magnitudes of effect, estimated in terms of odds ratios (OR), may be clinically relevant. Interventions that increase drinking water instead of apple juice may expect large relative odds of beneficial outcomes in the drinking water group: 10 times greater odds of insulin below 170 pg/mL, 6 times greater odds of pH above 7.0, 5 times greater odds of buffering capacity above 5.0, 2 times greater odds for IgG over 10 μg/mL, and 50% greater odds of alpha-amylase under 60 μg/mL. Overall, interventions that replace juice with drinking water can aim for a 5-fold increase in 4 to 7 concurrent protective factors in saliva.
4.4.2 Drinking water instead of no drink
Based on differences observed between the Water and No drink groups, accounting for between-group differences at baseline, interventions that induce an absolute increase in drinking water of 500 mL or more may detect 3 times greater odds of midday saliva osmolality below 70 mmol/kg, 2 times greater odds of lower saliva IgA, and over 4 times greater odds of 4 to 7 concurrent protective factors. In children, saliva osmolality above 70 mmol/kg is associated with urine specific gravity over 1.020 and dehydration (44), which in turn decreases saliva flow rate (29, 65), which in turn increases risk of caries incidence in cohort studies involving children (66). Exposure of teeth to 0.25 mg/mL sIgA promotes colonization of Streptococcus mutans in mice, particularly when saliva volume is reduced (20).
4.5 Evidence base for drinking water recommendations and interventions to prevent caries
The present results add to an accumulating evidence base from RCTs that indicates beneficial effects of drinking water on oral health. Contrary to belief that any or all fluid sources are equivalent for total body hydration and health, drinking water has distinct beneficial effects. Compared to SSB, juice, sports drinks, and milk, drinking water reduces carbohydrate intake, in adults and children, at rest or during exercise (67). Compared to no drink or milk, drinking water results in more dilute saliva (68). Drinking water increases saliva pH, unlike sweetened and plain full fat milks which acutely decrease saliva pH (69). Compared to sports drinks, during or after exercise, in adults or children, drinking water increases salivary flow, pH, and buffering capacity (24–27). Regarding ongoing debate about inconsistent effects of 100% juice on oral health (32), the present RCT, in children, sides with RCTs that involved adults, which indicate that 100% orange or apple juice has significant adverse effects on oral health parameters. In the present study, drinking water beneficially impacted multiple caries risk factors at the same time.
Health authority guidance about drinking water may draw on the present results to claim multiple, simultaneously co-occurring, protective effects of drinking water on caries risk factors. The WHO currently only highlights potential for drinking water to decrease exposure to sugar intake and increase exposure to fluoride (4). The CDC describes benefits of fluoride in drinking water (5). The ADA suggests that drinking water can keep the mouth clean, avoid calories, fight dry mouth, and strengthen teeth (3). The American Academy of pediatric dentistry endorses plain drinking water (unflavored, unsweetened, uncarbonated, fluoridated drinking water) for children, primarily for exposure to fluoride, outside of meals (70).
4.6 Next steps
Information about effective dose(s) of drinking water, types of oral health factors impacted by drinking water, and potential magnitudes of effect of drinking water, can be used to motivate and tailor drinking water interventions. The information provides an evidence base for decisions about intervention value, design, implementation, education materials (explanations for what effects to expect for families, funders, and policy makers), and evaluation goals. Dentists may use the results to explain to families what happens in the mouth in the hour after drinking water, citing details about multiple risk factors impacted at the same time and the magnitude of risk factor reduction. The results highlight saliva biomarker monitoring as a non-invasive, easy, and cost-effective (71) way to track intervention process and outcomes. Saliva biomarkers can enable researchers to distinguish relative and/or absolute effects of drinking water intervention, mediated via change in carbohydrate exposure and/or hydration, as well as intervention impact on oral health risk factors.
4.7 Limitations
Although the randomized, longitudinal design supports causal inference about drinking water effects, several aspects of the study limit interpretation of the present results. Between-group differences remain a possible source of error because each individual did not have opportunity to serve as their own control. A crossover design was not possible, because the patient population was unlikely to come back to the dental clinic for additional visits, after completing their annual dental check-up.
The study eligibility criteria did not restrict the study population to any given background hydration condition or caries risk. The study aimed to generalize to children who would be reached by school-based drinking water interventions, which touch all students at school. The study population may include some children who have a low risk of caries, who would be less likely to benefit from drinking water intervention than children with high risk of caries. Future studies might focus on groups at high-risk of caries, who are most likely to benefit from intervention.
The results may pertain only to children who meet the present eligibility criteria and experience, i.e., people who access dental care from one specific dental clinic and/or have San Francisco-specific background conditions (usual diet, temperature, water composition, etc.). Although the clinic is the most important pediatric dental clinic in the health safety net system in San Francisco, to confirm generalizability of results, future studies should include patients from other dental clinics, school-based settings, and communities.
The present results are specific to three drink options: 500 mL drinking water, 200 mL 100% apple juice, or no drink. Other studies are needed to describe oral health effects of other types of beverages and other drink volumes to consider dose response effects. The drinking water tested in this study was San Francisco tap water, which may differ in mineral composition or quality from other types of drinking water (e.g., tap water in other locations, artesian/bottled, or carbonated waters). The present results are limited to the 45–60-min window after the drink treatment, and to a mid-morning or mid-afternoon condition that did not involve food intake. It remains to be determined if other smaller doses of drinking water are also effective, if the short-term effects are repeatable over time, if similar effects are observed if the drinks are consumed with food, and if chronic sustained reduction in protective factors results in caries.
Despite randomization, at baseline, the No drink group differed from the Water group with respect to insulin, pH, alpha-amylase, and the relative odds of 4 to 7 protective factors. The Apple juice group differed from the Water group with respect to alpha-amylase. To address potential confounding by differences at baseline, the effects of drinking water were estimated with, and without, control for initial status. Baseline-adjusted results are available for parameters that differed at baseline.
4.7.1 Missing data
Fewer children with overweight or obesity were enrolled than anticipated (45 instead of 60), due to time running out for the dental clinician’s residency. Although, per the stratified randomization, the proportion of study participants with overweight or obesity was the same in each study group (43%), unbalanced heterogeneity within the children with overweight or obesity (e.g., wider range of saliva insulin) may be a source of error. Weight-stratified results will be reported separately.
Missing data are a source of potential bias, though the amount of missing data was small (<1% of participants). Only one person with overweight or obesity, who was assigned to the Apple juice group, was missing data. Analyses using the last observation carried forward, which assumed no change in saliva parameters after apple juice, were expected to produce conservative estimates relative to what would have happened if the participant had consumed the 500 mL apple juice, given that juice intake is known to increase plasma insulin. Noting that some of the saliva risk factors did change for some participants in the No drink group, as opposed to staying stable over the hour, sensitivity analyses checked for consistent results with missing data replaced with the mean follow-up values for participants with overweight or obesity in the No drink group. Sensitivity analyses that included only participants with complete data were also done to check for consistent results. Similar statistical significance, magnitude, and direction of effects in the sensitivity analyses suggest negligible bias from missing data.
5 Conclusion
In healthy children ages 5–10 years, this randomized clinical trial observed significantly lower median saliva insulin 45–60 min after drinking 500 mL tap water instead of 200 mL apple juice or no drink. In addition to increasing the likelihood of normalized saliva insulin (return to fasting levels), within the hour, drinking water significantly increased the likelihood of multiple factors that protect against tooth decay. The present results indicate that drinking water interventions may efficiently reduce caries risk by simultaneously impacting 4 to 7 risk factors, at once, unlike other interventions which only address a single caries risk factor. The results warrant further work to leverage drinking water effects to promote oral health in San Francisco and communities, worldwide. Researchers and health authorities may draw on the results (in meta-analyses) to further specify and expand the list of oral health benefits of drinking water.
Data availability statement
The raw data analyzed for this study are available in the Supplementary Material. Further inquiries can be directed to the corresponding author.
Ethics statement
The protocol was reviewed and approved by the University of California San Francisco, Human Research Protection Program Institutional Review Board (#21–35500). The studies were conducted in accordance with the local legislation and institutional requirements. Written informed consent for participation in this study was provided by the participants’ legal guardians/next of kin.
Author contributions
MC: Data curation, Investigation, Writing – review & editing. RC: Data curation, Project administration, Resources, Writing – review & editing. TT: Funding acquisition, Supervision, Writing – review & editing. JS: Conceptualization, Data curation, Formal analysis, Funding acquisition, Investigation, Methodology, Project administration, Resources, Software, Supervision, Validation, Visualization, Writing – original draft, Writing – review & editing.
Funding
The author(s) declare that financial support was received for the research and/or publication of this article. This research was supported by unrestricted funding from the California Society of Pediatric Dentistry, Drinking Water Research Foundation, and UCSF CTSI Lab Grant #UL1 TR001872.
Acknowledgments
The authors gratefully acknowledge the San Francisco Public Health Foundation for grant administration. The authors thank MG for preparing random assignments in advance of the study.
Conflict of interest
The authors declare that the research was conducted in the absence of any commercial or financial relationships that could be construed as a potential conflict of interest.
Generative AI statement
The authors declare that no Gen AI was used in the creation of this manuscript.
Publisher’s note
All claims expressed in this article are solely those of the authors and do not necessarily represent those of their affiliated organizations, or those of the publisher, the editors and the reviewers. Any product that may be evaluated in this article, or claim that may be made by its manufacturer, is not guaranteed or endorsed by the publisher.
Supplementary material
The Supplementary material for this article can be found online at: https://www.frontiersin.org/articles/10.3389/fnut.2025.1561771/full#supplementary-material
Supplimentary Table 1 | Raw data from the Saliva Insulin as Biomarker of Risk Factors for Metabolic Dysregulation and Caries (SIB) randomized controlled trial.
Footnotes
References
1. World Health Organization. (2024). Oral health. Available online at: https://www.who.int/news-room/fact-sheets/detail/oral-health (Accessed January 16, 2025).
2. Centers for Disease Control and Prevention. (2024). About cavities (tooth decay). Available online at: https://www.cdc.gov/oral-health/about/cavities-tooth-decay.html (Accessed January 16, 2025).
3. American Dental Association. (2024) MouthHealthy. 4 reasons water is the best beverage for your teeth. Available online at: https://www.mouthhealthy.org/nutrition/water-best-beverage (Accessed January 16, 2025).
4. World Health Organization. (2024). Be smart drink water: a guide for school principals in restricting the Sale and Marketing of Sugary Drinks in and around schools. Available online at: https://www.who.int/publications/i/item/WPR-2016-DNH-008 (Accessed January 16, 2025).
5. Centers for Disease Control and Prevention. (2024). Oral health data systems: my water’s fluoride. Available online at: https://www.cdc.gov/oral-health-data-systems/aboutmywatersfluoride/index.html (Accessed January 16, 2025).
6. Jackson, SL, Vann, WF Jr, Kotch, JB, Pahel, BT, and Lee, JY. Impact of poor oral health on children's school attendance and performance. Am J Public Health. (2011) 101:1900–6. doi: 10.2105/AJPH.2010.200915
7. Naavaal, S, and Kelekar, U. School hours lost due to acute/unplanned dental care. Health Behav Policy Rev. (2018) 5:66–73. doi: 10.14485/HBPR.5.2.7
8. Tungare, S, and Paranjpe, AG. Diet and nutrition to prevent dental problems. (2024). Treasure Island, FL: StatPearls Publishing. Available online at: https://www.ncbi.nlm.nih.gov/books/NBK534248/
9. Stookey, GK, and Stookey, MSD. The effect of saliva on dental caries. J Am Dent Assoc. (2008) 139:11S–7S. doi: 10.14219/jada.archive.2008.0347
10. Gondivkar, SM, Gadbail, AR, Gondivkar, RS, Sarode, SC, Sarode, GS, Patil, S, et al. Nutrition and oral health. Dis Mon. (2019) 65:147–54. doi: 10.1016/j.disamonth.2018.09.009
11. Reddy, A, Norris, DF, Momeni, SS, Waldo, B, and Ruby, JD. The pH of beverages in the United States. J Am Dent Assoc. (2016) 147:255–63. doi: 10.1016/j.adaj.2015.10.019
12. Walsh, LJ. Clinical aspects of salivary biology for the dental clinician. J Min Interv Dent. (2008) 1:7–24.
13. Marcotte, H, and Lavoie, MC. Oral microbial ecology and the role of salivary immunoglobulin a. Microbiol. Mol. Biol. Rev. (1998) 62:71–109. doi: 10.1128/MMBR.62.1.71-109.1998
14. Iheozor-Ejiofor, Z, Worthington, HV, Walsh, T, O'Malley, L, Clarkson, JE, Macey, R, et al. Water fluoridation for the prevention of dental caries. Coch. Data Sys. Rev. (2015) 6:CD010856.
15. Bruvo, M, Ekstrand, K, Arvin, E, Spliid, H, Moe, D, Kirkeby, S, et al. Optimal drinking water composition for caries control in populations. J Dent Res. (2008) 87:340–3. doi: 10.1177/154405910808700407
16. Arvin, E, Bardow, A, and Spliid, H. Caries affected by calcium and fluoride in drinking water and family income. J Water Health. (2018) 16:49–56. doi: 10.2166/wh.2017.139
17. Hegde, MN, Attavar, SH, Shetty, N, Hegde, ND, and Hegde, NN. Saliva as a biomarker for dental caries: a systematic review. J. Conserv. Dent. (2019) 2:2–6. doi: 10.33309/2639-9164.020103
18. Dodds, M, Roland, S, Edgar, M, and Thornhill, M. Saliva: a review of its role in maintaining oral health and preventing dental disease. BDJ Team. (2015) 2:15123. doi: 10.1038/bdjteam.2015.123
19. Kirstilä, V, Häkkinen, P, Jentsch, H, Vilja, P, and Tenovuo, J. Longitudinal analysis of the association of human salivary antimicrobial agents with caries increment and cariogenic micro-organisms: a two-year cohort study. J Dent Res. (1998) 77:73–80. doi: 10.1177/00220345980770011101
20. Ito, T, Maeda, T, and Senpuku, H. Roles of salivary components in Streptococcus mutans colonization in a new animal model using NOD/SCID.e2f1−/− mice. PLoS One. (2012) 7:e32063. doi: 10.1371/journal.pone.0032063
21. Ladeira, LLC, Nascimento, GG, Leite, FRM, Alves-Costa, S, Barbosa, JMA, Alves, CMC, et al. Obesity, insulin resistance, caries, and periodontitis: syndemic framework. Nutrients. (2023) 15:3512. doi: 10.3390/nu15163512
22. Hao, Y, Li, S, Dong, S, and Niu, L. The association between tooth loss and insulin resistance mediated by diet quality and systemic immunoinflammatory index. Nutrients. (2023) 15:5008. doi: 10.3390/nu15235008
23. Song, IS, Han, K, Park, YM, Ji, S, Jun, SH, Ryu, JJ, et al. Severe periodontitis is associated with insulin resistance in non-abdominal obese adults. J Clin Endocrinol Metab. (2016) 101:4251–9. doi: 10.1210/jc.2016-2061
24. Tanabe, M, Takahashi, T, Shimoyama, K, Toyoshima, Y, and Ueno, T. Effects of rehydration and food consumption on salivary flow, pH, and buffering capacity in young adult volunteers during ergometer exercise. J Int Soc Sports Nutr. (2013) 10:49. doi: 10.1186/1550-2783-10-49
25. Horswill, CA, Stofan, JR, Horn, MK, Eddy, DE, and Murray, R. Effect of exercise and fluid consumption on salivary flow and pH. Int J Sports Med. (2006) 27:500–4. doi: 10.1055/s-2005-865779
26. Angelopoulou, MV, Malak-Santaga, A, Agouropoulos, A, and Gonzalez, CD. Sports drinks effect on salivary volume and pH in children after exercise: a randomized clinical study. J Sports Med Phys Fitness. (2023) 63:977–81. doi: 10.23736/S0022-4707.23.14953-X
27. Tanabe-Ikegawa, M, Takahashi, T, Churei, H, Mitsuyama, A, and Ueno, T. Interactive effect of rehydration with diluted sports drink and water gargling on salivary flow, pH, and buffering capacity during ergometer exercise in young adult volunteers. J Oral Sci. (2018) 60:269–77. doi: 10.2334/josnusd.17-0183
28. Ship, JA, and Fischer, DJ. The relationship between dehydration and parotid salivary gland function in young and older healthy adults. J Gerontol Biol Sci Med Sci. (1997) 52A:M310–9. doi: 10.1093/gerona/52a.5.m310
29. Walsh, NP, Montague, JC, Callow, N, and Rowlands, AV. Saliva flow rate, total protein concentration, and osmolality as potential markers of whole body hydration status during progressive acute dehydration in humans. Arch Oral Biol. (2004) 49:149–54. doi: 10.1016/j.archoralbio.2003.08.001
30. Fortes, MB, Diment, BC, Di Felice, U, and Walsh, NP. Dehydration decreases saliva antimicrobial proteins important for mucosal immunity. Appl Physiol Nutr Metabol. (2012) 37:850–9. doi: 10.1139/h2012-054
31. Killer, SC, Svendsen, IS, and Gleeson, M. The influence of hydration status during prolonged endurance exercise on salivary antimicrobial proteins. Eur J Appl Physiol. (2015) 115:1887–95. doi: 10.1007/s00421-015-3173-1
32. Liska, D, Kelley, M, and Mah, E. 100% fruit juice and dental health: a systematic review of the literature. Front Public Health. (2019) 7:190. doi: 10.3389/fpubh.2019.00190
33. Franse, CB, Boelens, M, Fries, LR, Constant, F, van Grieken, A, and Raat, H. Interventions to increase the consumption of water among children: a systematic review and meta-analysis. Obes Rev. (2020) 21:e13015. doi: 10.1111/obr.13015
34. Stookey, JD, Hamer, J, Espinoza, G, Higa, A, Ng, V, Tinajero-Deck, L, et al. Orange juice limits postprandial fat oxidation after breakfast in normal-weight adolescents and adults. Adv Nutr. (2012) 3:629S–35S. doi: 10.3945/an.112.001990
35. Myette-Côté, É, Baba, K, Brar, R, and Little, JP. Detection of salivary insulin following low versus high carbohydrate meals in humans. Nutrients. (2017) 9:1204. doi: 10.3390/nu9111204
36. Centers for Disease Control and Prevention. (2024). BMI, child and teen BMI categories. Available online at: https://www.cdc.gov/bmi/child-teen-calculator/bmi-categories.html (Accessed January 16, 2025).
37. Abdul-Ghani, M, and DeFronzo, RA. Fasting hyperinsulinemia and obesity: cause or effect. J Clin Endocrinol Metab. (2023) 108:e1151–2. doi: 10.1210/clinem/dgad118
38. San Francisco Water Power Sewer. Annual water quality report. (2022). Available online at: https://www.sfpuc.gov/sites/default/files/documents/SF_WaterQualityReport_CY2022.pdf (Accessed March 28, 2025).
39. Decker, P. (2012). San Francisco unified School District (SFUSD) news. SF schools pushing kids to drink more tap water. Bay City News. Available online at: http://blog.sfusd.edu/2012/01/sf-schools-pushing-kids-to-drink-more.html (Accessed January 16, 2025).
40. Hayes, T. (2022). Buying a school water bottle with help from a 9-year old. Newsweek. Available online at: https://www.newsweek.com/buying-school-water-bottle-help-9-year-old-1704040 (Accessed January 2, 2025).
41. Texas Department of Agriculture, Food and Nutrition Division, School Breakfast Program. (2023). Square meals NSLP helper sheets, level up with school lunch and school breakfast, 2023-2024. Available online at: https://squaremeals.org/Portals/8/files/Test/PY%202023-24%20NSLP%20Helper%20Sheets.pdf (Accessed January 16, 2025).
42. Baliga, S, Muglikar, S, and Kale, R. Salivary pH: a diagnostic biomarker. J. Indian Soc. Periodontol. (2013) 17:461–5. doi: 10.4103/0972-124X.118317
43. Bechir, F, Pacurar, M, Tohati, A, and Bataga, SM. Comparative study of salivary pH, buffer capacity, and flow in patients with and without gastroesophageal reflux disease. Int J Environ Res Public Health. (2021) 19:201. doi: 10.3390/ijerph19010201
44. Faidah, N, Soraya, GV, Erlichster, M, Natzir, R, Chana, G, Skafidas, E, et al. Detection of voluntary dehydration in pediatric populations using non-invasive point-of-care saliva and urine testing. J. Ped. Child. Health. (2021) 57:813–8. doi: 10.1111/jpc.15325
45. Ahmad, P, Hussain, A, Carrasco-Labra, A, and Siqueira, WL. Salivary proteins as dental caries biomarkers: a systematic review. Caries Res. (2022) 56:385–98. doi: 10.1159/000526942
46. Singh, S, Sharm, A, Sood, PB, Sood, A, Zaidi, I, Sinha, A, et al. Saliva as a prediction tool for dental caries: an in vivo study. J. Oral. Biol. Craniofacial. Res. (2015) 5:59–64. doi: 10.1016/j.jobcr.2015.05.001
47. Rodriguez-Segade, S, Camiña, MF, Carnero, A, Lorenzo, MJ, Alban, A, Quinteiro, C, et al. High serum IgA concentrations in patients with diabetes mellitus: age wise distribution and relation to chronic complications. Clin Chem. (1996) 42:1064–7. doi: 10.1093/clinchem/42.7.1064
48. de Farias, DG, and Bezerra, AC. Salivary antibodies, amylase, and protein from children with early childhood caries. Clin. Oral Invest. (2003) 7:154–7. doi: 10.1007/s00784-003-0222-7
49. Centers for Disease Control and Prevention, National Center for Health Statistics. National Health and Nutrition Examination Survey, 2015-2016. Data documentation, codebook, and frequencies, fasting questionnaire (FASTQX_I). Available online at: https://wwwn.cdc.gov/Nchs/Data/Nhanes/Public/2015/DataFiles/FASTQX_I.htm (Accessed January 2, 2025).
50. Centers for Disease Control and Prevention, National Center for Health Statistics. National health and nutrition examination survey, 2017-2018 questionnaire variable list. Available online at: https://wwwn.cdc.gov/nchs/nhanes/search/variablelist.aspx?Component=Questionnaire&Cycle=2017-2018 (Accessed January 2, 2025).
51. Onufrak, SJ, Park, S, Sharkey, JR, and Sherry, B. The relationship of perceptions of tap water safety with intake of sugar-sweetened beverages and plain water among US adults. Public Health Nutr. (2014) 17:179–85. doi: 10.1017/S1368980012004600
52. Koleilat, M, and Whaley, SE. Reliability and validity of food frequency questions to assess beverage and food group intakes among low-income 2-to 4-year-old children. J. Acad. Nutr. Diet. (2016) 116:931–9. doi: 10.1016/j.jand.2016.02.014
53. Davis Research LLC. (2017). Los Angeles County WIC survey, WIC parents questionnaire. Available online at: https://lawicdata.org/wp-content/uploads/2020/12/2017-WIC-Parents-Quex-English-FINAL.pdf (Accessed January 2, 2025).
54. Centers for Disease Control and Prevention. (2012). Physical activity in U.S. youth aged 12–15 years. NCHS data brief no. 141. Available online at: https://www.cdc.gov/nchs/products/databriefs/db141.htm (Accessed January 10, 2025).
55. US Department of Health and Human Services. (2018). Physical activity guidelines for Americans, 2nd ed. Washington, DC: US Department of Health and Human Services. Available online at: https://health.gov/sites/default/files/2019-09/Physical_Activity_Guidelines_2nd_edition.pdf (Accessed January 13, 2025).
56. UCLA Center for Health Policy Research. (2020). California health interview survey: survey topics and questionnaires. Available online at: https://healthpolicy.ucla.edu/our-work/california-health-interview-survey-chis/chis-design-and-methods/survey-topics-and-questionnaires (Accessed January 13, 2025).
57. American Dental Association. (2023). Caries risk assessment and management. Available online at: https://www.ada.org/resources/ada-library/oral-health-topics/caries-risk-assessment-and-management (Accessed January 16, 2025).
58. US Department of Health and Human Services. (2020). Healthy people 2030. Reduce the proportion of children and adolescents with lifetime tooth decay – OH-01, data methodology and measurement. Available online at: https://odphp.health.gov/healthypeople/objectives-and-data/browse-objectives/oral-conditions/reduce-proportion-children-and-adolescents-lifetime-tooth-decay-oh-01/data-methodology (Accessed January 16, 2025).
59. CavityFreeSF. (2019). San Francisco children’s oral health strategic plan 2020-2025. Available online at: https://www.sf.gov/sites/default/files/2024-08/CavityFreeSF%20Strategic%20Plan_Final_2019.pdf (Accessed January 16, 2025).
60. San Francisco Department of Public Health, Maternal, Child and Adolescent Health. (2023). San Francisco children’s oral health disparities, CavityFree SF strategic plan indicators 2015-2022. Available online at: https://www.sf.gov/sites/default/files/2023-10/oral%20health%20CavityFree%20SF%20Strategic%20Plan%20Indicators%20MCAH%202015-2022%20Data%20Brief%20FINAL%20August%202023%20.cleaned.pdf (Accessed January 16, 2025).
61. Ahmadi-Motamayel, F, Davoodi, P, Dalband, M, and Hendi, SS. Saliva as a mirror of the body health. Avic J Dent Res. (2010) 2:41–55.
62. Moore, PA, Guggenheimer, J, Etzel, KR, Weyant, RJ, and Orchard, T. Type 1 diabetes mellitus, xerostomia, and salivary flow rates. Oral Surg Oral Med Oral Pathol Oral Radiol Endodontol. (2001) 92:281–91. doi: 10.1067/moe.2001.117815
63. Scannapieco, FA, Torres, G, and Levine, MJ. Salivary α-amylase: role in dental plaque and caries formation. Crit Rev Oral Biol Med. (1993) 4:301–7. doi: 10.1177/10454411930040030701
64. Rajendra, RE, Srikanth, S, Kiranmayi, M, Swathi, SP, Dutta, LD, and Kumar, A. Evaluation of flow rate, pH, and buffering capacity of saliva in children with caries, fluorosis, and caries with fluorosis. Int J Clin Pediatr Dent. (2023) 16:587–90. doi: 10.5005/jp-journals-10005-2645
65. Oliver, SJ, Laing, SJ, Wilson, S, Bilzon, JL, and Walsh, NP. Saliva indices track hypohydration during 48h of fluid restriction or combined fluid and energy restriction. Arch Oral Biol. (2008) 53:975–80. doi: 10.1016/j.archoralbio.2008.05.002
66. Dos Santos, LA, Siqueira, WL, Solon-de-Mello, M, Masterson, D, Freitas-Fernandes, LB, Valente, AP, et al. A critical review on the association of hyposalivation and dental caries in children and adolescents. Arch Oral Biol. (2022) 144:105545. doi: 10.1016/j.archoralbio.2022.105545
67. Stookey, J. Negative, null and beneficial effects of drinking water on energy intake, energy expenditure, fat oxidation and weight change in randomized trials: a qualitative review. Nutrients. (2016) 8:19. doi: 10.3390/nu8010019
68. Aragón-Vargas, LF, Garzón-Mosquera, JC, and Montoya-Arroyo, JA. Voluntary hydration with skimmed lactose-free Milk during exercise in the heat: exploring effectiveness and tolerance. Nutrients. (2023) 15. doi: 10.3390/nu15092069
69. Zamzam, R, Karkoutly, M, and Bshara, N. Effect of various types of milk on salivary pH among children: a pilot randomized controlled crossover trial. BDJ Open. (2023) 9:44. doi: 10.1038/s41405-023-00170-8
70. American Academy of Pediatric Dentistry. (2021). Healthy beverage consumption in early childhood: recommendations from key national health and nutrition organizations: summary of oral health considerations. The reference manual of pediatric dentistry. Chicago, IL: American Academy of Pediatric Dentistry; 565–568.
71. Nunes, LA, Mussavira, S, and Bindhu, OS. Clinical and diagnostic utility of saliva as a non-invasive diagnostic fluid: a systematic review. Biochem Med. (2015) 25:177–92. doi: 10.11613/BM.2015.018
Glossary
ADA - American Dental Association
AJ - Apple juice
BMI - Body mass index
CACFP - Child and Adult Care Food Program
CDC - United States Centers for Disease Control
CI - Confidence interval
CONSORT - Consolidated Standards of Reporting Trails
DMFT - decayed, missing, and filled teeth
EPIC - Epic systems corporation software proprietary electronic medical record software produced by Epic Systems Corporation
LOCF - Last observation carried forward
IgG - Immunoglobin G
IgA - Immunoglobin A
ND - No drink
NHANES - National Health and Nutrition Examination Survey
OR - Odds ratio
pH - Potential of hydrogen
Qreg - Quantile regression
SF - San Francisco
SFDPH - San Francisco Department of Public Health
SFUSD - San Francisco Unified School District
SSB - Sugar sweetened beverages
USDA - United States Department of Agriculture
W - Water
WHO - World Health Organization
WIC - Women Infants and Children
Keywords: drinking water, oral health, caries risk factors, saliva insulin, saliva osmolality, saliva pH, saliva buffering, children
Citation: Cholera M, Cape R, Tanbonliong T and Stookey JD (2025) Drinking water instead of apple juice or no drink results in greater odds of 4 to 7 co-occurring protective oral health factors within the hour. Front. Nutr. 12:1561771. doi: 10.3389/fnut.2025.1561771
Edited by:
Navneet Kumar, National Academy of Agricultural Research Management (ICAR), IndiaReviewed by:
Pratik Nayi, National Pingtung University of Science and Technology, TaiwanAsma Ansari, Dow University of Health Sciences, Pakistan
Copyright © 2025 Cholera, Cape, Tanbonliong and Stookey. This is an open-access article distributed under the terms of the Creative Commons Attribution License (CC BY). The use, distribution or reproduction in other forums is permitted, provided the original author(s) and the copyright owner(s) are credited and that the original publication in this journal is cited, in accordance with accepted academic practice. No use, distribution or reproduction is permitted which does not comply with these terms.
*Correspondence: Jodi D. Stookey, am9kaS5zdG9va2V5QHNmZHBoLm9yZw==