Abstract
Background:
The Dietary Index for Gut Microbiota (DI-GM), a newly introduced metric, indicates gut microbiota diversity. However, its correlation with frailty remains unexplored.
Method:
A total of 25,320 individuals were included in the 2007–2020 National Health and Nutrition Examination Survey (NHANES). Dietary recall data were calculated by averaging intake values from two separate 24-h dietary recall interviews. Frailty was assessed using the 49-item frailty index. The relationship between DI-GM and the frailty phenomenon was examined by applying a weighted logistic regression model. A comprehensive sensitivity analysis was undertaken, incorporating restricted cubic splines for modeling non-linear effects, stratified subgroup analyses to explore effect modification, and multiple imputation techniques to address potential missing data concerns.
Results:
Higher DI-GM scores and gut microbiota-beneficial dietary components were significantly associated with reduced prevalence of frailty (Frailty Index: OR = 0.987, 95% CI: 0.977–0.997, P = 0.014; Frailty: OR = 0.941, 95% CI: 0.902–0.980, P = 0.004). Restricted cubic spline analysis revealed a non-linear relationship between DI-GM and frailty. Body Mass Index (BMI) mediated this relationship, accounting for 17.57% of the association.
Conclusion:
We concluded that a higher DI-GM score is associated with a lower risk of frailty, partly via BMI mediation. Future research should validate these findings using longitudinal studies.
Introduction
Frailty is a physical condition caused by the accumulation of age-related deficits, characterized by reduced physiological reserves and loss of resistance to stressors. Frailty is a complex and multi-dimensional concept, which is not limited to physical decline, but also includes cognitive, emotional, social function, and other aspects of decline, the core of which all point to an individual’s increased vulnerability in performing daily activities. Frailty is particularly prevalent among older people and significantly impacts their mobility, daily life activities, and overall quality of life (1). Studies have found that frailty is closely related to a variety of adverse health outcomes (such as falls, hospitalization, disability, death, and dementia) (1, 2). Furthermore, it has been confirmed to be a predictor of mortality, catastrophic health expenditure, postoperative adverse outcomes, and adverse outcomes of chronic diseases (3–7). Moreover, frailty is often accompanied by other chronic conditions, such as diabetes, hypertension, and cardiovascular disease, which further complicate an individual’s health status (8–11). Therefore, identifying and managing frailty is crucial for promoting healthy aging and improving the quality of life among older people.
In addition to frailty’s multifaceted impacts, emerging research has highlighted the significant role of the gut microbiota in human health. The gut microbiota, a complex and diverse community of microorganisms residing in the human gastrointestinal tract, plays a crucial role in various physiological processes, influencing nutrient provision, metabolic processes, antibacterial effects, immune regulation, the brain-gut axis, and cardiovascular health (12–18). Additionally, recent studies have shown that the gut microbiota can influence the human’s response to diet and exercise, affecting weight loss and muscle growth (19) and may potentially slow the aging process and extend lifespan (20). Research indicates a close association between alterations in the gut microbiota and chronic low-grade inflammation. Dysbiosis, or an imbalance in the gut microbiota, can compromise intestinal barrier function, allowing harmful substances such as lipopolysaccharide (LPS) to enter the systemic circulation (21, 22). This chronic inflammation is a core characteristic of frailty, accelerating cellular aging, impairing metabolic function, and diminishing the body’s ability to cope with stressors (23, 24).
Studies suggest that both short-term and long-term dietary habits can alter the gut microbiota’s composi-tion and function, profoundly impacting human health (25, 26). To further explore the connection between diet and gut microbiota, Bezawit E. Kase and colleagues developed the Gut Microbiota Dietary Index (DI-GM) based on a com-prehensive review of 106 studies. The DI-GM is designed to assess the quality of diet concerning maintaining a healthy gut microbiota. It is calculated using data from dietary intake surveys, such as those conducted in the NHANES study, with scores ranging from 0 to 13. Higher scores indicate a more favorable diet for gut microbiota health.
The DI-GM is based on 14 dietary components identified as beneficial or detrimental to gut microbiota. Beneficial components include avocado, broccoli, chickpeas, coffee, cranberries, fermented dairy, fiber, green tea, soy, and whole grains, while detrimental components include red meat, processed meat, refined grains, and high-fat diets. The final DI-GM score reflects the overall balance of these dietary components, with higher scores indicating a healthier diet for gut microbiota. Although previous studies have linked DI-GM to health outcomes such as depression (27) and metabolic syndrome (28, 29), no research has yet explored the relationship between DI-GM and frailty, as well as the mediating role of BMI in this association. To date, there are no studies on the effects of DIGM-mediated BMI on frailty, and our study fills this gap.
This study aims to examine the relationship between DI-GM and frailty using na-tionally representative NHANES data, while also investigating the potential mediating role of BMI in this relationship.
Materials and methods
Data sources
The study utilized data acquired from the National Health and Nutrition Examination Survey (NHANES), a valuable cross-sectional survey conducted by the Centers for Disease Control and Prevention (CDC). NHANES employs a nationally representative, complex, multi-stage probability sampling design to comprehensively evaluate the health and nutritional status of adults and children in the United States. The NHANES study protocol received approval from the Research Ethics Review Board of the National Centre for Health Statistics (Continuation of Protocol #2005-06, Protocol #2011-17), Continuation of Protocol #2011-17, Protocol #2018-01 Effective beginning October 26, 2017). All participants provided written informed consent, ensuring compliance with ethical standards and safeguarding participant rights.
Survey design and population
This study analyzed data from 44,002 participants aged 20 years or older, covering the period from 2007 to March 2020. After excluding participants with missing DI-GM data (n = 6,084) or incomplete covariate information, including education level, marital status, PIR, BMI, physical activity and (n = 12,998), a total of 25,320 participants met the inclusion criteria for the final analysis. The detailed participant selection process is illustrated in Figure 1.
FIGURE 1

Flowchart of participants of the NHANES 2007–2020.
The assessment of DI-GM
In the NHANES study, participants underwent two 24-h dietary recall interviews to evaluate their dietary intake. The first interview was conducted in the Mobile Examination Centre (MEC), while the second was completed via telephone, with a time interval of 3–10 days between the two interviews. During these interviews, participants reported all foods and beverages consumed within the past 24 h. Researchers used the food composition database from the USDA Dietary Studies Food and Nutrient Database (FNDDS) to assign codes and quantities to these foods and beverages (30).
Kase et al. (31) studies identified 14 dietary components, including specific foods or nutrients as part of the DI-GM based on a specific scoring criterion. The beneficial components for gut microbiota included avocados, broccoli, chickpeas, coffee, cranberries, fermented dairy products, fiber, soy, green tea, and whole grains. Conversely, the detrimental components included red meat, processed meat, refined grains, and high-fat diets (which comprised ≥ 40% of energy from fat). The DI-GM was calculated based on the average intake from the two 24-h dietary recalls. For beneficial foods, a score of 1 was assigned if the intake exceeded the sex-specific median, and 0 otherwise. For detrimental foods, a score of 0 was assigned if the intake was equal to or exceeded the sex-specific median and 1 otherwise. The final DI-GM score was obtained by summing the scores for all components, with a range of 0–14. A higher DI-GM score indicated a healthier gut microbiota (32). The overall DI-GM score is obtained by summing up the individual scores, ranging from 0 to 14 (including a range of 0–10 for foods beneficial to the gut microbiota and 0–4 for foods detrimental to the gut microbiota). Detailed information is provided in Supplementary Table 2.
The assessment of frailty
Based on the standard procedures proposed by Searle et al. (33) and his colleagues, we constructed the frailty index (FI) to provide a quantitative measurement of frailty levels. The FI was designed to include traits representing health deficits across multiple domains. In selecting variables, we ensured that they were age-related and spanned multiple domains, including diseases, functional status, and cognition. Variables with either a high incidence (r > 0.80) or a strong inter-variable (r > 0.95) with others were excluded to minimize redundancy. For each health deficit, values ranging from 0 to 1 were assigned according to their respective severity levels. This approach allowed for the integration of both continuous and categorical variables in our calculation process. The FI score is calculated as the ratio of the total number of health deficits to the total number of variables considered, typically ranging from 0 to 1. A higher FI score signifies greater physical vulnerability.
A frailty index, comprising 49 items, was developed adhering to the standard construction procedure. This index encapsulated a wide array of deficits spanning multiple systems, including chronic diseases, activities of daily living, depressive symptoms, cognitive function, anthropometric measurements, physical performance, general health status, healthcare utilization, as well as laboratory values. The specific deficits incorporated within each system, along with their respective cut-off points, are detailed in Supplementary Table 1. To derive the frailty index score, the number of deficits exhibited by each participant was divided by the total number of considered deficits, yielding a score that ranged from 0 to 1. In the descriptive analysis, a threshold of 0.25 was employed to classify individuals as frail (34).
Covariates
Based on the specifics of the references and studies, we considered potential confounding variables that could have contributed to frailty, primarily demographic and lifestyle-related questionnaire information. This information was collected using standardized questionnaires during in-home interviews and included gender, age, race/ethnicity, education, marital status, family poverty income ratio (PIR), BMI, physical activity and use of anti-infective prescription medications (35, 36). Race/ethnicity is classified as non-Hispanic White, non-Hispanic Black, Mexican American, other Hispanic, or other race. Education level is divided into high school and below, above high school. Marital status was divided into three categories: never married, married, and widowed/divorced/separated. The Household poverty to Income ratio (PIR) divides household income by the specific poverty guideline for the survey year (37). Physical activity levels are measured by metabolic equivalent (MET) values, and all activities are assigned an intensity level based on a rate of energy consumption expressed as MET, which is obtained by multiplying the time of activity (minutes) and the corresponding metabolic equivalent score (38). Use of anti-infective prescription medications was ascertained based on self-reported data from participants during the interview. The Prescription Medications—Drug Information file from the NHANES database was used to identify and classify these medications. Specifically, this file provides information on the therapeutic drug classes associated with each reported drug and ingredient, allowing us to determine which medications were classified as anti-infectives. This classification was facilitated by the Lexicon Plus® database, a comprehensive database of all prescription and some non-prescription drug products available in the U.S. drug market, developed and maintained by Cerner Multum, Inc. (39, 40).
Statistical analyses
Following the guidance provided by the NHANES analysis manual, we performed all analyses with consideration for the dietary sampling weights and the complex survey design of NHANES. Continuous variables are presented as mean ± standard error (SE), whereas percentages are used for categorical variables to describe participants’ characteristics. Wilcoxon rank-sum test and chi-square tests were applied to examine the relationships between continuous and categorical variables and frailty, respectively.
Multiple logistic regression models were employed to estimate the adjusted odds ratios (ORs) and their corresponding 95% confidence intervals (CIs) for the associations between DI-GM and its components and frailty index/frailty. In Model 1, no covariates were considered. Model 2 was adjusted for age, sex, race/ethnicity, education, marital status, and poverty income ratio (PIR). Model 3 further adjusted for body mass index (BMI), physical activity metabolic equivalent tasks (MET) and use of anti-infection drugs based on Model 2. To determine whether certain factors alter this association, a stratified analysis was performed to test whether the association between DI-GM and frailty was robust across age groups (≥ 50 years, < 50 years) and gender groups.
To explore the potential non-linear relationship between DI-GM and frailty, a survey-weighted restricted cubic spline (RCS) model was used, setting up four knots to simulate the dose-response relationship between DI-GM scores (including both the beneficial and unfavorable aspects of the DI-GM index) and the frailty index. We also explored the mediating role of BMI in the association between DI-GM and biological age, conducted mediation analysis using the Bootstrap method, and performed 1,000 simulations according to the normal approximation.
Sensitivity analysis includes subgroup analysis and multiple interpolation. Subgroup analyses were used to examine potential effect modifications stratified by age, sex, race/ethnicity, educational attainment, PIR (PIR was divided into three groups: < = 1.30, 1.31–3.50, and > 3.50 (41)), marital status, take anti-infection drugs and NHANES cycles. To mitigate the impact of missing variables on the results, the missing values are interpolated using multiple interpolations via chained equations, resulting in 5 interpolated datasets based on variables in the final statistical model, which is consistent with previous studies. Detailed information on multiple imputations is available in Supplementary methods.
Data were processed and analyzed using R version 4.4.0. Package “survey” (version 4.4.2) was used for survey sample analysis, package “mediation” (version 4.5.0) was utilized for mediation analysis, and package “mice” (version 3.16.0) was used for multivariate imputation. All tests were two-tailed with a test level of α = 0.05.
Results
Characteristics of the participants
Table 1 summarizes the characteristics of a representative sample comprising 448.51 million U.S. adults, with an average age of 45.93 years (SE, 0.27). Among this population, approximately 40.63 million individuals were classified as frail. Compared with non-frail individuals, frail participants were generally older, more likely to be male, married or living with a partner, had lower income and education levels, engaged in less intense physical activity, exhibited lower DI-GM scores, and had a higher BMI.
TABLE 1
| Variable | Total | Non-frailty | Frailty | P-value |
| Weighted population, n (in millions) | 448.51 | 407.87 | 40.63 | |
| Age, mean (SE), y | 45.93 (0.27) | 44.82 (0.26) | 57.12 (0.49) | < 0.0001 |
| Age group (n,%) | < 0.0001 | |||
| > = 50 | 13,931 (58.00) | 13,151 (60.93) | 780 (28.60) | |
| < 50 | 11,389 (42.00) | 9,223 (39.07) | 2,166 (71.40) | |
| Sex (n,%) | <0.0001 | |||
| Female | 12,198 (48.93) | 10,560 (47.96) | 1,638 (58.70) | |
| Male | 13,122 (51.07) | 11,814 (52.04) | 1,308 (41.30) | |
| Race/Ethnicity (n,%)b | <0.0001 | |||
| Mexican American | 3,378 (8.06) | 3,086 (8.35) | 292 (5.12) | |
| Non-Hispanic Black | 5,424 (10.34) | 4,615 (9.86) | 809 (15.13) | |
| Non-Hispanic White | 10,862 (67.51) | 9,571 (67.65) | 1,291 (66.11) | |
| Other Hispanic | 2,394 (5.63) | 2,116 (5.60) | 278 (5.97) | |
| Other | 3,262 (8.46) | 2,986 (8.54) | 276 (7.67) | |
| Education (n,%) | <0.0001 | |||
| Above high school | 14,801 (64.84) | 13,462 (66.37) | 1,339 (49.50) | |
| High school and below | 10,519 (35.16) | 8,912 (33.63) | 1,607 (50.50) | |
| Marital status (n,%) | <0.0001 | |||
| Divorced/separated/widowed | 5,008 (16.65) | 3,965 (15.13) | 1,043 (31.91) | |
| Married/living with partner | 15,178 (62.66) | 13,709 (63.54) | 1,469 (53.85) | |
| Never married | 5,134 (20.69) | 4,700 (21.33) | 434 (14.25) | |
| PIR, mean (SE) | 3.12 (3.24) | 3.19 (3.24) | 2.36 (5.34) | <0.0001 |
| BMI, mean (SE), kg/m2 | 28.91 (0.09) | 28.61 (0.09) | 31.98 (0.23) | <0.0001 |
| PAtotal MET, mean (SE) | 5,127.16 (91.64) | 5,240.92 (99.80) | 3,985.38 (157.58) | <0.0001 |
| Take anti-infectives drugs (n,%) | <0.0001 | |||
| No | 23968 (93.98) | 21313 (94.41) | 2655 (89.58) | |
| Yes | 1352 (6.02) | 1061 (5.59) | 291 (10.42) | |
| DI_GM, mean (SE) | 4.73 (0.02) | 4.75 (0.03) | 4.55 (0.05) | <0.0001 |
| Beneficial to gut microbiota, mean (SE) | 2.18 (0.02) | 2.20 (0.02) | 1.94 (0.04) | <0.0001 |
| Unfavorable to gut microbiota, mean (SE) | 2.56 (0.01) | 2.55 (0.01) | 2.61 (0.03) | 0.03 |
Baseline of participants of the NHANES 2007–2020.
BMI, body mass index; PA, physical activity; PIR, poverty income ratio; SE, standard error. All means and SEs for continuous variables and numbers and percentages for categorical variables were weighted. aIncludes multi-racial participants. NHANES does not provide a detailed list of all races and ethnicities. bThe other category includes all Hispanics, regardless of race, who were not Mexican-American and also includes all non-Hispanics from racial groups other than White or Black.
Associations between DI-GM and frailty
As presented in Table 2, for every 1-point increase in DI-GM, the prevalence of frailty decreased by 1.5% (OR = 0.985, 95%CI: 0.976, 0.995, P < 0.01), and the score of frailty index decreased 0.074 (OR = 0.926, 95%CI: 0.893, 0.960, P = 0.001). After adjusting for covariates sex, age, race/ethnicity, education level, marital, and PIR, the above association remained significant in Model 2 (frailty: OR = 0.926, 95%CI: 0.893, 0.960, P = 0.001; frailty index: OR = 0.985, 95%CI: 0.971, 0.990, P = 0.001). In fully adjusted model 3, DI-GM scores were significantly associated with reduced risk of frailty (frailty: OR = 0.941, 95%CI: 0.902, 0.980, P = 0.004; frailty index: OR = 0.987, 95%CI: 0.977,0.997, P = 0.014).
TABLE 2
| Variables | Outcomes | Model1a | Model2b | Model3c | |||
| OR (95%CI) | P | OR (95%CI) | P | OR (95%CI) | P | ||
| DI_GM | Frailty index | 0.985 (0.976,0.995) | 0.005 | 0.981 (0.971,0.990) | 0.001 | 0.987 (0.977,0.997) | 0.014 |
| Beneficial to gut microbiota | Frailty index | 0.968 (0.956,0.980) | 0.001 | 0.973 (0.962,0.984) | 0.001 | 0.976 (0.965,0.987) | 0.001 |
| Unfavorable to gut microbiota | Frailty index | 1.018 (1.005,1.032) | 0.008 | 0.997 (0.986,1.009) | 0.650 | 1.008 (0.996,1.020) | 0.183 |
| DI_GM | Frailtyd | 0.926 (0.893,0.960) | 0.001 | 0.920 (0.884,0.957) | 0.001 | 0.941 (0.902,0.980) | 0.004 |
Weighted multifactor logistic regression analysis for associations between DIGM and frailty index.
OR, Odds Ratio; CI, Confidence Interval; DIGM, Dietary Index of Gut Microbiota.
aModel1: The crude model without adjustment for covariates.
bModel2: Adjust for sex, age, race/ethnicity, education level, marital, PIR;
cModel3: Adjust for model 2, additionally adjusted for sex, age, race, education, marital, PIR, BMI, physical activity total MET, take anti-infectives drugs.
dFrailty determines whether the Frailty index is ≥ 0.25.
Table 3 further illustrates the associations between DI-GM and frailty by the survey-weighted logistic regression models. In Model 1, DI-GM was inversely associated with frailty (adjusted OR = 0.926, 95%CI: 0.893, 0.960, P < 0.0001). This negative relationship persisted in Model 2 (adjusted OR = 0.920, 95% CI: 0.884, 0.957, P < 0.0001) and Model 3 (adjusted OR = 0.941, 95% CI: 0.902, 0.980, P = 0.004) after adjusting for potential confounders.
TABLE 3
| Subgroup | Model 1a | P-value | Model 2b | P-value | Model 3c | P-value |
| Total population | ||||||
| Frailty index[β(95%CI)] | 0.985 (0.976,0.995) | 0.005 | 0.981 (0.971,0.990) | <0.001 | 0.987 (0.977,0.997) | 0.014 |
| Frailtyd [OR (95%CI)] | 0.926 (0.893,0.960) | <0.0001 | 0.920 (0.884,0.957) | <0.0001 | 0.941 (0.902,0.980) | 0.004 |
| Female | ||||||
| Frailty index[β(95%CI)] | 0.967 (0.954,0.980) | < 0.0001 | 0.977 (0.965,0.990) | < 0.001 | 0.987 (0.974,0.999) | 0.035 |
| Frailty [OR (95%CI)] | 0.900 (0.854,0.948) | < 0.001 | 0.927 (0.878,0.979) | 0.007 | 0.960 (0.908,1.015) | 0.152 |
| Male | ||||||
| Frailty index[β(95%CI)] | 0.999 (0.986,1.012) | 0.999 | 0.985 (0.973,0.997) | 0.014 | 0.988 (0.975,1.000) | 0.057 |
| Frailty [OR (95%CI)] | 0.942 (0.892,0.995) | 0.032 | 0.910 (0.854,0.969) | 0.004 | 0.916 (0.860,0.976) | 0.007 |
| Age≥ 50 | ||||||
| Frailty index[β(95%CI)] | 0.960 (0.947,0.974) | <0.0001 | 0.977 (0.963,0.991) | 0.001 | 0.985 (0.972,0.999) | 0.035 |
| Frailty [OR (95%CI)] | 0.887 (0.845,0.930) | <0.0001 | 0.937 (0.892,0.984) | 0.010 | 0.958 (0.910,1.008) | 0.097 |
| Age < 50 | ||||||
| Frailty index[β(95%CI)] | 0.982 (0.972,0.993) | <0.001 | 0.984 (0.974,0.993) | <0.001 | 0.989 (0.979,0.999) | 0.037 |
| Frailty [OR (95%CI)] | 0.867 (0.823,0.913) | <0.001 | 0.865 (0.816,0.917) | <0.0001 | 0.881 (0.829,0.936) | <0.0001 |
Association between DIGM and frailty, with results weighted for sampling strategy.
OR, Odds Ratio; 95%CI, 95% Confidence Interval.
aModel 1 was the crude model without adjustment for covariates.
bModel 2 was adjusted for age, sex, race/ethnicity, PIR, and education level.
cModel 3 was adjusted as for model 2, additionally adjusted for physical activity total MET, BMI, take anti-infectives drugs.
dFrailty determines whether the Frailty index is ≥ 0.25. 95%CI, 95% Confidence Interval. Model adjusted for age, sex, race, education, PIR, PA total MET, take anti-infectives drugs.
The non-linear relationship between DI-GM and frailty was further explored using restricted cubic splines (RCS) regression. RCS analysis revealed a non-linear association between DI-GM and frailty (P for overall < 0.001, P for non-linearity = 0.012). However, the effects of both beneficial (P for overall < 0.001, P for non-linearity = 0.833) and unfavorable (P for overall = 0.015, P for non-linearity = 0.127) gut microbiota composition on frailty were found to be linear in nature (Figure 2). The threshold effect analysis revealed that 3 was a critical inflection point. When DI-GM was less than 3, the correlation between the two variables was not statistically significant (P = 0.472). When DI-GM was greater than 3, a significant correlation existed between DI-GM and the incidence of frailty (P < 0.001; Supplementary Table 4).
FIGURE 2
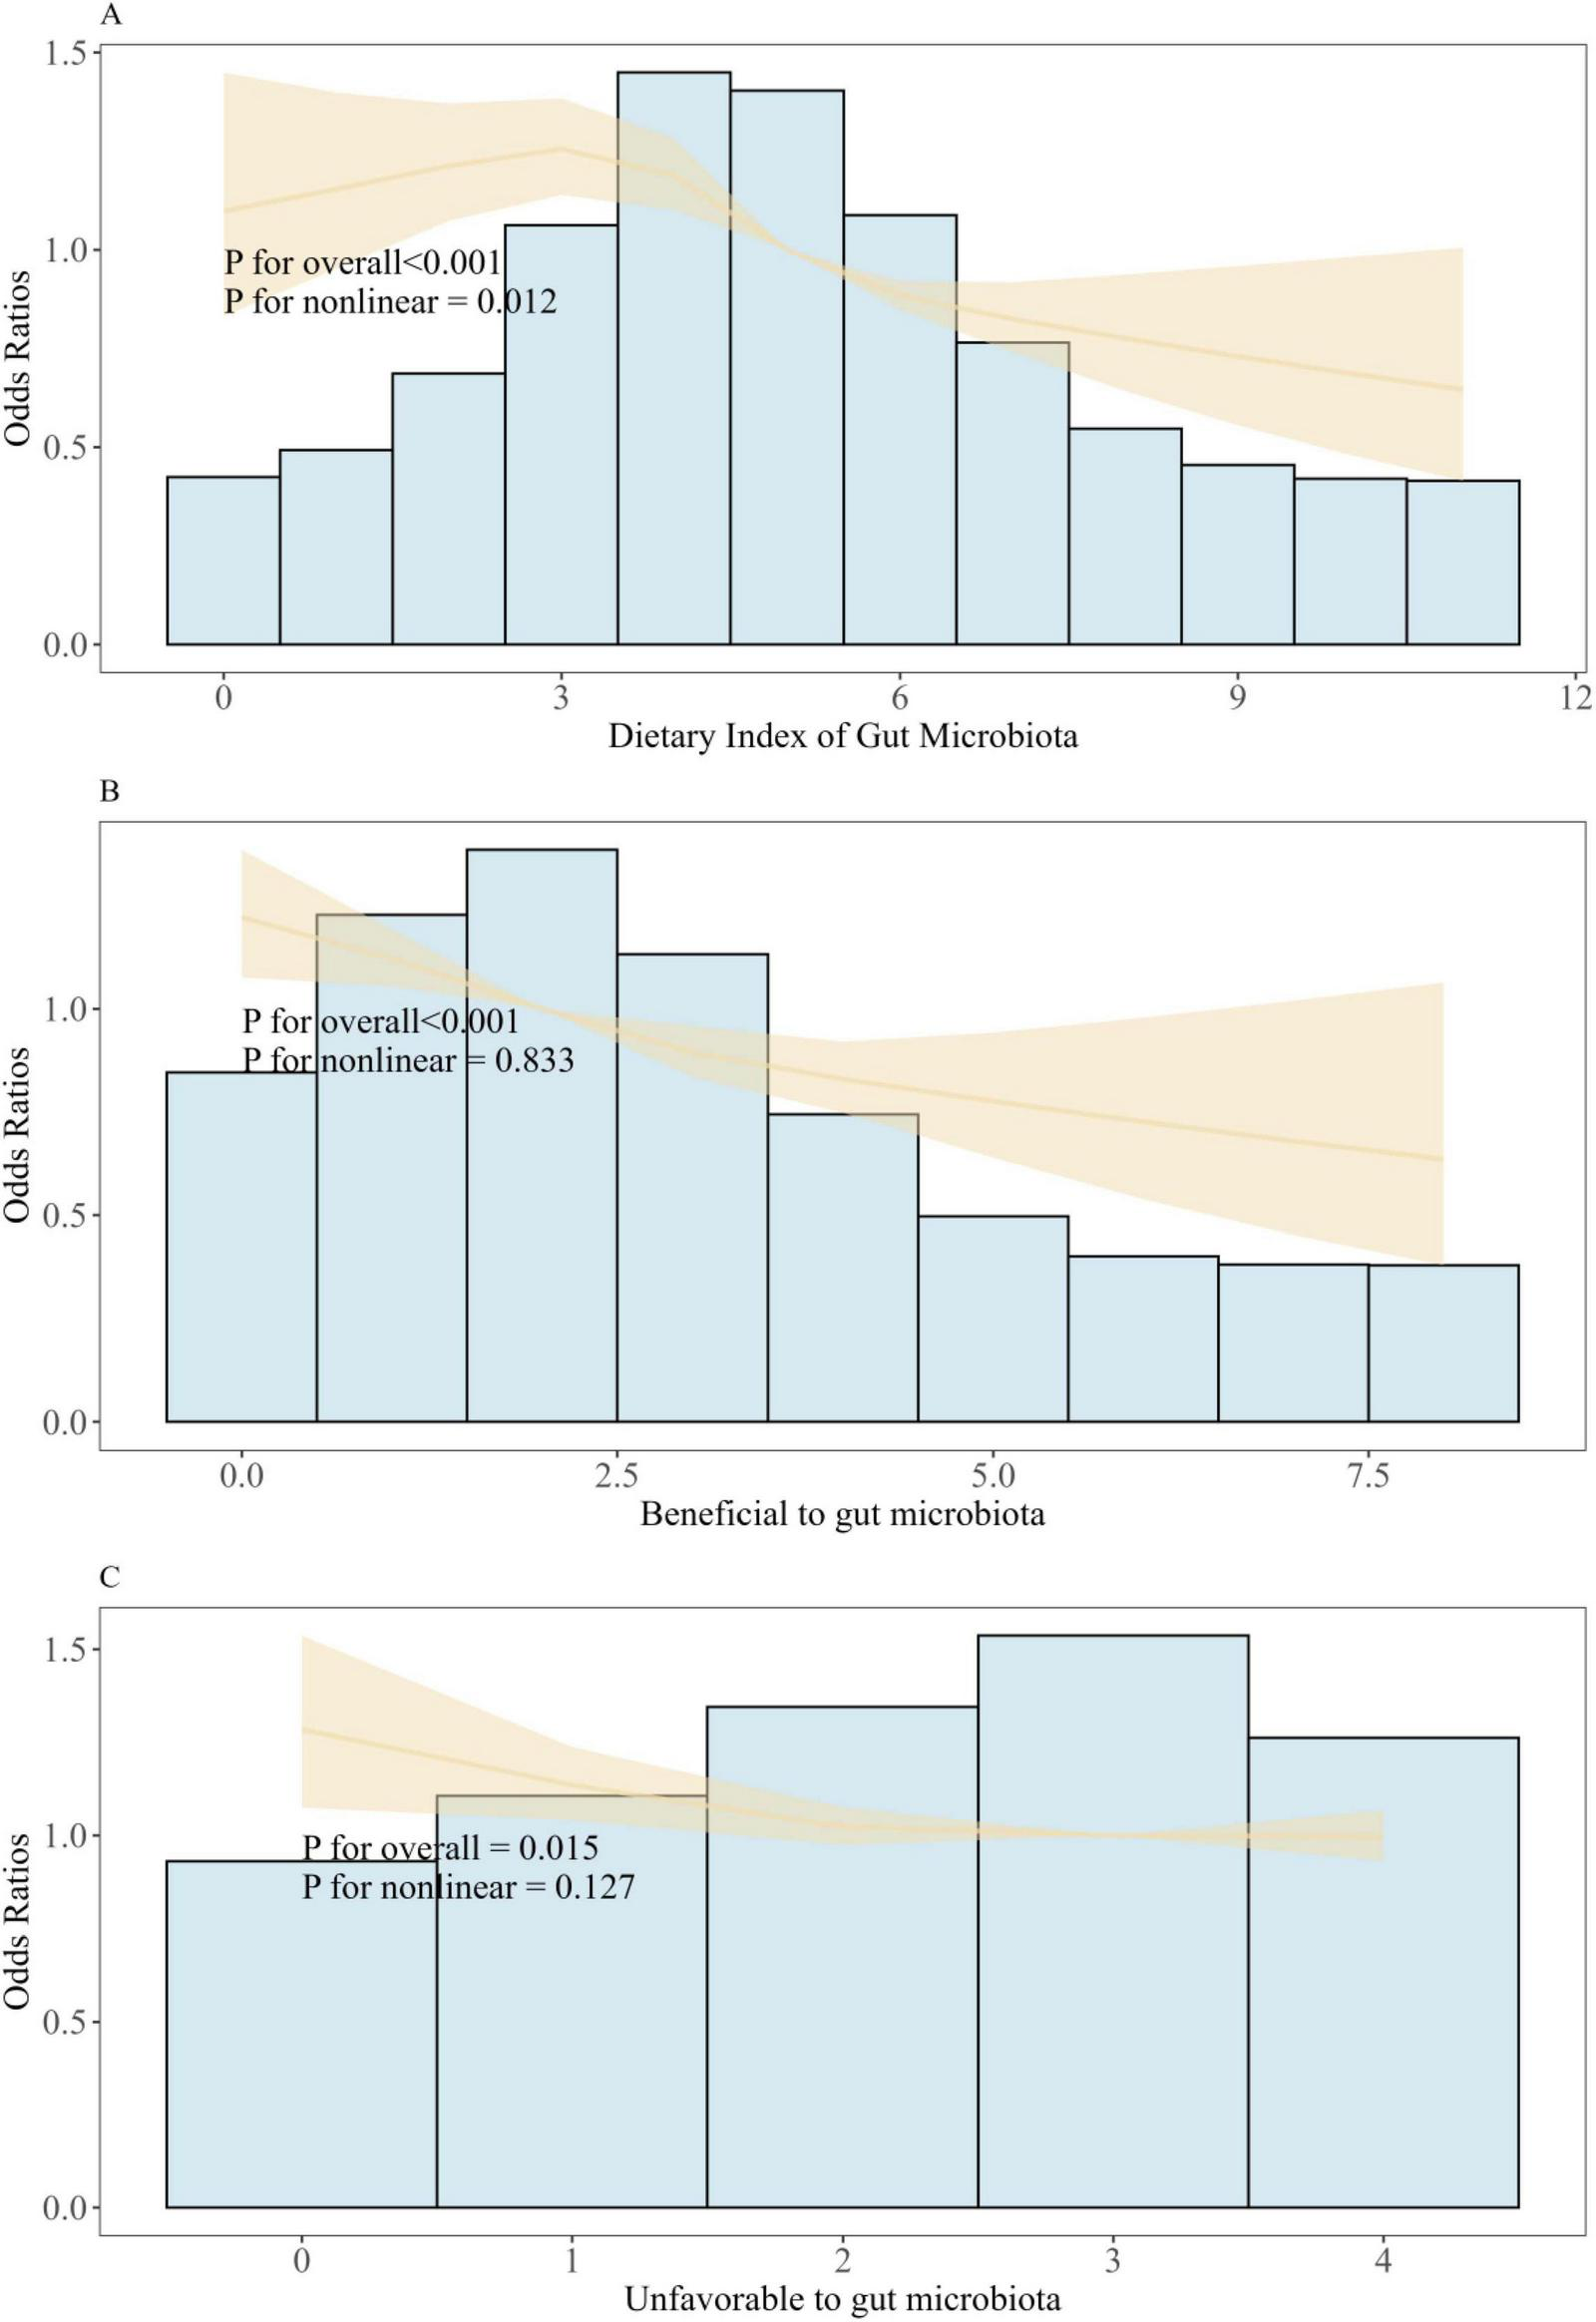
Association between DI-GM and frailty in NHANES 2007–2020 participants by RCS. (A) Restricted spline regression showed non-liner association between DI_GM and frailty. (B) Restricted spline regression showed liner association between Beneficial to gut microbiota and frailty. (C) Restricted spline regression showed liner association between Unfavorable to gut microbiota and frailty. Model adjusted for age, sex, race, education, BMI, PIR, PA total MET, take anti-infectives drugs. Frailty determines whether the Frailty index is ≥ 0.25.
Subgroup and sensitivity analyses
To derive more comprehensive results on trend and interaction analysis, this study performed subgroup analyses to investigate whether the relationship between DI-GM and frailty status was influenced by factors such as age, sex, ethnicity, education level, PIR and use of anti-infection drugs, and NHANES cycles (Figure 3). Except for the subgroup of educational level (P for interaction < 0.05), no significant interactions were found.
FIGURE 3
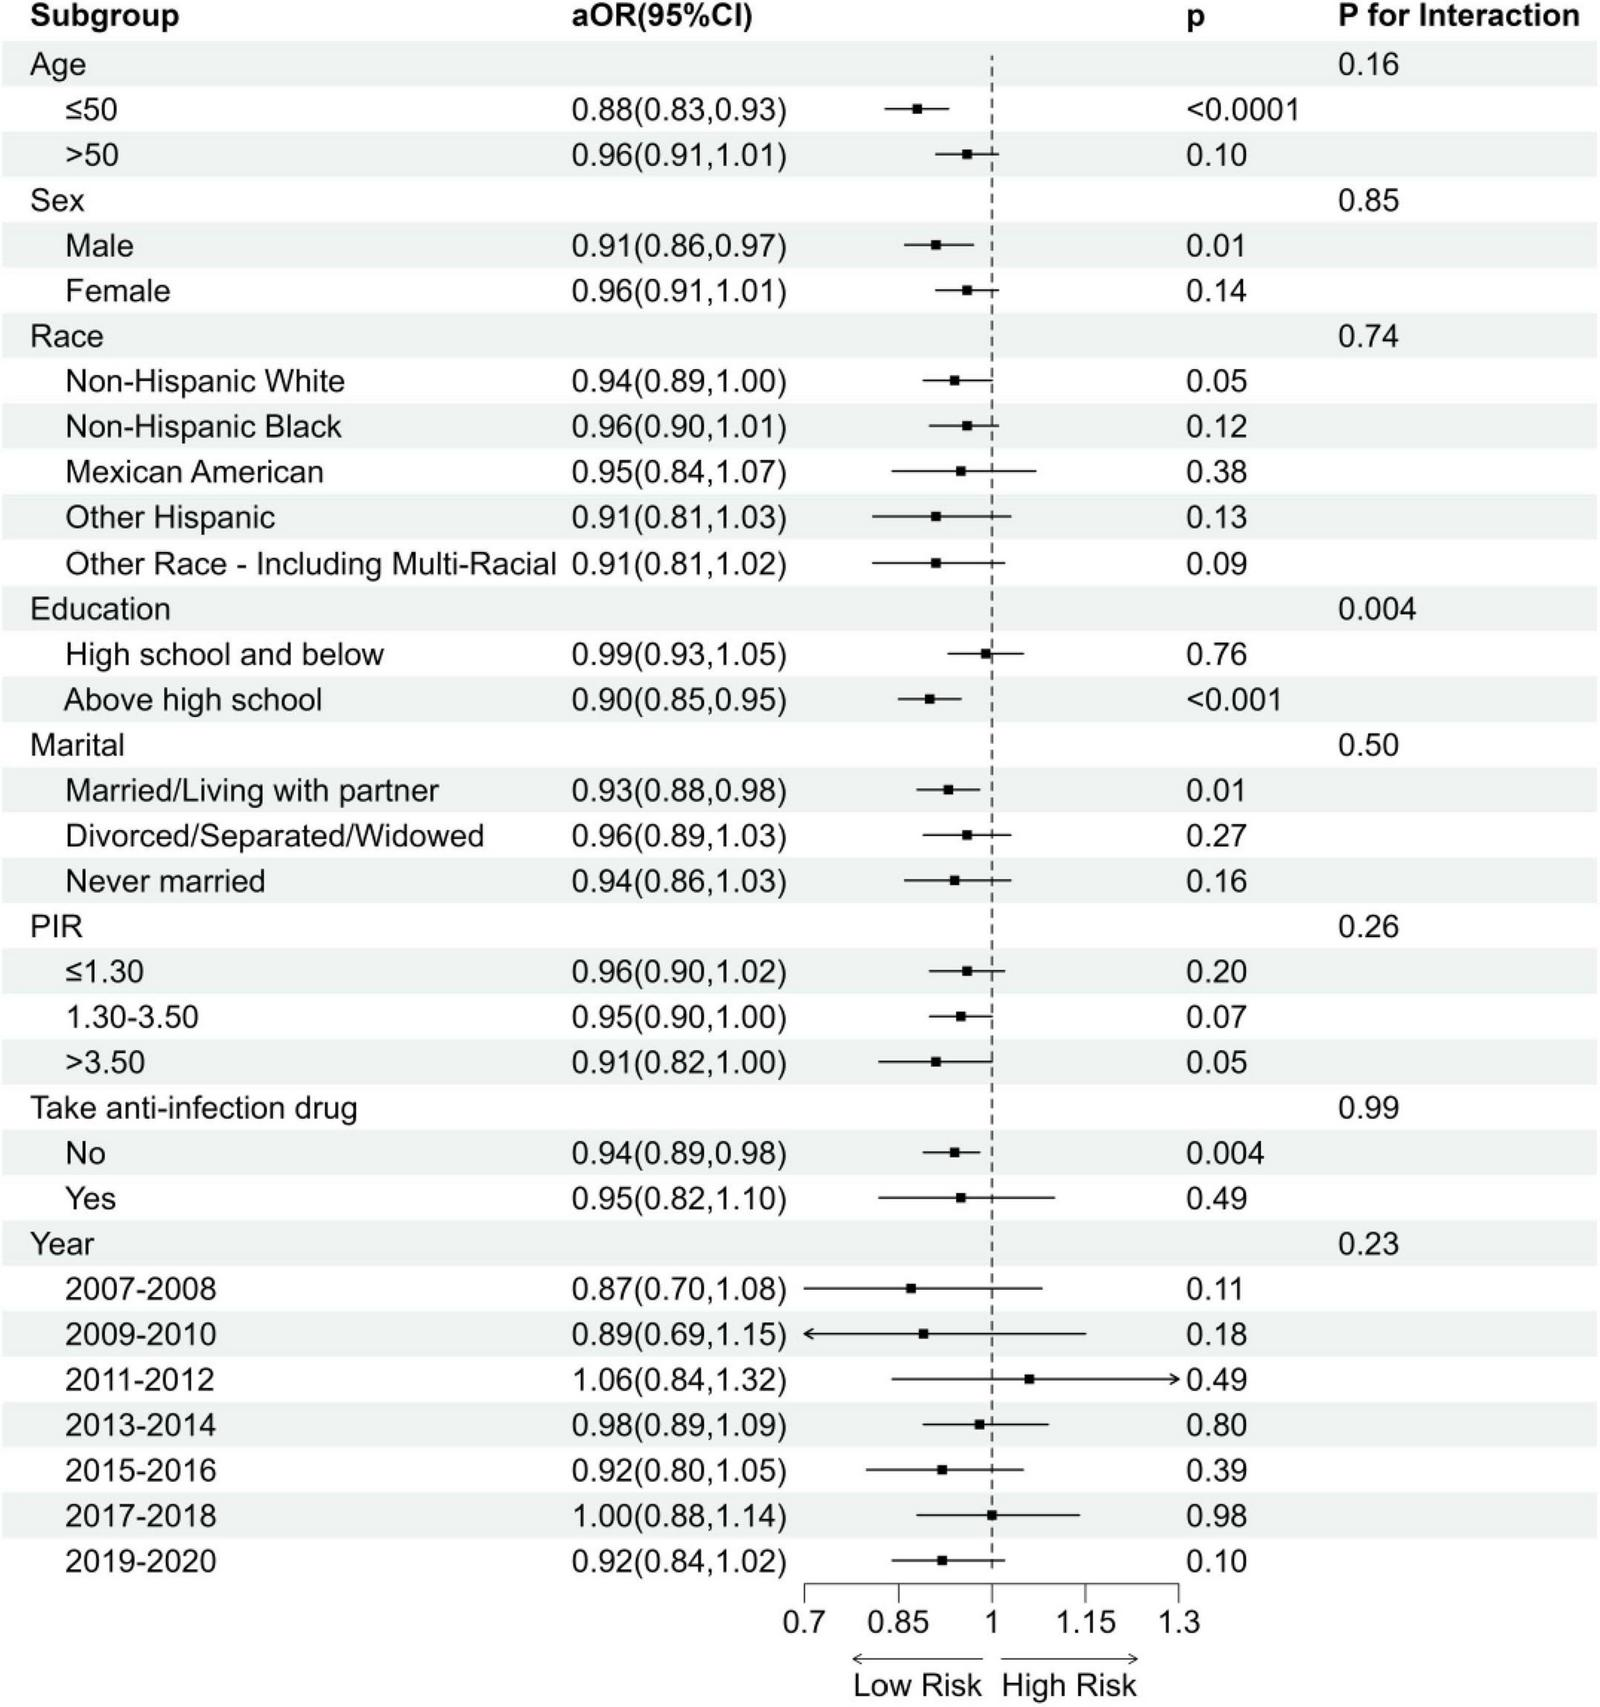
Subgroup analysis of the association between DI-GM and frailty status. aOR, adjusted Odds Ratio; 95%CI, 95% Confidence Interval. Model adjusted for age, sex, race, education, BMI, PIR, PA total MET, take anti-infectives drugs.
To handle missing data, we applied multiple imputations by chained equations (MICE), generating five imputed datasets. Multivariate logistic regression analyses on these imputed datasets yielded results consistent with the primary analysis, further supporting the protective role of higher DI-GM scores against frailty. These findings showed similar effect sizes and directions as the original dataset, reinforcing the robustness of our results. Detailed results of the multiple imputation analyses are available in Supplementary Table 3.
Mediation analysis
Figure 4 presents the results of the mediation analysis, with adjustments for potential confounders. The total effect of DI-GM on frailty was −0.01210 (P < 0.001), while the indirect effect mediated by BMI was −0.00213 (95% CI: −0.00214 to 0, P < 0.001). The proportion of the association mediated by BMI was 17.57% (P < 0.001).
FIGURE 4
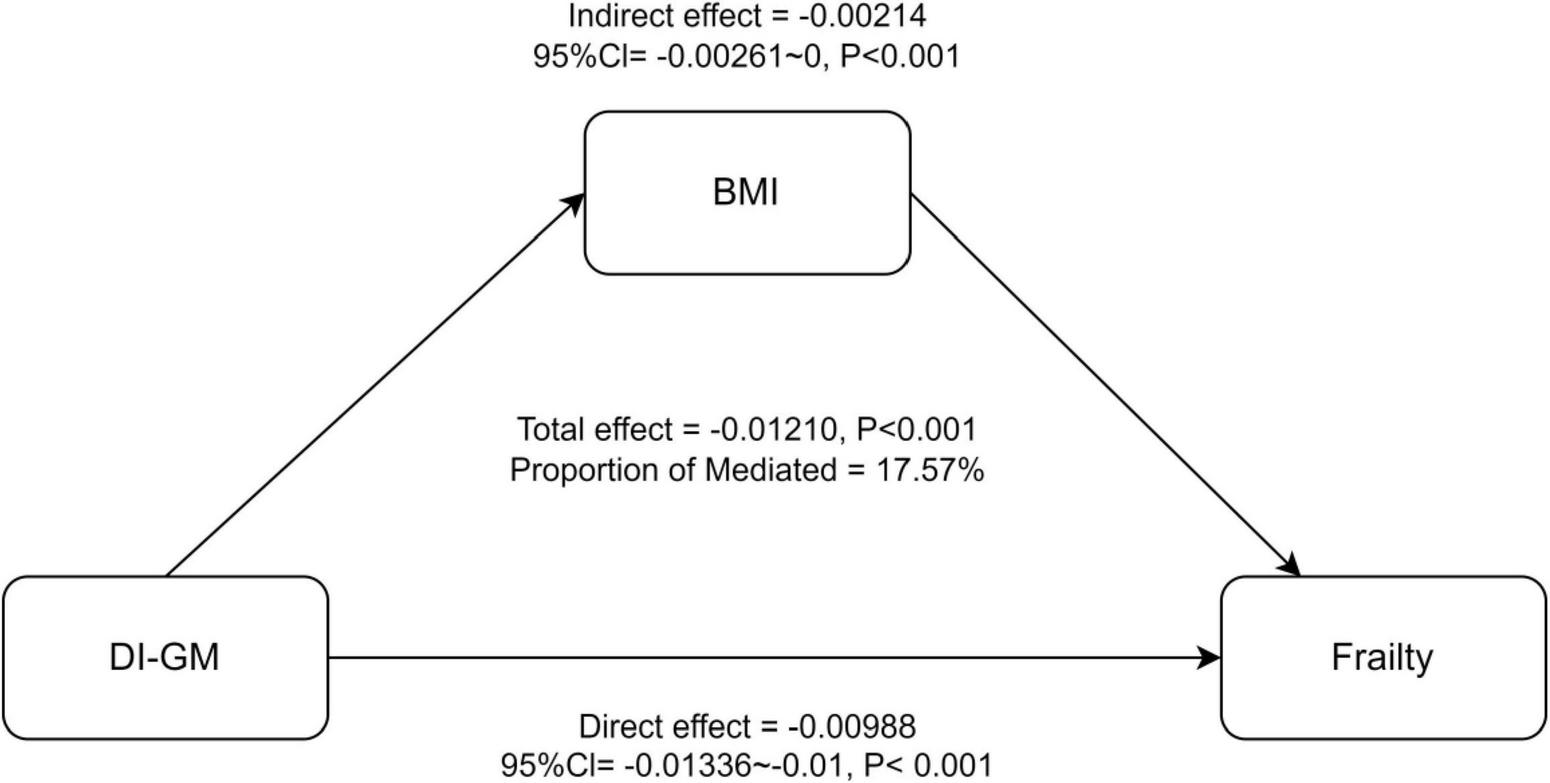
Mediation analysis of BMI in the association between DI-GM and Frailty. 95%CI, 95% Confidence Interval. Model adjusted for age, sex, race, education, PIR, PA total MET, take anti-infectives drugs.
Discussion
In our study, we demonstrated for the first time that DI-GM score was significantly negatively associated with frailty (frailty: OR = 0.941, 95% CI: 0.902, 0.980; > 0.25 frailty index: OR = 0.987, 95% CI: 0.977, 0.997). This association remained robust after adjusting multiple covariates. RCS analysis indicated that there is a non-linear relationship between DI-GM and frailty (P for non-linearity = 0.012). Notably, both beneficial gut microbiota (P for non-linearity = 0.833) and unfavorable gut microbiota (P for non-linearity = 0.127) exhibited linear correlations with frailty. Moreover, BMI was identified as a significant mediator of the association between them (OR = −0.00214, 95% CI: −0.00261, 0, P < 0.001), with 17.57% of the association being mediated. (42–45)Diet plays a critical role in shaping gut microbiota diversity and function, thereby influencing frailty risk. Adherence to dietary patterns such as the alternative Mediterranean diet (aMED), Recommended Food Score (RFS), Dietary Approaches to Stop Hypertension (DASH), and Mediterranean DASH and Neurodegenerative Delay Intervention (MIND) diet have been associated with reduced frailty risk (42). These diets are characterized by high intakes of fruit, vegetables, whole grains, lean protein, and healthy fats, and low in processed foods and refined sugars. These dietary components positively influence the gut microbiota, potentially reducing inflammation and oxidative stress (42). Specifically, prebiotics, as beneficial components of gut microbiota, can lower inflammatory markers (e.g., CRP, IL-7), enhance antioxidant enzyme activity (e.g., SOD), and mitigate damage from free radicals (44). Furthermore, elevated levels of certain metabolites, such as methionine, histidine, and alanine, are linked to frailty prevention, as they align with metabolic profiles observed in non-frail individuals (45). These findings suggest that specific dietary components can modulate gut microbiota composition and function, influencing metabolic pathways and reducing the risk of frailty.
Mechanistically, the association between DI-GM and frailty can be attributed to immune-inflammatory activation, oxidative stress imbalance, and abnormal amino acid metabolism (46–48). It is reported that the breakdown of antioxidant enzyme activity, such as SOD-1 is universal in frail individuals (46). The amino acid metabolism disorder such as the elevated levels of 3-methylhistidine, alanine, arginine, ethanolamine, and glutamate is associated with muscle loss and functional decline (47). Biomarkers like IL-6, cathepsin S, cystatin C, and GP-acetyl have demonstrated significant associations with frailty index scores in cross-sectional studies (47). Additionally, an 8-year follow-up study revealed that participants with higher baseline hs-CRP levels exhibited a significant increase in frailty index scores over time (48).
Rashidah et al. (49) reported reduced gut microbiota diversity in frail individuals, consistent with our findings (49). Mendelian randomization analysis provides further evidence of a causal relationship between specific gut microbiota genera and frailty (50). Notably, gut microbiota metabolites, such as phenylacetylglutamine (PAGln), can accelerate cellular aging by activating the ADR-AMPK signaling pathway, leading to mitochondrial dysfunction and DNA damage (20). These findings collectively highlight the crucial role of gut microbiota in the pathophysiology of frailty, particularly through mechanisms involving inflammation, oxidative stress, and metabolic dysregulation (51–56). BMI plays a crucial mediating role in the relationship between DI-GM and frailty, highlighting the complex interplay between obesity and frailty (56). While obesity is often associated with a higher risk of frailty, the relationship is not straightforward. Some studies have reported a U-shaped relationship, where both high and low BMI are linked to greater frailty risk (53). This phenomenon, sometimes referred to as the “obesity paradox”, suggests that higher BMI may mask underlying frailty and provide protective effects on muscle mass and bone density (54). Conversely, sarcopenia and other age-related changes may elevate frailty risk in individuals with normal BMI. Abdominal obesity, characterized by a high waist circumference, combined with a non-obese BMI (< 30 kg/m2), has been identified as a significant risk factor for frailty (55). Recent studies also highlight the mediating role of BMI in the relationship between gut microbiota-related dietary indices and biological age, consistent with our findings (56). These findings suggest that BMI may influence frailty through multiple mechanisms, including inflammation, metabolic dysfunction, and muscle mass regulation. Further research is needed to disentangle the complex relationship between BMI, gut microbiota, and frailty.
This study has several strengths. Firstly, it utilized the NHANES database, a national representative stratified multi-stage probability survey with extensive and comprehensive data. The use of stratified, multi-stage probability sampling ensures that the subjects represent the population distribution and characteristics of the entire United States. Secondly, the rigorous data collection protocols and quality control measures employed by NHANES enhance the reliability and validity of the findings. Additionally, the sensitivity analyses, including subgroup analyses and multiple imputation, further strengthen the robustness of the results. Finally, this study is the first one to comprehensively investigate the relationship between the DI-GM dietary quality index and frailty, as well as the mediating role of BMI, in a large, diverse population.
The clinical implications of our findings regarding BMI and DI-GM are significant. Regarding BMI, our results suggest that it may not be an independent predictor of frailty, but rather a mediating factor influenced by gut microbiota composition and dietary patterns. Therefore, BMI should be considered as a complementary factor in a comprehensive assessment of frailty risk, alongside other indicators such as physical performance, nutritional status, and chronic disease burden. The DI-GM score, on the other hand, represents a dietary quality index specifically designed to reflect the impact of diet on gut microbiota health. Our findings indicate that the DI-GM score may be a useful tool for identifying individuals at higher risk of frailty and guiding dietary interventions to improve gut microbiota health and potentially reduce frailty risk.
The study also had some limitations. First, it is a cross-sectional study, which cannot prove the causal relationship between DI-GM and frailty. Second, despite efforts to adjust many potential confounders, it is not possible to eliminate residual confounders (e.g., medical conditions, diet, occupation, drug use, other environmental chemicals) and unexpected factors (e.g., genetic influences). Despite these limitations, the study successfully demonstrated the association between DI-GM and frailty, underscoring the necessity for multicenter prospective cohort studies to further investigate this relationship.
Conclusion
Our study proposed DI-GM, which reflects a diet quality index related to gut microbiota diversity, was found to be inversely associated with frailty prevalence and frailty index. Mediation analysis further explored the mediating role of BMI. Given the close link between diet, gut microbiota, and frailty, further research and dietary interventions for frailty patients will be critical to reducing the prevalence of this disease.
Statements
Data availability statement
Publicly available datasets were analyzed in this study. This data can be found at: https://www.cdc.gov/nchs/nhanes/; https://www.cdc.gov/nchs/nhanes/index.htm.
Ethics statement
The studies involving humans were approved by the National Center for Health Statistics (NCHS) Ethics Review Board (ERB). The studies were conducted in accordance with the local legislation and institutional requirements. The participants provided their written informed consent to participate in this study.
Author contributions
JL: Conceptualization, Data curation, Formal Analysis, Software, Visualization, Writing – original draft, Writing – review & editing. TF: Methodology, Project administration, Software, Validation, Writing – original draft, Writing – review & editing. TT: Methodology, Validation, Visualization, Writing – review & editing. ZZ: Data curation, Formal Analysis, Methodology, Software, Validation, Writing – review & editing. GZ: Investigation, Validation, Writing – review & editing. YL: Investigation, Validation, Writing – review & editing. ZY: Investigation, Validation, Writing – review & editing. YW: Investigation, Validation, Writing – review & editing. XZ: Funding acquisition, Project administration, Resources, Supervision, Writing – review & editing. WS: Funding acquisition, Project administration, Resources, Supervision, Writing – review & editing. JW: Conceptualization, Funding acquisition, Project administration, Resources, Supervision, Writing – review & editing.
Funding
The author(s) declare that financial support was received for the research and/or publication of this article. This study was supported by the National Natural Science Foundation of China (No. 82402313) and the Science and Technology Plan Project of Liaoning Province (2023JH2/20200082).
Acknowledgments
Thanks to Zhang Jing (Second Department of Infectious Disease, Shanghai Fifth People’s Hospital, Fudan University) for his work on the NHANES database. His outstanding work, nhanesR package and webpage, makes it easier for us to explore NHANES database.
Conflict of interest
The authors declare that the research was conducted in the absence of any commercial or financial relationships that could be construed as a potential conflict of interest.
Generative AI statement
The authors declare that no Generative AI was used in the creation of this manuscript.
Publisher’s note
All claims expressed in this article are solely those of the authors and do not necessarily represent those of their affiliated organizations, or those of the publisher, the editors and the reviewers. Any product that may be evaluated in this article, or claim that may be made by its manufacturer, is not guaranteed or endorsed by the publisher.
Supplementary material
The Supplementary Material for this article can be found online at: https://www.frontiersin.org/articles/10.3389/fnut.2025.1573199/full#supplementary-material
References
1.
KimDHRockwoodK. Frailty in older adults. N Engl J Med. (2024) 391:1759–60. 10.1056/NEJMc2411327
2.
YamaguchiRMakinoKKatayamaOYamagiwaDShimadaH. Relationship between self-rated health, physical frailty, and incidence of disability among Japanese community-dwelling older adults: A longitudinal prospective cohort study.Prev Med. (2024) 191:108210. 10.1016/j.ypmed.2024.108210
3.
SappDCormierBRockwoodKHowlettSHeinzeS. The frailty index based on laboratory test data as a tool to investigate the impact of frailty on health outcomes: A systematic review and meta-analysis.Age Ageing. (2023) 52:afac309. 10.1093/ageing/afac309
4.
Justina AngelTJin HeanKReshma AzizMLi FengT. Frailty as a predictor of mortality in the oldest old: A systematic review and meta-analysis. Geriatr Gerontol Int. (2025) 25:102–7.
5.
FanLHouXLiuYChenSWangQDuW. Catastrophic health expenditure associated with frailty in community-dwelling chinese older adults: A prospective cohort analysis.Front Public Health. (2021) 9:718910. 10.3389/fpubh.2021.718910
6.
NiknamiMTahmasbiHFirouzabadiSMohammadiIMofidiSAlinejadfardMet alFrailty as a predictor of mortality and morbidity after cholecystectomy: A systematic review and meta-analysis of cohort studies.Langenbecks Arch Surg. (2024) 409:352. 10.1007/s00423-024-03537-z
7.
FengGLiJLiGLiuJGaoXYanGet alAssociation between frailty status and risk of chronic lung disease: An analysis based on two national prospective cohorts.Aging Clin Exp Res. (2024) 36:215. 10.1007/s40520-024-02867-8
8.
ZhangLChuCZhangYWangM. Association of frailty index with new-onset diabetes: From the China health and retirement longitudinal study (CHARLS).Acta Diabetol. (2025): 10.1007/s00592-024-02441-8Online ahead of print.
9.
VetranoDPalmerKGalluzzoLGiampaoliSMarengoniABernabeiRet alHypertension and frailty: A systematic review and meta-analysis.BMJ Open. (2018) 8:e024406. 10.1136/bmjopen-2018-024406
10.
ChenLLiXLvYTanXZhongVRongSet alPhysical frailty, adherence to ideal cardiovascular health and risk of cardiovascular disease: A prospective cohort study.Age Ageing. (2023) 52:afac311. 10.1093/ageing/afac311
11.
KennardARainsfordSHamiltonKGlasgowNPumpaKDouglasAet alSubjective and objectives measures of frailty among adults with advanced chronic kidney disease: A cross-sectional analysis of clinician misclassification.Intern Med J. (2025) 55:599–607. 10.1111/imj.16630
12.
WangSYuYAdeliK. Role of gut microbiota in neuroendocrine regulation of carbohydrate and lipid metabolism via the microbiota-gut-brain-liver axis.Microorganisms. (2020) 8:527. 10.3390/microorganisms8040527
13.
FanYPedersenO. Gut microbiota in human metabolic health and disease.Nat Rev Microbiol. (2021) 19:55–71. 10.1038/s41579-020-0433-9
14.
SahRNandanAKvAJoseA. Decoding the role of the gut microbiome in gut-brain axis, stress-resilience, or stress-susceptibility: A review.Asian J Psychiatr. (2024) 91:103861. 10.1016/j.ajp.2023.103861
15.
TurnbaughPLeyRMahowaldMMagriniVMardisEGordonJ. An obesity-associated gut microbiome with increased capacity for energy harvest.Nature. (2006) 444:1027–31. 10.1038/nature05414
16.
RahmanMIslamFMamunAARahamanMSIslamMMet alThe gut microbiota (Microbiome) in cardiovascular disease and its therapeutic regulation.Front Cell Infect Microbiol. (2022) 12:903570. 10.3389/fcimb.2022.903570
17.
SaadMSantosAPradaP. Linking gut microbiota and inflammation to obesity and insulin resistance.Physiology (Bethesda). (2016) 31:283–93. 10.1152/physiol.00041.2015
18.
ChenYZhouJWangL. Role and mechanism of gut microbiota in human disease.Front Cell Infect Microbiol. (2021) 11:625913. 10.3389/fcimb.2021.625913
19.
ZhangCZhangMWangSHanRCaoYHuaWet alInteractions between gut microbiota, host genetics and diet relevant to development of metabolic syndromes in mice.ISME J. (2010) 4:232–41. 10.1038/ismej.2009.112
20.
YangHWangTQianCWangHYuDShiMet alGut microbial-derived phenylacetylglutamine accelerates host cellular senescence.Nat Aging. (2025) 5:401–18. 10.1038/s43587-024-00795-w
21.
VioliFCammisottoVBartimocciaSPignatelliPCarnevaleRNocellaC. Gut-derived low-grade endotoxaemia, atherothrombosis and cardiovascular disease.Nat Rev Cardiol. (2023) 20:24–37. 10.1038/s41569-022-00737-2
22.
HersougLMøllerPLoftS. Role of microbiota-derived lipopolysaccharide in adipose tissue inflammation, adipocyte size and pyroptosis during obesity.Nutr Res Rev. (2018) 31:153–63. 10.1017/S0954422417000269
23.
LiXLiCZhangWWangYQianPHuangH. Inflammation and aging: Signaling pathways and intervention therapies.Signal Transduct Target Ther. (2023) 8:239. 10.1038/s41392-023-01502-8
24.
LiuPLiuZWangJWangJGaoMZhangYet alImmunoregulatory role of the gut microbiota in inflammatory depression.Nat Commun. (2024) 15:3003. 10.1038/s41467-024-47273-w
25.
RossFPatangiaDGrimaudGLavelleADempseyERossRet alThe interplay between diet and the gut microbiome: Implications for health and disease.Nat Rev Microbiol. (2024) 22:671–86. 10.1038/s41579-024-01068-4
26.
BeamAClingerEHaoL. Effect of diet and dietary components on the composition of the gut microbiota.Nutrients. (2021) 13:2795. 10.3390/nu13082795
27.
LinLXiangSChenYLiuYShenDYuXet alGut microbiota: Implications in pathogenesis and therapy to cardiovascular disease (Review).Exp Ther Med. (2024) 28:427. 10.3892/etm.2024.12716
28.
MerraGNoceAMarroneGCintoniMTarsitanoMCapacciAet alInfluence of mediterranean diet on human gut microbiota.Nutrients. (2020) 13:7. 10.3390/nu13010007
29.
WuHChiouJ. Potential benefits of probiotics and prebiotics for coronary heart disease and stroke. Nutrients. (2021) 13:2878. 10.3390/nu13082878
30.
SearleSMitnitskiAGahbauerEGillTRockwoodK. A standard procedure for creating a frailty index.BMC Geriatr. (2008) 8:24. 10.1186/1471-2318-8-24
31.
KaseBLieseAZhangJMurphyEZhaoLSteckS. The development and evaluation of a literature-based dietary index for gut microbiota.Nutrients. (2024) 16:1045. 10.3390/nu16071045
32.
ZhangXYangQHuangJLinHLuoNTangH. Association of the newly proposed dietary index for gut microbiota and depression: The mediation effect of phenotypic age and body mass index.Eur Arch Psychiatry Clin Neurosci. (2025) 275:1037–48. 10.1007/s00406-024-01912-x
33.
AhluwaliaNDwyerJTerryAMoshfeghAJohnsonC. Update on NHANES dietary data: Focus on collection, release, analytical considerations, and uses to inform public policy.Adv Nutr. (2016) 7:121–34. 10.3945/an.115.009258
34.
FanJYuCGuoYBianZSunZYangHet alFrailty index and all-cause and cause-specific mortality in Chinese adults: A prospective cohort study.Lancet Public Health. (2020) 5:e650–60. 10.1016/S2468-2667(20)30113-4
35.
BrooksJTitusABruceMOrzechowskiNMackenzieTBartelsSet alDepression and handgrip strength among U.S. adults aged 60 years and older from NHANES 2011-2014.J Nutr Health Aging. (2018) 22:938–43. 10.1007/s12603-018-1041-5
36.
IranpourSSabourS. Inverse association between caffeine intake and depressive symptoms in US adults: Data from national health and nutrition examination survey (NHANES) 2005-2006.Psychiatry Res. (2019) 271:732–9. 10.1016/j.psychres.2018.11.004
37.
National Center for Health Statistics.National Health and Nutrition Examination Survey 2011-2012 Data Documentation, Codebook, and Frequencies. (2025). Available online at: https://wwwn.cdc.gov/Nchs/Data/Nhanes/Public/2011/DataFiles/demo_g.htm#Component_Description(accessed January 24, 2025).
38.
AinsworthBHaskellWWhittMIrwinMSwartzAStrathSet alCompendium of physical activities: An update of activity codes and MET intensities.Med Sci Sports Exerc. (2000) 32:S498–504. 10.1097/00005768-200009001-00009
39.
Rxq_drug. (2025). Available online at: https://wwwn.cdc.gov/Nchs/Data/Nhanes/Public/1988/DataFiles/RXQ_DRUG.htm#Appendix_1:_Multum_Lexicon_End-User_License_Agreement, (accessed April 12, 2025).
40.
UMLS.Multum MediSource Lexicon (MMSL) Source Information. (2025). Available online at: https://www.nlm.nih.gov/research/umls/rxnorm/sourcereleasedocs/mmsl.html, (accessed April 12, 2025).
41.
MaHWangXXueQLiXLiangZHeianzaYet alCardiovascular health and life expectancy among adults in the United States.Circulation. (2023) 147:1137–46. 10.1161/CIRCULATIONAHA.122.062457
42.
YaoZJiaXChenZZhangTLiXZhangLet alDietary patterns, metabolomics and frailty in a large cohort of 120 000 participants.Food Funct. (2024) 15:3174–85. 10.1039/d3fo03575a
43.
KongFHuaYZengBNingRLiYZhaoJ. Gut microbiota signatures of longevity.Curr Biol. (2016) 26:R832–3. 10.1016/j.cub.2016.08.015
44.
MondotSLepagePSeksikPAllezMTrétonXBouhnikYet alStructural robustness of the gut mucosal microbiota is associated with Crohn’s disease remission after surgery.Gut. (2016) 65:954–62. 10.1136/gutjnl-2015-309184
45.
YangJHouLWangAShangLJiaXXuRet alPrebiotics improve frailty status in community-dwelling older individuals in a double-blind, randomized, controlled trial.J Clin Invest. (2024) 134:e176507. 10.1172/JCI176507
46.
Dzięgielewska-GęsiakSWysockaEFatygaEMuc-WierzgońM. Relationship of SOD-1 activity in metabolic syndrome and/or frailty in elderly individuals.Metabolites. (2024) 14:514. 10.3390/metabo14090514
47.
BålsrudPUlvenSChristensenJOttestadIHolvenK. Inflammatory markers and frailty in home-dwelling elderly, a cross-sectional study.BMC Geriatr. (2024) 24:175. 10.1186/s12877-024-04690-2
48.
BålsrudPUlvenSOttestadIRetterstølKSchwabUHolvenK. Association between inflammatory markers, body composition and frailty in home-dwelling elderly: An 8-year follow-up study.Geroscience. (2024) 46:5629–41. 10.1007/s11357-024-01279-w
49.
RashidahNLimSNeohCMajeedATanMKhorHet alDifferential gut microbiota and intestinal permeability between frail and healthy older adults: A systematic review.Ageing Res Rev. (2022) 82:101744. 10.1016/j.arr.2022.101744
50.
CuiGLiSYeHYangYJiaXLinMet alGut microbiome and frailty: Insight from genetic correlation and mendelian randomization.Gut Microbes. (2023) 15:2282795. 10.1080/19490976.2023.2282795
51.
SunQXiaXHeF. Longitudinal association between Body mass index (BMI), BMI trajectories and the risk of frailty among older adults: A systematic review and meta-analysis of prospective cohort studies.Arch Gerontol Geriatr. (2024) 124:105467. 10.1016/j.archger.2024.105467
52.
DuanLXiaoMLiuSWuZChenRZengRet alAssociations between modifiable risk factors and frailty progression among individuals with pre-frailty.Exp Gerontol. (2024) 194:112494. 10.1016/j.exger.2024.112494
53.
YuanLChangMWangJ. Abdominal obesity, body mass index and the risk of frailty in community-dwelling older adults: A systematic review and meta-analysis.Age Ageing. (2021) 50:1118–28. 10.1093/ageing/afab039
54.
Sastourné-ArreyQMathieuMContrerasXMonferranSBourlierVGil-OrtegaMet alAdipose tissue is a source of regenerative cells that augment the repair of skeletal muscle after injury.Nat Commun. (2023) 14:80. 10.1038/s41467-022-35524-7
55.
BuchACarmeliESheferGKeinan-BokerLBernerYMarcusYet alCognitive impairment and the association between frailty and functional deficits are linked to abdominal obesity in the elderly.Maturitas. (2018) 114:46–53. 10.1016/j.maturitas.2018.05.009
56.
AnSQinJGongXLiSDingHZhaoXet alThe mediating role of body mass index in the association between dietary index for gut microbiota and biological age: A study based on NHANES 2007-2018.Nutrients. (2024) 16:4164. 10.3390/nu16234164
Summary
Keywords
diet, gut microbiota, frailty, mediation, body mass index, NHANES
Citation
Lei J, Feng T, Tian T, Zhuang Z, Zhang G, Liu Y, Yang Z, Wang Y, Zhang X, Sun W and Wang J (2025) Association between the dietary index for gut microbiota and frailty: the mediating role of body mass index. Front. Nutr. 12:1573199. doi: 10.3389/fnut.2025.1573199
Received
08 February 2025
Accepted
25 June 2025
Published
18 July 2025
Volume
12 - 2025
Edited by
Eric Gumpricht, Independent Researcher, Gilbert, AZ, United States
Reviewed by
Ziye Huang, The Second Affiliated Hospital of Kunming Medical University, China
Junjie Yao, Changchun University of Chinese Medicine, China
Updates
Copyright
© 2025 Lei, Feng, Tian, Zhuang, Zhang, Liu, Yang, Wang, Zhang, Sun and Wang.
This is an open-access article distributed under the terms of the Creative Commons Attribution License (CC BY). The use, distribution or reproduction in other forums is permitted, provided the original author(s) and the copyright owner(s) are credited and that the original publication in this journal is cited, in accordance with accepted academic practice. No use, distribution or reproduction is permitted which does not comply with these terms.
*Correspondence: Xin Zhang, zhangxin800705@163.comWei Sun, sunwei8677@126.comJiahe Wang, wangjhcmusj@163.com
†These authors have contributed equally to this work and share first authorship
Disclaimer
All claims expressed in this article are solely those of the authors and do not necessarily represent those of their affiliated organizations, or those of the publisher, the editors and the reviewers. Any product that may be evaluated in this article or claim that may be made by its manufacturer is not guaranteed or endorsed by the publisher.