 Mengli Yao1
 Jia Liu1Fang Zhou1Haizhi Li1Ruoyong Wang2
 Zhong Han3
 Jie Liu4
 Wei Chen5Guoyu Liu1Shuheng Yang1Shenlin Duan1
 Xiaofeng Han1*Peng Yuan1*
- 1China National Research Institute of Food and Fermentation Industries Co., Ltd., Beijing, China
- 2Air Force General Hospital PLA, Beijing, China
- 3School of Food Science and Engineering, South China University of Technology, Guangzhou, China
- 4Key Laboratory of Geriatric Nutrition and Health, Beijing Technology and Business University, Ministry of Education, Beijing, China
- 5Peking Union Medical College Hospital, Beijing, China
Introduction: Polyphenol-rich sugarcane extract (PRSE) contains bioactive compounds with potential hypoglycemic properties, but its direct interaction with α-glucosidase has not been explored.
Methods: This study investigated the inhibitory mechanism of PRSE on α-glucosidase using enzyme kinetics. Bioactive compounds with α-glucosidase-binding affinity were identified through biolayer interferometry-mass spectrometry (BLI-MS), and the binding mechanisms were further explored via molecular docking analysis.
Results and discussion: PRSE was found to inhibit α-glucosidase through a mixed-type mechanism. A total of 29 compounds, including 4 coumarins, 9 phenolic acids, and 16 flavonoids, were identified in the PRSE dissociation solution. Representative compounds included coumarin, kaempferol, apigenin 7-o-neohesperidoside, and vicenin 3. Notably, apigenin 7-o-neohesperidoside and vicenin 3 were identified for the first time as potential α-glucosidase inhibitors.These compounds interacted with key residues of α-glucosidase, such as Asp and Glu, via hydrogen bonding, π-anion interactions, and hydrophobic forces. These findings suggest that PRSE could serve as a promising natural source of α-glucosidase inhibitors. The application of BLI-MS proved effective for screening target bioactive compounds in plant extracts. PRSE may have potential applications in functional foods for postprandial glycemic control and type 2 diabetes prevention.
1 Introduction
Controlling the postprandial rise in blood glucose levels is essential for the prevention of diabetes (DM) and its complications. The two glycoside hydrolases, α-amylase and α-glucosidase, play pivotal roles in regulating the digestion and absorption of carbohydrates (1, 2). Specifically, α-glucosidase hydrolyzes the glycosidic bonds at the non-reducing ends of oligosaccharides to release glucose. Inhibiting its activity can effectively delay glucose release, making it a promising strategy for controlling postprandial blood glucose (3). Acarbose, miglitol, and voglibose are commonly used α-glucosidase inhibitors in the clinical treatment of DM; however, due to their side effects, there is an urgent need to identify new plant-derived therapeutic agents for DM management (4, 5).
Plant extracts have long been recognized as valuable resources in drug development. Since 1981, approximately two-thirds of new small-molecule drugs have been derived from plant extracts, their derivatives, or mimics (6, 7). Exploring active components in plant extracts and elucidating their bioactivities has become a hot topic in pharmaceutical research (7, 8). Among these, polyphenolic compounds found in plant extracts have gained significant attention in drug development due to their rich bioactivities (9). Studies have shown that polyphenolic compounds, such as apigenin, rutin, kaempferol, and curcumin, exhibit significant inhibitory effects on α-glucosidase. Compared to clinical drugs like acarbose, natural inhibitors have the advantage of fewer side effects (7).
Recent studies have highlighted sugarcane and its byproducts, such as molasses and bagasse, as promising natural sources rich in polyphenolic compounds with significant bioactivities (10–12). Several investigations have explored the hypoglycemic effects of polyphenol-rich sugarcane extract (PRSE) and its underlying mechanisms. For instance, Zheng et al. (10) identified phenolic compounds such as tricin 4-O-guaiacylglyceryl ether-7-O-glucopyranoside, genistin, p-coumaric acid, and quercetin from 30% sugarcane bagasse extract using UHPLC-HR-TOFMS. These compounds were confirmed to exhibit hypoglycemic and enzyme inhibitory effects. Similarly, Zhao et al. (13) analyzed sugarcane bagasse extracts via HPLC and identified major phenolic acids, including gallic acid, ferulic acid, coumaric acid, and chlorogenic acid, which also displayed hypoglycemic activity. Additionally, Deseo et al. (14) utilized LC-MS to detect flavonoids in sugarcane molasses, including apigenin-C-glycosides, methoxyluteolin-C-glycosides, and tricin-O-glycosides, which were considered potential α-glucosidase inhibitors. Collectively, these studies demonstrate that polyphenolic compounds in sugarcane and its byproducts hold considerable promise as natural agents for controlling blood glucose levels, providing new avenues for diabetes treatment.
While the hypoglycemic effects of PRSE are well-documented, the precise mechanisms by which it inhibits α-glucosidase remain unclear.. To investigate this, the present study combines biolayer interferometry (BLI) and mass spectrometry (MS). BLI, a label-free detection technique based on optical interference,.enables real-time monitoring of molecular interactions. However, identifying specific molecules within complex mixtures poses challenge (6). By integrating BLI with MS (BLI-MS), this approach enhances detection sensitivity and specificity, making it particularly advantageous for high-throughput screening of bioactive compounds in natural products (15, 16).
This study systematically investigated the inhibitory kinetics of PRSE against α-glucosidase. Active inhibitors were identified using BLI-MS, and molecular docking revealed their mechanisms of action. These methods provide an efficient framework for screening bioactive compounds in plant extracts. The identification of natural α-glucosidase inhibitors in PRSE highlights its potential as a promising, low-side-effect alternative for managing type 2 diabetes, with applications in functional foods and dietary supplements.
2 Materials and methods
2.1 Materials and chemicals
Polyphenol-rich sugarcane extract (PRSE) was procured from Qingyunshan Pharmaceutical Co., Ltd., China. α-Glucosidase (32.4 U/mg, from Saccharomyces cerevisiae) was sourced from Shanghai Yuanye Biotechnology Co., Ltd., China. G-MM-IGT biotin (Genemor) was obtained from Jiangsu Lesai Biotechnology Co., Ltd., China. SSA biosensors for biolayer interferometry (BLI) analysis were procured from Sartorius, Germany. P-Nitrophenyl α-D-glucopyranoside (PNPG), acarbose, gallic acid, and rutin were acquired from Sigma-Aldrich Co., Ltd., United States, and Tween 20 from Beyotime Biotechnology Co., Ltd., China. All other chemicals were of analytical grade, and freshly prepared ultrapure water was used in all experiments.
2.2 Determination total flavonoid content (TFC)
The total flavonoid content was determined based on the method described by Zheng et al. (17), with minor modifications to sample concentration and reaction volumes to better suit the PRSE matrix. Briefly, a standard curve was prepared by dissolving 24.1 mg of rutin in 60% ethanol and diluting it to 50 mL (482 μg/mL); the solution was stored at 4°C. Aliquots of 0.2, 0.4, 0.6, 0.8, and 1.0 mL were taken, followed by the addition of 150 μL sodium nitrite and incubation for 6 min. Subsequently, 150 μL of 10% Al(NO3)3 was added, and the mixture was incubated for another 6 min. Finally, 2 mL of 4% NaOH was added, and the mixture was diluted to 5 mL with 60% ethanol, mixed, and incubated for 15 min before measuring the absorbance at 510 nm. A 1 mL aliquot of the PRSE solution (2 mg/mL) was treated using the same procedure, and the absorbance was used to calculate the flavonoid content based on the rutin standard curve.
2.3 Determination total phenolic content (TPC)
The total phenolic content was determined based on the method described by Zheng et al. (17), with minor modifications to reagent concentrations, reaction times, and sample preparation to accommodate the PRSE matrix. A 1 mg/mL gallic acid stock solution was prepared, and aliquots of 0.1–0.6 mL were diluted to 10 mL with ultrapure water to prepare working solutions of 10–60 μg/mL. For each working solution and the PRSE sample (2 mg/mL), 1 mL was mixed with 5 mL of 10% Folin–Ciocalteu reagent, vortexed, and allowed to stand for 6 min to ensure full color development. Subsequently, 4 mL of 7.5% Na2CO3 solution was added, and the mixture was left to stand for 40 min. The addition of sodium carbonate created an alkaline environment (pH > 10), which is optimal for the redox reaction between phenolic compounds and the Folin–Ciocalteu reagent. Absorbance was measured at 765 nm, and the total phenolic content was calculated using the gallic acid standard curve.
2.4 α-Glucosidase inhibition assay
The method described by Ren et al. (18) was modified slightly for this study, with adjustments to the PRSE solution concentrations and incubation time to better suit the experimental setup. Specifically, a 200 μL aliquot of PRSE solution at different concentrations (10, 20, 30, 40, 60, and 120 μg/mL) was mixed with 200 μL of α-glucosidase working solution, and the mixture was incubated at 37°C for 5 min. Subsequently, 200 μL of PNPG (2.5 mmol/L) was added and mixed thoroughly, followed by incubation at 37°C for an additional 15 min. The reaction was then terminated by adding 800 μL of Na2CO3 (0.2 mol/L). A 200 μL aliquot of the reaction mixture was transferred to a 96-well plate, and the absorbance at 405 nm was measured using a microplate reader. Acarbose, at concentrations of 0.01, 0.015, 0.02, 0.025, and 0.03 μg/mL, was used as a positive control. Each sample was tested in triplicate. The α-glucosidase inhibition rate was determined using Equation 1:
2.5 α-Glucosidase inhibition kinetics
Following the method of Sun et al. (19) with slight modifications, the substrate concentration (PNPG) was fixed at 2.5 mmol/L, while α-glucosidase concentrations were adjusted to 0.2, 0.4, 0.6, 0.8, and 1.0 U/mL. Initial reaction rates (ΔOD/min) were measured across varying PRSE concentrations (0, 60, 120, 200 μg/mL), and a rate vs. enzyme concentration curve was constructed to evaluate the reversibility of PRSE’s inhibition of α-glucosidase.
To determine the inhibition type and constants, Lineweaver-Burk plots were employed. With α-glucosidase fixed at 1.5 U/mL, PNPG concentrations were varied (0.5, 1.0, 2.0, 2.5, and 5.0 mmol/L), and reaction rates (ΔOD/min) were recorded at PRSE concentrations of 0, 10, 20, 50, and 60 μg/mL. The α-glucosidase concentration (1.5 U/mL) was selected based on preliminary experiments to ensure sufficient enzymatic activity within the linear range of detection, while PRSE concentrations were chosen to represent a range from low to high inhibition levels observed in prior dose–response assays. The reciprocal of initial reaction rates (1/V) was plotted against the substrate concentrations (1/S), and the Michaelis constant (Km) and maximum velocity (Vmax) were derived to classify the inhibition type (Equation 2).
Where, V is the initial reaction velocity; [I] is the concentration of PRSE.
The inhibition constants of PRSE for the free enzyme (KI) and for the enzyme-substrate complex (KIS) were derived from Equations 3 and Equations 4.
2.6 Biolayer interferometry
Based on the methods of Guo et al. (15) and Zhou et al. (20), with slight modifications, BLI kinetic analysis and fishing experiments were performed for PRSE, as illustrated in Figure 1. α-Glucosidase (2 mg/mL) was dissolved in PBS and biotinylated using the G-MM-IGT reagent. The biotinylated enzyme solution with the highest concentration was collected for further testing. In a 96-well plate, 200 μL PBS was added to the B1 wells for baseline1 signal recording, and 200 μL of the biotinylated α-Glu solution was added to the L wells. Baseline1 (60 s) and Loading (300 s) were performed to immobilize α-Glu onto the SSA sensor, and the immobilization signal was recorded. For kinetic analysis, 200 μL of PRSE solutions at different concentrations (200, 300, 400, 500, 600 μg/mL) were added to the S wells in the first row, while PBS was added to the B1 wells in the second row as a blank control. The process included baseline1 (30 s) and association (300 s), and the association signals were recorded.
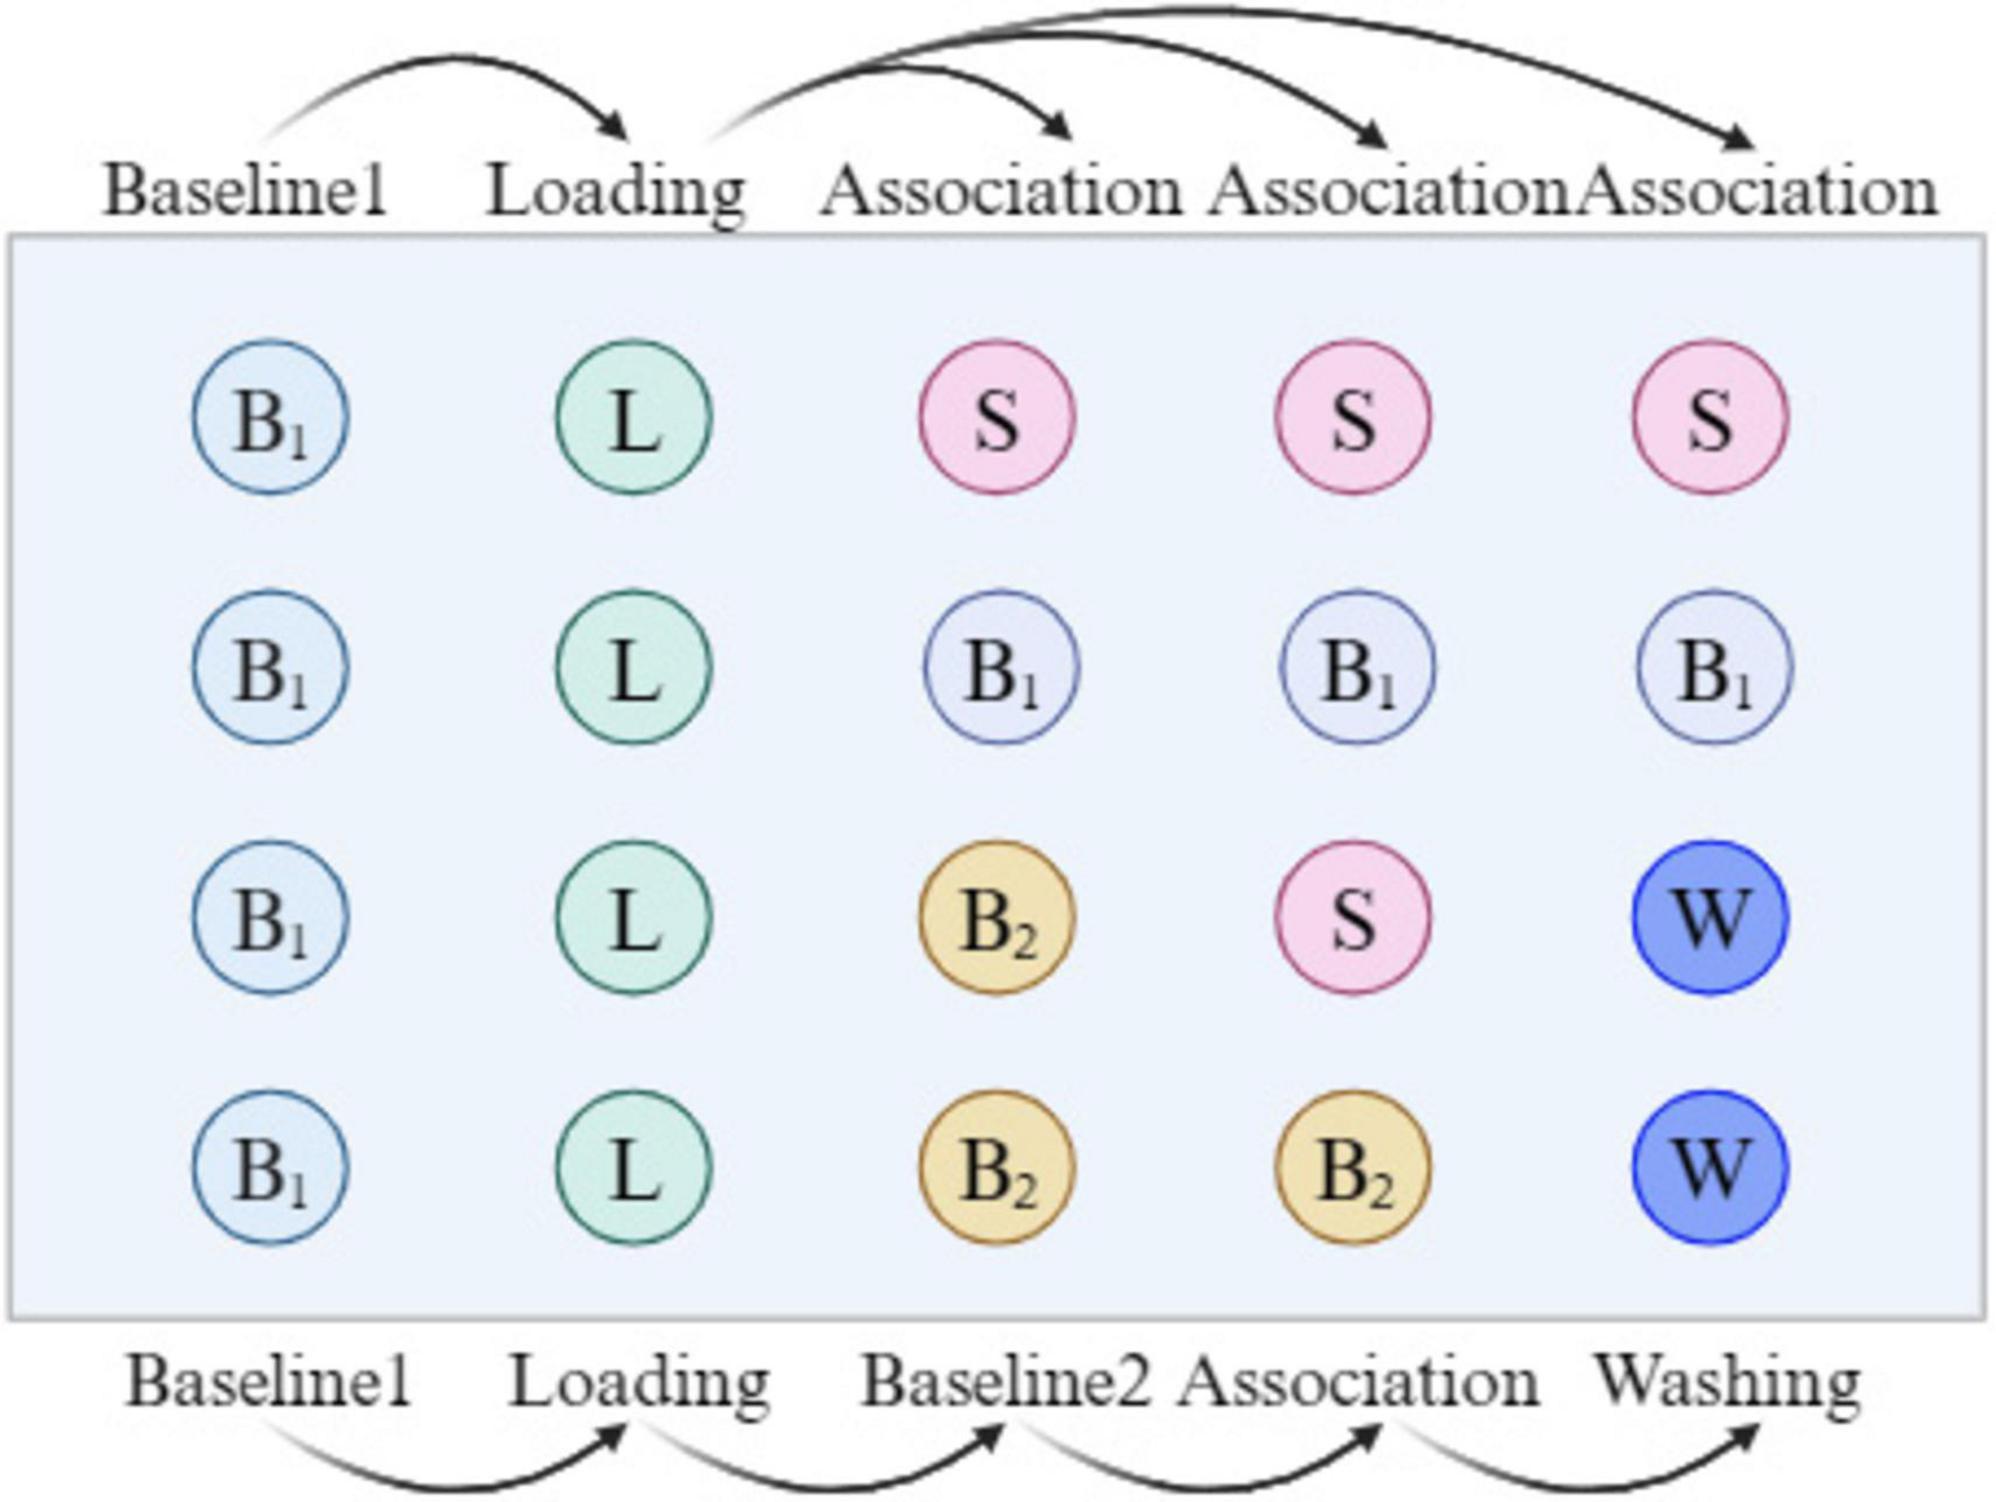
Figure 1. A brief flow chart of the BLI experiment.
In the fishing experiment for active compounds, 200 μL PBS (containing 0.1% Tween 20) was added to the B2 wells in the 3rd and 4th rows, while 200 μL of PRSE solution (2 mg/mL in 0.1% Tween 20 PBS) was added to the S wells in the 3rd row, and 200 μL of 0.1% formic acid was added to the W wells in the 3rd and 4th rows for washing. A total of 30 cycles were conducted, including baseline2 (30 s), association (300 s), and washing (20 s), to complete the fishing of active compounds. Data were collected and analyzed using the ForteBio Octet system (version 11.x). The eluates without PRSE were defined as S1, the eluates with PRSE as S2, and thePRS solutions not subjected to BLI as S3. Each group was tested in triplicate.
2.7 MS analysis
The S1, S2, and S3 sample groups were analyzed using an ultra-high-performance liquid chromatography (UHPLC) system. Analysis was performed on a Vanquish UHPLC system (Thermo Fisher Scientific) with a Phenomenex Kinetex C18 column (2.1 mm × 50 mm, 2.6 μm) for chromatographic separation of target compounds. The mobile phases consisted of an aqueous phase (Phase A, containing 0.01% acetic acid) and an organic phase (Phase B, isopropanol : water = 1:1, v/v). The sample tray was maintained at 4°C, and the injection volume was set to 2 μL. After chromatographic separation, primary and secondary mass spectrometric data were collected using an Orbitrap Exploris 120 mass spectrometer controlled by Xcalibur software (version 4.4, Thermo Fisher Scientific). MS parameters were set as follows: Sheath gas flow rate, 50 Arb; auxiliary gas flow rate, 15 Arb; capillary temperature, 320°C; full-scan MS resolution, 60,000; MS/MS resolution, 15,000; collision energy set at stepped normalized collision energy levels of 20/30/40; and spray voltage of 3.8 kV in positive mode and –3.4 kV in negative mode.
2.8 Calculation of the relative binding amount
The relative binding amount (RBA) was calculated after analyzing the samples using BLI and UHPLC. The analysis involved three solutions: The dissociation buffer of the PRSE-free solution (PBS + 0.1% Tween 20) after BLI analysis (S1), the dissociation buffer of the PRSE solution after BLI analysis (S2), and the PRSE solution without BLI analysis (S3). Compounds detected in both S2 and S3 but absent in S1, based on mass spectrometry analysis, were identified as potential PRSE compounds with binding affinity to α-glucosidase. The calculation formula is provided in Equation 5.
2.9 Molecular docking
Molecular docking simulations were conducted following the modified method of Lin, involving the potential compounds (structures shown in Supplementary Figure S1) and α-glucosidase (PDB ID 3AJ7, derived from S. cerevisiae) (21). The selected compounds represent key bioactive constituents identified or predicted from PRSE, based on previous reports and preliminary fishing results. The 2D structures of these PRSE-derived compounds were generated using ChemDraw, converted to 3D in Chem3D, and subjected to hydrogen atom addition, charge assignment, and energy minimization before being saved as mol2 files. The α-glucosidase crystal structure was retrieved from the PDB database. Water molecules were removed, and hydrogen atoms and charges were added using AutoDock, after which the structure was saved as pdbqt files. Docking simulations were carried out using default parameters to determine the lowest binding free energy. Discovery Studio 4 was utilized for the visualization of protein-ligand interactions.
2.10 Statistical analysis
All experimental data were measured in triplicate and reported as the mean ± standard deviation (n = 3). Graphs were generated using Origin Pro 9.0 and GraphPad Prism 9.0 software.
3 Results and discussion
3.1 TPC and TFC of PRSE
Polyphenolic compounds are well-documented for their diverse biological activities, particularly in glycemic regulation. Polyphenols are categorized into flavonoids, phenolic acids, stilbenes, and lignins based on the number of phenolic rings and structural variations (22). Studies have demonstrated that polyphenols mitigate postprandial blood glucose elevation through multiple mechanisms, such as inhibiting α-amylase and α-glucosidase activities, suppressing intestinal glucose absorption, stimulating insulin secretion, and reducing hepatic glucose output (23). Li et al. (24) demonstrated that mung bean polyphenols, including quinic acid, apigenin, and vitexin, exhibit significant in vitro inhibitory effects on α-glucosidase and effectively lower blood glucose levels while improving insulin resistance in type 2 diabetic mice. Similarly, Chen et al. (25) reported that active plant compounds, including flavonoids, alkaloids, polysaccharides, and polyphenols, form the molecular basis for the hypoglycemic effects of mulberries.
PRSE was found to be rich in phenolic acids and flavonoids, with TFC of 53.8 ± 1.6 mg CE/g and TPC of 218.3 ± 2.4 mg GAE/g (Table 1), exceeding or comparable to values reported for other sugarcane extracts. Deseo et al. (14) reported a TPC of 205 mg GAE/g and a TFC of 55 mg CE/g in ethanol extracts of sugarcane molasses, while Ji et al. (11) observed a TPC exceeding 200 mg GAE/g in hydrophobic sugarcane molasses extracts. These abundant polyphenvolic compounds likely contribute to PRSE’s inhibitory activity against α-glucosidase, aligning with hypoglycemic mechanisms observed in other plant extracts and reinforcing PRSE’s potential as a hypoglycemic agent (26). In addition to postprandial glucose regulation, such compounds may also support broader aspects of glucose metabolism, including improved insulin sensitivity and reduced glucose absorption.
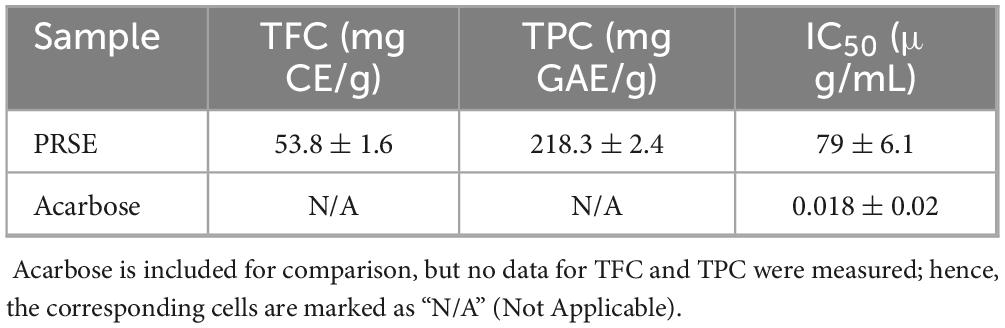
Table 1. TPC and TFC of PRSE and its inhibitory activity on α-Glucosidase.
3.2 Inhibition of α-glucosidase
This study assessed the inhibitory activity of PRSE against α-glucosidase, with acarbose serving as the positive control. Acarbose exhibited strong α-glucosidase inhibition, with an IC50 of 0.021 ± 0.02 μg/mL (Table 1). In comparison, PRSE showed notable inhibition, with an IC50 of 79 ± 6.1 μg/mL (27).
Initial reaction velocities plotted against enzyme concentrations (Figure 2A) showed lines intersecting at the origin, with slopes decreasing as PRSE concentrations increased. These findings indicate that PRSE exerts reversible inhibition by reducing enzyme activity without affecting the amount of active enzyme, which is consistent with the inhibition patterns observed for other plant extracts (21). In reversible inhibition, increasing the enzyme concentration can restore reaction velocity proportionally, which is consistent with the observed linearity through the origin—indicating that the inhibitor does not permanently inactivate the enzyme (28). The Lineweaver-Burk double-reciprocal plot (Figure 2B; Table 2) revealed that increasing PRSE concentrations reduced Vmax and Km, indicating enhanced enzyme-substrate affinity. Furthermore, the intersection of all lines in the third quadrant indicates a mixed-type inhibition mechanism. This inhibition mechanism is consistent with that observed for polyphenols from mung bean hull dietary fiber and passion fruit peel, which also target α-glucosidase (18, 19, 29).
![Graph A shows the reaction velocity (V, ΔOD/min) against α-glucosidase concentration (U/mL) with four lines representing concentrations of 0, 60, 120, and 200 µg/mL. Graph B is a Lineweaver-Burk plot, displaying 1/V against 1/[S] (L/mmol) with lines for 0, 10, 20, and 30 µg/mL concentrations. Two smaller graphs below show y-intercept variations against concentrations [I] in µg/mL.](https://www.frontiersin.org/files/Articles/1575409/fnut-12-1575409-HTML/image_m/fnut-12-1575409-g002.jpg)
Figure 2. The inhibitory effect of PRSE on α-glucosidase. (A) Kinetic curve of the inhibitory effect of PRSE on α-glucosidase; (B) Lineweaver-Burk plot of the inhibitory effect of PRSE on α-glucosidase. The inset shows the relationship between the slope (C) and the Y-intercept (D) with PRSE concentration.
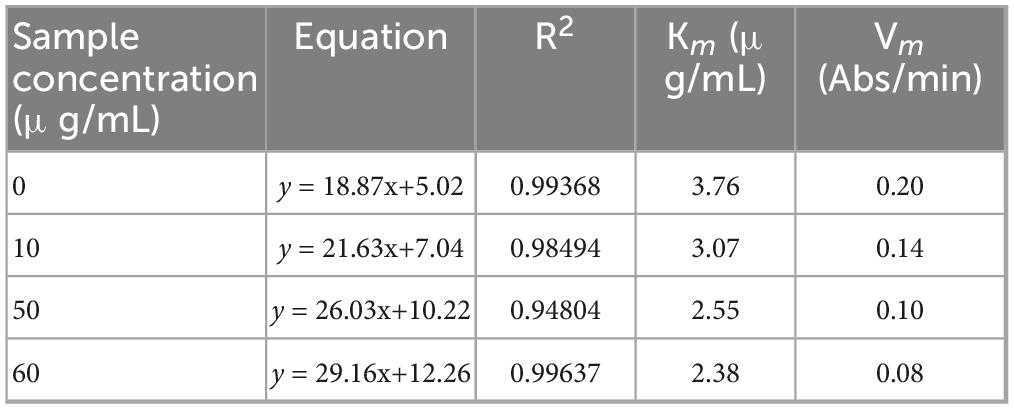
Table 2. Inhibition kinetics parameters of α-glucosidase by PRSE.
Secondary fitting curves derived from Lineweaver-Burk slope and intercept data (Figures 2C,D) produced binding constants of PRSE for the free enzyme (KI) and enzyme-substrate complex (KIS) as 0.018 μg/mL and 0.20 μg/mL, respectively. These findings confirm PRSE’s strong α-glucosidase inhibitory activity and show its higher binding affinity to the enzyme-substrate complex than to the free enzyme (30). R2 values of 0.9862 and 0.9796, derived from linear regression analysis, suggest a relatively simple binding mode between PRSE and the enzyme, likely involving a primary binding site (17). In conclusion, PRSE demonstrates potent α-glucosidase inhibition activity, highlighting its potential as a food-based source of α-glucosidase inhibitors (31).
3.3 Screening of α-glucosidase binding components in PRSE
This study further validated the interaction between PRSE and α-glucosidase by analyzing binding kinetics through real-time binding experiments. Association-dissociation curves showed a concentration-dependent increase in affinity between PRSE and α-glucosidase, confirming a direct and reversible interaction (Figure 3). Kinetic parameters — dissociation constant (KD), association rate constant (Kon), and dissociation rate constant (Kdis) — were calculated using ForteBio analysis software (version 11.x). The KD value quantifies the binding affinity between a sample and its target; lower KD values signify higher affinity, requiring less analyte to achieve 50% of maximum binding. Kon represents the binding rate; higher Kon values indicate faster and stronger binding. Kdis represents the dissociation rate; lower Kdis values suggest greater binding stability and reduced dissociation likelihood. Results revealed that PRSE and α-glucosidase exhibited a KD of 6.19 × 10⁻⁵μM, Kon of 2.12 × 10⁵ 1/M⋅s, and Kdis of 1.31 1/s (Table 3). These findings suggest that PRSE exhibits strong affinity, rapid binding, and stable interactions with α-glucosidase (15).
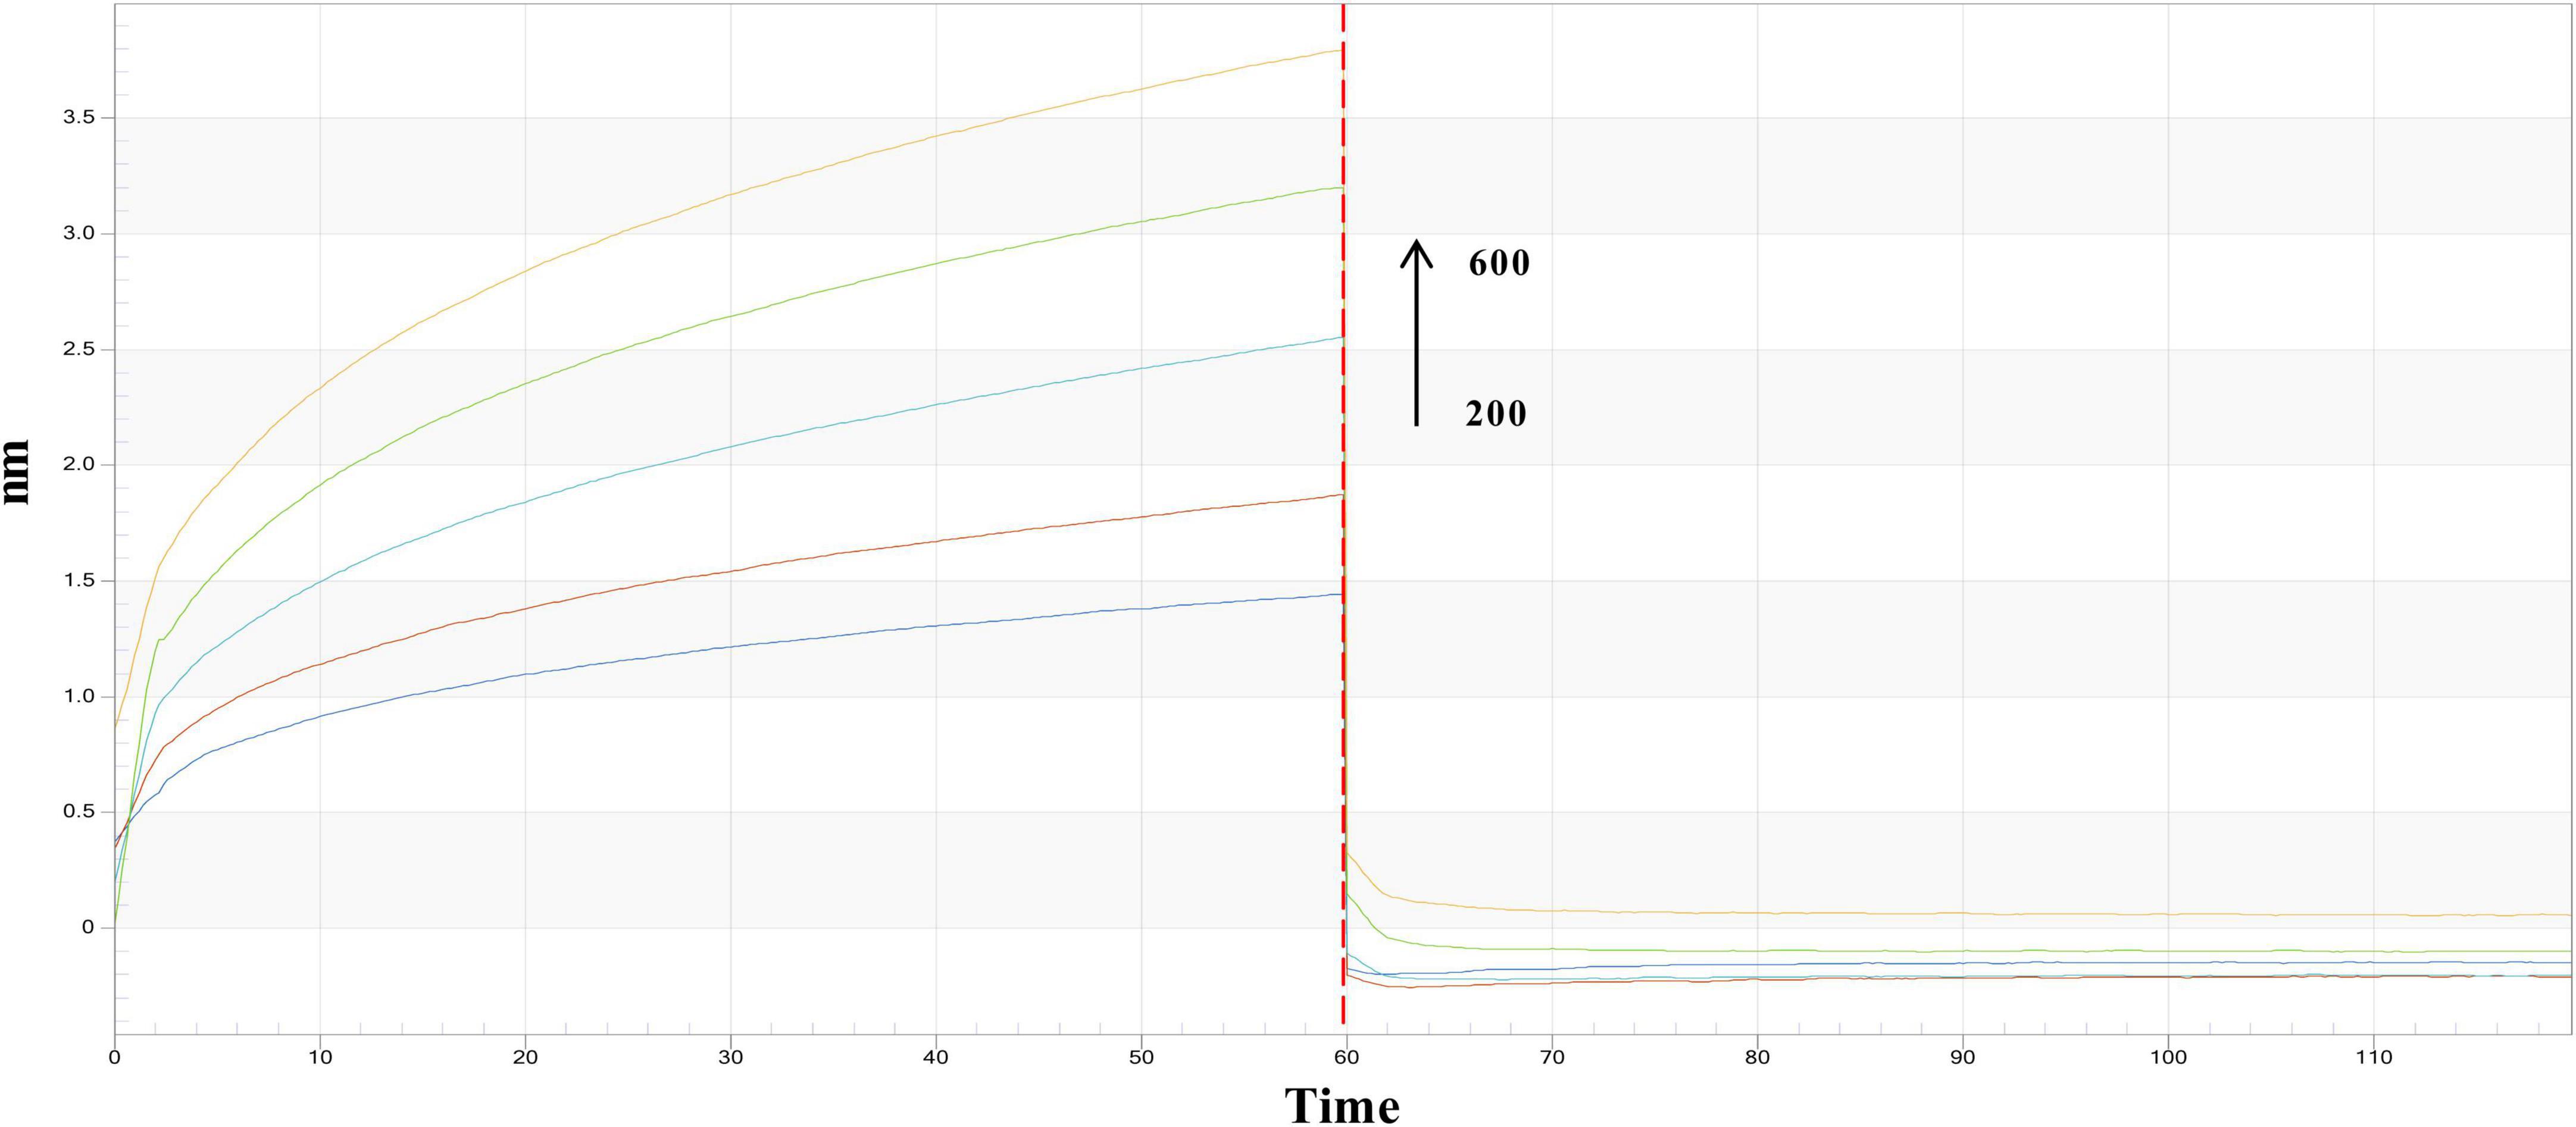
Figure 3. Real-time kinetic binding sensorgrams of different concentrations of PRSE increasing from 200 to 600 μg/mL are shown. Response (nm) indicates the optical thickness on the SSA biosensor layer.
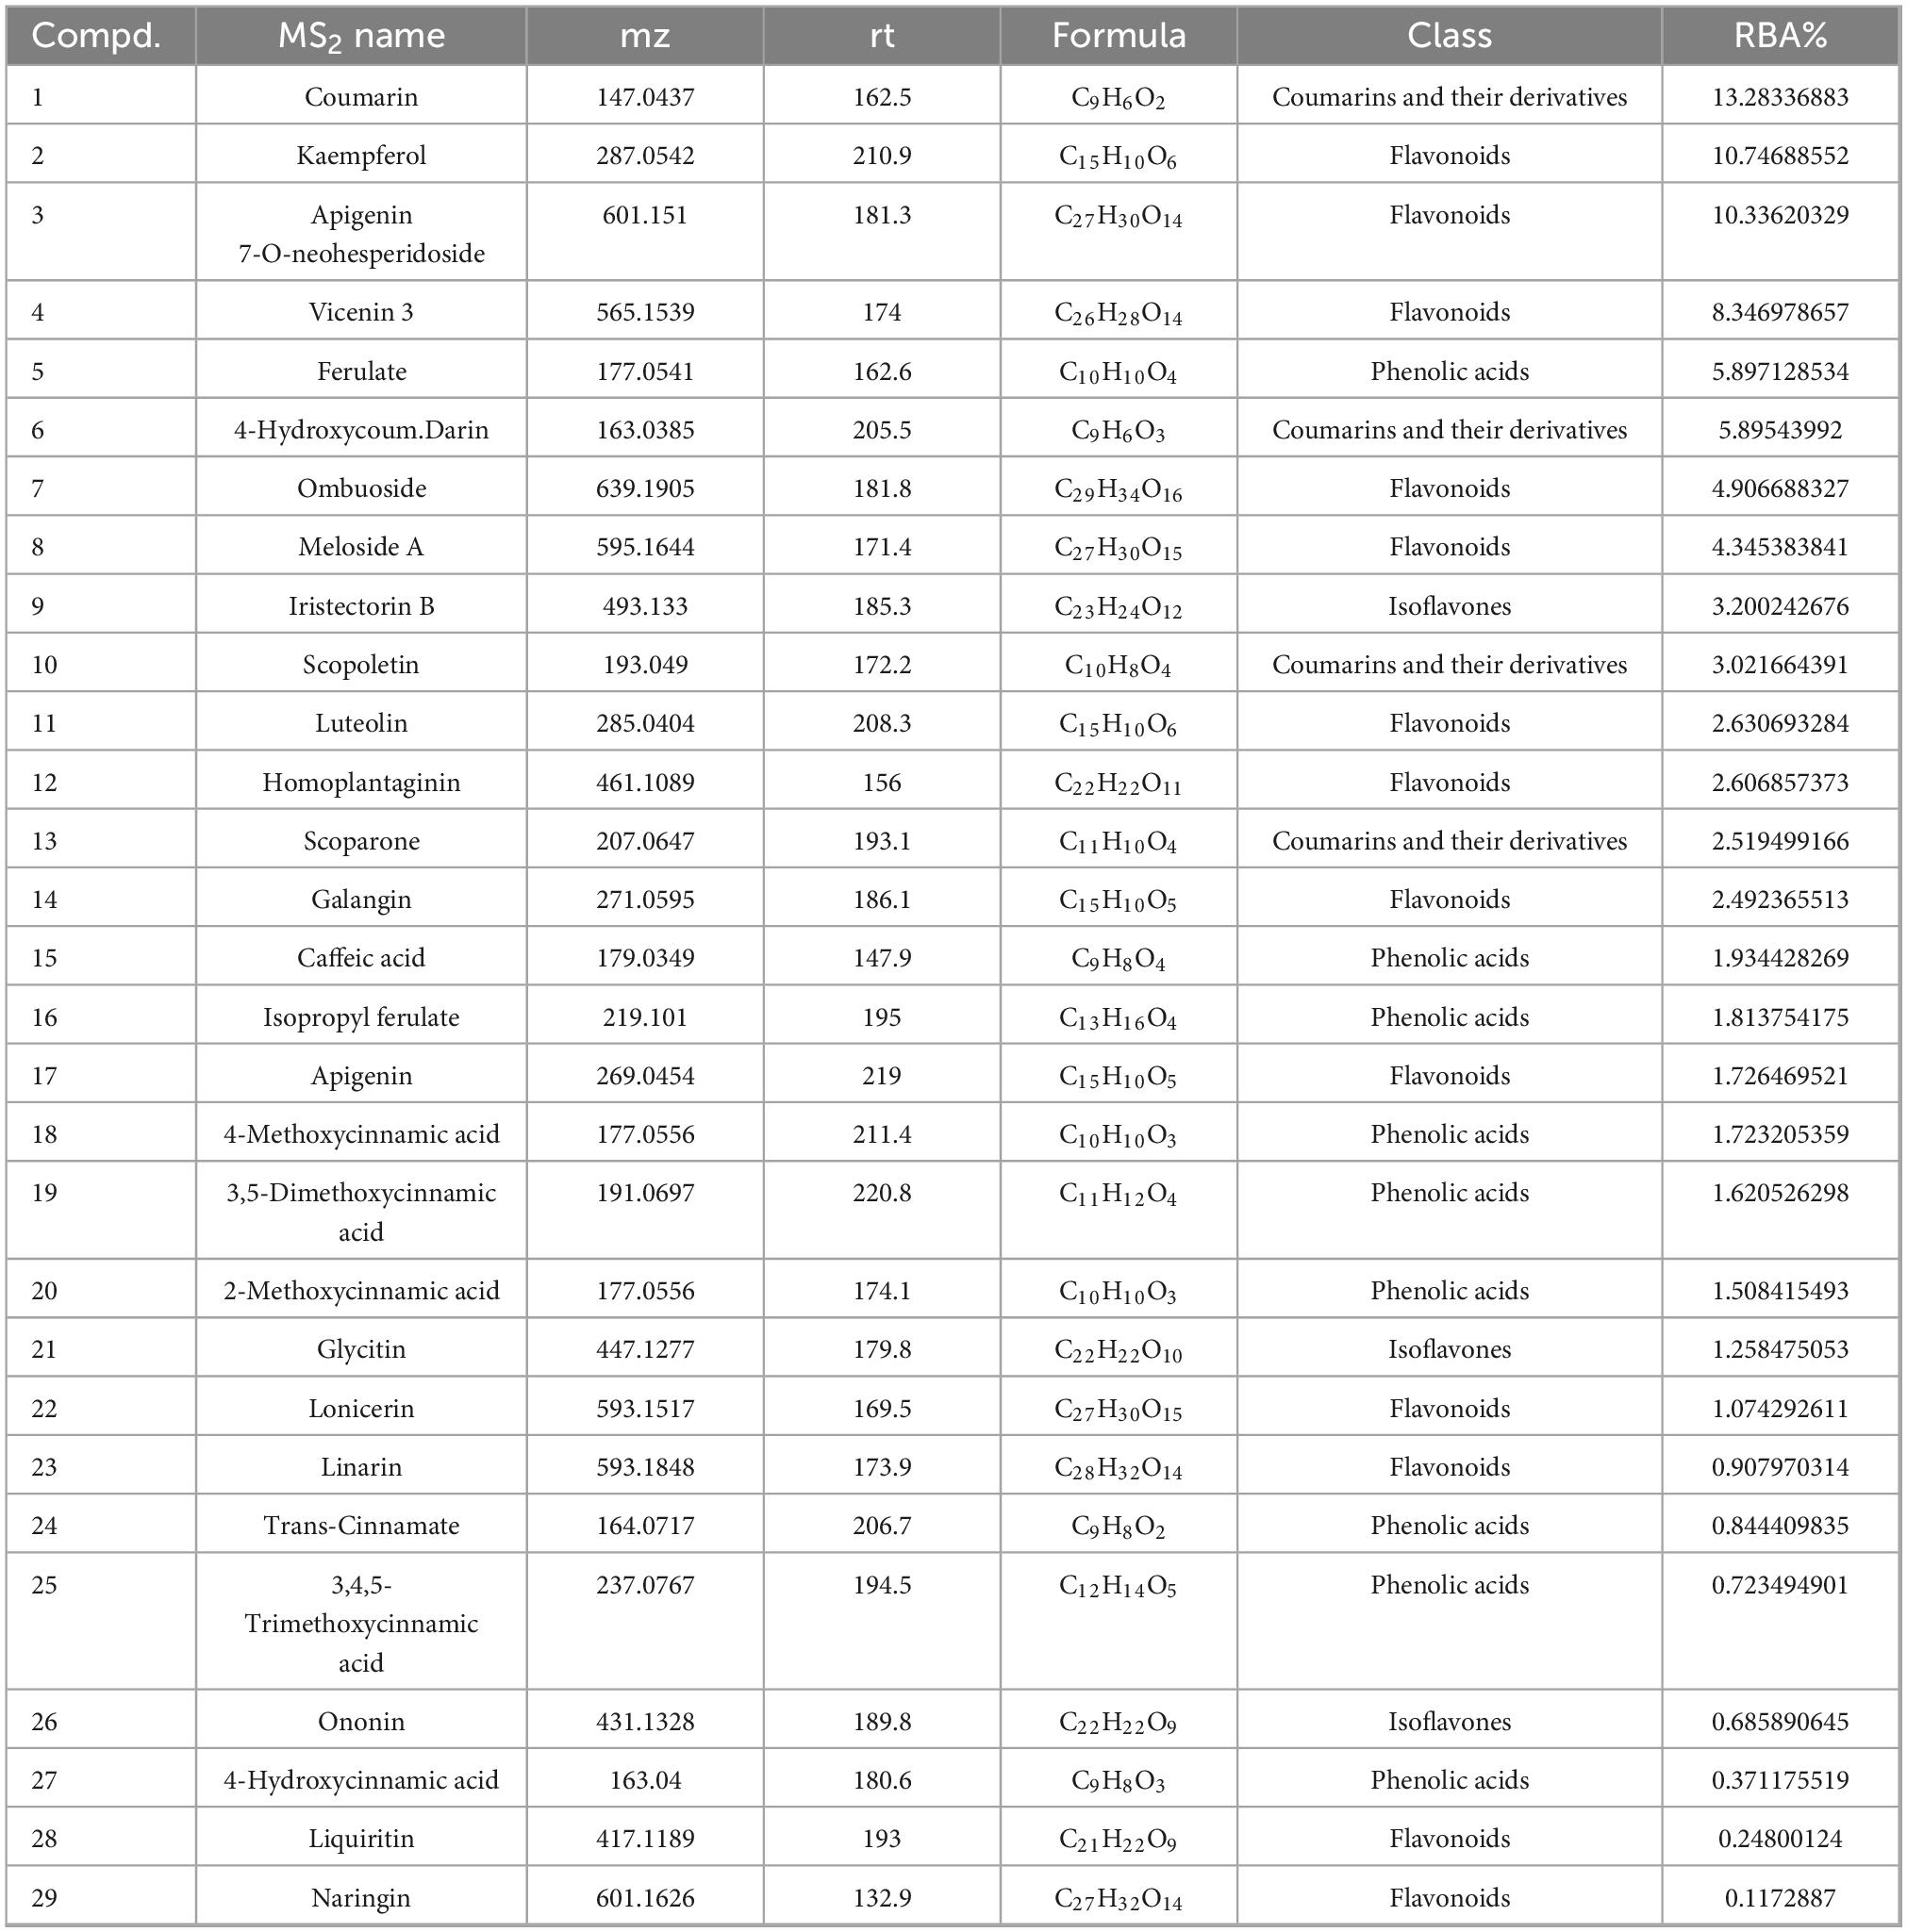
Table 3. The main detected components in PRSE and their RBA (%) with α-glucosidase.
3.4 MS analysis
This study hypothesized that active small molecules in PRSE bind to biotinylated α-glucosidase and are collected in the dissociation solution, whereas molecules lacking affinity remain in the original solution. The binding components were identified via mass spectrometry, using unprocessed PRSE solution (not analyzed by BLI) as a reference. Relative binding amounts (RBA) were calculated to screen potential α-glucosidase inhibitors, with higher RBA values indicating greater efficacy (15).
Table 3 lists the retention times, accurate masses, molecular weights, chemical nameds, molecular formulas, and RBA values of the detected components. A total of 29 compounds were identified in the PRSE dissociation solution, including 4 coumarins and their derivatives, 9 phenolic acids and their derivatives, and 16 flavonoids. Ten compounds with strong binding affinities (RBA > 3%) were selected, including Coumarin, Kaempferol, Apigenin 7-O-neohesperidoside, Vicenin 3, Ferulate, 4-Hydroxycoumarin, Ombuoside, Meloside A, and Iristectorin B (6).
Certain active compounds from PRSE have known α-glucosidase inhibitory activities. For instance, Coumarin and its derivatives are well-established α-glucosidase inhibitors (32, 33). Zhang et al. (32) reported several synthesized coumarin derivatives exhibiting significant α-glucosidase inhibition, with IC50 values below 0.1 μg/mL. Furthermore, flavonoids like Kaempferol, Ferulate, and Vitexin, and their derivatives, have been identified in Hibiscus pollen and Sophora-derived polyphenols, confirming their potential as α-glucosidase inhibitors (26, 27, 34). However, compounds like Apigenin 7-O-neohesperidoside, Vicenin 3, and Ombuoside have not been previously reported for α-glucosidase inhibitory activities. This study uniquely identified these compounds as potential inhibitors through the BLI-MS integrated approach, highlighting their novelty. These findings align with prior studies and expand PRSE’s chemical profile as a source of antidiabetic functional components.
3.5 Molecular docking
Molecular docking analysis was conducted to characterize the binding sites, binding energies, and interaction forces of the active compounds screened from PRSE with α-glucosidase (30, 35). Figure 4 shows the 3D and 2D docking results of the 10 active compounds with α-glucosidase. The docking results reveal that these small-molecule active compounds stabilize enzyme-ligand complexes by interacting with various amino acid residues (e.g., Asp, Glu, Tyr) within the α-glucosidase active pocket through van der Waals forces, hydrogen bonds, and carbon-hydrogen bonds (6).
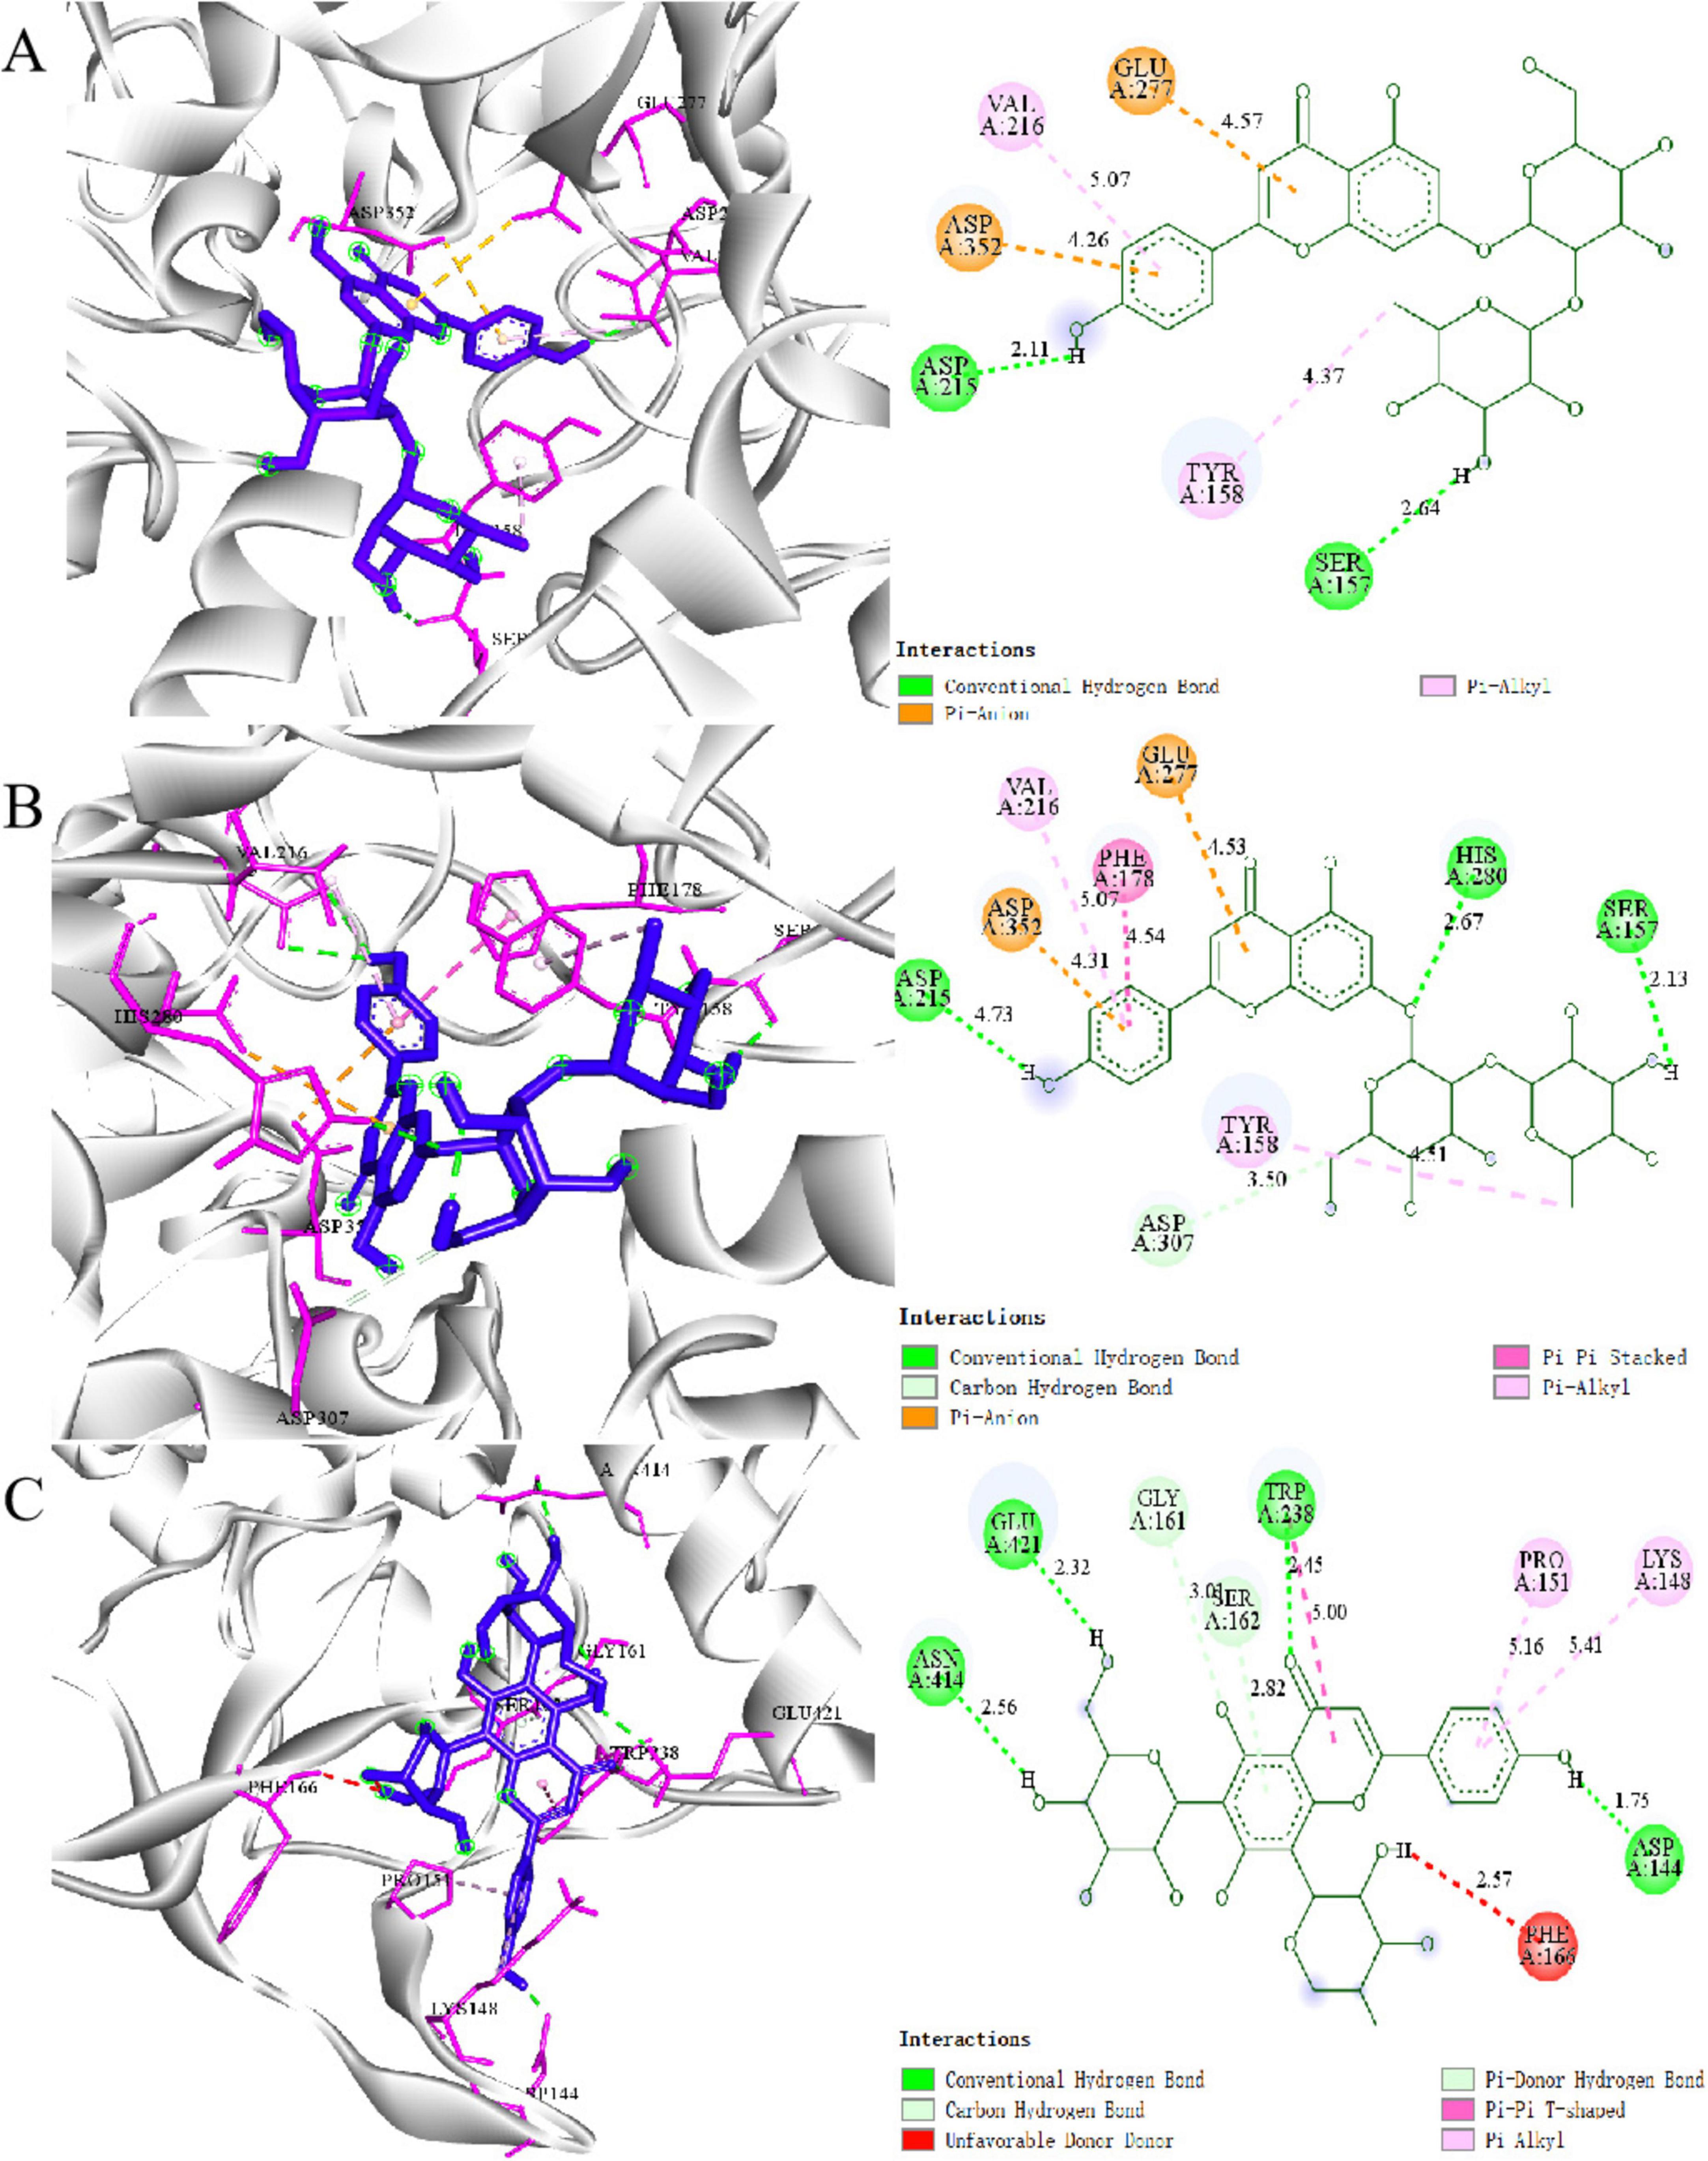
Figure 4. Molecular docking results: 2D and 3D structures of (A) Coumarin, (B) Apigenin 7-O-neohesperidoside, and (C) Vicenin 3 with α-glucosidas.
Coumarin widely reported for its α-glucosidase inhibitory effects in previous studies, was analyzed as a reference compound (Figure 4A). Coumarin primarily interacts with Asp215 and Sep157 through hydrogen bonds and stabilizes its binding to Glu277 and Asp352 via π-anion interactions. Its aromatic ring structure further enhances hydrophobic interactions with Val216 and Tyr158. These critical residues (e.g., Asp, Glu) align with those commonly reported in the literature as essential for enzyme-inhibitor interactions (18, 36).
Compounds such as Apigenin 7-O-neohesperidoside and Vicenin 3, which exhibited high RBA values in the mass spectrometry screening, have not been previously reported to interact with α-glucosidase. Apigenin 7-O-neohesperidoside interacts with Asp307, Arg315, and Glu277 at the enzyme’s active site through multiple hydrogen bonds. The glycosyl moiety further stabilizes the binding through hydrophobic interactions with surface residues of the enzyme (Figure 4B). Similarly, Vicenin 3 forms hydrogen bonds between its glycosyl moiety and Lys155 and Asp352, while its aglycone structure interacts with Glu277 and Asp215 in the active pocket via π-anion interactions (Figure 4C). And the molecular docking results of other compounds with α-glucosidase are shown in Supplementary Figure S2.
The binding affinities of the 10 active compounds with α-glucosidase ranged from –11.0 to –6.8 kcal/mol (Table 4). Among these, Coumarin demonstrated the strongest affinity for α-glucosidase, with the lowest binding energy. Apigenin 7-O-neohesperidoside and Vicenin 3 exhibited significant affinities, with binding energies of –10.9 and –8.3 kcal/mol, respectively. For comparison, the binding affinity of the standard α-glucosidase inhibitor acarbose with α-glucosidase is reported to be –8.1 kcal/mol (Supplementary Table S1). These findings suggest that the active compounds identified in PRSE exhibit similar or even stronger affinities than the standard inhibitor, highlighting their potential as α-glucosidase inhibitors. The results align with BLI-MS screening, further validating the inhibitory activity of PRSE’s active compounds against α-glucosidase.
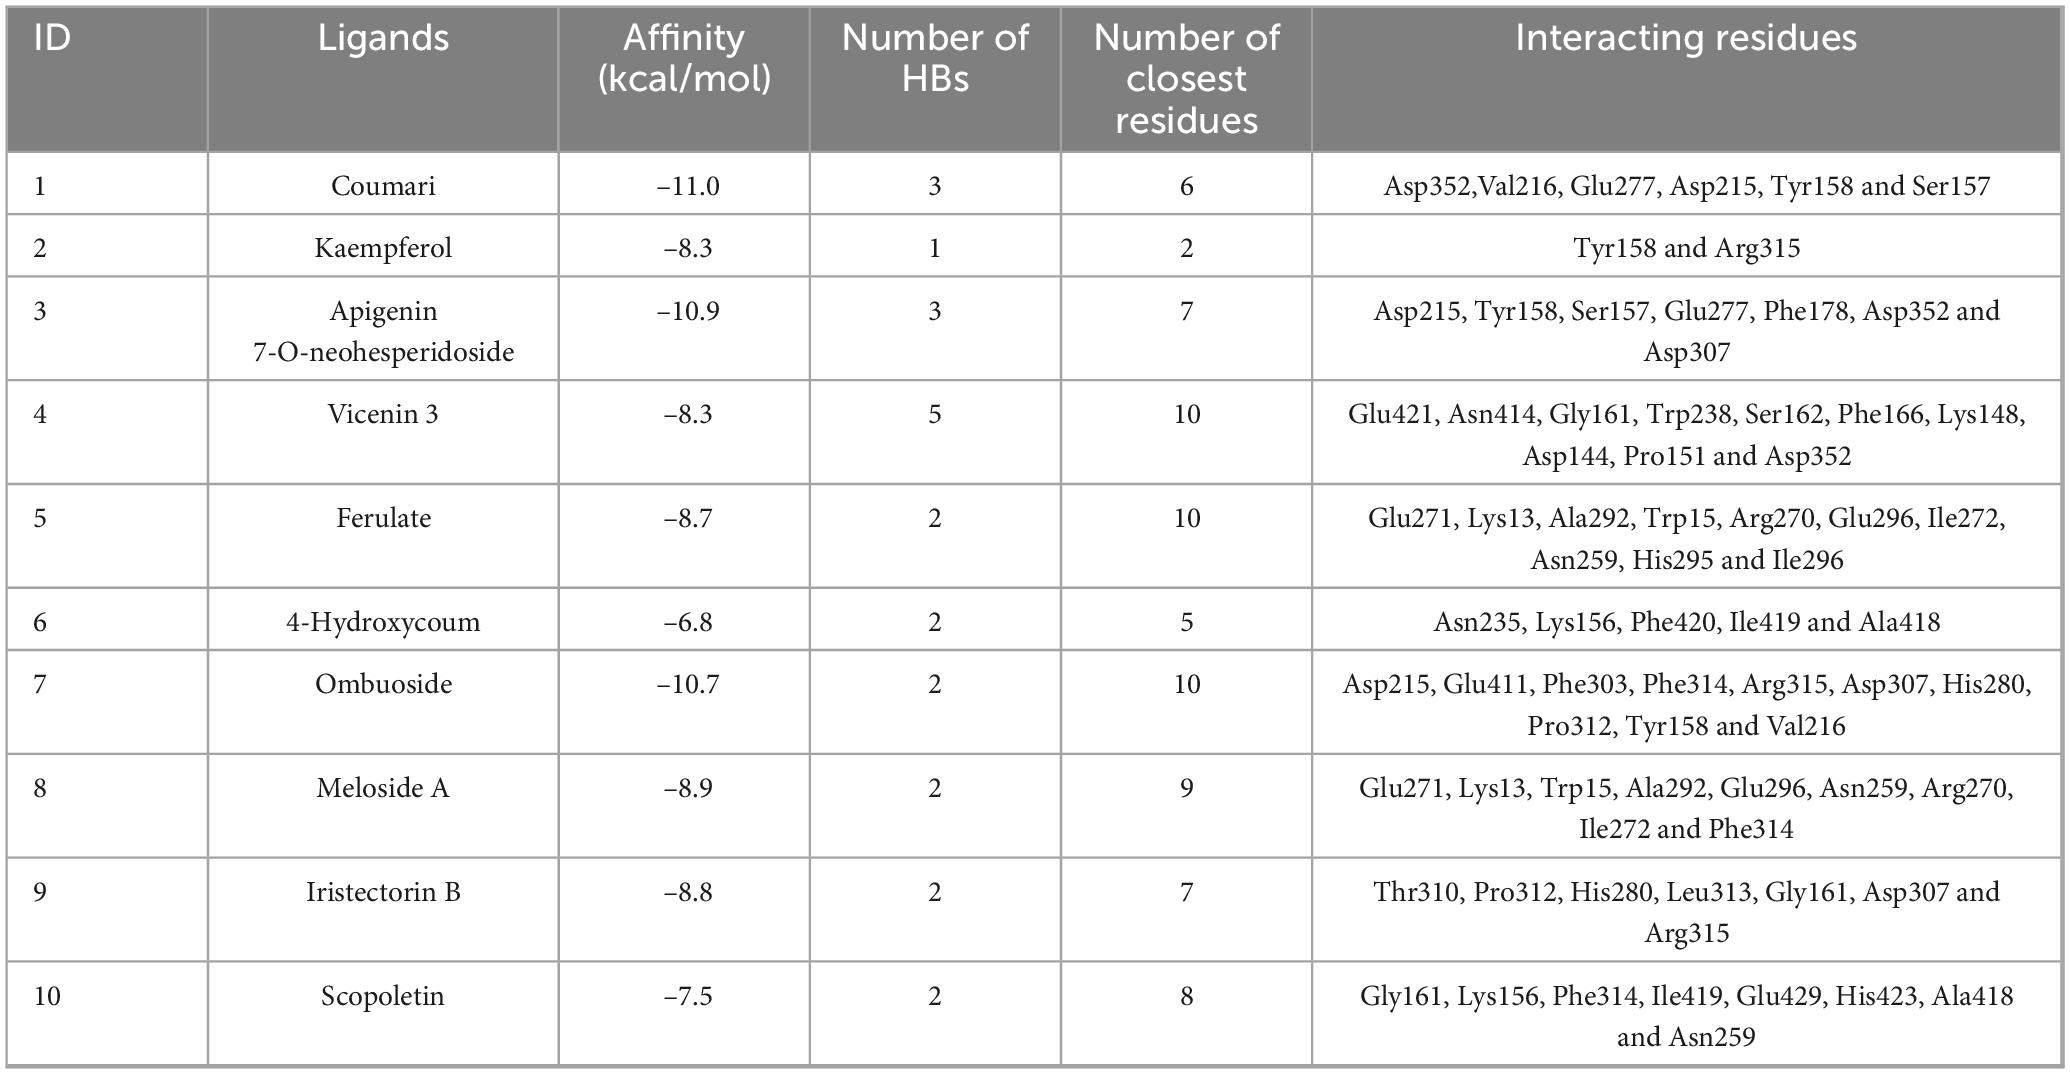
Table 4. Molecular docking parameters with active ingredients.
Conclusion
This study systematically analyzed the enzyme inhibition kinetics of PRSE and demonstrated its significant mixed-type inhibitory effects on α-glucosidase. These findings highlight PRSE as a promising natural source of α-glucosidase inhibitors with potential applications in postprandial glycemic control. Using a BLI-MS integrated screening strategy, 29 active compounds were identified, predominantly phenolic acids and flavonoids. Among these, compounds such as coumarin, kaempferol, and vicenin 3 showed strong binding affinities, while apigenin 7-O-neohesperidoside was identified for the first time as a potential inhibitor. Molecular docking further confirmed interactions between these compounds and key residues (e.g., Asp and Glu) in the enzyme’s active pocket, stabilized by hydrogen bonding and hydrophobic forces.
These findings validate the reliability of the BLI-MS screening approach and demonstrate its effectiveness in identifying target compounds from complex plant extracts. Looking forward, in vitro and in vivo studies are warranted to confirm the hypoglycemic effects of these compounds and elucidate their mechanisms of action. Further work should also explore structure-activity relationships through chemical modifications and advanced modeling. In addition, evaluating synergistic effects with other inhibitors and conducting long-term safety assessments will be essential to assess therapeutic viability. Importantly, these results suggest that PRSE and its active compounds hold promise for incorporation into functional food formulations aimed at managing metabolic disorders such as type 2 diabetes.
Data availability statement
The original contributions presented in this study are included in the article/Supplementary material, further inquiries can be directed to the corresponding authors.
Author contributions
MY: Methodology, Software, Validation, Writing – original draft, Writing – review and editing. JaL: Methodology, Validation, Writing – original draft. FZ: Validation, Visualization, Writing – review and editing. HL: Methodology, Writing – review and editing. RW: Data curation, Writing – review and editing. ZH: Funding acquisition, Writing – review and editing. JeL: Data curation, Writing – review and editing. WC: Resources, Writing – review and editing. GL: Resources, Writing – review and editing. SY: Investigation, Writing – review and editing. SD: Supervision, Writing – review and editing. XH: Conceptualization, Project administration, Supervision, Writing – review and editing. PY: Funding acquisition, Supervision, Writing – review and editing.
Funding
The author(s) declare that financial support was received for the research and/or publication of this article. This study was supported by the National High Level Hospital Clinical Research Funding (Grant No. 2025-PUMCH-C-004).
Conflict of interest
MY, JL, FZ, HL, GL, SY, SD, XH and PY were employed by the China National Research Institute of Food and Fermentation Industries Co., Ltd.
The remaining authors declare that the research was conducted in the absence of any commercial or financial relationships that could be construed as a potential conflict of interest.
Generative AI statement
The authors declare that no Generative AI was used in the creation of this manuscript.
Publisher’s note
All claims expressed in this article are solely those of the authors and do not necessarily represent those of their affiliated organizations, or those of the publisher, the editors and the reviewers. Any product that may be evaluated in this article, or claim that may be made by its manufacturer, is not guaranteed or endorsed by the publisher.
Supplementary material
The Supplementary Material for this article can be found online at: https://www.frontiersin.org/articles/10.3389/fnut.2025.1575409/full#supplementary-material
References
1. Zheng Y, Yang W, Sun W, Chen S, Liu D, Kong X, et al. Inhibition of porcine pancreatic α-amylase activity by chlorogenic acid. J Funct Foods. (2020) 64:103587. doi: 10.1016/j.jff.2019.103587
2. Man Z, Feng Y, Xiao J, Yang H, Wu X. Structural changes and molecular mechanism study on the inhibitory activity of Epigallocatechin against α-glucosidase and α-amylase. Front Nutr. (2022) 9:948027. doi: 10.3389/fnut.2022.948027
3. Han L, Fang C, Zhu R, Peng Q, Li D, Wang M. Inhibitory effect of phloretin on α-glucosidase: Kinetics, interaction mechanism and molecular docking. Int J Biol Macromol. (2017) 95:520–7. doi: 10.1016/j.ijbiomac.2016.11.089
4. Zhou H, Liao J, Ou J, Lin J, Zheng J, Li Y, et al. Bioassay-guided isolation of Fenghuang Dancong tea constituents with α-glucosidase inhibition activities. Front Nutr. (2022) 9:1050614. doi: 10.3389/fnut.2022.1050614
5. Mutlu M, Bingol Z, Uc E, Köksal E, Goren A, Alwasel S, et al. Comprehensive metabolite profiling of cinnamon (Cinnamomum zeylanicum) leaf oil using LC-HR/MS, GC/MS, and GC-FID: Determination of antiglaucoma, antioxidant, anticholinergic, and antidiabetic profiles. Life. (2023) 13:136. doi: 10.3390/life13010136
6. Zhang H, Yao J, Xiao G, Xie J, Mao S, Sun C, et al. Discovery of drug targets based on traditional Chinese medicine microspheres (TCM-MPs) fishing strategy combined with bio-layer interferometry (BLI) technology. Anal Chim Acta. (2024) 1305:342542. doi: 10.1016/j.aca.2024.342542
7. Muchiri R, Van Breemen R. Drug discovery from natural products using affinity selection-mass spectrometry. Drug Discov Today. (2021) 40:59–63. doi: 10.1016/j.ddtec.2021.10.005
8. Taslimi P, Köksal E, Gören A, Bursal E, Aras A, Kılıç Ö, et al. Anti-alzheimer, antidiabetic and antioxidant potential of satureja cuneifolia and analysis of its phenolic contents by LC-MS/MS. Arabian J Chem. (2020) 13:4528–37. doi: 10.1016/j.arabjc.2019.10.002
9. Ozden E, Bingol Z, Mutlu M, Karagecili H, Köksal E, Goren A, et al. Antioxidant, antiglaucoma, anticholinergic, and antidiabetic effects of kiwifruit (actinidia deliciosa) oil: Metabolite profile analysis using LC-HR/MS, GC/MS and GC-FID. Life. (2023) 13:1939. doi: 10.3390/life13091939
10. Zheng R, Su S, Zhou H, Yan H, Ye J, Zhao Z, et al. Antioxidant/antihyperglycemic activity of phenolics from sugarcane (Saccharum officinarum L.) bagasse and identification by UHPLC-HR-TOFMS. Indust Crops Prod. (2017) 101:104–14. doi: 10.1016/j.indcrop.2017.03.012
11. Ji J, Yang X, Flavel M, Shields Z, Kitchen B. Antioxidant and anti-diabetic functions of a polyphenol-rich sugarcane extract. J Am Coll Nutr. (2019) 38:670–80. doi: 10.1080/07315724.2019.1587323
12. Flavel M, Neoh J, Lim K. Dose-dependency of the glycemic response to polyphenol-rich sugarcane extract (PRSE). Biologics. (2023) 3:308–20. doi: 10.3390/biologics3040016
13. Zhao Y, Chen M, Zhao Z, Yu S. The antibiotic activity and mechanisms of sugarcane (Saccharum officinarum L.) bagasse extract against food-borne pathogens. Food Chem. (2015) 185:112–8. doi: 10.1016/j.foodchem.2015.03.120
14. Deseo M, Elkins A, Rochfort S, Kitchen B. Antioxidant activity and polyphenol composition of sugarcane molasses extract. Food Chem. (2020) 314:126180. doi: 10.1016/j.foodchem.2020.126180
15. Guo M, Zhu F, Qiu W, Qiao G, Law B, Yu L, et al. High-throughput screening for amyloid-β binding natural small-molecules based on the combinational use of biolayer interferometry and UHPLC–DAD–Q/TOF–MS/MS. Acta Pharm Sin B. (2022) 12:1723–39. doi: 10.1016/j.apsb.2021.08.030
16. Jung V, Roger K, Chhuon C, Pannetier L, Lipecka J, Gomez J, et al. BLI-MS: Combining biolayer interferometry and mass spectrometry. Proteomics. (2022) 22:e2100031. doi: 10.1002/pmic.202100031
17. Zheng Y, Liu S, Xie J, Chen Y, Dong R, Zhang X, et al. Antioxidant, α-amylase and α-glucosidase inhibitory activities of bound polyphenols extracted from mung bean skin dietary fiber. LWT - Food Sci Technol. (2020) 132:109943. doi: 10.1016/j.lwt.2020.109943
18. Ren L, Dong Q, Liu Z, Wang Y, Tan N, Wang H, et al. Optimization of subcritical water extraction, UPLC–triple–TOF–MS/MS analysis, antioxidant and α-glucosidase inhibitory activities of anthocyanins from Nitraria sibirica Pall. fruits. Food Chem. (2024) 23:101626. doi: 10.1016/j.fochx.2024.101626
19. Sun N. Purification, composition and activity of bound polyphenols from mung bean coat dietary fiber. Food Res Int. (2022) 162:111997. doi: 10.1016/j.foodres.2022.111997
20. Zhou M. Atomic zinc sites with hierarchical porous carbon for high-throughput chemical screening with high loading capacity and stability. Pharmacol. Res. (2022) 178:106154. doi: 10.1016/j.phrs.2022.106154
21. Lin M, Chai W, Zheng Y, Huang Q, Ou-Yang C. Inhibitory kinetics and mechanism of rifampicin on α-glucosidase: Insights from spectroscopic and molecular docking analyses. Int J Biol Macromol. (2019) 122:1244–52. doi: 10.1016/j.ijbiomac.2018.09.077
22. Raina J, Firdous A, Singh G, Kumar R, Kaur C. Role of polyphenols in the management of diabetic complications. Phytomedicine. (2024) 122:155155. doi: 10.1016/j.phymed.2023.155155
23. Kim Y, Keogh J, Clifton P. Polyphenols and glycemic control. Nutrients. (2016) 8:17. doi: 10.3390/nu8010017
24. Li B, Shen X, Shen H, Zhou Y, Yao X. Effect of optimized germination technology on polyphenol content and hypoglycemic activity of mung bean. Front Nutr. (2023) 10:1138739. doi: 10.3389/fnut.2023.1138739
25. Chen S, Xi M, Gao F, Li M, Dong T, Geng Z, et al. Evaluation of mulberry leaves’ hypoglycemic properties and hypoglycemic mechanisms. Front. Pharmacol. (2023) 14:1045309. doi: 10.3389/fphar.2023.1045309
26. Brown A, Anderson D, Racicot K, Pilkenton S, Apostolidis E. Evaluation of phenolic phytochemical enriched commercial plant extracts on the in vitro inhibition of α-glucosidase. Front Nutr. (2017) 4:56. doi: 10.3389/fnut.2017.00056
27. Gong Y, Li J, Li J, Wang L, Fan L. In vitro inhibitory effects of polyphenols from Flos sophorae immaturus on α-Glucosidase: Action mechanism, isothermal titration calorimetry and molecular docking analysis. Foods. (2023) 12:715. doi: 10.3390/foods12040715
28. Ye C, Zhang R, Dong L, Chi J, Huang F, Dong L, et al. α-Glucosidase inhibitors from brown rice bound phenolics extracts (BRBPE): Identification and mechanism. Food Chem. (2022) 372:131306. doi: 10.1016/j.foodchem.2021.131306
29. Tang F. Enhancing the inhibitory activities of polyphenols in passion fruit peel on α-Amylase and α-Glucosidase via β-Glucosidase-producing Lactobacillus fermentation. Food Biosci. (2024) 62:105005. doi: 10.1016/j.fbio.2024.105005
30. Sun N, Xie J, Zheng B, Xie J, Chen Y, Hu X, et al. The inhibition mechanism of bound polyphenols extracted from mung bean coat dietary fiber on porcine pancreatic α-amylase: Kinetic, spectroscopic, differential scanning calorimetric and molecular docking. Food Chem. (2024) 436:137749. doi: 10.1016/j.foodchem.2023.137749
31. He C, Liu X, Sun J. Inhibitory mechanism of baicalein against α-glucosidase. Nat Prod Commun. (2019) 14:1934578X19855825. doi: 10.1177/1934578X19855825
32. Maurya A, Mulpuru V. Discovery of novel coumarin analogs against the α-glucosidase protein target of diabetes mellitus: Pharmacophore-based QSAR, docking, and molecular dynamics simulation studies. ACS Omega. (2020) 5:32234–49. doi: 10.1021/acsomega.0c03871
33. Hu C, Luo Y, Wang W, Li J, Li M, Zhang Y, et al. Synthesis and evaluation of coumarin-chalcone derivatives as α-Glucosidase inhibitors. Front Chem. (2022) 10:926543. doi: 10.3389/fchem.2022.926543
34. Yeon S, Kwon H, Park Y, Turk A, Lee S, Ryu S, et al. Antioxidant and α-glucosidase inhibitory potential of the pollen of Hibiscus spp. Hortic Environ Biotechnol. (2024) 65:443–51. doi: 10.1007/s13580-023-00578-z
35. Xie L, Zhang T, Karrar E, Zheng L, Xie D, Jin J, et al. Insights into an α-Glucosidase inhibitory profile of 4,4-dimethylsterols by multispectral techniques and molecular docking. J Agric Food Chem. (2021) 69:15252–60. doi: 10.1021/acs.jafc.1c06347
Keywords: polyphenol-rich sugarcane extract, α-glucosidase inhibition, bioactive compounds, BLI-MS, molecular docking
Citation: Yao M, Liu J, Zhou F, Li H, Wang R, Han Z, Liu J, Chen W, Liu G, Yang S, Duan S, Han X and Yuan P (2025) α-Glucosidase inhibitory activity of polyphenol-rich sugarcane extract: screening and mechanistic insights based on biolayer interferometry-mass spectrometry. Front. Nutr. 12:1575409. doi: 10.3389/fnut.2025.1575409
Received: 20 February 2025; Accepted: 20 June 2025;
Published: 29 July 2025.
Edited by:
Mustafa Abdullah Yilmaz, Dicle University, TürkiyeReviewed by:
Elisa Julianti, Department of Food Science Universitas Sumatera Utara, IndonesiaIsmail Yener, Dicle University, Türkiye
Copyright © 2025 Yao, Liu, Zhou, Li, Wang, Han, Liu, Chen, Liu, Yang, Duan, Han and Yuan. This is an open-access article distributed under the terms of the Creative Commons Attribution License (CC BY). The use, distribution or reproduction in other forums is permitted, provided the original author(s) and the copyright owner(s) are credited and that the original publication in this journal is cited, in accordance with accepted academic practice. No use, distribution or reproduction is permitted which does not comply with these terms.
*Correspondence: Xiaofeng Han, aGFueGYyMDAxQDEyNi5jb20=; Peng Yuan, MTM0MDExNzA1MTRAMTYzLmNvbQ==