Abstract
Objective:
To investigate the impact of diet on cardiovascular (CV)/all-cause mortality among individuals with diabetes, and to explore whether this relationship changes by gender.
Methods:
We collected data from the National Health and Nutrition Examination Survey (NHANES) database pertaining to 5,875 individuals with diabetes (3,068 males and 2,807 females) and used the Healthy Eating Index (HEI), the Alternative Healthy Eating Index (AHEI), and the alternative Mediterranean Diet (aMED) index to assess diet quality. Multivariate Cox models were used to determine the association between dietary quality scores and CV/all-cause mortality, stratified by genders. Dose–response relationships were assessed using the Restricted Cubic Spline (RCS). As a secondary objective, a further analysis was conducted on the connection between CV/all-cause mortality and different dietary components.
Results:
During a median 9.25-year follow-up period, we observed 1,488 all-cause deaths, including 486 CV deaths. Sex-stratified analyses revealed that higher diet quality, as indicated by each standard deviation increase in the score, was significantly associated with a reduced risk of cardiovascular mortality in males (p < 0.05). No significant associations were observed in females (p > 0.05). Among the component scores of the aMED, legume intake was unfavorable for males with diabetes but was remarkably associated with lower CV/all-cause mortality in females.
Conclusion:
In the diabetic population, high dietary scores are significantly associated with lower CV/all-cause mortality in males but not in females.
Introduction
Type 2 diabetes mellitus (T2DM) has emerged as a critical global health challenge, currently affecting approximately 537 million adults, with projections indicating an alarming rise beyond 783 million by 2045 (1, 2). Extensive epidemiological evidence underscores T2DM as a significant independent risk factor contributing to multiple severe chronic conditions (3). Individuals diagnosed with T2DM exhibit a substantially elevated complication burden, notably experiencing a two- to five-fold increased risk of myocardial infarction and a two- to three-fold heightened risk of stroke compared to non-diabetic populations (4–6).
Accumulating evidence highlights lifestyle modifications—particularly dietary optimization-as a cornerstone for effective glycaemic control, demonstrating potential to significantly reduce T2DM progression risk by 30–60% (7, 8). An optimal dietary regimen encompasses diversified food selection, precise portioning of staple foods, and abundant consumption of vegetables, fruits, dairy, and legumes (9). Specific dietary patterns, such as the Mediterranean diet (MED), have consistently shown protective effects on CV mortality (10). Indeed, a pivotal longitudinal trial investigating the Mediterranean dietary pattern over approximately 4.3 years observed a substantial 30% risk reduction for cardiovascular disease (CVD) (11). Additionally, meta-analytic evidence has revealed that higher scores in dietary quality indices—including the alternate Mediterranean diet (aMED), the Alternative Healthy Eating Index (AHEI), and the Healthy Eating Index (HEI)-are inversely associated with the incidence of T2DM and diabetes-related mortality (12–14). However, the differential impact of these dietary indices on CV and all-cause mortality among individuals with diabetes of different genders remains under-explored.
Dietary quality indices, such as HEI, AHEI, and aMED, have been widely used to assess dietary patterns and are consistently associated with both diabetes and cardiovascular risk profiles (15–17). The aim of our study is to employ the National Health and Nutrition Examination Survey (NHANES) dataset to explore how different dietary indices (aMED index, AHEI, HEI) affect CV and all-cause mortality for individuals with diabetes of different genders.
Materials and methods
Study population
Using NHANES data from 9 cycles (2001–2018) and a multi-stage clustered probabilistic sampling design, we curated a representative cohort of the American population. The national center for health statistics (NCHS) Research Ethics Review Board approved the NHANES study protocol, and all participants provided oral and written informed consent.
To identify individuals with T2DM, we used the diagnostic criteria of the American Diabetes Association (18). Our study population included adults with diabetes, excluding 40,997 subjects under 20, 1,411 pregnant females, 10,307 individuals without survival status or dietary data, and 2,509 subjects with missing covariates. Finally, according to the diabetes inclusion criteria, 5,875 subjects were included in this study, including 3,068 males and 2,807 females. The entire data selection process was shown in Figure 1.
Figure 1

The flow chart illustrates the population selection methodology for this study.
Dietary quality scores
24-h recall interviews were used by the NHANES Nutrition Methods Work group to gather dietary data. A total of three dietary indices were analyzed in this study in relation to the CV/all-cause mortality, including: “alternative Mediterranean Diet” (aMED), “Alternative Healthy Eating Index” 2010 version (AHEI-2010) and “Healthy Eating Index” version 2020 (HEI-2020). The scores for each index were calculated according to the methodology reported in the literature, with higher scores indicating better adherence to the dietary pattern.
HEI-2020
The HEI-2020 is the latest version, which consists of 13 components categorized as adequate and moderate (19). The adequate components evaluate encouraged foods like fruits, vegetables, whole grains, dairy, protein, and healthy fats, while the moderate components assess limited foods such as saturated fats, refined grains, sodium, and added sugars. HEI-2020 scores range from 0 to 100, with higher scores reflecting higher diet quality.
AHEI-2010
The AHEI-2010 consists of 11 dietary items, with 6 components assessing adequacy (vegetables, fruits, whole grains, nuts and legumes, and long-chain n-3 fatty acids; PUFA) and 5 components assessing moderation (sugar-sweetened beverages and fruit juices, red/processed meats, trans fats, sodium, and alcohol) (20). Each component was scored on a 0–10 scale. Because data on trans fatty acids (TFAs) was not collected at baseline in this study (TFAs is one of the 11 items in the AHEI-2010), this item was not included in the scoring.
aMED index
The calculation of aMED index was based on the evaluated consumption of fish, whole grains, legumes, nuts, fruits, vegetables (apart from potatoes), red and processed meat, olive oil (the ratio of monounsaturated fatty acids to saturated fatty acids), and alcohol. Participants who consumed more than the median intake in the study cohort were given one point in addition to red/processed meat and alcohol. Additionally, 1 point was given to those who drank moderately (10–25 g/day for males and 5–15 g/day for females) or whose meat intake was below the cohort median. Those who fail to meet these requirements will be given a score of zero (21).
Covariate assessment
Baseline information was obtained by uniformly trained enumerators using a structured questionnaire to ask participants face-to-face for basic information. Body Mass Index (BMI): The number of kilograms of body weight divided by the square of the number of meters of height. Physical activity level: Participants were categorized as inactive, moderate, or active based on their self-reported physical activity. Smoking status: Participants were defined as smokers and never smokers. Smokers were further divided into ex-smokers and current smokers according to whether they quit smoking. Alcohol consumption: Participants were categorized as non-drinkers and drinkers. Drinkers were further categorized according to the amount of alcohol consumed per day: excessive alcohol consumption (≥ 3 drinks per day for females or ≥ 4 drinks per day for males) and moderate alcohol consumption (≥ 2 drinks per day for females or ≥ 3 drinks per day for males).
Outcome definition
CV mortality and all-cause mortality were analyzed based on data from December 31 of the 2019 National Death Index. The International Classification of Diseases, Tenth Revision codes accurately determined CV deaths: various heart diseases I00-I09, I11, I13, and ischemic heart disease I20-I51.
Statistical analysis
We designed our statistical methods according to CDC2022a guidelines to accommodate the complex sampling frame of NHANES. We used Kaplan–Meier curves to evaluate the impact of dietary indices on CV and all-cause mortality in diabetic patients, conducted subgroup analyses to identify special populations, applied multivariate Cox models to determine hazard ratios (HRs) and 95% confidence intervals (CIs), and performed Schoenfeld residual tests to verify the proportional hazard assumption of the Cox model. To ensure result accuracy, we conducted a sensitivity analysis by excluding individuals with CVD to eliminate confounding factors and removing participants who died within the first 2 years to avoid reverse causality. The dose–response relationship was analyzed using Restricted Cubic Spline (RCS) regression in a multivariate framework, with node selection guided by the Akaike Information Criterion (AIC) and linearity assessed through likelihood ratio tests. Finally, we further analyzed the independent correlation between the components of alternative Mediterranean Diet and the CV/all-cause mortality to investigate the magnitude of the contribution of each component to the association between dietary indices and the mortality in diabetic individuals. The model was adjusted for the multivariate in Model 3 above.
R software (version 4.3.2) was employed for all statistical analyses, and a two-sided test was deemed statistically significant if its p-value was less than 0.05.
Results
Baseline characteristics
The study cohort consisted of 5,875 participants over a median follow-up of 9.25 years (Table 1). Age and gender differences were observed in the dietary indices, where higher age and a greater proportion of females correlated with higher quartiles across all indices. Additionally, HEI, AHEI, and aMED scores were significantly higher among non-smokers, non-drinkers, and those with higher levels of education. Furthermore, lower dietary scores were associated with higher levels of serum HbA1c, TC, FBG, TG and higher TyG values and TyG-BMI values.
Table 1
| HEI | AHEI | aMED index | ||||
|---|---|---|---|---|---|---|
| Q1 | Q4 | Q1 | Q4 | Q1 | Q4 | |
| <43.2 | ≥59.1 | <30.1 | ≥44.7 | <5.0 | ≥6.5 | |
| Patients, n | 1475 | 1470 | 1461 | 1472 | 827 | 1822 |
| Age, years | 60.0 (47.0, 68.0) | 66.0(57.0, 74.0) | 60.0 (48.0, 69.0) | 64.0 (55.0, 73.0) | 59.0 (46.0, 68.0) | 65.0 (56.0, 74.0) |
| Sex/gender, Female | 627 (42.5) | 760 (51.7) | 664 (45.4) | 692 (47.0) | 348 (42.1) | 925 (50.8) |
| Race/ethnicity | ||||||
| Non-Hispanic Black | 396 (26.8) | 310 (21.1) | 440 (30.1) | 274 (18.6) | 232 (28.1) | 381 (20.9) |
| Non-Hispanic White | 601 (40.7) | 584 (39.7) | 560 (38.3) | 583 (39.6) | 347 (42.0) | 711 (39.0) |
| Mexican American | 271 (18.4) | 276 (18.8) | 234 (16.0) | 311 (21.1) | 116 (14.0) | 391 (21.5) |
| Other | 207 (14.0) | 300 (20.4) | 227 (15.5) | 304 (20.7) | 132 (16.0) | 339 (18.6) |
| Smoking status | ||||||
| Current smoking | 387 (26.2) | 116 (7.9) | 376 (25.7) | 133 (9.0) | 215 (26.0) | 153 (8.4) |
| Former smoking | 478 (32.4) | 514 (35.0) | 454 (31.1) | 508 (34.5) | 265 (32.0) | 637 (35.0) |
| Never | 610 (41.4) | 840 (57.1) | 631 (43.2) | 831 (56.5) | 347 (42.0) | 1032 (56.6) |
| Drinking status | ||||||
| Heavy drinking | 599 (40.6) | 537 (36.5) | 583 (39.9) | 614 (41.7) | 353 (42.7) | 684 (37.5) |
| Low-to-moderate drinking | 692 (46.9) | 642 (43.7) | 660 (45.2) | 622 (42.3) | 353 (42.7) | 803 (44.1) |
| Never | 184 (12.5) | 291 (19.8) | 218 (14.9) | 236 (16.0) | 121 (14.6) | 335 (18.4) |
| Educational attainment | ||||||
| College or above | 608 (41.2) | 694 (47.2) | 550 (37.6) | 760 (51.6) | 329 (39.8) | 871 (47.8) |
| High school or equivalent | 347 (23.5) | 342 (23.3) | 355 (24.3) | 305 (20.7) | 195 (23.6) | 396 (21.7) |
| Less than high school | 520 (35.3) | 434 (29.5) | 556 (38.1) | 407 (27.6) | 303 (36.6) | 555 (30.5) |
| Exercise status | ||||||
| Active | 66 (4.5) | 55 (3.7) | 70 (4.8) | 51 (3.5) | 44 (5.3) | 64 (3.5) |
| Inactive | 889 (60.3) | 897 (61.0) | 911 (62.4) | 867 (58.9) | 512 (61.9) | 1071 (58.8) |
| Moderate | 692 (46.9) | 642 (43.7) | 660 (45.2) | 622 (42.3) | 353 (42.7) | 803 (44.1) |
| Hypertension, yes | 908 (61.6) | 1007 (68.5) | 908 (62.1) | 960 (65.2) | 499 (60.3) | 1198 (65.8) |
| CVD, yes | 348 (23.6) | 381 (25.9) | 389 (26.6) | 307 (20.9) | 206 (24.9) | 473 (26.0) |
| BMI, kg/m2 | 32.4 (27.9,37.6) | 30.1 (26.7,34.6) | 31.9 (27.8,37.2) | 29.9 (26.4,34.4) | 31.9 (27.8, 37.3) | 30.2 (26.6,34.7) |
| HbA1c, % | 6.9 (6.2, 8.1) | 6.8 (6.2, 7.7) | 6.8 (6.2, 8.0) | 6.8 (6.1, 7.7) | 6.9 (6.4, 8.2) | 6.8 (6.2, 7.8) |
| TC, mg/dL | 187.0 (158.0, 219.0) | 182.0 (155.0, 216.0) | 189.0 (161.0, 221.0) | 183.0 (155.0, 215.0) | 190.0 (158.0, 222.0) | 183.0 (156.0, 214.0) |
| FPG, mg/dL | 130.0 (107.0, 177.0) | 126.0 (105.0, 161.0) | 128.0 (106.0, 175.0) | 126.0 (104.0, 164.0) | 131.0 (109.0, 182.0) | 127.0 (105.0, 168.0) |
| TG, mg/dL | 157.0 (108.0, 238.0) | 148.0 (97.0, 217.0) | 157.0 (108.0, 234.0) | 146.0 (96.0, 212.0) | 157.0 (105.0, 241.5) | 148.0(98.0, 216.0) |
| TyG | 9.3 (8.8, 9.8) | 9.1 (8.7, 9.7) | 9.3 (8.8, 9.8) | 9.1 (8.7, 9.6) | 9.3 (8.8,9.9) | 9.2 (8.7, 9.7) |
| TyG_BMI | 305.7 (258.3, 355.6) | 278.6 (240.8, 325.4) | 301.6 (257.3, 353.1) | 277.6 (237.4, 323.1) | 301.9 (256.7, 357.6) | 278.9 (240.9, 327.0) |
Baseline characteristics of participants with diabetes.
Data are numeric (percentages), or median [interquartile spacing]. All estimates take into account the complex survey design. Q1: Quartile 1, Q2: Quartile 2, Q3: Quartile 3, Q4: Quartile 4, CVD: Cardiovascular disease, BMI: Body Mass Index, HbA1c: glycosylated hemoglobin, TC: Serum total cholesterol, FPG: Fasting Plasma Glucose, TG: Serum triglycerides, TyG: Triglyceride and glucose index, TyG_BMI: Triglyceride glucose-body mass index.
Survival analysis and subgroup analyses
Supplementary Figure 1 emphasized the role of diet in diabetes prognosis, with Supplementary Figures 1B,E demonstrating that higher dietary scores in diabetic patients were associated with lower CV and all-cause mortality. After stratification, there was a gender-based interaction between HEI/AHEI and CV mortality (HEI: p-interaction = 0.006; AHEI: p-interaction = 0.003) (Table 2). Similarly, Table 3 further showed a significant gender-based interaction between HEI/AHEI/aMED index and all-cause mortality (HEI: p-interaction = 0.009; AHEI: p-interaction = 0.001; aMED index: p-interaction = 0.027). Interactions for other subgroups remained nonsignificant (p-interaction >0.05).
Table 2
| Variables | HEI | AHEI | aMED index | |||
|---|---|---|---|---|---|---|
| HR (95%CI) | P for interaction | HR (95%CI) | P for interaction | HR (95%CI) | P for interaction | |
| Sex/gender | 0.006 | 0.003 | 0.303 | |||
| Male | 0.91 (0.82-1.01) | 0.81 (0.73-0.90) | 0.98 (0.88-1.09) | |||
| Female | 1.15 (1.01-1.30) | 1.03 (0.91-1.17) | 1.07 (0.93-1.22) | |||
| Age, years | 0.171 | 0.288 | 0.114 | |||
| <60 | 0.78 (0.62-0.98) | 0.74 (0.59-0.93) | 0.76 (0.60-0.96) | |||
| ≥60 | 0.92 (0.85-1.00) | 0.84 (0.77-0.92) | 0.93 (0.85-1.02) | |||
| Race/ethnicity | 0.397 | 0.836 | 0.938 | |||
| Non-Hispanic Black | 1.01 (0.85-1.19) | 0.91 (0.77-1.08) | 1.04 (0.87-1.24) | |||
| Non-Hispanic White | 1.04 (0.94-1.15) | 0.90 (0.81-1.00) | 1.01 (0.91-1.13) | |||
| Mexican American | 0.93 (0.73-1.18) | 0.86 (0.68-1.08) | 0.97 (0.75-1.25) | |||
| Others | 0.80 (0.58-1.09) | 0.79 (0.59-1.07) | 0.96 (0.70-1.31) | |||
| Drinking status | 0.629 | 0.413 | 0.482 | |||
| Heavy | 1.02 (0.87-1.19) | 0.85 (0.73-0.99) | 0.94 (0.80-1.11) | |||
| Never/low/moderate | 0.97 (0.89-1.07) | 0.91 (0.83-1.00) | 1.01 (0.92-1.12) | |||
| Smoking status | 0.123 | 0.217 | 0.896 | |||
| Yes | 1.08 (0.96-1.22) | 0.95 (0.84-1.07) | 1.02 (0.90-1.16) | |||
| No | 0.95 (0.85-1.06) | 0.86 (0.77-0.96) | 1.01 (0.90-1.13) | |||
| Educational attainment | 0.635 | 0.881 | 0.645 | |||
| College and above | 0.97 (0.85-1.12) | 0.91 (0.79-1.04) | 1.04 (0.90-1.20) | |||
| Below College level | 1.01 (0.92-1.12) | 0.9 (0.82-0.99) | 1.00 (0.90-1.11) | |||
| Exercise status | 0.56 | 0.306 | 0.946 | |||
| Yes | 1.03 (0.89-1.18) | 0.95 (0.83-1.09) | 1.01 (0.87-1.17) | |||
| No | 0.98 (0.89-1.08) | 0.87 (0.79-0.96) | 1.02 (0.92-1.13) | |||
| Hypertension | 0.147 | 0.908 | 0.274 | |||
| Yes | 0.95 (0.87-1.04) | 0.88 (0.81-0.97) | 0.97 (0.87-1.07) | |||
| No | 1.09 (0.93-1.27) | 0.90 (0.77-1.04) | 1.08 (0.92-1.27) | |||
| HbA1c | 0.129 | 0.068 | 0.238 | |||
| <7.0 | 1.04 (0.94-1.16) | 0.95 (0.85-1.05) | 1.05 (0.94-1.17) | |||
| ≥7.0 | 0.92 (0.82-1.04) | 0.81 (0.72-0.92) | 0.95 (0.83-1.08) | |||
Association of dietary indicators with CV mortality in different subgroups.
Data was expressed as HR (95% CI). The data was stratified by age, sex/gender, race/ethnicity, drinking status, smoking status, educational level, exercise status, hypertension status, and HbA1c level. Stratification variables themselves were not included in the model.
Table 3
| HEI | AHEI | aMED index | ||||
|---|---|---|---|---|---|---|
| Variable | HR (95%CI) | P for interaction | HR (95%CI) | P for interaction | HR (95%CI) | P for interaction |
| Sex/gender | 0.009 | 0.001 | 0.027 | |||
| Male | 0.97 (0.91-1.03) | 0.89 (0.84-0.95) | 1.00 (0.94-1.06) | |||
| Female | 1.09 (1.02-1.17) | 1.04 (0.97-1.12) | 1.11 (1.03-1.20) | |||
| Age, years | 0.326 | 0.199 | 0.099 | |||
| <60 | 0.87 (0.77-0.99) | 0.83 (0.74-0.93) | 0.85 (0.75-0.96) | |||
| ≥60 | 0.93 (0.89-0.98) | 0.90 (0.86-0.95) | 0.96 (0.91-1.01) | |||
| Race/ethnicity | 0.06 | 0.292 | 0.093 | |||
| Non-Hispanic Black | 1.00 (0.90-1.10) | 0.92 (0.83-1.02) | 1.05 (0.94-1.17) | |||
| Non-Hispanic White | 1.06 (1.00-1.12) | 0.98 (0.92-1.04) | 1.08 (1.02-1.15) | |||
| Mexican American | 0.98 (0.87-1.10) | 0.94 (0.83-1.06) | 0.96 (0.85-1.10) | |||
| Others | 0.84 (0.72-1.00) | 0.84 (0.72-0.98) | 0.89 (0.75-1.05) | |||
| Drinking status | 0.095 | 0.364 | 0.355 | |||
| Heavy | 1.07 (0.98-1.17) | 0.99 (0.91-1.07) | 1.06 (0.97-1.16) | |||
| Low/moderate/never | 0.98 (0.93-1.03) | 0.94 (0.89-1.00) | 1.01 (0.96-1.07) | |||
| Smoking status | 0.06 | 0.431 | 0.303 | |||
| Yes | 1.09 (1.01-1.17) | 0.98 (0.92-1.06) | 1.09 (1.01-1.17) | |||
| No | 1.00 (0.94-1.06) | 0.95 (0.90-1.01) | 1.03 (0.97-1.10) | |||
| Educational attainment | 0.885 | 0.761 | 0.571 | |||
| College and above | 1.01 (0.93-1.10) | 0.96 (0.89-1.04) | 1.07 (0.98-1.16) | |||
| Below College level | 1.02 (0.97-1.08) | 0.97 (0.92-1.03) | 1.04 (0.98-1.10) | |||
| Exercise status | 0.469 | 0.251 | 0.983 | |||
| Yes | 1.04 (0.96-1.12) | 1.00 (0.92-1.08) | 1.05 (0.96-1.14) | |||
| No | 1.00 (0.95-1.06) | 0.94 (0.89-1.00) | 1.05 (0.99-1.12) | |||
| Hypertension | 0.67 | 0.933 | 0.836 | |||
| Yes | 1.00 (0.95-1.05) | 0.95 (0.90-1.00) | 1.03 (0.97-1.09) | |||
| No | 1.02 (0.94-1.11) | 0.94 (0.87-1.03) | 1.04 (0.95-1.14) | |||
| HbA1c | 0.663 | 0.385 | 0.807 | |||
| <7.0 | 1.02 (0.96-1.08) | 0.97 (0.91-1.03) | 1.04 (0.98-1.11) | |||
| ≥7.0 | 1.00 (0.93-1.07) | 0.93 (0.87-0.99) | 1.03 (0.96-1.11) | |||
Association of dietary indicators with all-cause mortality in different subgroups.
Data was expressed as HR (95% CI). The data was stratified by age, sex/gender, race/ethnicity, drinking status, smoking status, educational level, exercise status, hypertension status, and HbA1c level. Stratification variables themselves were not included in the model.
Relationship between dietary scores and CV/all-cause mortality
After multivariate adjustment, in males, dietary scores were associated with CV mortality, all-cause mortality in an inverse relationship. The highest aMED index, HEI, and AHEI quartiles were significantly associated with reduced CV mortality (aMED index: HR = 0.58, 95% CI: 0.36–0.95, p = 0.027; HEI: HR = 0.46, 95% CI: 0.30–0.70, p < 0.001; AHEI: HR = 0.39, 95% CI: 0.25–0.62, p < 0.001) and reduced all-cause mortality (aMED index: HR = 0.75, 95% CI: 0.58–0.98, p = 0.03; AHEI: HR = 0.84, 95% CI: 0.64–1.10, p = 0.01) compared to the lowest quartiles of aMED index, HEI, and AHEI. However, among females, the associations between the dietary indices and CV mortality were not statistically significant, nor were the associations between the HEI, aMED index, and all-cause mortality, after similar adjustment. AHEI may be associated with reduced all-cause mortality in females (p = 0.012) (Tables 4, 5). Additionally, sensitivity analysis results further validated the accuracy of our results (Supplementary Tables 1, 2).
Table 4
| Cardiovascular mortality | |||||
|---|---|---|---|---|---|
| Quartile 1 | Quartile 2 | Quartile 3 | Quartile 4 | p for trend | |
| HEI | |||||
| Male | |||||
| Model 1 | 1 | 0.99 (0.66–1.46) | 0.73 (0.47–1.12) | 0.42 (0.28–0.61) | <0.001 |
| Model 2 | 1 | 1.06 (0.70–1.61) | 0.82 (0.54–1.23) | 0.47 (0.32–0.69) | <0.001 |
| Model 3 | 1 | 1.05 (0.69–1.61) | 0.80 (0.52–1.23) | 0.46 (0.30–0.70) | <0.001 |
| Female | |||||
| Model 1 | 1 | 0.91 (0.57–1.47) | 0.89 (0.57–1.40) | 0.77 (0.50–1.19) | 0.677 |
| Model 2 | 1 | 0.97 (0.60–1.59) | 0.98 (0.62–1.54) | 0.95 (0.58–1.57) | 0.758 |
| Model 3 | 1 | 1.02 (0.62–1.70) | 1.02 (0.65–1.59) | 1.03 (0.60–1.75) | 0.608 |
| AHEI | |||||
| Male | |||||
| Model 1 | 1 | 0.75 (0.52–1.09) | 0.46 (0.32–0.68) | 0.29 (0.19–0.45) | <0.001 |
| Model 2 | 1 | 0.93 (0.64–1.34) | 0.56 (0.37–0.85) | 0.39 (0.25–0.60) | <0.001 |
| Model 3 | 1 | 0.92 (0.63–1.34) | 0.56 (0.36–0.86) | 0.39 (0.25–0.62) | <0.001 |
| Female | |||||
| Model 1 | 1 | 1.01 (0.61–1.65) | 0.58 (0.36–0.94) | 0.67 (0.43–1.04) | 0.002 |
| Model 2 | 1 | 1.05 (0.62–1.76) | 0.59 (0.36–0.97) | 0.82 (0.51–1.34) | 0.042 |
| Model 3 | 1 | 1.04 (0.64–1.71) | 0.58 (0.35–0.95) | 0.86 (0.52–1.40) | 0.064 |
| aMED index | |||||
| Male | |||||
| Model 1 | 1 | 0.85 (0.54–1.34) | 0.60 (0.36–1.01) | 0.51 (0.33–0.80) | 0.003 |
| Model 2 | 1 | 0.85 (0.54–1.35) | 0.62 (0.37–1.04) | 0.56 (0.36–0.86) | 0.014 |
| Model 3 | 1 | 0.90 (0.56–1.46) | 0.63 (0.36–1.11) | 0.58 (0.36–0.95) | 0.027 |
| Female | |||||
| Model 1 | 1 | 0.53 (0.32–0.89) | 0.49 (0.25–0.98) | 0.53 (0.30–0.92) | 0.425 |
| Model 2 | 1 | 0.63 (0.38–1.04) | 0.61 (0.30–1.22) | 0.66 (0.34–1.26) | 0.928 |
| Model 3 | 1 | 0.65 (0.40–1.08) | 0.63 (0.32–1.27) | 0.71 (0.36–1.40) | 0.877 |
Cardiovascular mortality in men and women with diabetes based on dietary index quartiles.
Data was expressed as HR (95% CI). Model 1: adjusted for demographic factors (age, race/ethnicity). Model 2: Includes additional adjustments for socio-behavioral factors (educational level, drinking patterns, smoking status, and exercise level), baseline hypertension disease status, and baseline cardiovascular disease status. Model 3: Further adjustments were made for metabolic indicators and health status affecting cardiovascular risk (HbA1c, BMI, cholesterol, blood glucose, triglycerides), as well as for novel indicators such as the triglyceride-glucose (TyG) index and its body mass index-adjusted variant (TyG-BMI index).
Table 5
| All-cause mortality | |||||
|---|---|---|---|---|---|
| Quartile 1 | Quartile 2 | Quartile 3 | Quartile 4 | p for trend | |
| HEI | |||||
| Male | |||||
| Model 1 | 1 | 0.95 (0.74–1.20) | 1.01 (0.78–1.32) | 0.62 (0.48–0.78) | 0.001 |
| Model 2 | 1 | 1.03 (0.80–1.33) | 1.22 (0.93–1.59) | 0.75 (0.58–0.96) | 0.062 |
| Model 3 | 1 | 1.03 (0.79–1.34) | 1.22 (0.93–1.59) | 0.76 (0.59–0.99) | 0.103 |
| Female | |||||
| Model 1 | 1 | 0.81 (0.63–1.05) | 0.83 (0.64–1.08) | 0.66 (0.50–0.87) | 0.011 |
| Model 2 | 1 | 0.89 (0.68–1.15) | 0.93 (0.71–1.21) | 0.81 (0.61–1.08) | 0.238 |
| Model 3 | 1 | 0.90 (0.69–1.19) | 0.96 (0.73–1.26) | 0.80 (0.60–1.07) | 0.147 |
| AHEI | |||||
| Male | |||||
| Model 1 | 1 | 0.98 (0.77–1.24) | 0.73 (0.59–0.90) | 0.58 (0.45–0.75) | <0.001 |
| Model 2 | 1 | 1.19 (0.95–1.50) | 0.87 (0.70–1.10) | 0.79 (0.61–1.03) | 0.002 |
| Model 3 | 1 | 1.21 (0.96–1.54) | 0.90 (0.71–1.12) | 0.84 (0.64–1.10) | 0.01 |
| Female | |||||
| Model 1 | 1 | 1.11 (0.83–1.48) | 0.77 (0.57–1.04) | 0.75 (0.58–0.97) | <0.001 |
| Model 2 | 1 | 1.16 (0.86–1.58) | 0.82 (0.60–1.12) | 0.92 (0.69–1.22) | 0.025 |
| Model 3 | 1 | 1.13 (0.84–1.53) | 0.82 (0.60–1.11) | 0.89 (0.67–1.18) | 0.012 |
| aMED index | |||||
| Male | |||||
| Model 1 | 1 | 0.94 (0.72–1.24) | 0.95 (0.72–1.26) | 0.64 (0.49–0.84) | <0.001 |
| Model 2 | 1 | 0.96 (0.73–1.27) | 0.98 (0.74–1.30) | 0.72 (0.56–0.93) | 0.011 |
| Model 3 | 1 | 1.00 (0.76–1.33) | 1.01 (0.75–1.37) | 0.75 (0.58–0.98) | 0.03 |
| Female | |||||
| Model 1 | 1 | 0.79 (0.57–1.11) | 0.65 (0.44–0.96) | 0.72 (0.52–1.01) | 0.172 |
| Model 2 | 1 | 0.90 (0.64–1.28) | 0.79 (0.52–1.19) | 0.91 (0.63–1.32) | 0.941 |
| Model 3 | 1 | 0.90 (0.63–1.27) | 0.81 (0.54–1.21) | 0.89 (0.62–1.30) | 0.898 |
All-cause mortality in men and women with diabetes based on dietary index quartiles.
Data was expressed as HR (95% CI). Model 1: adjusted for demographic factors (age, race/ethnicity). Model 2: Includes additional adjustments for socio-behavioral factors (educational level, drinking patterns, smoking status, and exercise level), baseline hypertension disease status, and baseline cardiovascular disease status. Model 3: Further adjustments were made for metabolic indicators and health status affecting cardiovascular risk (HbA1c, BMI, cholesterol, blood glucose, triglycerides), as well as for novel indicators such as the triglyceride-glucose (TyG) index and its body mass index-adjusted variant (TyG-BMI index).
Dose–response relationship
Higher dietary scores were associated with a lower CV/all-cause mortality in males, whereas in females there was no significant change. Among males, there was a significant linear relationship between the CV mortality and the three dietary indices (p nonlinear >0.05; p overall <0.05) (Figures 2A–C). In females, HEI, AHEI, and aMED scores were not significantly associated with CV mortality, with no clear linear or nonlinear dose-response relationships observed (Figures 2D–F). There was a linear relationship between the all-cause mortality and the AHEI (p nonlinear >0.05; p overall<0.05) (Figure 2H) and a significant non-linear relationship with the HEI, aMED index (p nonlinear <0.05; p overall<0.05) (Figures 2G,I).
Figure 2
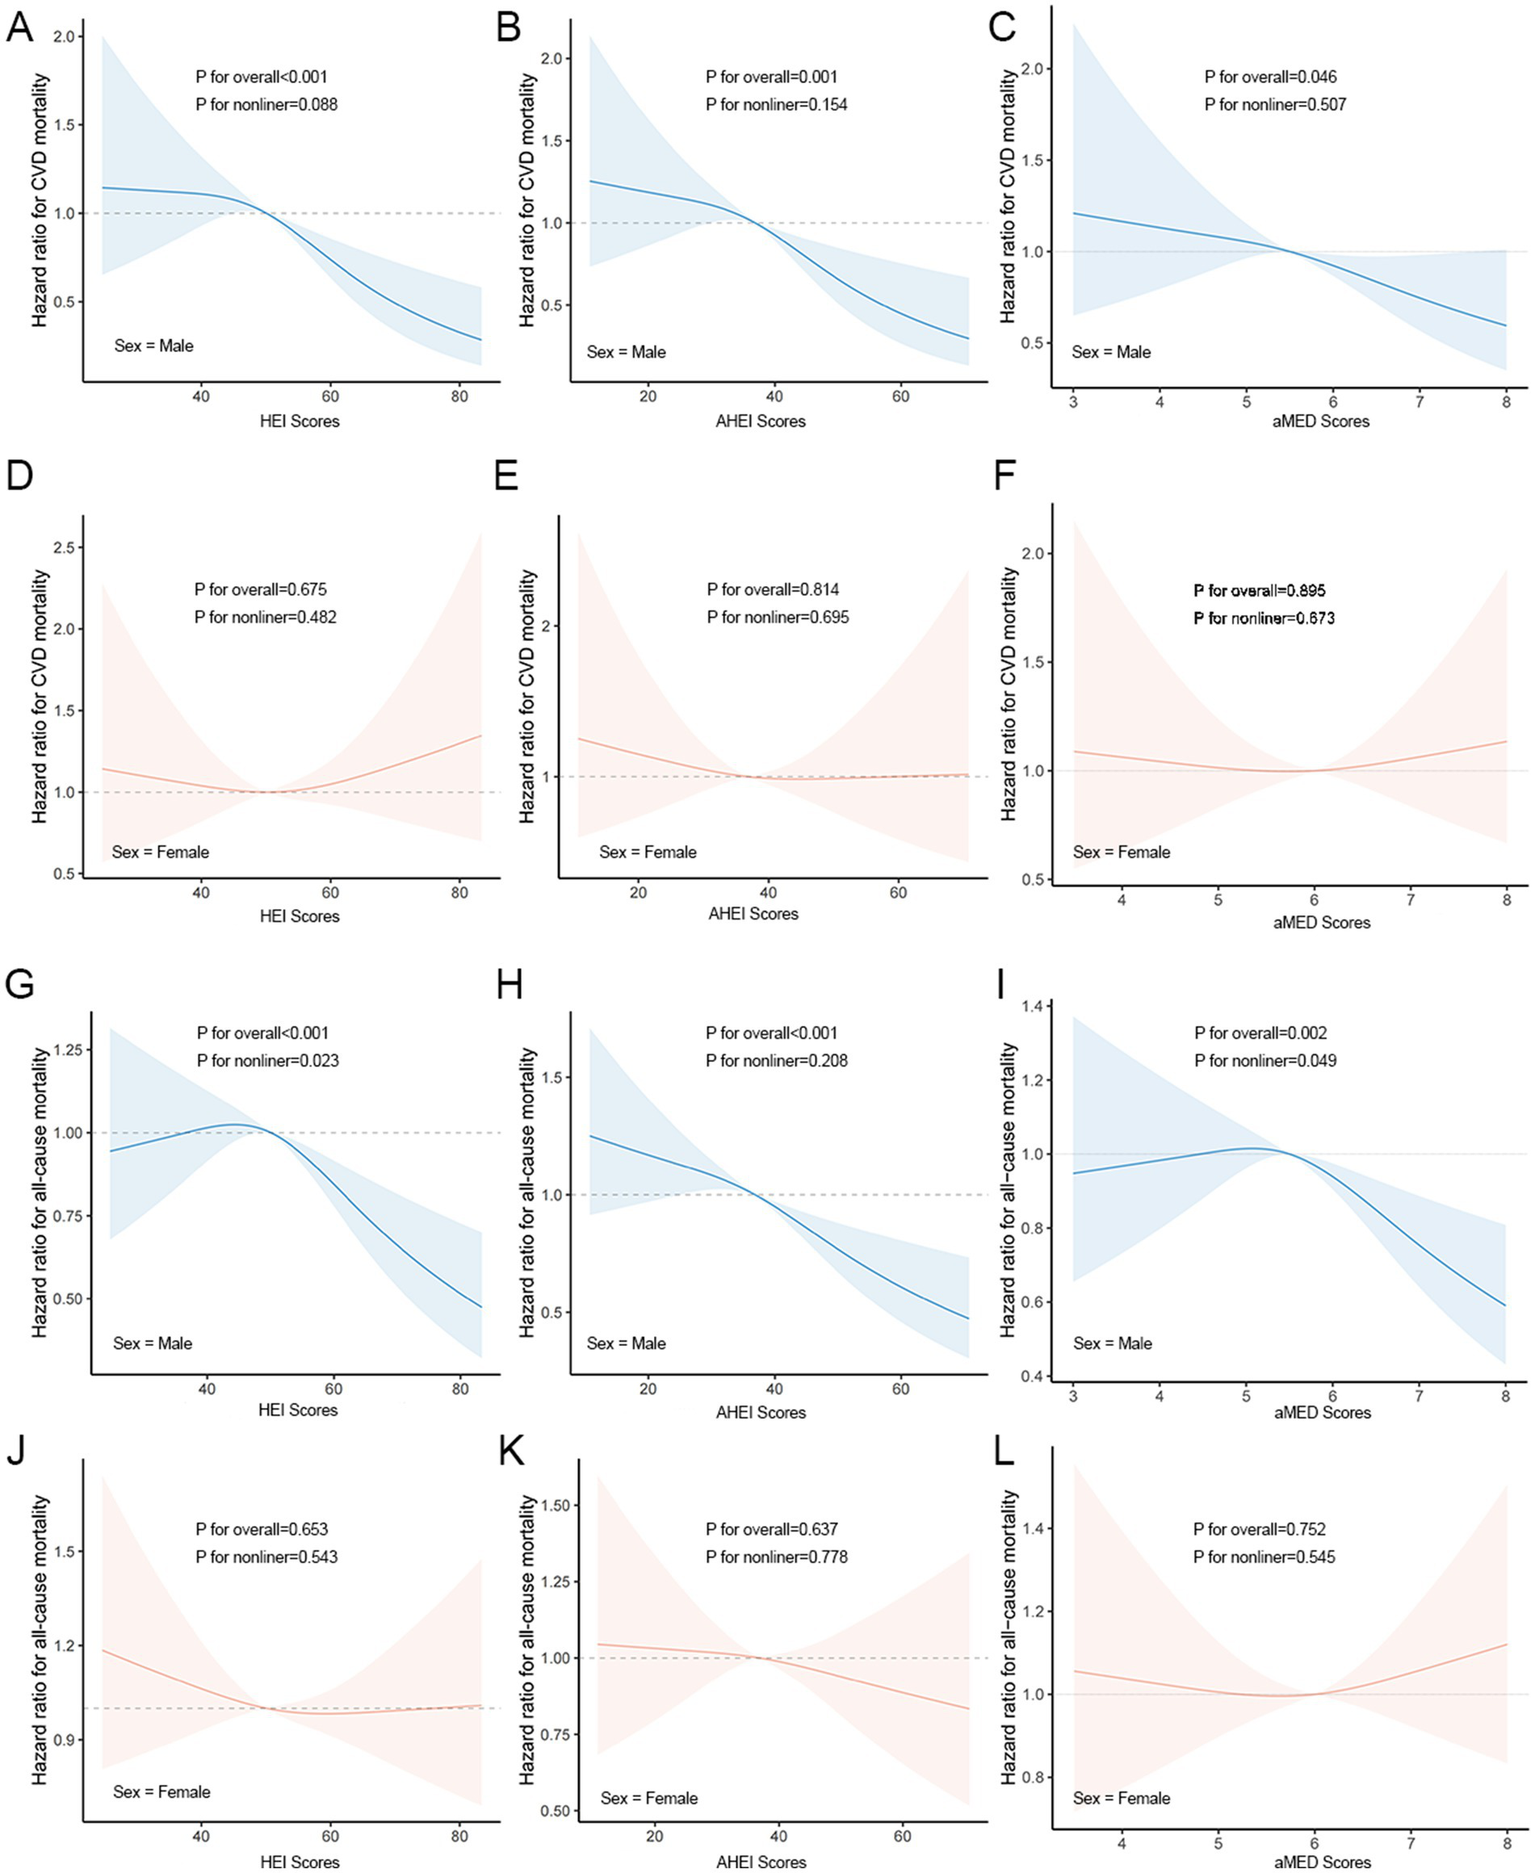
Dose–response relationships between dietary indicators and CV/all-cause mortality. (A–C) Associations between HEI (A), AHEI (B), and aMED (C) scores and CV mortality in males. (D–F) Associations between HEI (D), AHEI (E), and aMED (F) scores and CV mortality in females. (G–I) Associations between HEI (G), AHEI (H), and aMED (I) scores and all-cause mortality in males. (J–L) Associations between HEI (J), AHEI (K), and aMED (L) scores and all-cause mortality in females.
Association between components of aMED and CV/all-cause mortality
As shown in Figure 3, among the components, legume intake was significantly connected to higher CV mortality in males, whereas fruit and olive oil intake were significantly connected to lower mortality. Legume and nut intake was significantly connected to lower mortality in females. Using the composition of the alternative Mediterranean diet as an example, the HRs for the CV mortality was as follows: in males, the HR for fruits was 0.59 (95% CI: 0.44–0.80; p = 0.001), and the HR for legumes was 1.76 (95% CI: 1.02–3.06; p = 0.043). In females, the HR for legumes was 0.39 (95% CI: 0.20–0.77; p = 0.007) and for nuts was 0.60 (95% CI: 0.36–0.99; p = 0.044). The HRs for the all-cause mortality from T2DM corresponding to additional daily intake were 0.83 (95% CI: 0.70–0.98; p = 0.026) for fruits and 0.76 (95% CI: 0.59–0.97; p = 0.027) for olive oil in males. In females, the HR was 0.53 (95% CI: 0.36–0.78; p = 0.001) for legumes and 0.65 (95% CI: 0.48–0.88; p = 0.005) for nuts.
Figure 3
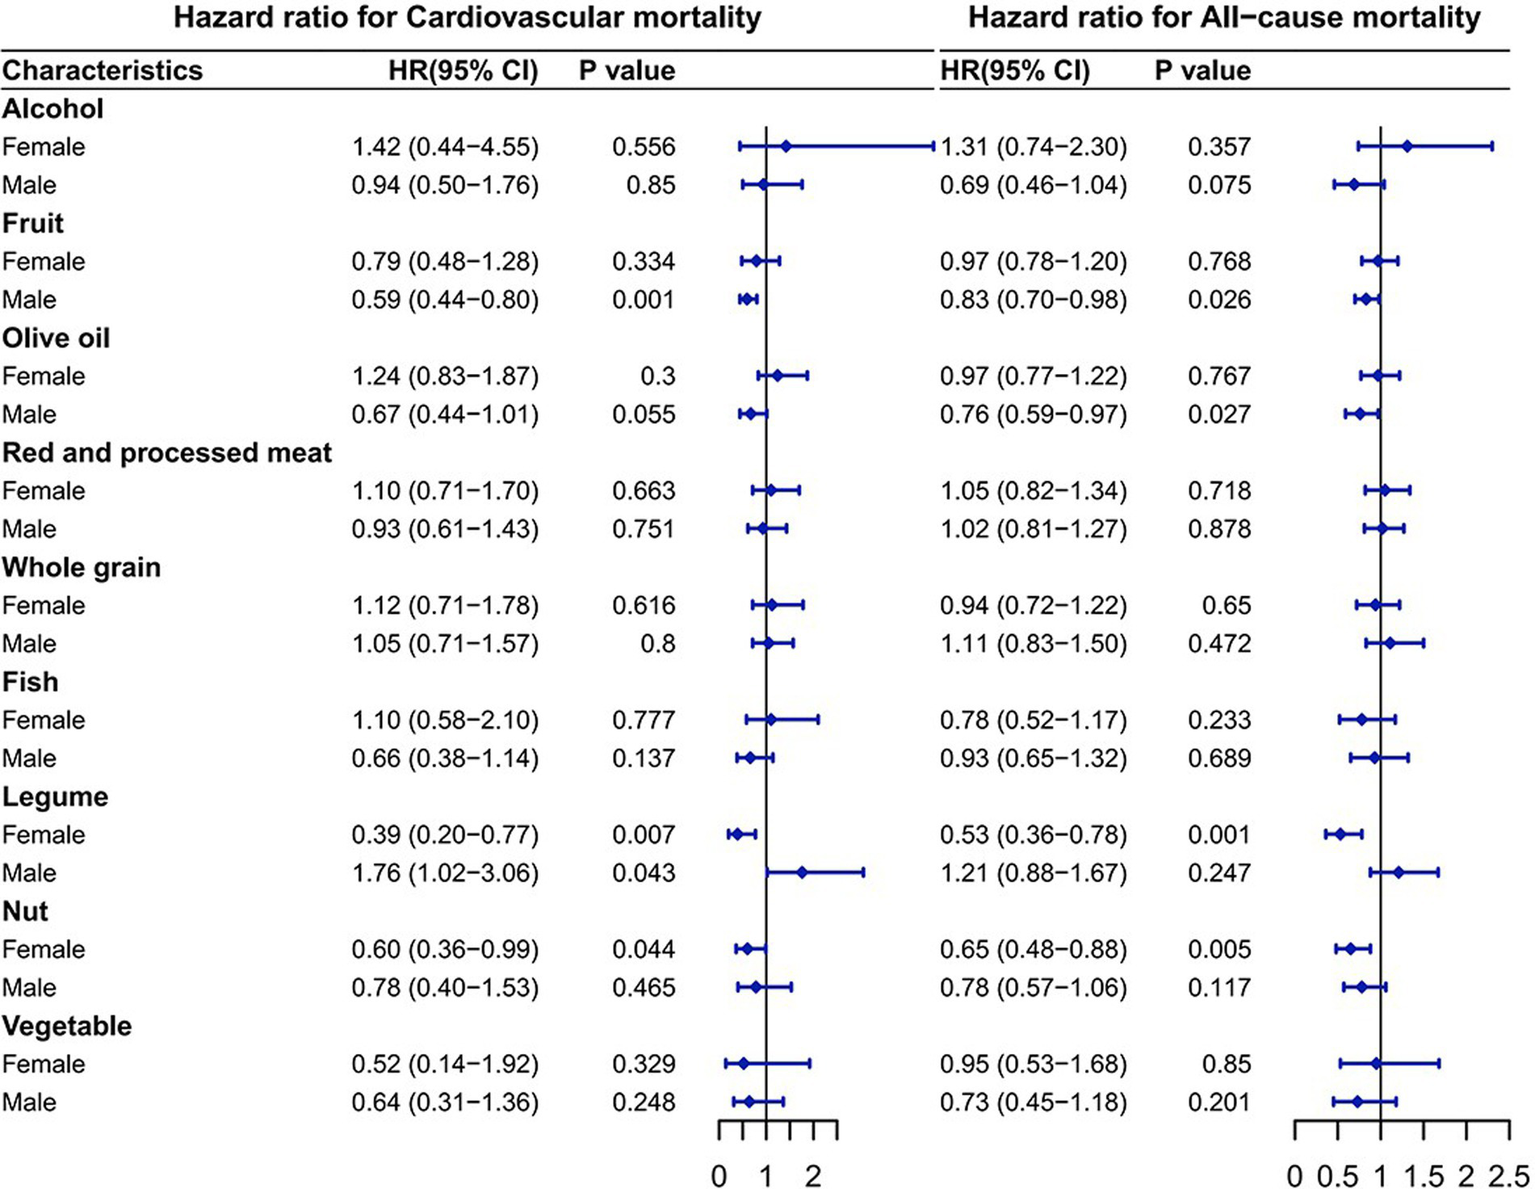
Association of the components of the alternative Mediterranean diet with mortality. The model was adjusted based on age, race/ethnicity, educational level, drinking patterns, smoking status, exercise level, baseline hypertension status, baseline cardiovascular disease status, HbA1c level, BMI, cholesterol, glucose, triglycerides, TyG and TyG-BMI.
Discussion
Our study provided the detailed report on the impact of gender differences on diet and long-term mortality in a T2DM population. Previous cohort studies have demonstrated a 32% lower risk of CVD mortality and an 18% lower risk of all-cause mortality in participants in the highest quintile of the HEI-2015 compared to those in the lowest quintile of the HEI-2015, after controlling for potential confounders (22). In a follow-up investigation over a median follow-up time of 6.9 years, subjects in the highest quintile of the AHEI had a 27% lower risk of CVD mortality and a 16% lower risk of all-cause mortality, underscoring the significant impact of dietary habits on physical health (23). Notably, higher dietary scores were significantly associated with lower CV/all-cause mortality in males. However, there was no significant association between these dietary indices and the prognosis of females with diabetes (Tables 4, 5). This gender disparity may be attributable to several factors. First, adherence to dietary guidelines tends to differ significantly between genders, as indicated by previous studies. A German study, for instance, reported marked gender differences in dietary adherence and glycaemic control, suggesting that males might cope more effectively with dietary recommendations compared to females, who often adopt independent management strategies (24). Furthermore, female patients have to cook and care for their families, which makes it difficult for them to follow their own diets and eating schedules. Second, physiological differences related to reproductive factors may place females with diabetes at greater cardiometabolic risk. Females typically possess less fat-free muscle mass compared to males, potentially exacerbating insulin resistance and dyslipidaemia (25). A decline in estrogen after menopause may also be a potential reason for females’ poorer prognosis (26). These findings strongly indicate that, as with virtually all medical conditions, gender should be considered in the personalized treatment of diabetes.
Recent studies have demonstrated that the lipid profiles of diabetic females are less favorable than those of males, suggesting that gender differences may influence dietary habits (27). Epidemiological evidence currently supports the existence of gender differences in responses to the Mediterranean diet, which significantly enhances insulin homeostasis in males, with no comparable effects observed in females (28). Females also exhibit a reduced response to alterations in dietary fat and carbohydrate intake compared to males (29). Experimental and clinical studies further illustrate gender differences in substrate utilization, with females predominantly converting non-esterified fatty acids (NEFAs) into triglycerides during resting and postprandial states, favoring lipid storage, whereas males typically oxidize NEFAs for immediate energy generation (25, 30). These metabolic distinctions offer critical insights for tailoring dietary interventions to optimize gender-specific outcomes in diabetes management.
There are substantial evidences that dietary components potentially influence the risk of diabetes in genetically predisposed individuals by regulating inflammation and oxidation processes (31). For example, n-3 fatty acids and fiber- and phytochemical-rich plant-based foods (whole grains, fruits, vegetables, and legumes) possess well-established anti-inflammatory properties, reducing inflammation through antioxidant activity, interference with oxidative stress signaling, and inhibition of pro-inflammatory signal transduction (32). Intake of these diets can effectively improve endothelial dysfunction and reduce the risk of cardiovascular death in patients with diabetes.
Legumes, central components of traditional plant-based diets globally, contain abundant proteins, fibers, magnesium, and bioactive polyphenols (33). Epidemiological analyses involving nearly 100,000 females and over 56,000 males have indicated gender-dependent associations between legume consumption and diabetes prevalence, with legume intake significantly reducing diabetes risk in females but presenting inverse associations in males (34). Notably, the findings of this study suggested that legumes intake has a protective effect on females with diabetes, significantly reducing the CV/all-cause mortality. However, in males, legumes intake significantly increased the CV mortality (Figure 3). This finding demonstrates the prognostic value of legumes in females with T2DM and their positive contribution to females’ health. The protective function of legumes on females with diabetes possibly be due to a variety of biological reasons. The most likely explanation has to do with isoflavones, a type of phytoestrogens found almost exclusively in soybeans and other legumes (35). Estrogen is known to be a potential heart protector and an immunomodulator of inflammatory responses in atherosclerosis (36). Because the chemical structure of isoflavones is similar to estrogen, isoflavones can mimic the effects of estrogen on the human body (37). When males ingest legumes, only about 30 percent produce equol, a metabolite of legumes that is an important isoflavone for humans (38, 39). Polyphenols, including lignans and ketones, also exhibit potent antioxidant properties, potentially contributing to protective effects against diabetes progression (40). Our results also suggested that fruit intake significantly reduced CV/all-cause mortality in males with diabetes (Figure 3). Fruits contain heart-protective components like fiber, folate, nitrates, vitamins, and non-nutritive phytochemicals, including flavonoids such as anthocyanins, flavonols, and flavones, which are abundant in common fruits like berries, citrus fruits, apples, and grapes (41). The results of a randomized controlled trial suggest that flavonoid-rich fruits improve microvascular reactivity and inflammatory status in males (42). Flavonoids have been reported to promote vasodilation and improve vascular function by activating eNOS or enhancing the availability of endogenous NO (43).
A key strength of the study is its use of NHANES data, a large, nationally representative survey known for its timeliness and high quality. Secondly, we made multivariate adjustments: The study accounted for multiple potential confounders in the analysis, including new metabolic markers (TyG and TyG-BMI) that affect cardiovascular risk.
Limitations
Firstly, as an observational study, we cannot draw definitive causal conclusions about the relationship between dietary scores and mortality. Residual confounding from unmeasured or inadequately adjusted factors may influence the associations observed. Secondly, dietary assessments and covariates relied upon self-reported recall, potentially introducing recall bias. Moreover, dietary quality scores were measured only at baseline, limiting insights into the impact of dietary changes during follow-up on long-term mortality outcomes. Future longitudinal studies addressing these limitations will be essential to confirm our findings.
Conclusion
There are gender differences in the relationship between diabetes patients’ diet and their risk of CV and all-cause deaths. Higher dietary scores are significantly associated with CV/all-cause mortality in males but not in females. Legumes intake is unfavorable for males with diabetes, but was substantially connected to lower CV/all-cause mortality in females, with a protective effect in females with diabetes.
Statements
Data availability statement
The original contributions presented in the study are included in the article/Supplementary material, further inquiries can be directed to the corresponding authors.
Ethics statement
The studies involving humans were approved by the national center for health statistics (NCHS) Research Ethics Review Board. The studies were conducted in accordance with the local legislation and institutional requirements. Written informed consent for participation was not required from the participants or the participants’ legal guardians/next of kin in accordance with the national legislation and institutional requirements. Written informed consent was obtained from the individual(s) for the publication of any potentially identifiable images or data included in this article.
Author contributions
ZY: Data curation, Formal analysis, Validation, Writing – original draft, Writing – review & editing. YM: Formal analysis, Funding acquisition, Writing – original draft, Writing – review & editing. JL: Software, Validation, Writing – original draft, Writing – review & editing. WJ: Investigation, Resources, Writing – original draft, Writing – review & editing. YF: Funding acquisition, Resources, Supervision, Writing – original draft, Writing – review & editing.
Funding
The author(s) declare that financial support was received for the research and/or publication of this article. This study was supported by the National Natural Science Foundation of China (Grant No. 81901853 to YF; Grant No. 82100268 to YM), the Chinese Cardiovascular Association-Natural Lipid-Lowering Drugs Fund (Grant No. 2023-CCA-NLD-796 to YF), the Foundation of the State Key Laboratory of Component-Based Chinese Medicine (Grant No. CBCM2023107 to YF), the 2nd Affiliated Hospital of Harbin Medical University (Grant No. PYMS2023-12 to YF), and the Natural Science Foundation of Heilongjiang Province (Grant No. PL2024H087 to YF). Special thanks to the foundation of Wu Jieping Medical Foundation Special Fund for Clinical Research (320.6750.2024–24-10 to YM).
Acknowledgments
The authors sincerely express their profound gratitude to Academician Junbo Ge of the Chinese Academy of Sciences, Professor Bo Yu, and Professor Weihua Zhang of Harbin Medical University for their invaluable guidance and insightful advice. Special and heartfelt appreciation is extended to Professor Jun Ren, whose extraordinary passion, unwavering dedication, and inspiring mentorship have significantly enriched this work.
Conflict of interest
The authors declare that the research was conducted in the absence of any commercial or financial relationships that could be construed as a potential conflict of interest.
Generative AI statement
The authors declare that no Gen AI was used in the creation of this manuscript.
Publisher’s note
All claims expressed in this article are solely those of the authors and do not necessarily represent those of their affiliated organizations, or those of the publisher, the editors and the reviewers. Any product that may be evaluated in this article, or claim that may be made by its manufacturer, is not guaranteed or endorsed by the publisher.
Supplementary material
The Supplementary material for this article can be found online at: https://www.frontiersin.org/articles/10.3389/fnut.2025.1576983/full#supplementary-material
Abbreviations
AHEI, Alternative Healthy Eating Index; AIC, Akaike Information Criterion; BMI, Body Mass Index; CV, Cardiovascular; CVD, Cardiovascular Disease; FBG, Fasting Blood Glucose; HbA1c, Glycosylated Hemoglobin; HEI, Healthy Eating Index; aMED, alternative Mediterranean Diet; HRs, Hazard Ratios; NHANES, National Health and Nutrition Examination Survey; T2DM, Type 2 Diabetes Mellitus; TC, Total Cholesterol; TG, Triglycerides; TyG, Triglyceride and Glucose index.
References
1.
AhmadELimSLampteyRWebbDRDaviesMJ. Type 2 diabetes. Lancet. (2022) 400:1803–20. doi: 10.1016/S0140-6736(22)01655-5
2.
GregoryGARobinsonTILinklaterSEWangFColagiuriSde BeaufortCet al. Global incidence, prevalence, and mortality of type 1 diabetes in 2021 with projection to 2040: a modelling study. Lancet Diabetes Endocrinol. (2022) 10:741–60. doi: 10.1016/S2213-8587(22)00218-2
3.
JosephJJDeedwaniaPAcharyaTAguilarDBhattDLChyunDAet al. Lifestyle AHADCotCo, health C, council on arteriosclerosis T, biology V, cardiology CoC, hypertension co. comprehensive management of cardiovascular risk factors for adults with type 2 diabetes: a scientific statement from the American Heart Association. Circulation. (2022) 145:e722–59. doi: 10.1161/CIR.0000000000001040
4.
TomicDShawJEMaglianoDJ. The burden and risks of emerging complications of diabetes mellitus. Nat Rev Endocrinol. (2022) 18:525–39. doi: 10.1038/s41574-022-00690-7
5.
LeeDYHanKParkSYuJHSeoJAKimNHet al. Glucose variability and the risks of stroke, myocardial infarction, and all-cause mortality in individuals with diabetes: retrospective cohort study. Cardiovasc Diabetol. (2020) 19:1–12. doi: 10.1186/s12933-020-01134-0
6.
WuJZhangYJiLZhaoSHanYZouXet al. Associations among microvascular dysfunction, fatty acid metabolism, and diabetes. Cardiovasc Innov Appl. (2023) 8:941. doi: 10.15212/CVIA.2023.0076
7.
ZafarMIMillsKEZhengJRegmiAHuSQGouLet al. Low-glycemic index diets as an intervention for diabetes: a systematic review and meta-analysis. Am J Clin Nutr. (2019) 110:891–902. doi: 10.1093/ajcn/nqz149
8.
MagkosFHjorthMFAstrupA. Diet and exercise in the prevention and treatment of type 2 diabetes mellitus. Nat Rev Endocrinol. (2020) 16:545–55. doi: 10.1038/s41574-020-0381-5
9.
WuJZhouYHuHYangDYangF. Effects of β-carotene on glucose metabolism dysfunction in humans and type 2 diabetic rats. Acta Mater Med. (2022) 1:138–53. doi: 10.15212/AMM-2021-0009
10.
MenteADehghanMRangarajanSO’DonnellMHuWDagenaisGet al. Diet, cardiovascular disease, and mortality in 80 countries. Eur Heart J. (2023) 44:2560–79. doi: 10.1093/eurheartj/ehad269
11.
FilippouCDTsioufisCPThomopoulosCGMihasCCDimitriadisKSSotiropoulouLIet al. Dietary approaches to stop hypertension (DASH) diet and blood pressure reduction in adults with and without hypertension: a systematic review and meta-analysis of randomized controlled trials. Adv Nutr. (2020) 11:1150–60. doi: 10.1093/advances/nmaa041
12.
BrlekAGregoričM. Diet quality indices and their associations with all-cause mortality, CVD and type 2 diabetes mellitus: an umbrella review. Br J Nutr. (2023) 130:709–18. doi: 10.1017/S0007114522003701
13.
ErtugluLADemirayAAfsarBOrtizAKanbayM. The use of healthy eating index 2015 and healthy beverage index for predicting and modifying cardiovascular and renal outcomes. Curr Nutr Rep. (2022) 11:526–35. doi: 10.1007/s13668-022-00415-2
14.
WongMMLouieJCY. A priori dietary patterns and cardiovascular disease incidence in adult population-based studies: a review of recent evidence. Crit Rev Food Sci Nutr. (2022) 62:6153–68. doi: 10.1080/10408398.2021.1897517
15.
XuZSteffenLMSelvinERebholzCM. Diet quality, change in diet quality and risk of incident CVD and diabetes. Public Health Nutr. (2020) 23:329–38. doi: 10.1017/S136898001900212X
16.
RosatoVTempleNJLa VecchiaCCastellanGTavaniAGuercioV. Mediterranean diet and cardiovascular disease: a systematic review and meta-analysis of observational studies. Eur J Nutr. (2019) 58:173–91. doi: 10.1007/s00394-017-1582-0
17.
FanHWangYRenZLiuXZhaoJYuanYet al. Mediterranean diet lowers all-cause and cardiovascular mortality for patients with metabolic syndrome. Diabetol Metab Syndr. (2023) 15:107. doi: 10.1186/s13098-023-01052-7
18.
ChungWKErionKFlorezJCHattersleyATHivertM-FLeeCGet al. Precision medicine in diabetes: a consensus report from the American Diabetes Association (ADA) and the European Association for the Study of diabetes (EASD). Diabetes Care. (2020) 43:1617–35. doi: 10.2337/dci20-0022
19.
Shams-WhiteMMPannucciTELermanJLHerrickKAZimmerMMathieuKMet al. Healthy eating index-2020: review and update process to reflect the dietary guidelines for Americans, 2020-2025. J Acad Nutr Diet. (2023) 123:1280–8. doi: 10.1016/j.jand.2023.05.015
20.
PoursalehiDBahramiGMirzaeiSAsadiAAkhlaghiMSaneeiP. Association between alternative healthy eating index (AHEI) with metabolic health status in adolescents with overweight and obesity. BMC Public Health. (2024) 24:42. doi: 10.1186/s12889-023-17558-8
21.
Guasch-FerréMWillettWC. The Mediterranean diet and health: a comprehensive overview. J Intern Med. (2021) 290:549–66. doi: 10.1111/joim.13333
22.
HuEASteffenLMCoreshJAppelLJRebholzCM. Adherence to the healthy eating index–2015 and other dietary patterns may reduce risk of cardiovascular disease, cardiovascular mortality, and all-cause mortality. J Nutr. (2020) 150:312–21. doi: 10.1093/jn/nxz218
23.
LiFZhangYPanLChenH. Effects of dietary patterns on the all-cause mortality and cardiovascular disease mortality in patients with hypertension: A cohort study based on the NHANES database. Clin Cardiol. (2023) 46:1353–70. doi: 10.1002/clc.24118
24.
RaumEKrämerHURüterGRothenbacherDRosemannTSzecsenyiJet al. Medication non-adherence and poor glycaemic control in patients with type 2 diabetes mellitus. Diabetes Res Clin Pract. (2012) 97:377–84. doi: 10.1016/j.diabres.2012.05.026
25.
Kautzky-WillerAHarreiterJPaciniG. Sex and gender differences in risk, pathophysiology and complications of type 2 diabetes mellitus. Endocr Rev. (2016) 37:278–316. doi: 10.1210/er.2015-1137
26.
DavisSRBaberRJ. Treating menopause—MHT and beyond. Nat Rev Endocrinol. (2022) 18:490–502. doi: 10.1038/s41574-022-00685-4
27.
DingLFanYHeJWangRHeQCuiJet al. Different indicators of adiposity and fat distribution and cardiometabolic risk factors in patients with type 2 diabetes. Obesity. (2021) 29:837–45. doi: 10.1002/oby.23151
28.
BédardACorneauLLamarcheBDodinSLemieuxS. Sex-related differences in the effects of the Mediterranean diet on glucose and insulin homeostasis. J Nutr Metab. (2014) 2014:424130. doi: 10.1155/2014/424130
29.
LiebermanHRFulgoniVLIIIAgarwalSPasiakosSMBerrymanCE. Protein intake is more stable than carbohydrate or fat intake across various US demographic groups and international populations. Am J Clin Nutr. (2020) 112:180–6. doi: 10.1093/ajcn/nqaa044
30.
TramuntBSmatiSGrandgeorgeNLenfantFArnalJ-FMontagnerAet al. Sex differences in metabolic regulation and diabetes susceptibility. Diabetologia. (2020) 63:453–61. doi: 10.1007/s00125-019-05040-3
31.
MacvaninMTIsenovicER. Diabetes and associated cardiovascular complications: the role of microRNAs. Cardiol Plus. (2023) 8:167–83. doi: 10.1097/CP9.0000000000000062
32.
ChenLPuYXuYHeXCaoJMaYet al. Anti-diabetic and anti-obesity: efficacy evaluation and exploitation of polyphenols in fruits and vegetables. Food Res Int. (2022) 157:111202. doi: 10.1016/j.foodres.2022.111202
33.
AffrifahNSUebersaxMAAminS. Nutritional significance, value-added applications, and consumer perceptions of food legumes: a review. Legu Sci. (2023) 5:e192. doi: 10.1002/leg3.192
34.
AgrawalSEbrahimS. Association between legume intake and self-reported diabetes among adult men and women in India. BMC Public Health. (2013) 13:1–13. doi: 10.1186/1471-2458-13-706
35.
DasSSharangiAEgbunaCJeevanandamJEzzatSMAdetunjiCOet al. Health benefits of isoflavones found exclusively of plants of the fabaceae family In: MoboladjiBMOnyeikePC, editors. Functional foods and nutraceuticals. Cham: Springer (2020). 473–508.
36.
MinJLiuXPengRChenC-CWangWGuoR-T. New generation estrogen receptor-targeted agents in breast cancer: present situation and future prospectives. Acta Mater Med. (2024) 3:57–71. doi: 10.15212/AMM-2024-0006
37.
Tomczyk-WarunekAWiniarska-MieczanABlicharskiTBlicharskiRKowalFPanoITet al. Consumption of phytoestrogens affects bone health by regulating estrogen metabolism. J Nutr. (2024) 154:2611–27. doi: 10.1016/j.tjnut.2024.05.026
38.
LvJJinSZhangYZhouYLiMFengN. Equol: a metabolite of gut microbiota with potential antitumor effects. Gut Pathog. (2024) 16:35. doi: 10.1186/s13099-024-00625-9
39.
TengYLuoWZhouJWangMWuJNieXet al. Clinical research on tai chi: a review of health benefits. Acupunct Herb Med. (2024) 4:320–45. doi: 10.1097/HM9.0000000000000097
40.
SilvaASilvaVIgrejasGAiresAFalcoVValentãoPet al. Phenolic compounds classification and their distribution in winemaking by-products. Eur Food Res Technol. (2023) 249:207–39. doi: 10.1007/s00217-022-04163-z
41.
LópezJG-E. Flavonoids in health and disease. Curr Med Chem. (2019) 26:6972–5. doi: 10.2174/092986732639191213095405
42.
MacreadyALGeorgeTWChongMFAlimbetovDSJinYVidalAet al. Flavonoid-rich fruit and vegetables improve microvascular reactivity and inflammatory status in men at risk of cardiovascular disease—FLAVURS: a randomized controlled trial. Am J Clin Nutr. (2014) 99:479–89. doi: 10.3945/ajcn.113.074237
43.
HarahapUSyahputraRAAhmedANasutionAWiselyWSiraitMLet al. Current insights and future perspectives of flavonoids: A promising antihypertensive approach. Phytother Res. (2024) 38:3146–68. doi: 10.1002/ptr.8199
Summary
Keywords
Type 2 diabetes, healthy eating index, mediterranean diet, all-cause mortality, cardiovascular mortality, gender-specific
Citation
Youqi Z, Meng Y, Liu J, Jianjun W and Fan Y (2025) Sex-specific associations between diet quality and mortality in adults with diabetes: findings from NHANES 2001-2018. Front. Nutr. 12:1576983. doi: 10.3389/fnut.2025.1576983
Received
14 February 2025
Accepted
26 March 2025
Published
16 April 2025
Volume
12 - 2025
Edited by
Haoqiang Zhang, University of Science and Technology of China, China
Reviewed by
Mingbao Lin, Chinese Academy of Medical Sciences & Peking Union Medical College, China
Chunhua Wu, Wuxi People’s Hospital, China
Longbin Zheng, Nanjing Medical University, China
Shuai Li, Beijing University of Chinese Medicine, China
Updates
Copyright
© 2025 Youqi, Meng, Liu, Jianjun and Fan.
This is an open-access article distributed under the terms of the Creative Commons Attribution License (CC BY). The use, distribution or reproduction in other forums is permitted, provided the original author(s) and the copyright owner(s) are credited and that the original publication in this journal is cited, in accordance with accepted academic practice. No use, distribution or reproduction is permitted which does not comply with these terms.
*Correspondence: Wu Jianjun, drwujianjun@sina.comYang Fan, yangfana@sina.com
†These authors have contributed equally to this work
‡ORCID: Yang Fan, orcid.org/0000-0003-4676-3778
Disclaimer
All claims expressed in this article are solely those of the authors and do not necessarily represent those of their affiliated organizations, or those of the publisher, the editors and the reviewers. Any product that may be evaluated in this article or claim that may be made by its manufacturer is not guaranteed or endorsed by the publisher.