Abstract
Background:
Stress hyperglycemia ratio (SHR), which combines acute admission glucose with chronic glycemic indices, is a novel marker of stress hyperglycemia. Its association with acute myocardial infarction (AMI) risk in the general population remains unclear.
Methods:
This prospective cohort study used data from the UK Biobank and included 337,620 participants without known cardiovascular disease (CVD). SHR was calculated as admission glucose/[(28.7 × HbA1c%) – 46.7], with levels categorized into quintiles. The primary outcome was incident AMI, while ST-segment elevation myocardial infarction (STEMI) and non-ST-segment elevation myocardial infarction (NSTEMI) were evaluated as secondary outcomes. Cox proportional hazards models assessed the relationship between SHR and incident AMI risk. An accelerated failure time model was used to evaluate the effect of SHR on time to AMI onset, and dynamic changes in SHR were analyzed using a restricted cubic spline (RCS).
Results:
During a median follow-up of 164.8 months (IQR: 155.7–173.6), 10,598 AMI events, including 3,019 STEMI and 5,711 NSTEMI cases, were recorded. Compared with the fourth quintile, the first, second, and third quintiles had increased AMI risks by 19% (HR 1.19; 95% CI 1.12–1.27), 16% (HR 1.16; 95% CI 1.09–1.24), and 7% (HR 1.07; 95% CI 1.00–1.14), respectively, with no significant increase observed in the highest quintile. RCS analysis revealed a U-shaped relationship between SHR and incident AMI risk (P for non-linearity < 0.001), with the lowest risk at an SHR of 0.966.
Conclusion:
In the general population without known CVD, SHR exhibited a U-shaped association with incident AMI risk, with the lowest risk observed at an SHR of 0.966, particularly at levels below this threshold.
In this prospective UK Biobank cohort of 337,620 individuals without cardiovascular disease, SHR exhibited a U-shaped association with incident AMI risk, with the lowest risk at an SHR of 0.966 (P for nonlinearity < 0.001). Both low and high SHR levels were associated with elevated AMI risk. In addition, lower SHR levels were associated with earlier AMI onset, with the first quintile advancing the median AMI onset by up to 13.23 months compared to the fourth quintile. 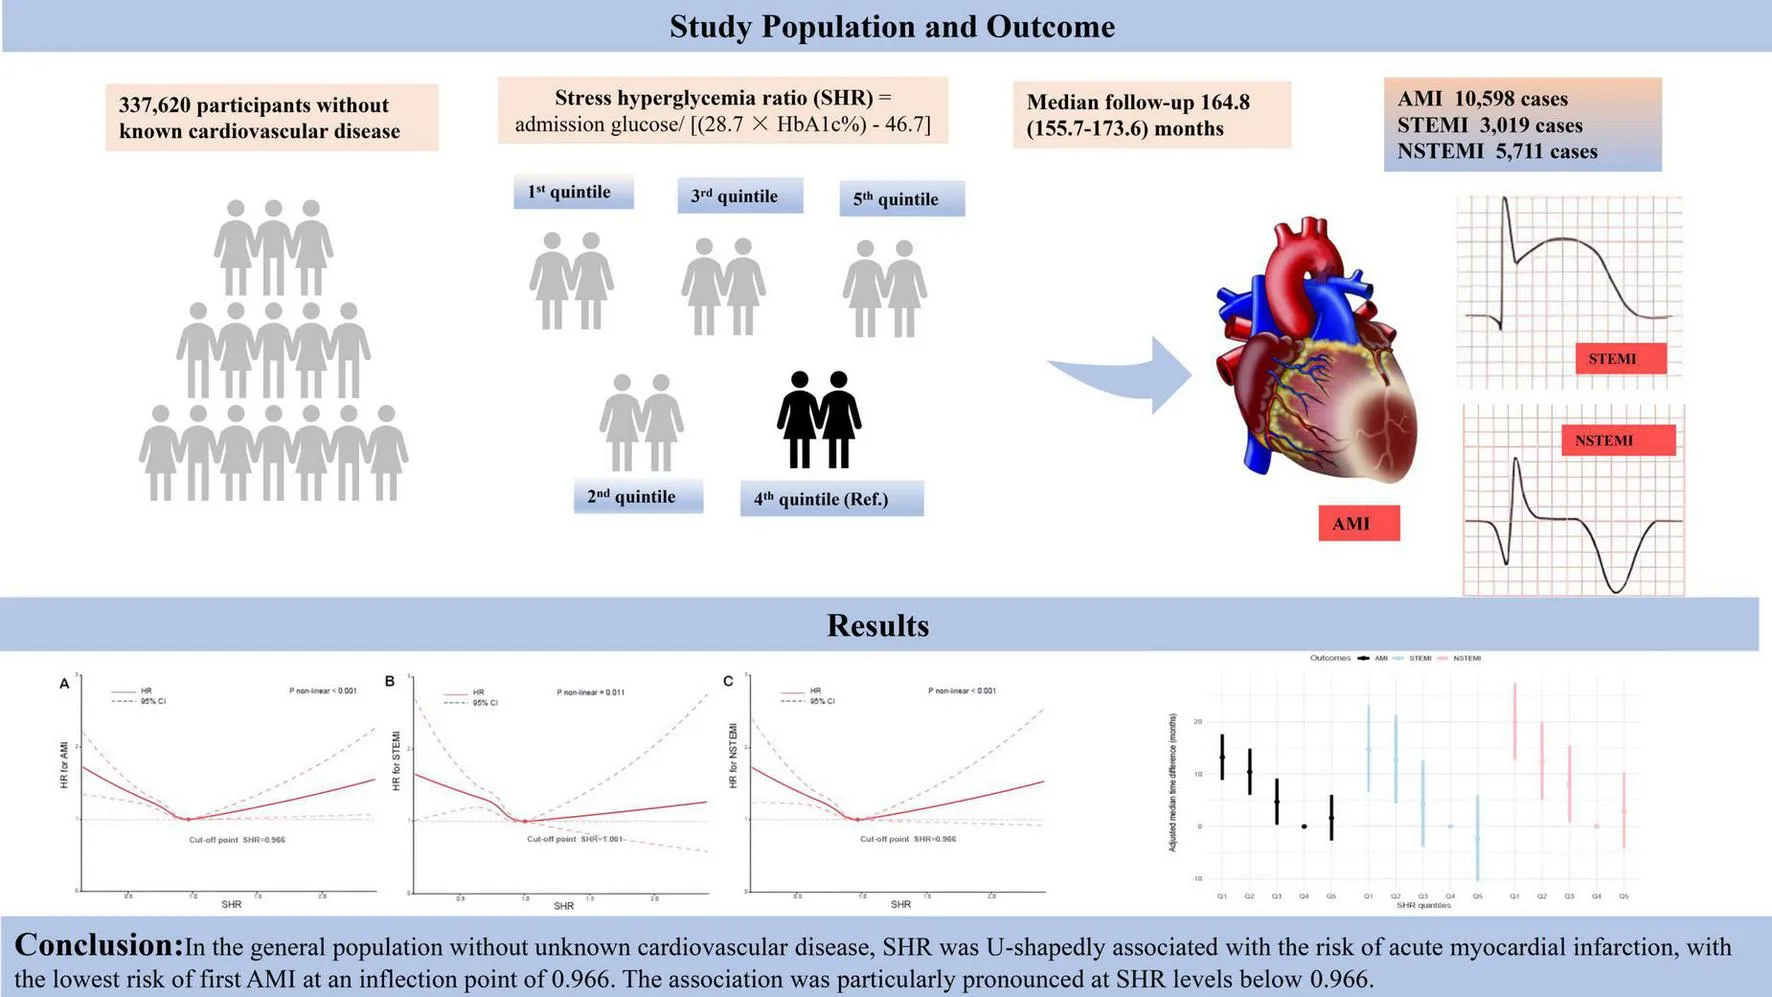
Introduction
Acute myocardial infarction (AMI) is a major contributor to global mortality and morbidity, presenting substantial challenges to healthcare systems worldwide. With an annual incidence approaching 3 million cases globally, approximately 70% of AMI cases are attributed to atherosclerotic plaque rupture accompanied by thrombosis (1). AMI is categorized into non-ST-segment elevation myocardial infarction (NSTEMI) and ST-segment elevation myocardial infarction (STEMI) based on electrocardiographic characteristics. Despite advances in understanding AMI pathophysiology and management, the identification of effective biomarkers for risk stratification in the general population remains a central focus in cardiovascular research.
Stress hyperglycemia, characterized by transient elevations in blood glucose levels induced by acute illness or physiological stress, is a common adaptive response (2). It primarily results from increased secretion of counter-regulatory hormones such as catecholamines and cortisol, which promote gluconeogenesis and glycogenolysis, thereby raising blood glucose levels (3, 4). Moreover, stress hyperglycemia reflects the body’s response to severe illness through enhanced inflammatory and neurohormonal activation. It is often indicative of illness severity and serves as a critical marker for risk assessment in hospitalized patients (5–7). However, admission blood glucose levels alone may not fully capture the acute hyperglycemic state, as they are influenced by the patient’s underlying chronic glycaemic control (8). Furthermore, using a single glycemic threshold for risk assessment (e.g., 180 mg/dL) may misjudge individuals’ true risk, especially if chronic metabolic conditions are present (2, 9).
In this context, the stress hyperglycemia ratio (SHR)—which integrates acute admission blood glucose levels with chronic glycemic indices, such as glycated hemoglobin (HbA1c)—has emerged as a novel marker of stress-induced hyperglycemia (10). Although once considered a benign physiological adaptation, growing evidence highlights the detrimental effects of stress hyperglycemia, especially in patients with AMI (8, 11–13). Mechanistically, this may involve the promotion of oxidative stress and endothelial dysfunction, both of which can worsen myocardial injury and hinder recovery. Atherosclerosis, the pathological foundation of AMI, is driven by persistent inflammation, with oxidative stress playing a pivotal role in vascular dysregulation. Endothelial dysfunction, often preceding myocardial infarction and triggered by inflammation or infection, accelerates atherosclerotic progression, plaque instability, and thrombus formation—ultimately leading to AMI (14). Despite the biological plausibility, the relationship between SHR and AMI risk in the general population remains poorly characterized. We hypothesize that an elevated SHR, mediated by oxidative stress and endothelial dysfunction, may identify individuals at heightened risk for AMI. Therefore, this study aims to investigate the association between SHR and AMI risk in the general population.
Materials and methods
Study design and data source
This prospective cohort study utilized data from the UK Biobank, collected between 2006 and 2010 across various centers in the United Kingdom. The detailed methodology has been previously described (15). At baseline, comprehensive data were obtained on demographic and clinical characteristics, lifestyle factors, medical history, and biological samples through physical examinations, structured interviews, and laboratory assessments. Ethical approval for the study was granted by the North West Multi-Centre Research Ethics Committee (REC reference: 11/NW/0382), and written informed consent was obtained from all participants. Additional details are available on the UK Biobank website1.
A total of 384,159 participants with complete data on the SHR and no prior history of coronary artery disease were initially included. Participants who were pregnant (n = 111) or had a history of cancer (n = 40,850) were excluded. Furthermore, individuals with pre-existing othter cardiovascular conditions were excluded to minimize confounding effects, including those with heart failure (n = 542), valvular heart disease (n = 1,781), cardiomyopathy (n = 281), and arrhythmias (n = 754). After applying these exclusion criteria, the final analytic cohort comprised 337,620 participants. This study was conducted in accordance with the ethical standards of the Declaration of Helsinki.
Assessment of SHR
Standard hematological tests were performed on fresh whole blood samples within 24 h of collection. Blood glucose levels were measured using Beckman Coulter AU5800 analyzers, while glycated hemoglobin A1c (HbA1c) was assessed using Bio-Rad Variant II Turbo analyzers. A quality control protocol was implemented to ensure the accuracy and reliability of HbA1c measurements. This involved bracketing participant samples with internal quality control materials at low, medium, and high concentrations. The precision of glucose measurements, as reflected by coefficients of variation (CV), ranged from 1.49 to 1.82%. For HbA1c, the CV ranged from 1.46 to 2.13%, indicating high measurement precision.
Estimated average glucose (eAG) levels were calculated from HbA1c values using the following equation: eAG (mg/dL) = 28.7 × HbA1c (%) − 46.7 (16). The SHR was then calculated by dividing the admission blood glucose level (mg/dL) by the eAG (mg/dL) (10), with the blood glucose value recorded at the initial assessment considered as the admission level.
Assessment of other covariates
The baseline survey collected self-reported data on a range of variables, including age, sex, race, blood pressure, lipid profiles, physical activity levels, the Townsend Deprivation Index (TDI), chronic health conditions, medication use, fasting duration, and smoking and alcohol consumption patterns. The TDI, an established measure of socioeconomic status, incorporated indicators such as employment status, car and home ownership, and living space per person, with higher scores reflecting greater socioeconomic deprivation. To assess dietary risk factors, a methodology similar to that used in previous UK Biobank studies was employed to construct a composite dietary risk score (17). Briefly, nine dietary components—processed meats, red meats, fish, milk, butter/margarine, cereals, table salt, water, and fruits and vegetables—were selected for inclusion in the score. These components were categorized based on adherence to dietary guidelines recommended by UK and European health authorities. Points were assigned for consumption patterns deviating from these recommendations, yielding a total dietary score ranging from 0 (healthiest) to 9 (least healthy). Physical activity levels were quantified in total metabolic equivalent (MET) minutes per week, calculated using an adapted version of the International Physical Activity Questionnaire. Standardized protocols were followed to measure body mass index (BMI), blood pressure, and lipid profiles. Baseline comorbidities were ascertained through self-reported information obtained via questionnaires or interviews at enrolment, as well as through diagnostic codes from hospital records and surgical procedure data.
Assessment of AMI and its subtypes
AMI and its subtypes were identified using algorithmically defined outcomes derived from the Health-Related Outcomes data within the UK Biobank. This algorithm-based classification system detects AMI events and subtypes with high accuracy by integrating coded health information from multiple sources, including baseline assessments, hospital admission records, and death registries. This automated approach is particularly beneficial in large-scale epidemiological research, as it streamlines outcome ascertainment and reduces reliance on manual diagnostic code integration. AMI diagnoses were coded according to the International Classification of Diseases, Ninth and Tenth Revisions (ICD-9 and ICD-10) (Supplementary Table S1).
The algorithms, developed by the UK Biobank Outcome Adjudication Group, are designed to maximize positive predictive value (PPV) for health event identification. A systematic review by the UK Biobank Cardiac Outcomes Group reported PPVs ranging from 75 to 100% for algorithmically defined AMI based on linked hospital admission records, with PPVs exceeding 90% for NSTEMI and ranging from 71 to 100% for STEMI (18). The PPV for AMI events identified from death registry data was approximately 70–75%.
The primary outcome of this study was incident AMI, with secondary outcomes including incident STEMI and NSTEMI. For each participant, the observation period extended from the date of enrollment to the earliest occurrence of incident AMI, death, or the censoring date of 29 November 2022.
Statistical analysis
Missing categorical variables were handled using missing indicator methods, while continuous variables were imputed using the mean. The distribution of continuous variables was assessed using the Kolmogorov–Smirnov test, which indicated non-normality. Consequently, categorical variables were summarized as frequencies and percentages, and continuous variables were reported as medians with interquartile ranges (IQRs). SHR levels were stratified into quintiles. Group comparisons were performed using the Chi-squared test for categorical variables and the Kruskal–Wallis test for continuous variables. AMI incidence within SHR quintiles was expressed as events per 1,000 person-years, while cumulative incidence was calculated as the number of events divided by the total population at risk.
Kaplan–Meier survival curves were generated to estimate AMI incidence across SHR quintile groups, and differences between groups were assessed using the log-rank test. Based on the observed exposure–response pattern, the fourth SHR quintile was selected as the reference category. Hazard ratios (HRs) and 95% confidence intervals (CIs) for the association between SHR and incident AMI were estimated using Cox proportional hazards models. The proportional hazards assumption was verified using Schoenfeld residuals, with no significant violations observed.
Potential confounders were identified based on established a priori knowledge relevant to causal inference. A directed acyclic graph (DAG) was constructed using the DAGitty online tool2 to determine the minimally sufficient adjustment set. This set included sex, age, race, BMI,TDI, fasting duration, physical activity, dietary score, diabetes mellitus, insulin use, and smoking and alcohol consumption status (Supplementary Figure S1). Hypertension, antihypertensive medication, blood pressure and lipid parameters, which are potential mediating variables in the exposure-outcome association, were not adjusted for in the main analysis. Three Cox regression models were fitted: Model 1 was unadjusted (crude); Model 2 adjusted for age, sex, and race; and Model 3 additionally adjusted for the full set of confounding variables identified through the DAG.
To explore potential non-linear associations between SHR and incident AMI risk, restricted cubic spline (RCS) functions were fitted with four knots placed at the 5th, 35th, 65th, and 95th percentiles of the SHR distribution. The selection and placement of knots followed Harrell’s recommended strategy (19), balancing model flexibility and avoidance of overfitting, a method widely adopted in large-scale epidemiological studies (20–23). Non-linearity was tested using a log-likelihood ratio test. Where a significant non-linear association was observed, a two-piecewise linear regression model was applied to estimate the inflection point. Further analyses are detailed in Supplementary Appendix 1. Additionally, SHR values were standardized using Z-score normalization (mean = 0, SD = 1) to quantify the change in AMI risk per one standard deviation increase in SHR before and after the inflection point. Subgroup analyses were conducted across predefined strata, including age (< 55 vs. ≥ 55 years), sex (men vs. women), race (Caucasian vs. non-Caucasian), BMI (< 30 vs. ≥ 30 kg/m2), and diabetes status (yes vs. no). Between-group interaction P values were obtained using likelihood ratio tests.
To assess the temporal influence of SHR on AMI onset, an accelerated failure time (AFT) model was fitted, under the assumption that covariates accelerate or delay event timing independently of the proportional hazards assumption. A multivariate AFT model evaluated the time to AMI onset across SHR quintiles, using the fourth quintile (Q4) as the reference group. Differences in median AMI onset time were computed in months by subtracting the reference value from each comparison group. Negative values indicated delayed AMI onset, while positive values indicated earlier onset relative to Q4. A flexible Weibull distribution was used to accommodate the right-skewed distribution of time-to-event data (Supplementary Figures S2,S3).
Sensitivity analyses were conducted to assess the robustness of the findings using two approaches. First, multiple imputation was applied to address missing data, using predictive mean matching across five replicates and Markov Chain Monte Carlo methods. Imputed datasets were analyzed using Cox models, and results were pooled accordingly. Second, participants who experienced AMI within 2 years of enrolment were excluded to minimize potential reverse causality. Third, the sample was restricted to participants with SHR values between the 2.5th and 97.5th percentiles to minimize the influence of extreme values and assess whether the association between SHR and AMI remained robust. Fourth, the Cox models were further adjusted for hypertension, antihypertensive medication use, and lipid-lowering therapy to assess whether the association remained after accounting for these potential mediators. All statistical analyses were performed using R software (version 4.2.0), and a two-sided P < 0.05 was considered statistically significant.
Results
Figure 1 presents the participant selection flowchart. Table 1 summarizes the baseline characteristics of the 337,620 participants without a history of CVD. The median age of the cohort was 57 years (interquartile range [IQR]: 49–62 years), with 45.72% being male and 94.26% identified as Caucasian. Participants were stratified into quintiles according to their SHR levels, with the following ranges: 0.07– < 0.75, 0.75– < 0.80, 0.80– < 0.86, 0.86– < 0.93, and 0.93–3.18. Significant differences across SHR quintiles were observed for multiple baseline variables, including age, sex, race, TDI, BMI, blood pressure, lipid profiles, physical activity levels, chronic health conditions, medication use, fasting duration, and smoking and alcohol consumption behaviors.
FIGURE 1
TABLE 1
| Variables | Total | SHR quintiles | |||||
| Q1 (0.07– < 0.75) | Q2 (0.75–<0.80) | Q3 (0.80–< 0.86) | Q4 (0.86– < 0.93) | Q5 (0.93–3.18) | P-value | ||
| Number | 337,620 | 67,524 | 67,523 | 67,522 | 67,526 | 67,525 | |
| Age (years) | 57 (49–62) | 57 (50–63) | 57 (50–63) | 57 (49–62) | 56 (48–62) | 56 (48–62) | < 0.001 |
| Men (%) | 154,347 (45.72%) | 31,459 (46.59%) | 29,221 (43.28%) | 29,644 (43.90%) | 30,949 (45.83%) | 33,074 (48.98%) | < 0.001 |
| Caucasian (%) | 318235 (94.26%) | 61138 (90.54%) | 63376 (93.86%) | 64301 (95.23%) | 64788 (95.95%) | 64632 (95.72%) | < 0.001 |
| TDI | −2.17 (−3.66–0.45) | −2 (−3.59–0.86) | −2.17 (−3.67–0.42) | −2.26 (−3.69–0.28) | −2.21 (−3.68–0.30) | −2.17 (−3.65–0.40) | < 0.001 |
| BMI (Kg/m2) | 26.66 (24.08–29.73) | 26.97 (24.19–30.34) | 26.66 (24.06–29.72) | 26.51 (24.01–29.48) | 26.46 (24–29.37) | 26.74 (24.16–29.78) | < 0.001 |
| DBP (mmHg) | 82 (75.50–89) | 81.50 (75–88.50) | 82 (75.50–89) | 82.50 (75.50–89) | 82.50 (76–89.50) | 82.50 (76–89.50) | < 0.001 |
| SBP (mmHg) | 136 (124.50–149) | 134.50 (123.5–147.5) | 135.50 (124–148.5) | 136 (124.50–149) | 136.50 (125–149.5) | 138 (126.50–151) | < 0.001 |
| Physical activity (MET-min/week) | 2626.50 (1070–2906) | 2661 (1034–2825.25) | 2661 (1074–2910) | 2661 (1097–2977.5) | 2593 (1095–2968.5) | 2535 (1053–2868) | < 0.001 |
| Diet score | 5 (4–6) | 5 (4–6) | 5 (4–6) | 5 (4–6) | 5 (4–6) | 5 (4–6) | < 0.001 |
| HbA1c (%) | 5.36 (5.13–5.59) | 5.60 (5.39–5.84) | 5.45 (5.28–5.64) | 5.34 (5.18–5.52) | 5.22 (5.06–5.42) | 5.11 (4.89–5.39) | < 0.001 |
| TC (mmol/L) | 5.71 (5–6.46) | 5.68 (4.93–6.46) | 5.78 (5.07–6.53) | 5.77 (5.08–6.51) | 5.72 (5.02–6.46) | 5.59 (4.87–6.34) | < 0.001 |
| HDL-C (mmol/L) | 1.40 (1.20–1.70) | 1.40 (1.10–1.60) | 1.40 (1.20–1.70) | 1.40 (1.20–1.70) | 1.40 (1.20–1.70) | 1.40 (1.20–1.70) | < 0.001 |
| LDL-C (mmol/L) | 3.57 (3.01–4.15) | 3.56 (2.98–4.16) | 3.62 (3.07–4.21) | 3.61 (3.07–4.19) | 3.57 (3.03–4.14) | 3.47 (2.92–4.04) | < 0.001 |
| TG (mmol/L) | 1.47 (1.04–2.13) | 1.57 (1.09–2.28) | 1.48 (1.05–2.13) | 1.43 (1.03–2.06) | 1.41 (1–2.03) | 1.47 (1.02–2.17) | < 0.001 |
| Glucose (mg/dl) | 88.49 (82.64–95.24) | 79.36 (74.05–84.35) | 85.30 (81.41–89.41) | 88.52 (84.60–92.81) | 91.84 (87.46–96.66) | 99.79 (92.75–110.92) | < 0.001 |
| Fasting time (hours) | 3 (2–4) | 3 (2–4) | 3 (3–5) | 3 (3–5) | 3 (3–4) | 3 (2–4) | < 0.001 |
| Diabetes mellitus (%) | 14199 (4.21%) | 4951 (7.33%) | 1703 (2.52%) | 1393 (2.06%) | 1461 (2.16%) | 4691 (6.95%) | < 0.001 |
| Hypertension (%) | 83465 (24.72%) | 18034 (26.71%) | 15949 (23.62%) | 15512 (22.97%) | 15685 (23.23%) | 18285 (27.08%) | < 0.001 |
| Current smoker (%) | 35381 (10.49%) | 10351 (15.35%) | 7700 (11.42%) | 6456 (9.57%) | 5811 (8.61%) | 5063 (7.51%) | < 0.001 |
| Current drinker (%) | 311232 (92.28%) | 60411 (89.57%) | 61936 (91.82%) | 62682 (92.92%) | 63268 (93.78%) | 62935 (93.33%) | < 0.001 |
| Antihypertensives use (%) | 58110 (17.21%) | 13037 (19.31%) | 11012 (16.31%) | 10482 (15.52%) | 10601 (15.70%) | 12978 (19.22%) | < 0.001 |
| Lipid-lowering drugs use (%) | 44360 (13.14%) | 11840 (17.53%) | 8730 (12.93%) | 7513 (11.13%) | 7226 (10.70%) | 9051 (13.40%) | < 0.001 |
| Insulin use (%) | 2796 (0.83%) | 1071 (1.59%) | 187 (0.28%) | 182 (0.27%) | 188 (0.28%) | 1168 (1.73%) | < 0.001 |
Baseline characteristics of 337,620 participants stratified by quintiles of stress hyperglycemia ratio.
TDI, Townsend deprivation index; BMI, body mass index; TC, total cholesterol; LDL-C, low-density lipoprotein cholesterol; HDL-C, high-density lipoprotein; MET, metabolic equivalent task; SBP, systolic blood pressure; DBP, diastolic blood pressure.
SHR and incident AMI
During a median follow-up of 164.8 months (IQR: 155.7–173.6), 10,598 cases of AMI (3.14% of the cohort), 3,019 cases of STEMI (0.89%), and 5,711 cases of NSTEMI (1.69%) were documented. Kaplan–Meier survival analysis revealed significant differences in the incidence of AMI, STEMI, and NSTEMI across SHR quintiles (log-rank test, P < 0.001), with the lowest incidence observed in the fourth quintile and the highest in the first. A similar trend was noted for cumulative incidence (Figure 2 and Table 2).
FIGURE 2
TABLE 2
| Event/total | Person-years | Incidence rate (Per 1,000 person-years) | Unadjusted HR (95%CI) | P-value | Adjusted HR† (95%CI) | P-value | Multivariate adjusted HR‡ (95%CI) | P-value | |
| AMI | 10,598/337,620 | ||||||||
| SHR Q1 | 2,693/67,524 | 902,129.04 | 2.98 | 1.46 (1.37–1.55) | < 0.001 | 1.38 (1.30–1.47) | < 0.001 | 1.19 (1.12–1.27) | < 0.001 |
| SHR Q2 | 2,214/67,523 | 903,592.23 | 2.45 | 1.22 (1.15–1.30) | < 0.001 | 1.21 (1.14–1.29) | < 0.001 | 1.16 (1.09–1.24) | < 0.001 |
| SHR Q3 | 1,961/67,522 | 902,435.54 | 2.17 | 1.08 (1.02–1.16) | 0.013 | 1.08 (1.02–1.16) | 0.014 | 1.07 (1.0–1.14) | 0.037 |
| SHR Q4 | 1,800/67,526 | 899,636.56 | 2 | Reference | Reference | Reference | |||
| SHR Q5 | 1,984/67,525 | 895,087.93 | 2.22 | 1.11 (1.04–1.18) | 0.002 | 1.09 (1.02–1.16) | 0.012 | 1.02 (0.96–1.09) | 0.453 |
| STEMI | 3,019/337,620 | ||||||||
| SHR Q1 | 750/67,524 | 910,709.49 | 0.82 | 1.42 (1.27–1.59) | < 0.001 | 1.36 (1.22–1.52) | < 0.001 | 1.21 (1.08–1.36) | < 0.001 |
| SHR Q2 | 654/67,523 | 910,754.18 | 0.72 | 1.24 (1.10–1.39) | < 0.001 | 1.25 (1.11–1.40) | < 0.001 | 1.19 (1.06–1.34) | 0.003 |
| SHR Q3 | 564/67,522 | 908,890.51 | 0.62 | 1.07 (0.95–1.20) | 0.266 | 1.08 (0.96–1.21) | 0.215 | 1.06 (0.94–1.20) | 0.31 |
| SHR Q4 | 525/67,526 | 905,460.19 | 0.58 | Reference | Reference | Reference | |||
| SHR Q5 | 526/67,525 | 901,436.54 | 0.58 | 1.01 (0.89–1.14) | 0.912 | 0.98 (0.87–1.10) | 0.721 | 0.97 (0.86–1.09) | 0.61 |
| NSTEMI | 5,711/337,620 | ||||||||
| SHR Q1 | 1,463/67,524 | 908,619.47 | 1.61 | 1.52 (1.40–1.65) | < 0.001 | 1.44 (1.33–1.56) | < 0.001 | 1.24 (1.14–1.34) | < 0.001 |
| SHR Q2 | 1,167/67,523 | 909,159.64 | 1.28 | 1.22 (1.12–1.33) | < 0.001 | 1.20 (1.10–1.31) | < 0.001 | 1.15 (1.06–1.26) | 0.001 |
| SHR Q3 | 1,065/67,522 | 906,998.69 | 1.17 | 1.12 (1.02–1.22) | 0.014 | 1.11 (1.02–1.21) | 0.017 | 1.10 (1.01–1.20) | 0.036 |
| SHR Q4 | 950/67,526 | 903,990.77 | 1.05 | Reference | Reference | Reference | |||
| SHR Q5 | 1,066/67,525 | 899,995.58 | 1.18 | 1.13 (1.03–1.23) | 0.007 | 1.11 (1.01–1.21) | 0.024 | 1.04 (0.95–1.13) | 0.442 |
Cox proportional hazards analysis to assess SHR quintile levels and risk of AMI.
SHR, stress hyperglycemia ratio; AMI, acute myocardial infarction; STEMI, ST-segment elevation myocardial infarction; NSTEMI, non-ST-segment elevation myocardial infarction.
†Indicates model adjusted for age, sex, and race. ‡Indicates model adjusted for age, sex, race, body mass index, Townsend Deprivation Index, physical activity, diet score, insulin use, fasting time, diabetes mellitus, smoking and drinking status.
Cox regression analyses were performed using the fourth SHR quintile as the reference group, with results presented in Table 2. In unadjusted models, both higher and lower SHR quintiles were associated with increased risks of AMI and NSTEMI (P < 0.05), while lower SHR levels were associated with higher STEMI risk (P < 0.05). These associations persisted after adjusting for age, sex, and race. In the fully adjusted multivariable model, the first, second, and third SHR quintiles were associated with a 19% (HR 1.19, 95% CI: 1.12–1.27), 16% (HR 1.16, 95% CI: 1.09–1.24), and 7% (HR 1.07, 95% CI: 1.00–1.14) increased risk of AMI, respectively. For STEMI, the corresponding risk increases were 21% (HR 1.21, 95% CI: 1.08–1.36), 19% (HR 1.19, 95% CI: 1.06–1.34), and 6% (HR 1.06, 95% CI: 0.94–1.20). For NSTEMI, the increases were 24% (HR 1.24, 95% CI: 1.14–1.34), 15% (HR 1.15, 95% CI: 1.06–1.26), and 10% (HR 1.10, 95% CI: 1.01–1.20), respectively. Notably, the highest SHR quintile was not associated with a significantly increased risk of AMI compared with the fourth quintile.
SHR and time to AMI onset
In the multivariate AFT model, compared to the fourth SHR quintile, AMI, STEMI and NSTEMI onset was advanced in the first, second and third SHR quintiles (Figure 3). Specifically, the adjusted median time to incident AMI was shortened by 13.23, 10.44, and 4.71 months in the first, second, and third SHR quintile groups, respectively, compared to the fourth quintile. Moreover, the adjusted median time of onset of STEMI was advanced by 14.73, 12.64, and 4.24 months, respectively, while that of NSTEMI was advanced by 19.90, 12.42 and 8.06 months, respectively. However, the time to AMI, STEMI and NSTEMI was not significantly advanced in the highest SHR quintile compared with the fourth quintile.
FIGURE 3
Exposure-effect relationship between SHR and incident AMI risk
The RCS analysis revealed a non-linear relationship between SHR levels and incident AMI risk, which showed a U-shaped curve (P for non-linear < 0.001) (Figure 4). When analyzing SHR with the risk of AMI, STEMI and NSTEMI, their inflection points were found at 0.966, 1.001, and 0.966, respectively. As the SHR level increased, the risk of AMI initially decreased significantly but then gradually increased. Specifically, when SHR was < 0.966, each SD increase in SHR was associated with a 10 and 11% reduction in the risk of AMI and NSTEMI, respectively. However, when SHR was ≥ 0.966, no further increase in AMI or NSTEMI risk was observed per SD increase in SHR. A similar pattern was seen for STEMI: when SHR was < 1.001, the risk decreased by 11% per SD increase, while no additional risk change was observed beyond this threshold.
FIGURE 4
Given this non-linear association, subgroup analyses were conducted to assess the effect of each SD increase in SHR on AMI risk before and after the inflection point of 0.966 across various strata. As shown in Figure 5, in the SHR range < 0.966, AMI risk consistently declined across subgroups of sex, race, age, and BMI, with no significant interactions. However, a modest interaction was observed in the diabetes mellitus subgroup, where the risk reduction was more pronounced among individuals without diabetes. In the SHR range ≥ 0.966, no significant increase in AMI risk was found in any subgroup, and no interactions were detected.
FIGURE 5
Sensitivity analyses
In the sensitivity analyses, results obtained through multiple imputation were consistent with those from the primary analyses (Supplementary Table S2). Similarly, excluding participants who experienced AMI within the first 2 years of follow-up did not materially alter the findings, further confirming the robustness of our results (Supplementary Table S3). Consistent results were also observed when restricting the analysis to participants with SHR values between the 2.5th and 97.5th percentiles, minimizing the influence of extreme values (Supplementary Table S4). In addition, further adjustment for hypertension status, antihypertensive medication use, and lipid-lowering therapy did not materially change the association between SHR and AMI risk (Supplementary Table S5).
Discussion
In this large prospective cohort study, we identified a U-shaped association between the SHR and the incidence of AMI in individuals without pre-existing CVD, with a threshold inflection point at 0.966. SHR levels both below and above this threshold were associated with an increased risk of AMI and earlier onset of the disease, with particularly pronounced effects observed in the lower SHR range.
Previous clinical epidemiological studies have extensively explored the role of stress hyperglycemia in predicting the prognosis of patients with AMI, consistently finding that elevated stress hyperglycemia levels correlate with higher risks of adverse cardiovascular events and mortality (24–27). Although the precise mechanisms linking stress hyperglycemia to adverse outcomes remain incompletely understood, it likely reflects the severity of acute events and suboptimal glycemic control (8). Stress hyperglycemia may exacerbate acute cardiac events through various pathways, including microvascular obstruction, reduced endothelium-dependent vasodilatory function, impaired platelet nitric oxide reactivity and exacerbation of vascular injury induced by hyperglycemia. Additionally, insulin resistance has been implicated as a contributing factor in stress hyperglycemia (28). Recently, Whitlock et al. demonstrated that the regulation of hepatic gluconeogenesis involving the forkhead box protein O transcription factor may play a crucial role in stress hyperglycemia (29).However, admission blood glucose levels alone may not accurately reflect true stress-induced hyperglycemia, necessitating consideration of long-term chronic blood glucose levels, which can be determined by the following formula ([(28.7 × HbA1c [%]) − 46.7]) (16). Therefore, SHR has emerged as a more comprehensive biomarker than admission hyperglycemia alone (10), supported by several recent observational studies (2, 7, 8, 30). Nevertheless, the association between SHR and AMI risk in the general population remains unclear. The pathophysiological link between the brain and heart forms the basis of CVD, particularly AMI. Activation of the hypothalamic-pituitary axis and the sympathetic-adrenal system in response to stress leads to increased release of epinephrine, norepinephrine and pro-inflammatory cytokines (e.g., TNF-α, IL-1 and IL-6) (31). This hyperactivity of the sympathetic nervous system has been associated with the development of various CVD, including hypertension, arrhythmias, atherosclerosis, heart failure and AMI (32).
Preclinical studies indicate that chronic stress-induced release of norepinephrine is associated with endothelial dysfunction and atherosclerosis development, contributing to oxidative stress and inflammation. Normally, alpha-adrenergic-mediated vasoconstriction does not significantly affect coronary blood flow, but in certain pathological states, such as endothelial dysfunction and atherosclerosis, the blood flow is affected and results in myocardial ischemia (33). Notably, the excitation of sympathetic afferent nerves in the left ventricle is speculated to be an important mechanism of sympathetic activation after AMI. Furthermore, inflammation and activation of the immune system play a key role in the development and progression of coronary artery disease. Elevated pro-inflammatory cytokine levels are implicated in AMI risk, with certain pro-inflammatory cytokines such as IL-8 being associated with a high risk of coronary artery disease (34, 35).
The dose-dependent analyses elucidated a U-shaped relationship between SHR levels and AMI risk, with both low and high SHR associated with a higher risk of AMI. For the secondary outcomes, we explored two subtypes of AMI, namely STEMI and NSTEMI. STEMI is typically induced by complete blockage due to coronary thrombosis, whereas NSTEMI is induced by partial blockage or intermittent blockage due to flow instability. Consistent with the association between SHR and AMI risk, this U-shaped relationship persisted in the secondary outcome analyses of STEMI and NSTEMI, further confirming the stability and prevalence of this relationship between SHR and AMI. Unexpectedly, although a U-shaped association between the SHR and the risk of incident AMI was observed, the inverse relationship was more pronounced at lower SHR levels (< 0.966). This finding appears to contrast with most existing literature and prevailing clinical expectations (36–39). SHR provides a measure of stress-induced hyperglycemia, comparing current glucose levels with long-term glycemic control estimated from HbA1c. Stress is not inherently harmful but rather functions as a double-edged sword. Moderate stress responses mobilize metabolic reserves, maintain glucose supply, and stabilize hemodynamics, thereby offering short-term protective effects (40). Conversely, both insufficient and excessive stress responses can disrupt metabolic homeostasis and elevate cardiovascular risk. As a marker of the deviation between acute random glucose and chronic HbA1c, SHR serves as a proxy for the body’s glycemic adaptability under stress (40). Under stress, counterregulatory hormones such as adrenaline, cortisol, and glucagon are typically elevated to increase blood glucose, facilitating the body’s physiological response (41). Most previous studies linking elevated SHR to adverse outcomes have focused on populations with acute cardiovascular events or critical illness, where a high SHR is often interpreted as a marker of disease severity and poor prognosis. In contrast, evidence from community-based populations without baseline CVD is scarce. These discrepancies may arise from the fundamentally different metabolic implications of SHR across populations.
Consistent with our findings, Zhang et al. recently reported an inverse association between low SHR and CVD risk in older adults without baseline CVD (42). They identified a non-linear relationship with an inflection point at 0.985, closely aligning with our identified threshold of 0.966. The slightly higher cutoff in their study may be attributed to a broader CVD definition, which encompassed both heart disease and stroke. Similarly, Tan et al. reported a U-shaped association between SHR and cardiovascular mortality in individuals at CKM stages 0–3, a population without diagnosed CVD. Interestingly, no significant association was observed between higher SHR and cardiovascular mortality. They speculated that individuals with elevated SHR may possess greater metabolic reserves and stress-regulation capacity, thereby mitigating its harmful effects (43). These observations suggest that low SHR may reflect a high-risk phenotype characterized by impaired stress responsiveness or diminished metabolic reserve. Notably, individuals with low SHR often exhibit elevated HbA1c alongside relatively low random glucose levels, indicating chronic hyperglycemia without an adequate glycemic surge during stress (42). This “blunted stress response” may signal sympathetic nervous system dysfunction or impaired pancreatic reserve—features of reduced metabolic adaptability linked to heightened cardiovascular vulnerability (40). In contrast, among individuals without CVD, a moderately elevated SHR may reflect a transient and adaptive hormonal response, unlikely to result in long-term harm. In patients with established CVD or critical illness, however, a high SHR is more likely to represent maladaptive physiological stress, systemic inflammation, and metabolic dysregulation (40, 44). These individuals commonly exhibit chronic inflammation, β-cell dysfunction, and overactivation of the sympathoadrenal axis. In such contexts, a markedly elevated SHR may signal greater disease severity, enhanced inflammatory burden, and impaired glucose regulation—contributing to cardiovascular events via mechanisms including increased myocardial oxygen demand, platelet activation, and endothelial dysfunction. Taken together, these findings suggest that the prognostic significance of SHR may vary across populations depending on whether it reflects an adaptive or maladaptive stress response. This conceptual distinction may help reconcile inconsistencies in the literature and underscores the importance of context when interpreting the clinical relevance of SHR. Our results also reinforce the established role of glucose management in mitigating AMI risk. Subgroup analyses demonstrated consistent associations across most strata, with stronger associations observed among individuals without diabetes. This finding aligns with previous studies suggesting that SHR may serve as a more sensitive marker of adverse outcomes in non-diabetic individuals (26). The direct effect of diabetes on AMI risk may attenuate the relative contribution of SHR in diabetic populations.
The observed U-shaped association is unlikely to be explained by residual confounding, reverse causality, or measurement bias. Similar non-linear associations between SHR and adverse outcomes have been reported in multiple prior studies (8, 45–48), supporting the robustness of this pattern. While residual confounding cannot be entirely excluded, our covariate selection was guided by DAGs and prior evidence, reducing the risk of over adjustment and enhancing model stability. Sensitivity analyses further supported the robustness of the findings. Additional adjustment for hypertension, antihypertensive medication use, and lipid-lowering therapy—known risk factors for AMI—did not materially alter the effect estimates. To reduce the potential for reverse causation, individuals who experienced AMI events within the first 2 years of follow-up were excluded, thereby strengthening the temporal validity of our findings. Furthermore, fasting duration was adjusted for in all multivariable models to address potential bias from non-fasting glucose measurements.
Although the phenotypic trend between SHR and adverse outcomes appears consistent across studies, the identified cutoff values vary to some extent. Yang et al. also reported a U-shaped relationship between SHR and adverse cardiovascular events in patients with AMI, with an inflection point at 0.78 (8). In our study, the lowest risk of incident AMI was observed at an SHR of 0.966, suggesting a higher threshold in the general population compared to individuals with established AMI. Several factors may account for this discrepancy. First, population-related differences likely contribute to the variation. Yang et al. examined hospitalized patients with acute AMI, representing a secondary prevention setting. These individuals were under peak physiological stress, and the lower threshold may reflect heightened vulnerability to stress hyperglycemia during the acute phase. In contrast, our study was based on the UK Biobank cohort, consisting of generally healthy, middle-aged and older adults without known CVD. The objective was to evaluate SHR as a predictive marker for AMI risk in a primary prevention context. The differences in population characteristics and clinical setting likely explain the higher threshold observed in our analysis. Second, variations in glucose measurement conditions may also contribute. In Yang et al.’s study, SHR was derived from glucose levels obtained at hospital admission, reflecting acute illness and intensified stress responses. In contrast, glucose in the UK Biobank was primarily measured in non-fasting, outpatient settings, capturing more moderate physiological states. These contextual differences may shift the overall SHR distribution. Third, differences in statistical methodology should be considered. Yang et al. determined the optimal cutoff using the Youden Index from receiver operating characteristic curve analysis. In contrast, our study used restricted cubic spline modeling to examine non-linear associations, with the threshold defined at the nadir of AMI risk. These differing analytical approaches may have also contributed to the observed differences in cutoff values.
Strength and limitations
To the best of our knowledge, this study is the first to investigate the association between SHR levels and AMI risk in the general population. The robust sample size of over 300,000 participants and the prospective cohort design enhances the validity and generalizability of the findings, aligning them more closely with real-world scenarios. Additionally, the incorporation of the AFT model, which analyses both the risk and timing of AMI onset, reinforces the stability of the results.
Nonetheless, there remain certain limitations. Firstly, the observational design of the study precludes the establishment of causal relationships between SHR and AMI risk. Secondly, despite adjusting for potential confounding and mediating variables identified through DAGs, residual confounding may persist, impacting result accuracy. Third, the use of non-fasting blood glucose levels for SHR calculation—due to logistical constraints in obtaining fasting samples in large cohorts—may introduce variability and affect the accuracy of SHR measurements. Although fasting time was adjusted for in the analyses, residual impact on the results cannot be entirely excluded. Finally, the study population was predominantly Caucasian individuals from the UK Biobank, limiting the generalizability of the findings to other ethnicities.
Conclusion
In the general population without known CVD, SHR showed a U-shaped association with the risk of incident AMI, with the lowest risk at an inflection point of 0.966. The association was particularly pronounced at SHR levels below 0.966.
Statements
Data availability statement
The datasets presented in this study can be found in online repositories. The names of the repository/repositories and accession number(s) can be found in the article/Supplementary material.
Ethics statement
The studies involving humans were approved by North West Multi-Centre Research Ethics Committee (REC reference: 11/NW/0382). The studies were conducted in accordance with the local legislation and institutional requirements. The participants provided their written informed consent to participate in this study.
Author contributions
WC: Writing – review & editing, Formal Analysis, Writing – original draft, Supervision, Resources, Visualization, Data curation, Conceptualization, Validation, Software. XZ: Conceptualization, Writing – original draft, Data curation, Writing – review & editing. JS: Writing – review & editing, Data curation, Conceptualization, Writing – original draft. HR: Writing – original draft, Writing – review & editing. PK: Writing – review & editing, Writing – original draft. HS: Writing – review & editing, Writing – original draft. MX: Writing – review & editing, Writing – original draft. ZD: Writing – review & editing, Funding acquisition, Writing – original draft, Conceptualization, Visualization, Supervision. BT: Writing – original draft, Visualization, Funding acquisition, Conceptualization, Supervision, Writing – review & editing.
Funding
The authors declare financial support was received for the research and/or publication of this article. This work was supported by grants from the Research Project of Zhejiang Chinese Medical University (2023JKZKTS11). The funder has no role in the overall study process, including design, collection of data, statistical analysis, and interpretation of results.
Acknowledgments
We extend our deepest gratitude to the study participants and the members of the UK Biobank cohort. The establishment of the UK Biobank was made possible through the efforts of the Wellcome Trust, Medical Research Council, Department of Health, Scottish Government, and the Northwest Regional Development Agency. We thank my colleague Dr. Chuang Yang for censoring the data. This study was conducted using the UK Biobank Resource, Application Number: 107335. In addition, we thank Bullet Edits Limited for the linguistic editing and proofreading of the manuscript.
Conflict of interest
The authors declare that the research was conducted in the absence of any commercial or financial relationships that could be construed as a potential conflict of interest.
Generative AI statement
The authors declare that no Generative AI was used in the creation of this manuscript.
Publisher’s note
All claims expressed in this article are solely those of the authors and do not necessarily represent those of their affiliated organizations, or those of the publisher, the editors and the reviewers. Any product that may be evaluated in this article, or claim that may be made by its manufacturer, is not guaranteed or endorsed by the publisher.
Supplementary material
The Supplementary Material for this article can be found online at: https://www.frontiersin.org/articles/10.3389/fnut.2025.1601137/full#supplementary-material
References
1.
MechanicOGavinMGrossmanS.Acute Myocardial Infarction.Treasure Island, FL: StatPearls (2024).
2.
MondalSDasGuptaRLodhMGaraiRChoudhuryBHazraAet alStress hyperglycemia ratio, rather than admission blood glucose, predicts in-hospital mortality and adverse outcomes in moderate-to severe COVID-19 patients, irrespective of pre-existing glycemic status.Diabetes Res Clin Pract. (2022) 190:109974. 10.1016/j.diabres.2022.109974
3.
ShamoonHHendlerRSherwinR. Synergistic interactions among antiinsulin hormones in the pathogenesis of stress hyperglycemia in humans.J Clin Endocrinol Metab. (1981) 52:1235–41. 10.1210/jcem-52-6-1235
4.
HarpJYancopoulosGGromadaJ. Glucagon orchestrates stress-induced hyperglycaemia.Diabetes Obes Metab. (2016) 18:648–53. 10.1111/dom.12668
5.
WernlyBLichtenauerMFranzMKabischBMuessigJMasyukMet alDifferential impact of hyperglycemia in critically Ill patients: Significance in acute myocardial infarction but not in sepsis?Int J Mol Sci. (2016) 17:1586. 10.3390/ijms17091586
6.
ZhouYLiuLHuangHLiNHeJYaoHet al‘Stress hyperglycemia ratio and in-hospital prognosis in non-surgical patients with heart failure and type 2 diabetes.Cardiovasc Diabetol. (2022) 21:290. 10.1186/s12933-022-01728-w
7.
XuWSongQWangXZhaoZMengXXiaCet alAssociation of stress hyperglycemia ratio and in-hospital mortality in patients with coronary artery disease: Insights from a large cohort study.Cardiovasc Diabetol. (2022) 21:217. 10.1186/s12933-022-01645-y
8.
YangJZhengYLiCGaoJMengXZhangKet alThe Impact of the Stress hyperglycemia ratio on short-term and long-term poor prognosis in patients with acute coronary syndrome: Insight from a large cohort study in Asia.Diabetes Care. (2022) 45:947–56. 10.2337/dc21-1526
9.
JacobiJBircherNKrinsleyJAgusMBraithwaiteSDeutschmanCet alGuidelines for the use of an insulin infusion for the management of hyperglycemia in critically ill patients.Crit Care Med. (2012) 40:3251–76. 10.1097/CCM.0b013e3182653269
10.
RobertsGQuinnSValentineNAlhawassiTO’DeaHStranksSet alRelative hyperglycemia, a marker of critical illness: Introducing the stress hyperglycemia ratio.J Clin Endocrinol Metab. (2015) 100:4490–7. 10.1210/jc.2015-2660
11.
MarenziGCosentinoNMilazzoVde MetrioMCecereMMoscaSet alPrognostic value of the acute-to-chronic glycemic ratio at admission in acute myocardial infarction: A Prospective Study.Diabetes Care. (2018) 41:847–53. 10.2337/dc17-1732
12.
MengSZhuYLiuKJiaRNanJChenMet alThe stress hyperglycaemia ratio is associated with left ventricular remodelling after first acute ST-segment elevation myocardial infarction.BMC Cardiovasc Disord. (2021) 21:72. 10.1186/s12872-021-01889-8
13.
YangYKimTYoonKChungWAhnYJeongMet alThe stress hyperglycemia ratio, an index of relative hyperglycemia, as a predictor of clinical outcomes after percutaneous coronary intervention.Int J Cardiol. (2017) 241:57–63. 10.1016/j.ijcard.2017.02.065
14.
BhagatK. Endothelial function and myocardial infarction.Cardiovasc Res. (1998) 39:312–7. 10.1016/s0008-6363(98)00138-2
15.
SudlowCGallacherJAllenNBeralVBurtonPDaneshJet alUK biobank: An open access resource for identifying the causes of a wide range of complex diseases of middle and old age.PLoS Med. (2015) 12:e1001779. 10.1371/journal.pmed.1001779
16.
NathanDKuenenJBorgRZhengHSchoenfeldDHeineR. Translating the A1C assay into estimated average glucose values.Diabetes Care. (2008) 31:1473–8. 10.2337/dc08-0545
17.
Petermann-RochaFHoFFosterHBooporJParra-SotoSGraySet alNonlinear associations between cumulative dietary risk factors and cardiovascular diseases, cancer, and all-cause mortality: A prospective cohort study from UK Biobank.Mayo Clin Proc. (2021) 96:2418–31. 10.1016/j.mayocp.2021.01.036
18.
RubboBFitzpatrickNDenaxasSDaskalopoulouMYuNPatelRet alUse of electronic health records to ascertain, validate and phenotype acute myocardial infarction: A systematic review and recommendations.Int J Cardiol. (2015) 187:705–11. 10.1016/j.ijcard.2015.03.075
19.
HarrellF.Regression Modeling Strategies With Applications to Linear Models, Logistic and Ordinal Regression, and Survival Analysis.Switzerland: Springer International Publishing AG (2015).
20.
TuKLiuKWangYJiangYZhangC. Association of dietary intake of zinc and selenium with breast cancer risk: A Case-Control Study in Chinese Women.Nutrients. (2023) 15:3253. 10.3390/nu15143253
21.
YangYLongYYuanJZhaY. U-shaped association of serum magnesium with mild cognitive impairment among hemodialysis patients: A multicenter study.Ren Fail. (2023) 45:2231084. 10.1080/0886022X.2023.2231084
22.
ChengFLiYDengKZhangXSunWYangXet alAssociations between phthalate metabolites and two novel systemic inflammatory indexes: A cross-sectional analysis of NHANES data.Ann Med. (2025) 57:2496411. 10.1080/07853890.2025.2496411
23.
LinYLinRWangWXieMLiYZhangQ. Association between urinary organophosphate ester metabolite exposure and thyroid disease risk among US adults: National Health and Nutrition Examination Survey 2011-2014.Front Endocrinol. (2024) 15:1329247. 10.3389/fendo.2024.1329247
24.
LiptonJBarendseRvan DomburgRSchinkelABoersmaHSimoonsMet alHyperglycemia at admission and during hospital stay are independent risk factors for mortality in high risk cardiac patients admitted to an intensive cardiac care unit.Eur Heart J Acute Cardiovasc Care. (2013) 2:306–13. 10.1177/2048872613489304
25.
FerreiraJBaptistaRMonteiroSGonçalvesFMonteiroPGonçalvesL. Admission hyperglycemia and all-cause mortality in diabetic and non-diabetic patients with acute myocardial infarction: A tertiary center analysis.Intern Emerg Med. (2021) 16:2109–19. 10.1007/s11739-021-02693-0
26.
KojimaTHikosoSNakataniDSunaSDohiTMizunoHet alImpact of hyperglycemia on long-term outcome in patients with ST-segment elevation myocardial infarction.Am J Cardiol. (2020) 125:851–9. 10.1016/j.amjcard.2019.12.034
27.
JensenCEberleHNassensteinKSchlosserTFarazandehMNaberCet alImpact of hyperglycemia at admission in patients with acute ST-segment elevation myocardial infarction as assessed by contrast-enhanced MRI.Clin Res Cardiol. (2011) 100:649–59. 10.1007/s00392-011-0290-7
28.
MesottenDDelhantyPVanderhoydoncFHardmanKWeekersFBaxterRet alRegulation of insulin-like growth factor binding protein-1 during protracted critical illness.J Clin Endocrinol Metab. (2002) 87:5516–23. 10.1210/jc.2002-020664
29.
Garcia WhitlockASostre-ColónJGavinMMartinNBaurJSimsCet alLoss of FOXO transcription factors in the liver mitigates stress-induced hyperglycemia.Mol Metab. (2021) 51:101246. 10.1016/j.molmet.2021.101246
30.
AbduFGalipJQiPZhangWMohammedALiuLet alAssociation of stress hyperglycemia ratio and poor long-term prognosis in patients with myocardial infarction with non-obstructive coronary arteries.Cardiovasc Diabetol. (2023) 22:11. 10.1186/s12933-023-01742-6
31.
MarikPBellomoR. Stress hyperglycemia: An essential survival response!Crit Care. (2013) 17:305. 10.1186/cc12514
32.
GrassiGSeravalleGManciaG. Sympathetic activation in cardiovascular disease: Evidence, clinical impact and therapeutic implications.Eur J Clin Invest. (2015) 45:1367–75. 10.1111/eci.12553
33.
HeuschG. The paradox of α-adrenergic coronary vasoconstriction revisited.J Mol Cell Cardiol. (2011) 51:16–23. 10.1016/j.yjmcc.2011.03.007
34.
KristonoGHolleyALakshmanPBrunton-O’SullivanMHardingSLarsenP. Association between inflammatory cytokines and long-term adverse outcomes in acute coronary syndromes: A systematic review.Heliyon. (2020) 6:e03704. 10.1016/j.heliyon.2020.e03704
35.
ZhangHDhallaN. The role of pro-inflammatory cytokines in the pathogenesis of cardiovascular disease.Int J Mol Sci. (2024) 25:1082. 10.3390/ijms25021082
36.
FuRCuiKYangJXuHYinDSongWet alFasting stress hyperglycemia ratio and in-hospital mortality after acute myocardial infarction in patients with different glucose metabolism status: Results from China acute myocardial infarction registry.Diabetes Res Clin Pract. (2023) 196:110241. 10.1016/j.diabres.2023.110241
37.
XieLChenJLiYHuangBLuoS. The prognostic impact of stress hyperglycemia ratio on mortality in cardiogenic shock: A MIMIC-IV database analysis.Diabetol Metab Syndr. (2024) 16:312. 10.1186/s13098-024-01562-y
38.
LiuJZhouYHuangHLiuRKangYZhuTet alImpact of stress hyperglycemia ratio on mortality in patients with critical acute myocardial infarction: Insight from American MIMIC-IV and the chinese CIN-II study.Cardiovasc Diabetol. (2023) 22:281. 10.1186/s12933-023-02012-1
39.
ChenGLiMWenXWangRZhouYXueLet alAssociation between stress hyperglycemia ratio and in-hospital outcomes in elderly patients with acute myocardial infarction.Front Cardiovasc Med. (2021) 8:698725. 10.3389/fcvm.2021.698725
40.
SongGLiuXLuZGuanJChenXLiYet alRelationship between stress hyperglycaemic ratio (SHR) and critical illness: A systematic review.Cardiovasc Diabetol. (2025) 24:188. 10.1186/s12933-025-02751-3
41.
QiuSLiuXLeiLLiangHLiXWangYet alAssociation between the stress-hyperglycemia ratio and all-cause mortality in community-dwelling populations: An analysis of the National Health and Nutrition Examination Survey (NHANES) 1999-2014.J Diabetes. (2024) 16:e13567. 10.1111/1753-0407.13567
42.
ZhangZZhouJWangCWangKDaiYLinQet alL-shaped relationship between stress hyperglycemia ratio and cardiovascular disease risk in middle-aged and older adults: Insight from the China Health and Retirement Longitudinal Study.PLoS One. (2025) 20:e0324978. 10.1371/journal.pone.0324978
43.
TanMZhangYZhuSWuSZhangPGaoM. The prognostic significance of stress hyperglycemia ratio in evaluating all-cause and cardiovascular mortality risk among individuals across stages 0-3 of cardiovascular-kidney-metabolic syndrome: Evidence from two cohort studies.Cardiovasc Diabetol. (2025) 24:137. 10.1186/s12933-025-02689-6
44.
GonzálezPLozanoPRosGSolanoF. Hyperglycemia and oxidative stress: An integral, updated and critical overview of their metabolic interconnections.Int J Mol Sci. (2023) 24:9352. 10.3390/ijms24119352
45.
LeLZhouLPengXZhangZZhangZXiongYet alAssociation of stress hyperglycemia ratio and mortality in patients with sepsis: Results from 13,199 patients.Infection. (2024) 52:1973–82. 10.1007/s15010-024-02264-3
46.
TuersunGAlifuJQuYKangX. The prognostic impact of stress hyperglycemia ratio for all-cause mortality in patients with Psoriasis.Sci Rep. (2024) 14:26113. 10.1038/s41598-024-77019-z
47.
DingLZhangHDaiCZhangAYuFMiLet alThe prognostic value of the stress hyperglycemia ratio for all-cause and cardiovascular mortality in patients with diabetes or prediabetes: Insights from NHANES 2005-2018.Cardiovasc Diabetol. (2024) 23:84. 10.1186/s12933-024-02172-8
48.
LeLZhaoMZhangZZhouLZhangZXiongYet alPrognostic significance of the stress hyperglycemia ratio in critically ill patients.Cardiovasc Diabetol. (2023) 22:275. 10.1186/s12933-023-02005-0
Summary
Keywords
stress hyperglycemia ratio, acute myocardial infarction, ST-segment elevation myocardial infarction, non-ST-segment elevation myocardial infarction, UK Biobank
Citation
Cheng W, Zhang X, Shi J, Ruan H, Kang P, Sun H, Xu M, Du Z and Tang B (2025) Stress hyperglycemia ratio and risk of incident myocardial infarction in the general population: a large-scale cohort study. Front. Nutr. 12:1601137. doi: 10.3389/fnut.2025.1601137
Received
27 March 2025
Accepted
05 June 2025
Published
03 July 2025
Volume
12 - 2025
Edited by
Nikos Stalikas, OLV Aalst, Belgium
Reviewed by
Hanqing Liu, Zhejiang University, China
Guangdong Wang, Jiaotong University, China
Updates
Copyright
© 2025 Cheng, Zhang, Shi, Ruan, Kang, Sun, Xu, Du and Tang.
This is an open-access article distributed under the terms of the Creative Commons Attribution License (CC BY). The use, distribution or reproduction in other forums is permitted, provided the original author(s) and the copyright owner(s) are credited and that the original publication in this journal is cited, in accordance with accepted academic practice. No use, distribution or reproduction is permitted which does not comply with these terms.
*Correspondence: Zhongyan Du, duzhongyan@zcmu.edu.cnBi Tang, bitang2000@163.com
Disclaimer
All claims expressed in this article are solely those of the authors and do not necessarily represent those of their affiliated organizations, or those of the publisher, the editors and the reviewers. Any product that may be evaluated in this article or claim that may be made by its manufacturer is not guaranteed or endorsed by the publisher.