 Mattia D’Alleva1,2*†
 Stefano Lazzer1,2†
 Maria De Martino1†
 Lara Mari1,2
 Enrico Rejc1,2Simone Zaccaron1,2,3Jacopo Stafuzza1,2
 Miriam Isola1Adele Bondesan4Diana Caroli4Francesca Frigerio4Laura Abbruzzese5Enrica Ventura6
 Alessandro Sartorio4
- 1Department of Medicine, University of Udine, Udine, Italy
- 2School of Sport Science, University of Udine, Udine, Italy
- 3Department of Neurosciences, Biomedicine and Movement Sciences, University of Verona, Verona, Italy
- 4Experimental Laboratory for Auxo-Endocrinological Research, Istituto Auxologico Italiano, Istituto di Ricovero e Cura a Carattere Scientifico (IRCCS), Piancavallo, Italy
- 5Division of Auxology, Istituto Auxologico Italiano, Istituto di Ricovero e Cura a Carattere Scientifico (IRCCS), Piancavallo, Italy
- 6Division of Eating and Nutrition Disorders, Istituto Auxologico Italiano, Istituto di Ricovero e Cura a Carattere Scientifico (IRCCS), Piancavallo, Italy
Purpose: The aetiology of metabolic syndrome (MetS) in young people involves a complex interplay between lifestyle, body composition, and cardiometabolic risk factors. The present study aimed to explore the relationships between anthropometric characteristics, body composition, cardiometabolic parameters and resting substrate metabolism in the development of MetS in severely adolescents with obesity.
Methods: Seven hundred and thirty adolescents with obesity (mean age: 14.6 ± 2.1 years, BMI > 97th percentile for gender and age) were included in this study. Body composition analysis was obtained using tetrapolar bioelectrical impedance analysis (BIA), while resting substrate oxidation was measured using an indirect calorimeter.
Results: MetS was present in 27% of the participants. Compared to those without MetS, adolescents with MetS had significantly higher body mass (+15 kg, p < 0.001), fat-free mass (FFM; +6 kg, p < 0.001), fat mass (+9 kg, p < 0.001), carbohydrate oxidation at rest (CHO; +0.02 g·min−1, p = 0.015), and Homeostasis Model Assessment for Insulin Resistance (HOMA-IR; +0.8, p < 0.001). In adjusted-univariate logistic regression, HOMA-IR (OR: 1.22; 95% CI: 1.12–1.34, p < 0.001) was associated with higher odds of MetS. Conversely, higher FFM percentage (OR: 0.96; 95% CI: 0.93–0.99, p = 0.003) and HDL cholesterol levels (OR: 0.83; 95% CI: 0.81–0.86, p = 0.003) were protective.
Conclusion: In adolescents with severe obesity, resting carbohydrate oxidation and HOMA-IR emerged as independent risk factors for MetS, offering additional insight beyond conventional anthropometric and lipid indicators. Conversely, higher FFM and HDL cholesterol levels appeared to exert a protective effect. These findings underscore the importance of incorporating metabolic and body composition variables into MetS risk models and support the promotion of targeted interventions, such as endurance and resistance training, to address modifiable risk factors and reduce the likelihood of developing MetS.
Introduction
Obesity is one of the major global health problems, affecting millions of individuals worldwide, with a particularly alarming prevalence among children and adolescents (1). Its primary causes include sedentary behavior, unhealthy dietary patterns, and insufficient physical activity (2). In paediatric populations, obesity is frequently associated with metabolic abnormalities such as insulin resistance, dyslipidaemia and hypertension, hallmark features of metabolic syndrome (MetS) (3). Cross-sectional studies have reported MetS prevalence rates ranging from 10 to 38% among children and adolescents with obesity (4, 5).
These metabolic disturbances are primarily driven by excessive fat mass (FM), particularly visceral adiposity (6). Visceral fat plays a key role in metabolic dysfunction through the secretion of adipokines involved in the pathogenesis of cardiometabolic diseases (7). Furthermore, increased FM promotes the accumulation of lipid intermediates, such as ceramides and diacylglycerols, within skeletal muscle (8). Combined with physical inactivity, this accumulation contributes to reduced mitochondrial density, enhanced adipogenesis, and decreased activity of key enzymes involved in aerobic energy production and fatty acid oxidation (9, 10). As a result, fat oxidation (FAT) at rest may be impaired (11, 12), and the ability to shift toward carbohydrate oxidation (CHO) in response to insulin stimulation is diminished (13). This impaired capacity to adjust substrate oxidation according to substrate availability, known as metabolic inflexibility, is typically characterised by an elevated respiratory exchange ratio (RER) at rest, reflecting a predominant reliance on carbohydrate metabolism (9). This phenomenon has been observed in individuals with metabolically unhealthy obesity (12). Indeed, resting substrate oxidation may provide additional predictive value for cardiometabolic risk, as it reflects both mitochondrial efficiency and the ability to utilise fat as an energy source in basal conditions (14). An elevated CHO oxidation rate at rest, may suggest impaired lipid oxidation and insulin resistance, both of which are implicated in the pathophysiology of MetS (15). Moreover, alterations in substrate utilisation may precede clinically evident metabolic dysfunction, offering an earlier window for risk identification (10). Nonetheless, findings remain inconsistent, particularly in paediatric populations with obesity, and this potentially valuable marker has been largely underexplored in paediatric risk models (16).
These metabolic alterations may also contribute to a reduction in fat-free mass (FFM) (16), leading to a lower basal metabolic rate (BMR), as FFM is the principal determinant of BMR (17). Over time, this unfavourable metabolic profile may increase susceptibility to the development of MetS (18). Despite these associations, to the best of our knowledge, no studies have specifically examined the relationship between resting substrate oxidation (i.e., CHO and FAT oxidation) and MetS risk in adolescents with obesity.
Given the increasing prevalence of MetS in this population, several indirect indexes have been proposed for its early identification in both clinical and epidemiological settings. Body mass index (BMI) remains the most used parameter (19); however, it does not differentiate between FM and FFM and provides no information on fat distribution (20). In paediatric populations, age- and sex-adjusted BMI z-scores are typically used, although their association with cardiometabolic risk is non-linear (21). Other indexes, such as waist circumference (WC), which indirectly reflect both the quantity and distribution of adipose tissue, have been used to assess body composition and cardio-metabolic risk factors (22). The waist-to-height ratio (WHR) has also emerged as a reliable screening tool to identify MetS in the paediatric population (23). More recently, the Visceral Adiposity Index (VAI), a sex-specific algorithm incorporating anthropometric measures (BMI and WC) and lipid profile parameters [triglycerides and high-density lipoprotein cholesterol (HDL-C)], has been proposed as a novel marker of cardiometabolic risk (24). VAI reflects visceral fat accumulation and dyslipidaemia, and has been linked to insulin resistance, impaired glucose regulation, and an increased cardiovascular risk. Its utility in identifying MetS has also been confirmed in paediatric populations (25). However, none of these indexes incorporates direct assessments of body composition, such as FM and FFM. Instead, they rely on indirect anthropometric parameters, such as BMI or WC. Moreover, to date, no studies have explored the potential role of resting substrate oxidation parameters in developing metabolic indexes for use in paediatric populations to facilitate the early identification of MetS.
Therefore, the aims of the present study were (i) to evaluate the differences in body composition, cardiometabolic parameters, and substrate oxidation at rest in a large cohort of adolescents with obesity, with and without MetS; (ii) to assess which of the parameters mentioned above act as protective or risk factors for the development of MetS; and (iii) to propose a novel MetS index that incorporates direct measures of body composition and substrate oxidation at rest.
Materials and methods
Study group
A retrospective cohort study was conducted on 733 adolescents (mean age: 14.8 ± 2.1 years; Tanner stage: 3.8 ± 1.4; height: 1.63 ± 0.10 m; body mass: 101.6 ± 22.7 kg; BMI: 37.9 ± 6.2 kg m−2) with severe obesity [BMI z-score > 2, based on the Italian reference growth charts for age and sex (26)]. All participants were admitted to the Division of Auxology at the Istituto Auxologico Italiano, IRCCS, Piancavallo-Verbania, for a 3-week multidisciplinary body weight reduction program. Inclusion criteria were: (i) age between 10 and 19 years; (ii) BMI SDS ≥ 2.0 according to sex- and age-specific Italian reference charts (27); (iii) essential obesity; (iv) abstinence from alcohol; (v) unbalanced type 2 diabetes mellitus. Exclusion criteria included: (i) genetic or syndromic obesity; (ii) any alcohol consumption; (iii) infection with the hepatitis B or C virus; (iv) type 1 diabetes mellitus; (v) obesity secondary to endocrine disorders (i.e., hypothyroidism, Cushing’s disease or syndrome). The study was conducted in accordance with the Declaration of Helsinki and was approved by the territorial Ethics Committee no. 5, Lombardy Region, Italy (approval number: 141/25; date of approval: March 25, 2025; internal order code: 01C515; acronym: OSSIGRASSIMET). At the hospital admission, informed assent/consent had been obtained from all participants and their parents.
Measurements
Physical characteristics and body composition measurement
At hospital admission, each subject underwent a medical history review and physical examination. Body mass (BM) was measured to the nearest 0.1 kg using an electronic scale (Selus, Italy), with participants wearing only light underwear. Stature was measured to the nearest 0.5 cm using a standardised Harpenden stadiometer (Holtain Ltd., UK). Body mass index (BMI) was calculated as weight (kg) divided by the square of height (m) (26). Waist circumference (WC) was measured in a standing position, midway between the lowest rib and the top of the iliac crest, after a gentle expiration, using a non-elastic, flexible measuring tape (28). Hip circumference (HC) was assessed at the point of greatest posterior protuberance (28).
Body composition was evaluated using a multifrequency tetrapolar bioelectrical impedance analyser (BIA, Human-IM Scan, DS-Medigroup, Milan, Italy), delivering a current of 800 μA at a frequency of 50 kHz. To minimise measurement error, all procedures were standardised to ensure validity, reproducibility, and precision. Measurements were conducted according to the method described in Lukasky et al. (29), after a 20 min rest in the supine position, with arms and legs relaxed and not touching each other. FFM was estimated using a validated prediction equation (30), and FM was calculated as the difference between body mass and FFM. Although BIA is a practical and widely used method to estimate FFM and FM in adolescents, its precision is limited by several factors. A systematic review reported that test–retest measurement error in percentage body fat can be as high as 7.5–13.4% in youth, with poor agreement with criterion methods like dual-energy X-ray absorptiometry (DEXA) (31). Furthermore, accuracy diminishes in adolescents with higher degrees of obesity: correlations with DXA remain moderate or low, and the ability to track changes in FM and FFM is reduced in individuals with severe obesity (32). Hence, while BIA is acceptable for group-level assessments, caution is warranted when interpreting individual-level data.
Basal metabolic rate
Basal metabolic rate (BMR) was assessed following an overnight fast using an open-circuit, indirect computerised calorimetry system (Vmax 29, Sensor Medics, Yorba Linda, CA, United States) equipped with a rigid, transparent, and ventilated canopy to ensure minimal air leakage and stable measurement conditions. Before each measurement session, the calorimeter was calibrated according to the manufacturer’s instructions using standard gas mixtures (i.e., 16% oxygen and 5% carbon dioxide) to ensure accuracy and reproducibility of gas exchange measurements. Energy expenditure was calculated from oxygen consumption (V’O2) and carbon dioxide production (V’CO2) using the equation of Weir (33). Data acquisition was conducted under controlled environmental conditions (room temperature, 22 ± 1°C; humidity, 50–60%) to minimise variability.
The substrate oxidation rate at rest was determined from V’O2 and V’CO2 values using the following equations (34):
where Pox is the protein oxidation rate. The protein oxidation rate was estimated by assuming that protein oxidation contributed approximately 12% of resting energy expenditure (34):
Missing or inconsistent data points from the calorimetry recordings, such as brief signal loss or artefacts, were identified by visual inspection of the raw data and the software’s quality control flags. These segments were excluded from the analysis. If data loss exceeded 5% of the total recording time, the measurement was repeated. No imputation methods were applied; all calculations were performed on validated continuous data segments.
Blood pressure measurements
Diastolic and systolic blood pressure (BP) were measured using a standard mercury sphygmomanometer to the nearest 2 mmHg after 5 min of rest. The average of three measurements taken on different days was used. Blood pressure was assessed according to the IDF criteria for paediatric age (35).
Laboratory analyses
Baseline blood samples were collected via venipuncture after a 12 h overnight fast on the second day of hospitalisation. Fasting glucose, fasting insulin, total cholesterol, high-density lipoprotein cholesterol (HDL-C), low-density lipoprotein cholesterol (LDL-C), very low-density lipoprotein cholesterol (VLDL-C), triglycerides (TG), and C-reactive protein (C-RP) were measured using standard techniques.
The Homeostasis Model Assessment Index—Insulin Resistance (HOMA-IR) was calculated using the following formula (36):
MetS indexes
According to the International Diabetes Federation (IDF) criteria (37), the diagnosis of MetS was made when three or more of the following risk factors are present: a WC ≥ 80 cm, fasting glucose (FPG) ≥ 100 mg/dL (5.55 mmoL/L) or on drug treatment for elevated glucose, systolic blood pressure (SBP) ≥ 130 mmHg or diastolic blood pressure (DBP) ≥ 85 mmHg or on antihypertensive drug treatment in a patient with a history of hypertension, fasting triglycerides (TG) ≥ 150 mg/dL (1.7 mmoL/L) or on drug treatment for elevated TG, and HDL-C < 50 mg/dL (1.3 mmoL/L) or on drug treatment for reduced HDL-C.
In addition, the following indexes were calculated according to the following formulas (22, 38–42):
Statistical analyses
A Shapiro–Wilk test was used to assess the normality of each continuous variable. Normally distributed data were presented as mean ± standard deviation, while non-normally distributed data were reported as median and interquartile range (IQR: 25th–75th percentile). Adjusted odds ratios (ORs) were calculated using a logistic regression model to evaluate the association between the odds of having MetS and body composition, cardiometabolic parameters, resting substrate oxidation, and various indexes. Age and sex were included as covariates to control for potential confounding effects. An OR greater than 1 indicates an increased likelihood of metabolic syndrome, while an OR less than 1 suggests a protective association. 95% confidence intervals (CIs), p-values and Cohen’s d effect sizes were reported. A metabolic syndrome risk score was developed using the following appropriately scaled variables: sex, age, BMI, FFM (in kg), FM (in kg), WHR, indirect calorimetry, CHO (%), and FAT (%). Variables were selected to represent distinct physiological domains and to minimise redundancy among predictors. The dataset was randomly split into a training set (70%) and a testing set (30%). A LASSO logistic regression model with metabolic syndrome as the outcome variable was applied to the training set and iterated 100 times on bootstrapped samples. LASSO logistic regression is a regularisation method that applies an L1 penalty, and it was selected for its ability to perform variable selection and regularisation simultaneously. For each variable, the selection frequency and the mean LASSO coefficient were recorded. Variables with a selection frequency ≥ 60% were retained for score construction, based on recommendations from stability selection methods (43). The coefficients were then normalised to scale from −20 to 20. The risk score was calculated by multiplying each selected and scaled variable by its corresponding normalised mean coefficient. Youden’s index was applied to identify the optimal threshold for the risk score. At this cut-off, sensitivity, specificity, positive predictive value (PPV) and negative predictive value (NPV) were estimated with their 95% confidence intervals. Model performance was evaluated on the testing set by computing the area under the ROC curve (AUC) along with its 95% confidence interval.
Results
Physical characteristics of the study group
The descriptive characteristics of the study group are shown in Table 1. According to the IDF criteria, the presence of MetS was found in 202 patients (28%). Patients with MetS+ had significantly higher values of BMI z-score (+11%, p < 0.001), FFM (kg) (+11%, p < 0.001), FM (kg) (+18%, p < 0.001), WC (+10%, p < 0.001), HC (+4%, p < 0.001), TG (+44%, p < 0.001), Fasting insulin (+33%, p < 0.001), HOMA-IR (+32%, p < 0.001), SBP (+8%, p < 0.001), basal metabolic rate (+13%, p < 0.001) and CHOrest (+8%, p = 0.010) (Table 2). Additionally, HDL-C levels were significantly lower in the MetS+ group (−20%, p < 0.001) (Table 2). No significant differences were observed between the two groups in fasting glucose, total cholesterol and other resting substrate oxidation parameters (Table 2). Obese adolescents with MetS+ showed higher values of WHR (+5%, p < 0.001), WHtR BMFI (+19%, p < 0.001), VAI (+96%, p < 0.001), CMI (+95%, p < 0.001) and MetS z-score (+55%, p < 0.001) than obese adolescents without MetS (MetS−) (p < 0.001) (Table 2).
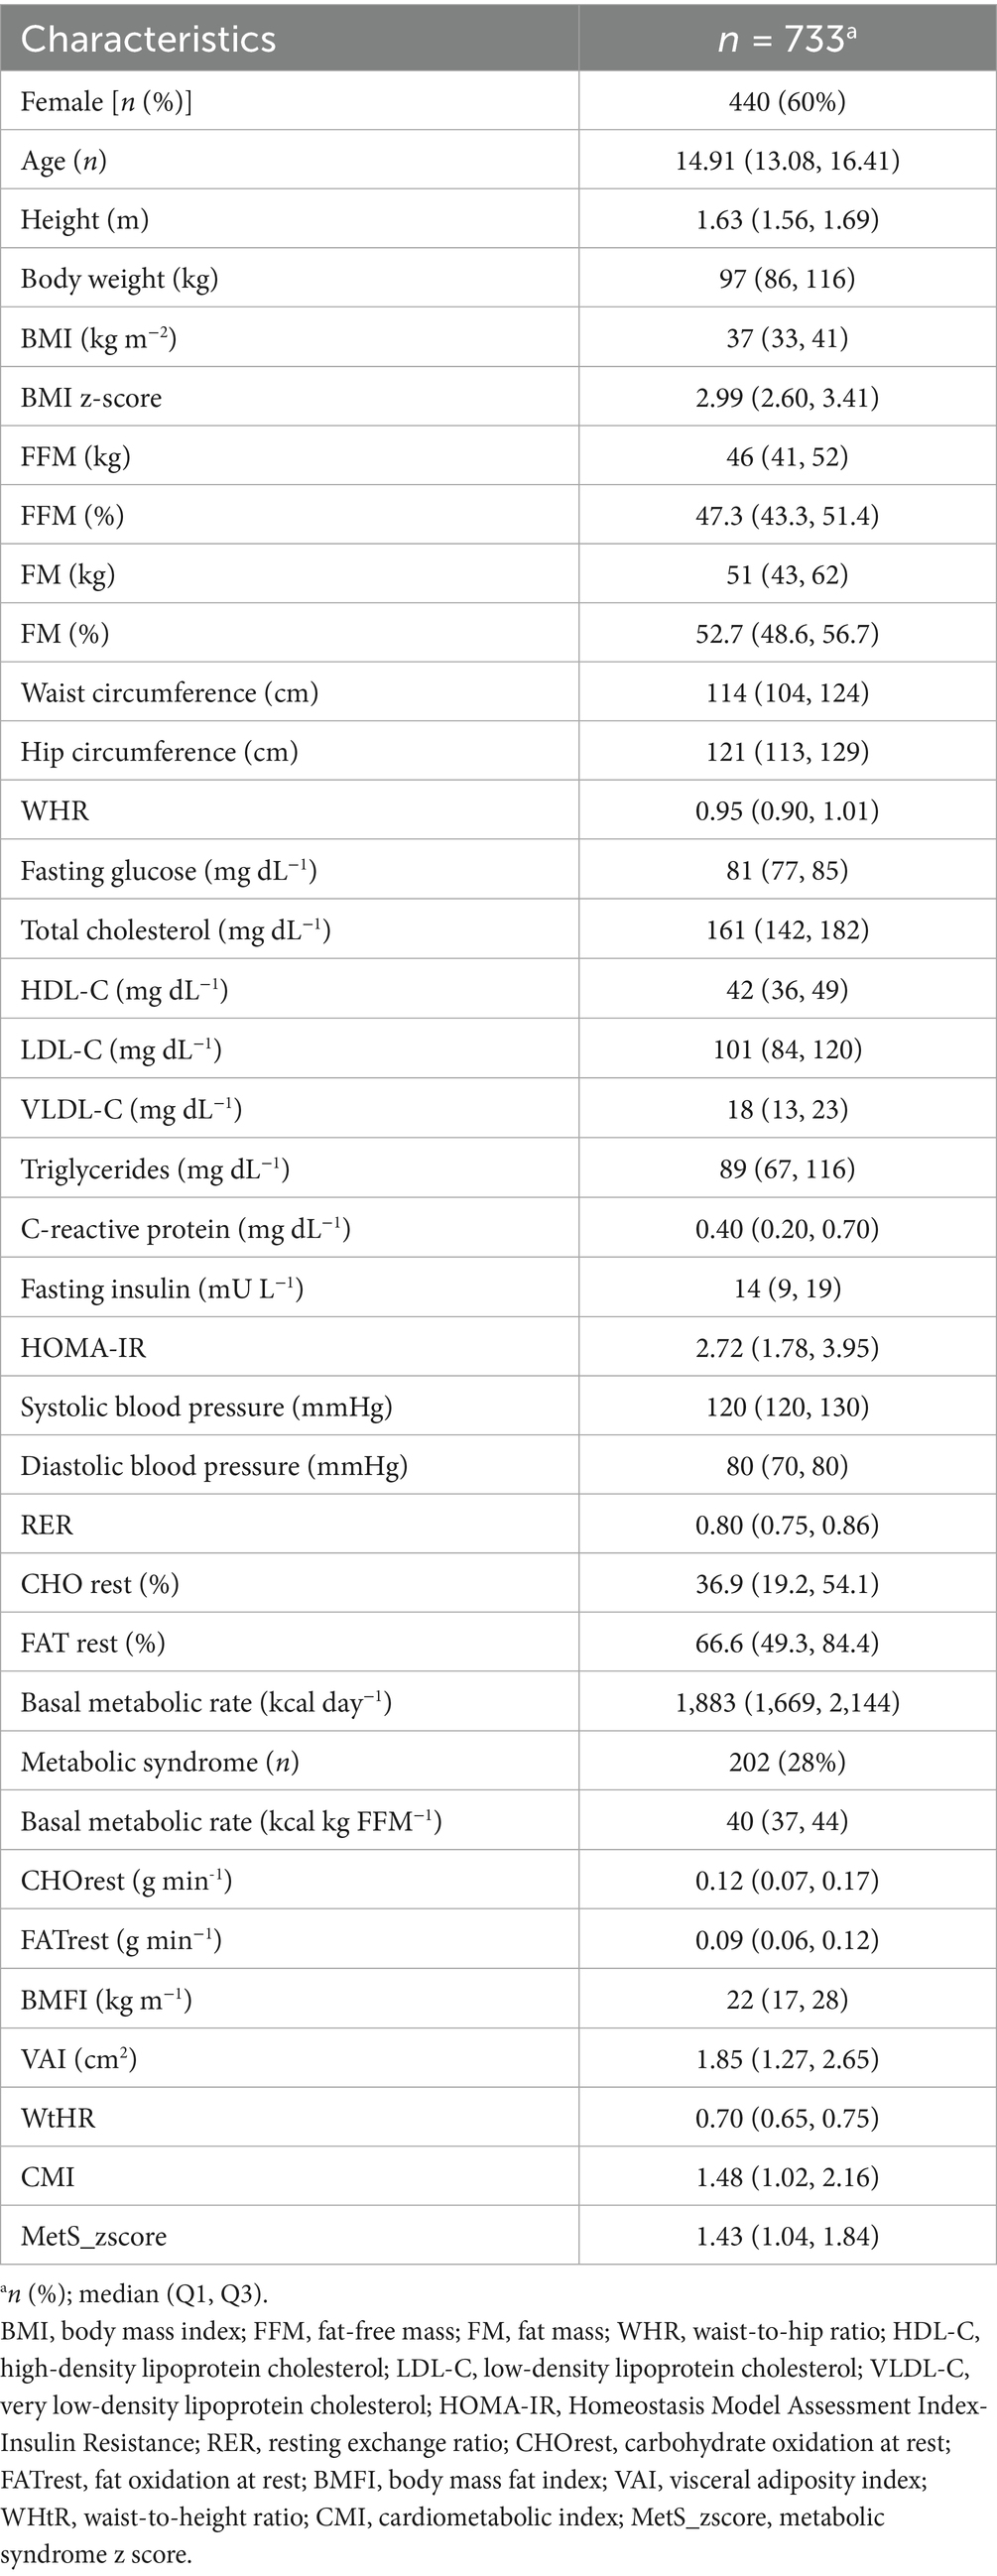
Table 1. Descriptive statistics for the whole study group.
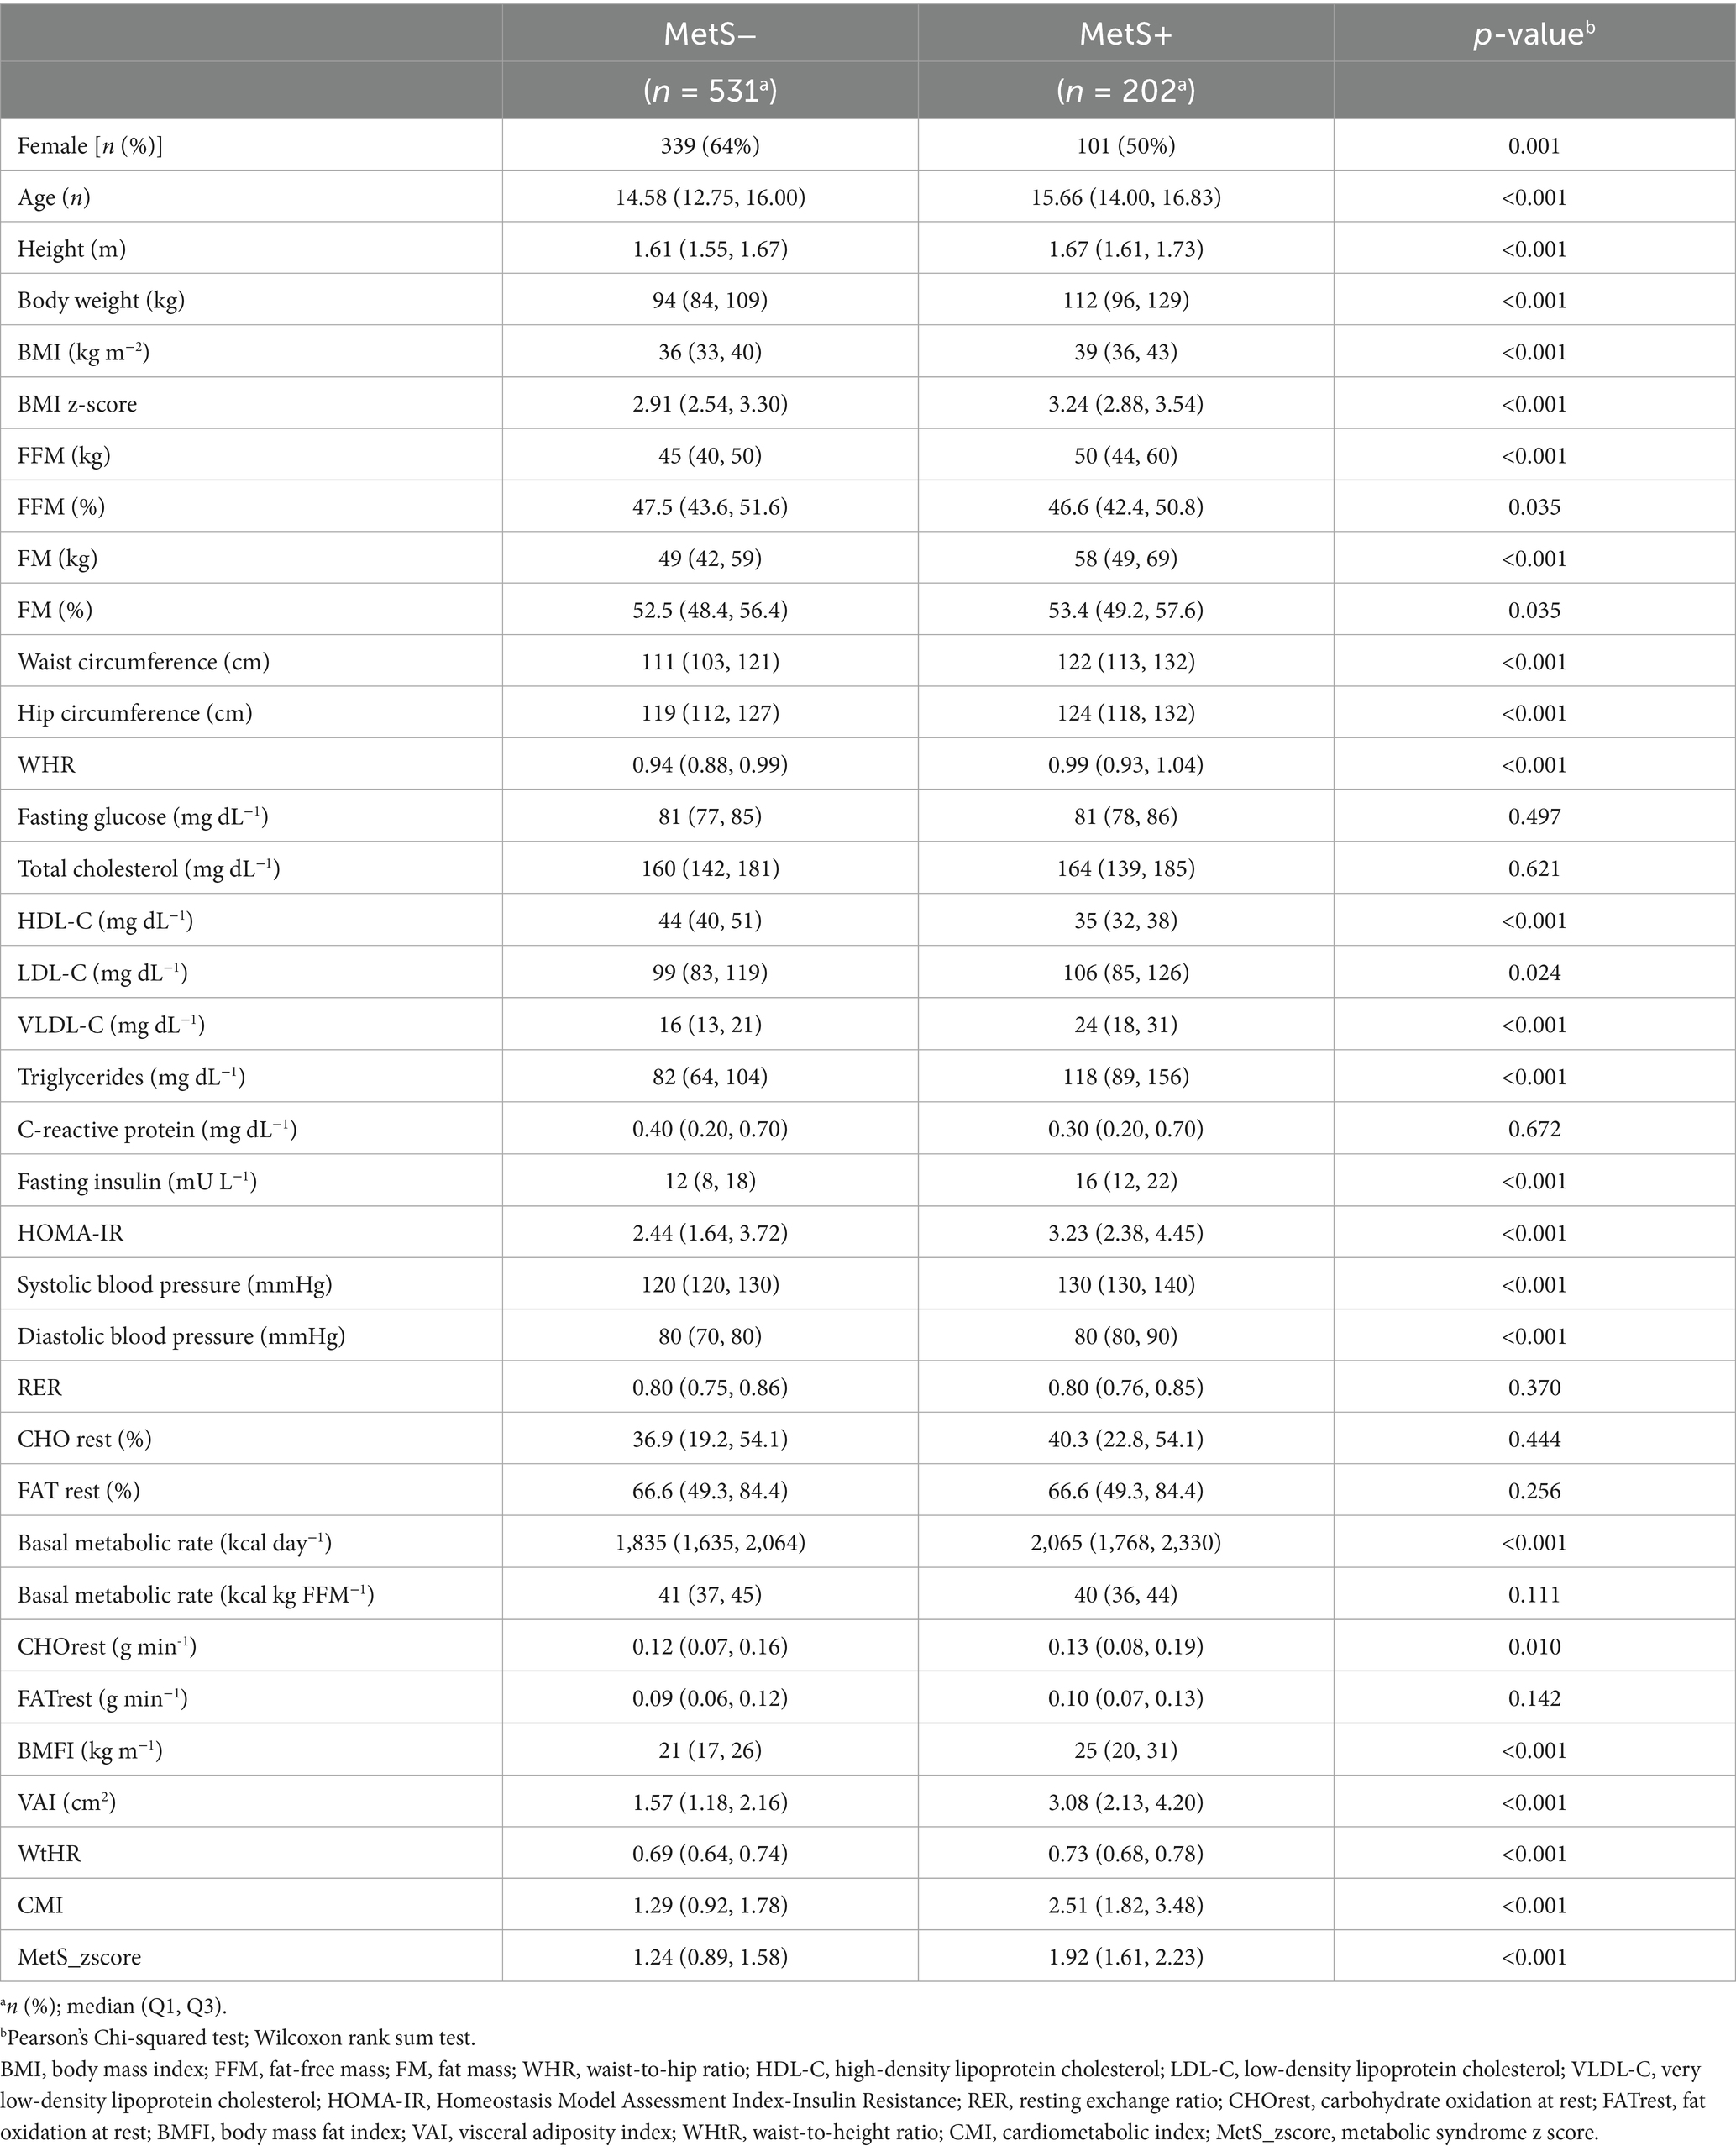
Table 2. Descriptive statistics for all adolescents without metabolic syndrome (MetS−), and with metabolic syndrome (MetS+).
Protective and risk factors for MetS
After adjusting for age and sex, logistic regression analysis identified several variables significantly associated with the presence of metabolic syndrome (MetS) (Figures 1–4).
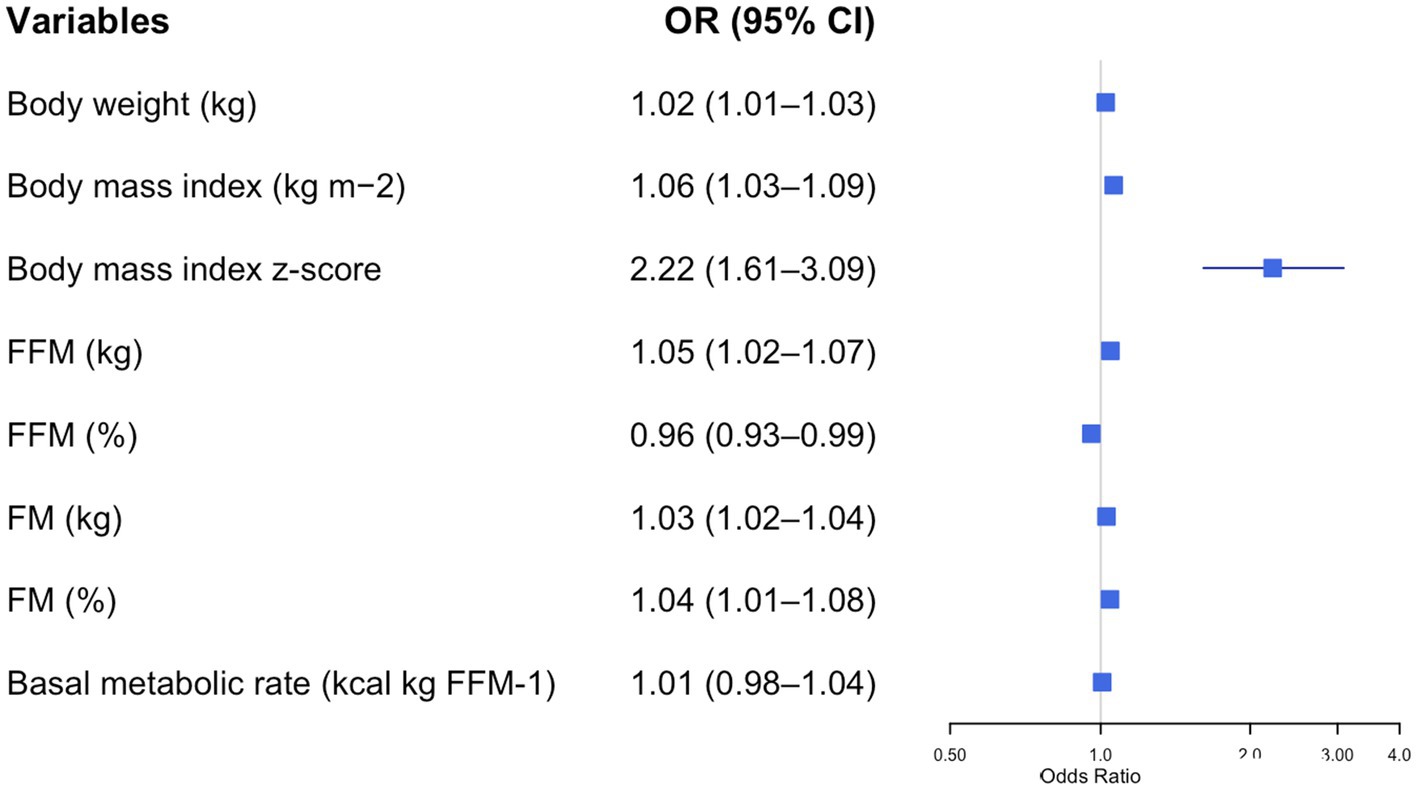
Figure 1. Forest plot of adjusted odds ratios (ORs) and 95% confidence intervals (CIs) for body composition parameters and metabolic syndrome risk in adolescents with obesity. Each row displays a specific index, with the square dot representing the adjusted-for-age odds ratio and the horizontal line extending from the dot indicating the 95% confidence interval. The plot includes a vertical reference line at an OR of 1.0, representing no effect. Predictors with confidence intervals that do not cross this line suggest a statistically significant association with obesity risk. The numerical values of the odds ratio and their CI are placed next to each index. FFM, free fat mass; FM, fat mass.
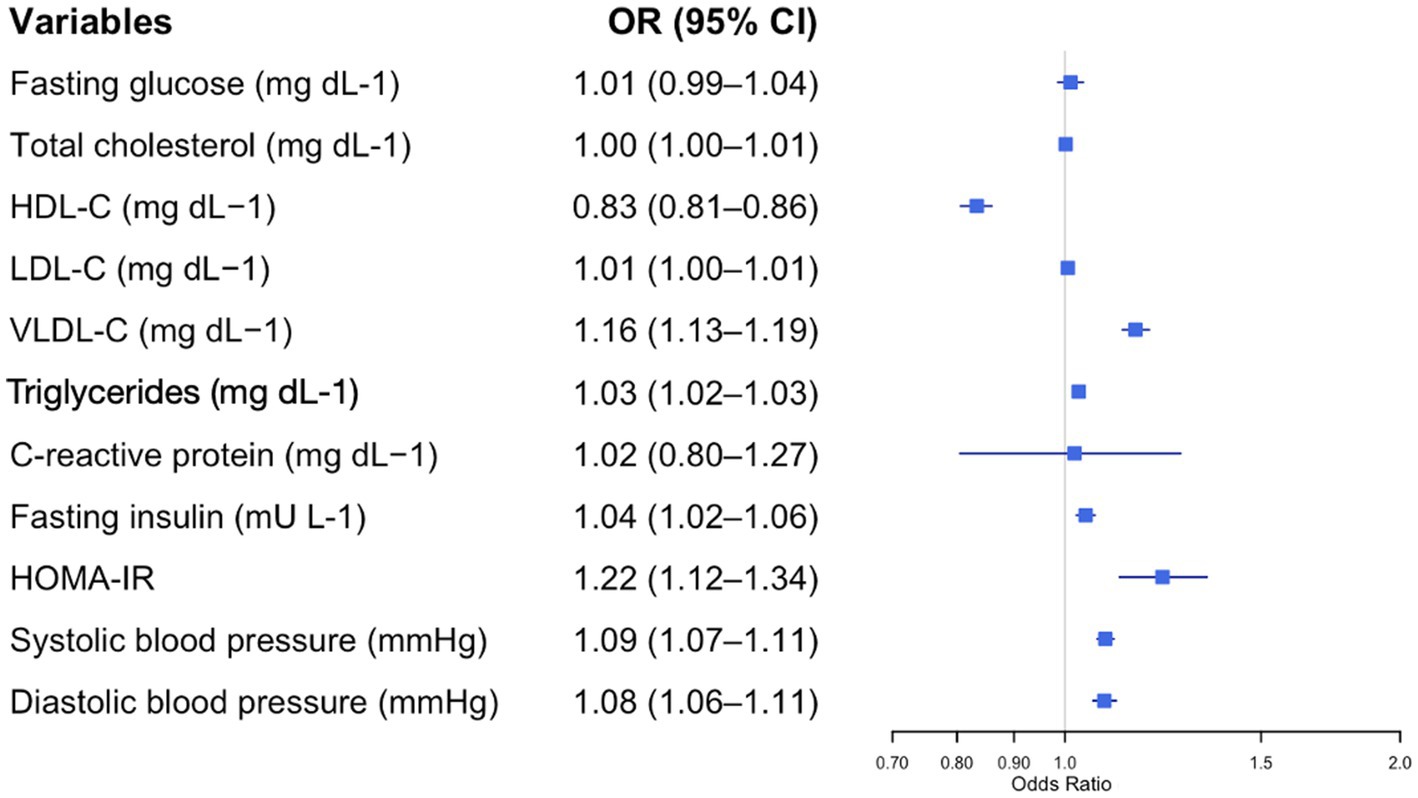
Figure 2. Forest plot of adjusted odds ratios (ORs) and 95% confidence intervals (CIs) for blood parameters and metabolic syndrome risk in adolescents with obesity. Each row displays a specific index, with the square dot representing the adjusted-for-age odds ratio and the horizontal line extending from the dot indicating the 95% confidence interval. The plot includes a vertical reference line at an OR of 1.0, representing no effect. Predictors with confidence intervals that do not cross this line suggest a statistically significant association with obesity risk. The numerical values of the odds ratio and their CI are placed next to each index. HDL-C, high-density lipoprotein cholesterol; LDL-C, low-density lipoprotein cholesterol; VLDL-C, very low-density lipoprotein cholesterol; HOMA-IR, Homeostasis Model Assessment Index-Insulin Resistance.
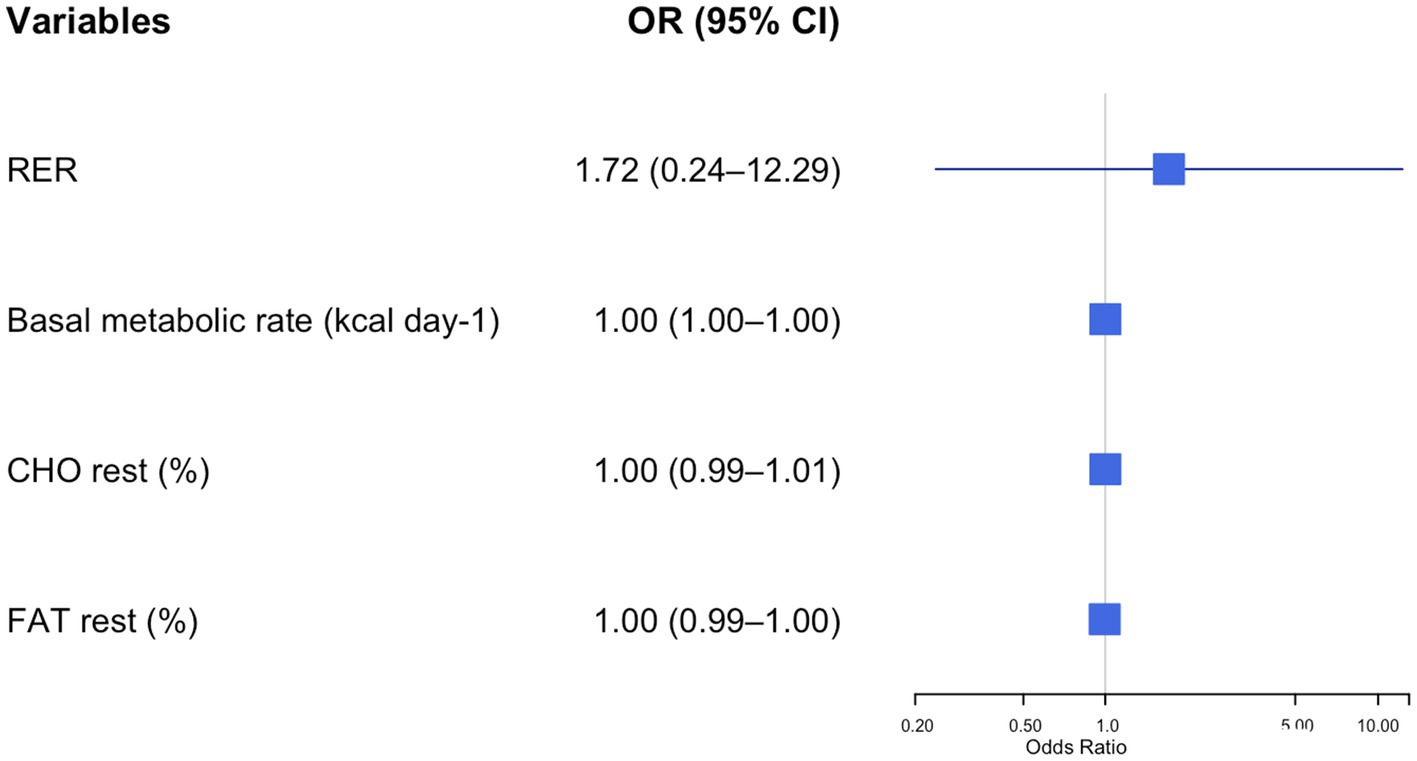
Figure 3. Forest plot of adjusted odds ratios (ORs) and 95% confidence intervals (CIs) for resting energy expenditure parameters and metabolic syndrome risk in adolescents with obesity. Each row displays a specific index, with the square dot representing the adjusted-for-age odds ratio and the horizontal line extending from the dot indicating the 95% confidence interval. The plot includes a vertical reference line at an OR of 1.0, representing no effect. Predictors with confidence intervals that do not cross this line suggest a statistically significant association with obesity risk. The numerical values of the odds ratio and their CI are placed next to each index. RER, respiratory exchange ratio; CHO, resting carbohydrate oxidation; FAT, resting fat oxidation.
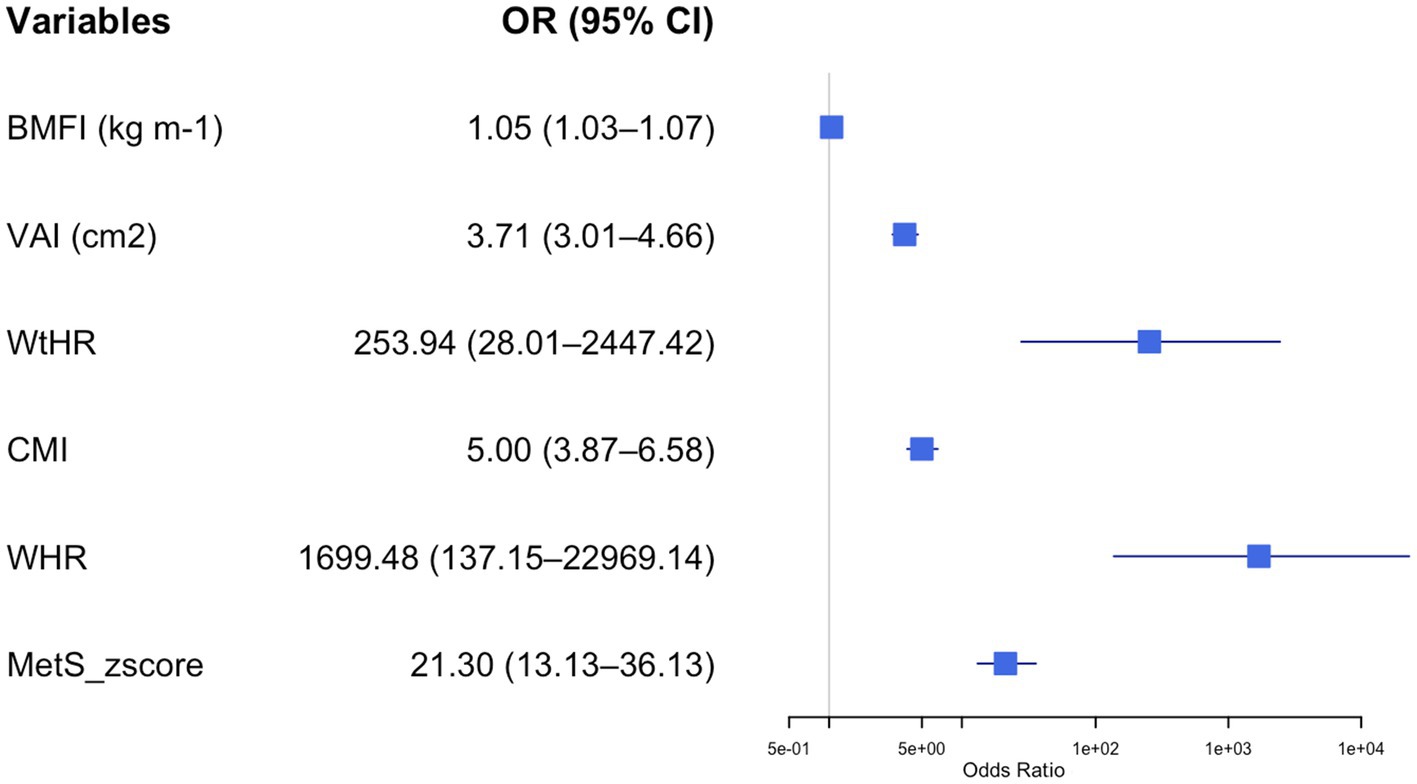
Figure 4. Forest plot of adjusted odds ratios (ORs) and 95% confidence intervals (CIs) for body composition parameters and metabolic syndrome risk in adolescents with obesity. Each row displays a specific index, with the square dot representing the adjusted-for-age odds ratio and the horizontal line extending from the dot indicating the 95% confidence interval. The plot includes a vertical reference line at an OR of 1.0, representing no effect. Predictors with confidence intervals that do not cross this line suggest a statistically significant association with obesity risk. The numerical values of the odds ratio and their CI are placed next to each index. BMFI, body mass fat index; VAI, visceral adiposity index; WHtR, waist-to-height ratio; CMI, cardiometabolic index; MetS_zscore, metabolic syndrome z score.
Figure 1 illustrates the impact of various anthropometric and body composition parameters on the odds of having MetS in adolescents with obesity. All the parameters were directly related to the odds of having MetS. However, among the various parameters, higher BMI z-scores were strongly associated with increased odds of MetS (OR = 2.22, 95% CI: 1.61–3.09, p < 0.001). Conversely, higher FFM (%) was associated with reduced odds of MetS (OR = 0.96, 95% CI: 0.93–0.99, p = 0.003), indicating a protective role.
Figure 2 illustrates the impact of different cardiometabolic parameters on the odds of having MetS in adolescents with obesity. All the parameters, except for the HDL-C, were directly related to the odds of having MetS. A stronger association was found for the HOMA-IR (OR = 1.22, 95% CI: 1.12–1.34, p < 0.001). Conversely, HDL-C was associated with reduced odds of MetS (OR = 0.83, 95% CI: 0.81–0.86, p = 0.003).
Figure 3 shows how the different resting substrate oxidation data affected the odds of having MetS in the study group. Higher CHOrest values were associated with an increased risk of MetS (OR = 21.489, 95% CI: 2.46–190.5, p = 0.006).
Figure 4 illustrates the impact of different MetS indexes on the odds of having MetS in adolescents with obesity. All the indexes were directly related to the odds of having MetS. However, this association was stronger for the WHR (OR = 1699.48, 95% CI: 137.2–22969.1, p < 0.001) and WtHR (OR = 235.9, 95% CI: 28.01–2447.42, p < 0.001) than for the other indexes. Supplementary file 1 provides a summary table including all adjusted odds ratios (ORs), 95% confidence intervals (CIs), and Cohen’s d values for the associations between the evaluated parameters and metabolic syndrome risk in adolescents with obesity.
MetS risk score
Among the ten variables considered for the score, seven were selected by the model with a selection frequency greater than 60%: WHR, FFM (kg), FAT (%), age, BMI, BMR, and sex (Table 3). The metabolic syndrome risk score was then constructed by multiplying the standardised variables by the normalised coefficients (Equation 1):
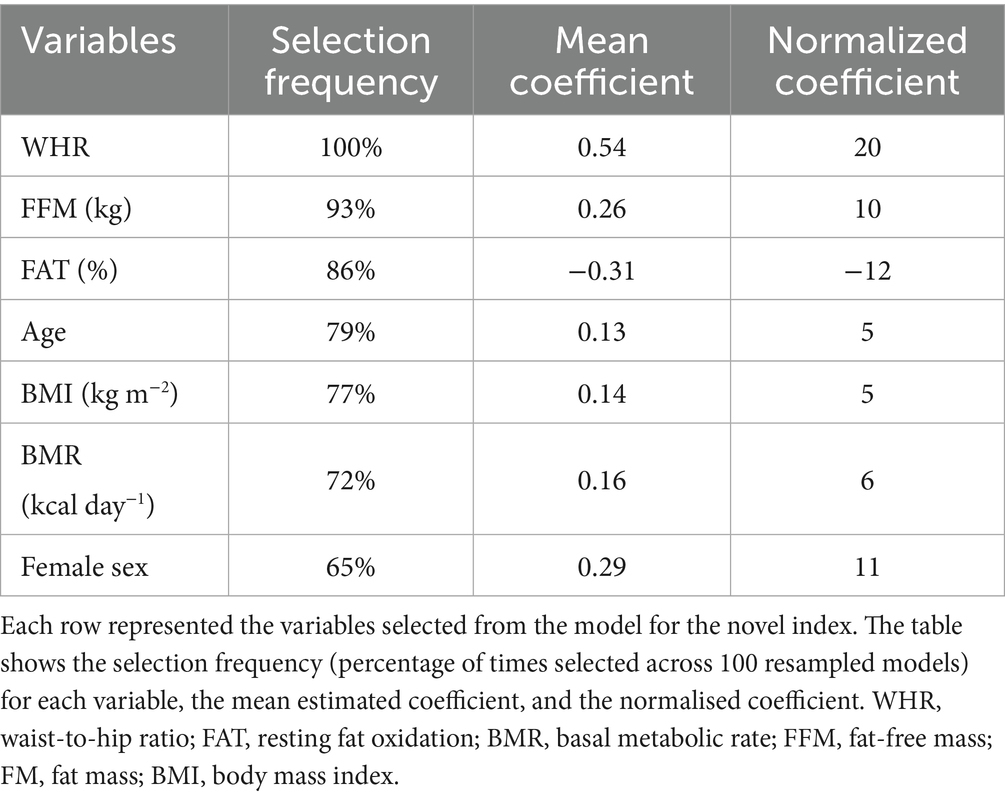
Table 3. Variables selected for the novel metabolic syndrome index.
The resulting score ranged from −70.35 to 92.14 in the training dataset, with a mean of 6.74 (SD: 29.6). The optimal threshold for identifying individuals at risk of metabolic syndrome corresponded to a score of 1.85. Model performance was evaluated on the testing set, yielding an AUC of 0.73 (95% CI: 0.66–0.81), indicating a good discriminative ability (Figure 5). At the optimal cut-off, the model showed a sensitivity of 0.83 (95% CI: 0.71–0.92), a specificity of 0.54 (95% CI: 0.46–0.62), a positive predictive value (PPV) of 0.41 (95% CI: 0.32–0.50), and a negative predictive value (NPV) of 0.90 (95% CI: 0.82–0.95).
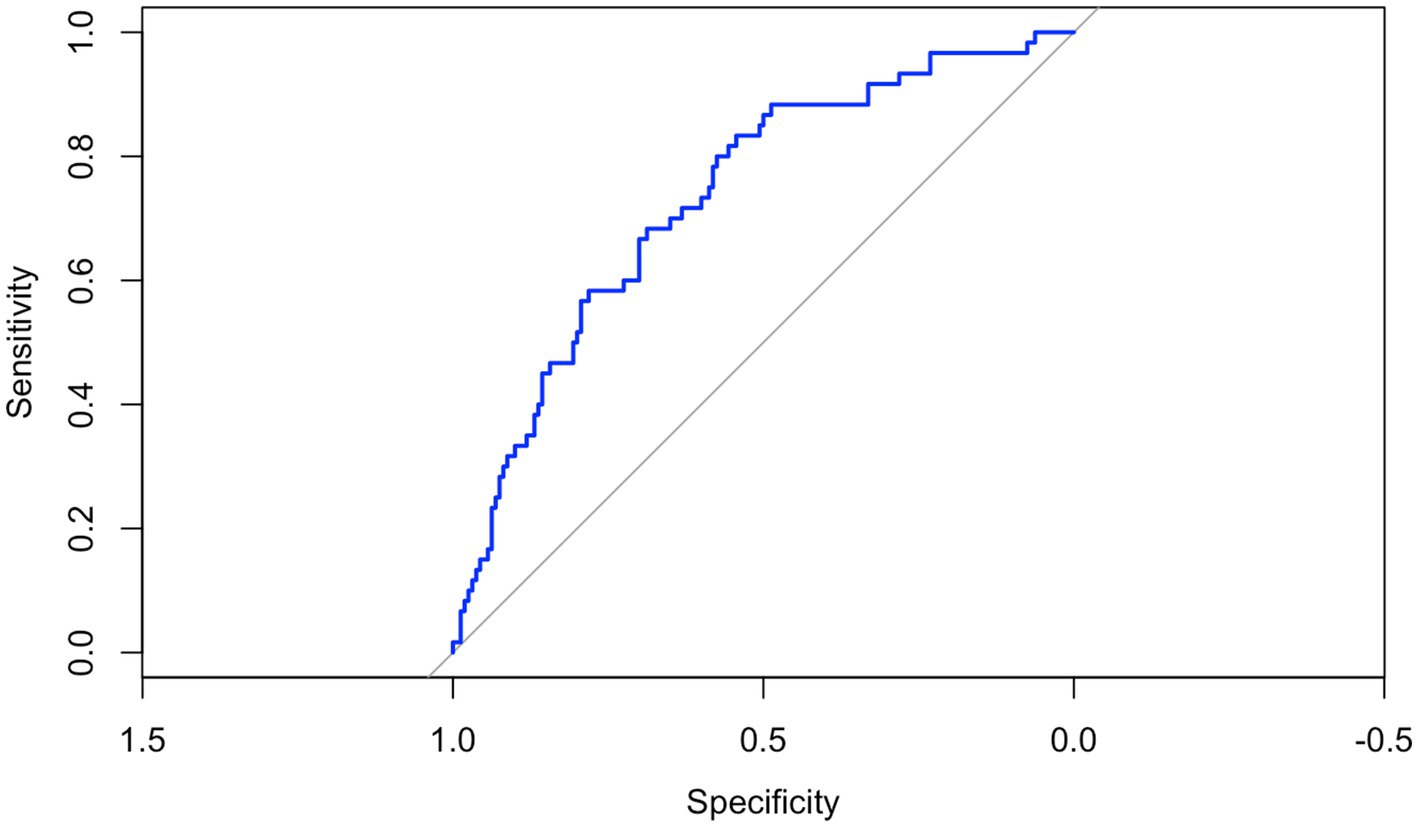
Figure 5. The receiver operating characteristic (ROC) curve of the novel index in predicting metabolic syndrome in adolescents with obesity in the testing set. The ROC curve illustrates the trade-off between sensitivity (true positive rate) and 1-specificity (false positive rate) across different cut-offs. The model is based on a risk score created by the LASSO logistic regression trained on 70% of the dataset and tested on the remaining 30% of participants. The area under the curve (AUC) was 0.73 (95% CI: 0.66–0.81), indicating a good discriminatory ability of the index in differentiating between adolescents with and without metabolic syndrome.
Discussion
The main findings of the present study were: (i) adolescents with MetS exhibited higher values of WC and HC, as well as elevated BMI, FM, triglycerides, fasting insulin, and HOMA-IR compared to their peers without MetS; (ii) FFM (%) and high-density lipoprotein cholesterol (HDL-C) were protective factors for MetS; (iii) higher BMI z-scores, HOMA-IR, and resting CHO were identified as significant risk factors for the development of MetS. Moreover, this paper proposed a novel predictive index for MetS that incorporates direct measures of body composition and resting substrate oxidation, which demonstrated good discriminative ability in identifying the presence of MetS.
Our findings revealed that 202 participants (28%) in our sample met the diagnostic criteria for MetS. This prevalence aligns with previous cross-sectional studies in paediatric populations with obesity, where rates of MetS range from 10 to 38% (4, 5). WC was significantly higher in adolescents with MetS, reinforcing its role as an indirect marker of visceral adipose tissue (VAT) accumulation (20). Consistent with prior research (39, 44, 45), adolescents with MetS exhibited a higher prevalence of metabolic abnormalities, including elevated triglycerides, hyperinsulinemia, insulin resistance, and reduced levels of HDL-C. These data suggest that increased central adiposity, reflected by greater WC, may contribute to the development of insulin resistance and hyperinsulinemia through several well-established mechanisms (46). VAT is highly metabolically active and exhibits increased lipolytic activity, leading to elevated circulating free fatty acids (47). Free fatty acids, in turn, impair insulin-mediated glucose uptake in peripheral tissues partially by the secretion of pro-inflammatory cytokines, which interfere with insulin signalling pathways (47, 48). All together, these alterations contribute to impaired insulin action and may promote early metabolic dysfunction, although this mechanistic pathway was not directly assessed in the present study.
The second key finding of our study was the identification of several significant risk and protective factors associated with the development of MetS in a large cohort of adolescents with obesity. Notably, our analysis highlighted two main protective factors. The first is FFM (%). FFM plays a crucial protective role in the development of MetS in adolescents with obesity. Indeed, higher FFM is associated with improved insulin sensitivity, enhanced glucose uptake, and increased resting energy expenditure, all of which contribute to a more favourable cardiometabolic profile. This is partially supported by our findings, which revealed significant differences in body composition parameters between adolescents with and without MetS. Moreover, skeletal muscle, the main component of FFM, serves as a primary site for glucose disposal and lipid oxidation, playing a central role in maintaining metabolic homeostasis (49, 50). Regular physical activity, particularly resistance and aerobic training, promotes muscle hypertrophy and mitochondrial adaptations, thereby increasing FFM (10, 51). These physiological changes enhance substrate utilisation efficiency and may substantially lower the risk of developing MetS later in life (52). The second protective factor identified is HDL-C. Higher levels of HDL-C were associated with a significantly reduced risk of MetS (OR < 1), underscoring the well-established protective role of HDL in metabolic health. Beyond its role in reverse cholesterol transport, HDL also exerts anti-inflammatory and antioxidant effects that may enhance insulin sensitivity and lower cardiometabolic risk (53). These findings underscore the importance of comprehensive metabolic profiling in adolescents with obesity to detect early metabolic alterations. Identifying both risk and protective factors can inform personalised prevention strategies aimed at improving long-term metabolic health and reducing the progression of MetS into adulthood. Among the most relevant risk factors, a higher rate of resting CHO emerged as a novel and independent predictor of MetS. This observation suggests that adolescents with obesity who predominantly rely on carbohydrates as an energy source at rest may display impaired metabolic flexibility, potentially indicating early alterations in mitochondrial efficiency or insulin signalling (10, 14). From a physiological perspective, elevated resting CHO oxidation may reflect a reduced capacity for lipid oxidation, possibly linked to diminished mitochondrial oxidative function or a blunted response to insulin (10, 14). Such metabolic shifts may favour glycolytic pathways even in the absence of acute energy demand. Moreover, several studies showed that resting metabolic inflexibility and elevated resting CHO are not features of obesity per se, but rather distinctive traits of youth with metabolically unhealthy obesity (13, 54). As previously suggested, these individuals also exhibit poorer insulin sensitivity compared to their peers with metabolically healthy obesity, findings that are partially supported by our results. In our adolescent sample, those with MetS displayed a worse glycaemic profile than those without MetS, despite both groups being affected by obesity. Nonetheless, several confounding factors may influence substrate utilisation at rest, including habitual diet, recent food intake, cardiorespiratory fitness, and physical activity levels (17, 55). These variables can affect insulin sensitivity and substrate availability, thereby modulating the balance between fat and carbohydrate oxidation. While some of these aspects were not directly accounted for in the present analysis, they warrant consideration in future investigations to clarify the underlying mechanisms and strengthen the interpretability of resting CHO oxidation as a marker of cardiometabolic risk. However, the strength of our model lies in having adjusted the odds ratio for age, sex, and the presence of MetS.
However, current findings in paediatric populations remain inconsistent, partly due to the limited consideration of confounding factors such as cardiorespiratory fitness and substrate utilisation during aerobic exercise (56). Elevated BMI z-scores and higher values of the HOMA-IR were also significantly associated with the presence of MetS, in line with previous literature emphasising the central role of excess adiposity and insulin resistance in the pathogenesis of metabolic dysfunction (57, 58). The ORs for these variables indicated a markedly increased likelihood of developing MetS, reinforcing their relevance in early clinical risk stratification.
The last important finding of our study was the development of a novel predictive index for MetS, which integrates WHR, FFM, resting FAT (%), age, BMI, BMR, and sex. This composite index yielded an AUC of 0.73, indicating moderate to good discriminative ability for identifying individuals at risk of MetS. The inclusion of BMR, FFM, and resting FAT (%) represents a key innovation of this model, as these parameters reflect essential aspects of metabolic function that are typically overlooked in standard clinical assessments. Both BMR and FFM are major determinants of total energy expenditure (17) while resting FAT (%) is closely related to metabolic flexibility (12). Moreover, reduced resting FAT (%) has been associated with an increased risk of developing metabolic dysregulation and insulin resistance later in life (13). However, in our cohort, we did not observe significant differences in resting FAT (%) between adolescents with and without MetS. In comparison, commonly used indexes such as BMFI, VAI, WtHR, CMI, and the MetS z-score have demonstrated AUC values ranging from 0.55 to 0.77 in paediatric populations (39, 45). While these indexes provide practical screening tools, they do not account for metabolic and bioenergetic resting parameters. In contrast, our model incorporates both structural components (e.g., FFM, BMI, WHR) and resting energetics parameters (e.g., BMR, resting FAT oxidation), offering a more integrated approach to metabolic risk assessment. Although the predictive performance of our index is comparable to that of existing models, its inclusion of physiologically relevant variables may enhance early risk stratification when used in conjunction with traditional markers. Further validation in larger and more diverse cohorts is warranted to optimise its predictive value and explore its clinical applicability in preventive care. Notably, while the model demonstrated good sensitivity, its specificity was low, suggesting that further investigation and external validation are necessary to improve its ability to accurately exclude individuals without metabolic syndrome and enhance its overall clinical performance. Moreover, external replication studies are necessary to confirm the model’s stability, particularly to investigate the wide confidence intervals observed for some predictors (55).
Our study has several limitations that should be acknowledged. First, longitudinal research is necessary to evaluate the ability of our index to predict the progression of MetS over time in adolescents with obesity. Second, we did not employ dual-energy X-ray absorptiometry (DEXA), the gold standard for body composition analysis, due to the large sample size, cost constraints, and concerns related to radiation exposure in paediatric populations. Instead, we used WC as a surrogate marker of central obesity. Although WC is widely adopted in clinical research, it may be subject to measurement variability. To mitigate this, all anthropometric assessments were conducted by trained and experienced healthcare professionals, enhancing data consistency and reliability.
Moreover, although BIA is less accurate than DEXA (which represents the gold standard), it offers a feasible, non-invasive, and scalable method for estimating body composition, particularly in large cohorts and standard clinical settings. Its affordability and ease of use make it especially valuable in paediatric obesity management, where access to advanced imaging modalities is often constrained. Similarly, although indirect calorimetry is not the gold standard for assessing substrate oxidation, it remains a validated and widely adopted method. Together, these tools offer a pragmatic yet scientifically sound approach, striking an important balance between methodological rigour and practical applicability. Emphasising this balance strengthens the translational relevance of the study, supporting its implementation in real-world settings where resources and time are often limited.
In conclusion, our study identified FFM and HDL-C as significant protective factors against the development of MetS in adolescents with obesity. In contrast, increased WC, BMI, HOMA-IR, and resting RER emerged as key risk factors. These findings emphasise the critical role of body composition, both as a protective and risk-related component, in the pathogenesis of MetS. Moreover, they underscore the importance of promoting regular aerobic and resistance exercise in this population as a targeted strategy to modify risk factors and reduce the likelihood of developing MetS. Importantly, we propose a novel predictive index that incorporates WHR, FFM, resting FAT (%), BMI, BMR, and sex, which demonstrates good discriminatory power and provides a more comprehensive assessment of metabolic risk compared to traditional anthropometric-based indexes. Future longitudinal studies are, however, necessary to understand how changes in this novel predictive index over time might be usefully employed in guiding personalised therapeutic interventions for this clinical condition in a more effective manner.
Data availability statement
The datasets analyzed in this study cannot be made publicly available as they include sensitive information, but they can be made available upon reasonable request of interested researchers to the corresponding author, who will forward a data transfer agreement request to the relevant Ethical Committee. Requests can be addressed to Dr. Alessandro Sartorio (c2FydG9yaW9AYXV4b2xvZ2ljby5pdA==).
Ethics statement
The studies involving humans were approved by Ethics Committee no. 5, Lombardy Region, Italy (approval number: 141/25; date of approval: March 25, 2025; internal order code: 01C515; acronym: OSSIGRASSIMET). The studies were conducted in accordance with the local legislation and institutional requirements. Written informed consent for participation in this study was provided by the participants’ legal guardians/next of kin.
Author contributions
MD’A: Writing – original draft, Formal analysis, Writing – review & editing, Conceptualization. SL: Conceptualization, Validation, Writing – review & editing. MM: Writing – review & editing, Writing – original draft, Formal analysis. LM: Visualization, Writing – review & editing. ER: Writing – review & editing, Validation. SZ: Visualization, Writing – review & editing. JS: Visualization, Writing – review & editing. MI: Visualization, Formal analysis, Writing – review & editing. AB: Data curation, Writing – review & editing. DC: Writing – review & editing, Data curation. FF: Writing – review & editing, Data curation. LA: Writing – review & editing, Data curation. EV: Data curation, Writing – review & editing. AS: Supervision, Conceptualization, Funding acquisition, Writing – review & editing, Data curation.
Funding
The author(s) declare that financial support was received for the research and/or publication of this article. This work was supported by the Italian Ministry of Health-Ricerca Corrente.
Acknowledgments
The authors would like to thank all the children and adolescents, as well as their families, for their participation in the study. They also extend their gratitude to the physicians and nurses of the Division of Auxology at the Istituto Auxologico Italiano, IRCCS, Piancavallo, Verbania, Italy, for their valuable assistance during the clinical study.
Conflict of interest
The authors declare that the research was conducted in the absence of any commercial or financial relationships that could be construed as a potential conflict of interest.
Generative AI statement
The author(s) declare that no Gen AI was used in the creation of this manuscript.
Publisher’s note
All claims expressed in this article are solely those of the authors and do not necessarily represent those of their affiliated organizations, or those of the publisher, the editors and the reviewers. Any product that may be evaluated in this article, or claim that may be made by its manufacturer, is not guaranteed or endorsed by the publisher.
Supplementary material
The Supplementary material for this article can be found online at: https://www.frontiersin.org/articles/10.3389/fnut.2025.1624696/full#supplementary-material
References
1. Martin, A, Booth, JN, Laird, Y, Sproule, J, Reilly, JJ, and Saunders, DH. Physical activity, diet and other behavioural interventions for improving cognition and school achievement in children and adolescents with obesity or overweight. Cochrane Database Syst Rev. (2018) 1:CD009728. doi: 10.1002/14651858.CD009728.pub3
2. Kodama, S, Saito, K, Tanaka, S, Maki, M, Yachi, Y, Asumi, M, et al. Cardiorespiratory fitness as a quantitative predictor of all-cause mortality and cardiovascular events in healthy Men and women: a meta-analysis. Available online at: www.jamaarchivescme.com
3. Engin, A. The definition and prevalence of obesity and metabolic syndrome. Adv Exp Med Biol. (2017). 960:1–17. doi: 10.1007/978-3-319-48382-5_1
4. Zaki, ME, El-Bassyouni, HT, El-Gammal, M, and Kamal, S. Indicators of the metabolic syndrome in obese adolescents. Arch Med Sci. (2015) 11:92–98. doi: 10.5114/aoms.2015.49214
5. Magge, SN, Goodman, E, Armstrong, SC, Daniels, S, Corkins, M, De Ferranti, S, et al. The metabolic syndrome in children and adolescents: shifting the focus to cardiometabolic risk factor clustering. Pediatrics. (2017) 140. doi: 10.1542/peds.2017-1603
6. Kelishadi, R, Mirmoghtadaee, P, Najafi, H, and Keikha, M. Rtcle systematic review on the association of abdominal obesity in children and adolescents with cardio-metabolic risk factors. J Res Med Sci. (2015) 20:294–307. doi: 10.4103/1735-1995.156179
7. Ruiz-Castell, M, Samouda, H, Bocquet, V, Fagherazzi, G, Stranges, S, and Huiart, L. Estimated visceral adiposity is associated with risk of cardiometabolic conditions in a population-based study. Sci Rep. (2021) 11:9121. doi: 10.1038/s41598-021-88587-9
8. Fucho, R, Casals, Ń, Serra, D, and Herrero, L. Ceramides and mitochondrial fatty acid oxidation in obesity. FASEB J. (2017) 31:1263–72. doi: 10.1096/fj.201601156R
9. Galgani, JE, and Fernández-Verdejo, R. Pathophysiological role of metabolic flexibility on metabolic health. Obes Rev. (2021) 22:e13131. doi: 10.1111/obr.13131
10. Georgiev, A, Granata, C, and Roden, M. The role of mitochondria in the pathophysiology and treatment of common metabolic diseases in humans. Am J Physiol Cell Physiol. (2022) 322:C1248–59. doi: 10.1152/ajpcell.00035.2022
11. Lanzi, S, Codecasa, F, Cornacchia, M, Maestrini, S, Salvadori, A, Brunani, A, et al. Fat oxidation, hormonal and plasma metabolite kinetics during a submaximal incremental test in lean and obese adults. PLoS One. (2014) 9:e88707. doi: 10.1371/journal.pone.0088707
12. Pujia, A, Gazzaruso, C, Ferro, Y, Mazza, E, Maurotti, S, Russo, C, et al. Individuals with metabolically healthy overweight/obesity have higher fat utilization than metabolically unhealthy individuals. Nutrients. (2016) 8. doi: 10.3390/nu8010002
13. Gebara, NY, Kim, JY, Bacha, F, Lee, SJ, and Arslanian, S. Metabolic inflexibility in youth with obesity: is it a feature of obesity or distinctive of youth who are metabolically unhealthy? Clin Obes. (2022) 12:e12501. doi: 10.1111/cob.12501
14. Smith, RL, Soeters, MR, Wüst, RCI, and Houtkooper, RH. Metabolic flexibility as an adaptation to energy resources and requirements in health and disease. Endocr Rev. (2018) 39:489–517. doi: 10.1210/er.2017-00211
15. Savage, DB, Petersen, KF, and Shulman, GI. Disordered lipid metabolism and the pathogenesis of insulin resistance. Physiol Rev. (2007) 87:507–20. doi: 10.1152/physrev.00024.2006
16. Córdoba-Rodríguez, DP, Iglesia, I, Gomez-Bruton, A, Rodríguez, G, Casajús, JA, Morales-Devia, H, et al. Fat-free/lean body mass in children with insulin resistance or metabolic syndrome: a systematic review and meta-analysis. BMC Pediatr. (2022) 22. doi: 10.1186/s12887-021-03041-z
17. Johnstone, AM, Murison, SD, Duncan, JS, Rance, KA, and Speakman, JR. Factors influencing variation in basal metabolic rate include fat-free mass, fat mass, age, and circulating thyroxine but not sex, circulating leptin, or triiodothyronine. Am J Clin Nutr. (2005) 82:941–48. doi: 10.1093/ajcn/82.5.941
18. Tchernof, A, and Després, JP. Pathophysiology of human visceral obesity: an update. Physiol Rev. (2013) 93:359–404. doi: 10.1152/physrev.00033.2011
19. August, GP, Caprio, S, Fennoy, I, Freemark, M, Kaufman, FR, Lustig, RH, et al. Prevention and treatment of pediatric obesity: an Endocrine Society clinical practice guideline based on expert opinion. J Clin Endocrinol Metab. (2008) 93:4576–99. doi: 10.1210/jc.2007-2458
20. Romieu, I, Dossus, L, Barquera, S, Blottière, HM, Franks, PW, Gunter, M, et al. Energy balance and obesity: what are the main drivers? Cancer Causes Control. (2017) 28:247–58. doi: 10.1007/s10552-017-0869-z
21. Cole, TJ, Bellizzi, MC, Flegal, KM, and Dietz, WH. Establishing a standard definition for child overweight and obesity worldwide: international survey. BMJ. (2000) 320:1240–3. doi: 10.1136/bmj.320.7244.1240
22. World Health Organization. Waist circumference and waist-hip ratio: Report of a WHO expert consultation, Geneva, (2008). Available online at: https://apps.who.int/iris/handle/10665/44583
23. Ochoa Sangrador, C, and Ochoa-Brezmes, J. Waist-to-height ratio as a risk marker for metabolic syndrome in childhood. A meta-analysis. Pediatr Obes. (2018) 13:421–32. doi: 10.1111/ijpo.12285
24. Petta, S, Amato, M, Cabibi, D, Cammà, C, Di Marco, V, Giordano, C, et al. Visceral adiposity index is associated with histological findings and high viral load in patients with chronic hepatitis C due to genotype 1. Hepatology. (2010) 52:1543–52. doi: 10.1002/hep.23859
25. Ejtahed, HS, Kelishadi, R, Hasani-Ranjbar, S, Angoorani, P, Motlagh, ME, Shafiee, G, et al. Discriminatory ability of visceral adiposity index as an indicator for modeling cardio-metabolic risk factors in pediatric population: the CASPIAN-V study. J Cardiovasc Thorac Res. (2019) 11:280–86. doi: 10.15171/jcvtr.2019.46
26. Deurenberg, P, Weststrate, JA, and Seidell, JC. Body mass index as a measure of body fatness: age- and sex-specific prediction formulas. Br J Nutr. (1991) 65:105–14. doi: 10.1079/bjn19910073
27. Cacciari, E, Milani, S, Balsamo, A, Spada, E, Bona, G, Cavallo, L, et al. Italian cross-sectional growth charts for height, weight and BMI (2 to 20 yr). J Endocrinol Investig. (2006) 29:581–93. doi: 10.1007/BF03344156
28. Kagawa, M, Byrne, NM, and Hills, AP. Comparison of body fat estimation using waist:height ratio using different “waist” measurements in Australian adults. Br J Nutr. (2008) 100:1135–41. doi: 10.1017/S0007114508966095
29. Lukaski, HC. Methods for the assessment of human body composition: traditional and new. Am J Clin Nutr. (1987) 46:537–56. doi: 10.1093/ajcn/46.4.537
30. Lazzer, S, Bedogni, G, Agosti, F, De Col, A, Mornati, D, and Sartorio, A. Comparison of dual-energy X-ray absorptiometry, air displacement plethysmography and bioelectrical impedance analysis for the assessment of body composition in severely obese Caucasian children and adolescents. Br J Nutr. (2008) 100:918–24. doi: 10.1017/S0007114508922558
31. Talma, H, Chinapaw, MJM, Bakker, B, Hirasing, RA, Terwee, CB, and Altenburg, TM. Bioelectrical impedance analysis to estimate body composition in children and adolescents: a systematic review and evidence appraisal of validity, responsiveness, reliability and measurement error. Obes Rev. (2013) 14:895–905. doi: 10.1111/obr.12061
32. Thivel, D, Verney, J, Miguet, M, Masurier, J, Cardenoux, C, Lambert, C, et al. The accuracy of bioelectrical impedance to track body composition changes depends on the degree of obesity in adolescents with obesity. Nutr Res. (2018) 54:60–8. doi: 10.1016/j.nutres.2018.04.001
33. Weir, JB, and De, V. New methods for calculating metabolic rate with special reference to protein metabolism. J Physiol. (1949) 109:1–9. doi: 10.1113/jphysiol.1949.sp004363
34. Frayn, KN. Calculation of substrate oxidation rates in vivo from gaseous exchange. J Appl Physiol Respir Environ Exerc Physiol. (1983) 55:628–34. doi: 10.1152/jappl.1983.55.2.628
35. Zimmet, P, Alberti, GKMM, Kaufman, F, Tajima, N, Silink, M, Arslanian, S, et al. The metabolic syndrome in children and adolescents—an IDF consensus report. Pediatr Diabetes. (2007) 8:299–306. doi: 10.1111/j.1399-5448.2007.00271.x
36. Matthews, DR, Hosker, JP, Rudenski, AS, Naylor, BA, Treacher, DF, and Turner, RC. Homeostasis model assessment: insulin resistance and β-cell function from fasting plasma glucose and insulin concentrations in man. Diabetologia. (1985) 28:412–19. doi: 10.1007/BF00280883
37. Alberti, KGMM, Eckel, RH, Grundy, SM, Zimmet, PZ, Cleeman, JI, Donato, KA, et al. Harmonizing the metabolic syndrome: a joint interim statement of the international diabetes federation task force on epidemiology and prevention; national heart, lung, and blood institute; American heart association; world heart federation; international atherosclerosis society; and international association for the study of obesity. Circulation. (2009) 120:1640–5. doi: 10.1161/CIRCULATIONAHA.109.192644
38. Browning, LM, Hsieh, SD, and Ashwell, M. A systematic review of waist-to-height ratio as a screening tool for the prediction of cardiovascular disease and diabetes: 05 could be a suitable global boundary value. Nutr Res Rev. (2010) 23:247–69. doi: 10.1017/S0954422410000144
39. Radetti, G, Fanolla, A, Grugni, G, Lupi, F, and Sartorio, A. Indexes of adiposity and body composition in the prediction of metabolic syndrome in obese children and adolescents: which is the best? Nutr Metab Cardiovasc Dis. (2019) 29:1189–96. doi: 10.1016/j.numecd.2019.06.011
40. Wakabayashi, I, and Daimon, T. The “cardiometabolic index” as a new marker determined by adiposity and blood lipids for discrimination of diabetes mellitus. Clin Chim Acta (2015) 438:274–278. doi: 10.1016/j.cca.2014.08.042
41. Amato, MC, Giordano, C, Galia, M, Criscimanna, A, Vitabile, S, Midiri, M, et al. Visceral adiposity index: a reliable indicator of visceral fat function associated with cardiometabolic risk. Diabetes Care. (2010) 33:920–2. doi: 10.2337/dc09-1825
42. Gurka, MJ, Ice, CL, Sun, SS, and DeBoer, MD. A confirmatory factor analysis of the metabolic syndrome in adolescents: an examination of sex and racial/ethnic differences. Cardiovasc Diabetol. (2012) 11. doi: 10.1186/1475-2840-11-128
43. Meinshausen, N, and Bühlmann, P. Stability selection. J R Stat Soc Series B Stat Methodol. (2010) 72:417–73. doi: 10.1111/j.1467-9868.2010.00740.x
44. Mari, L, Lazzer, S, Gatti, A, D’Alleva, M, Zaccaron, S, Stafuzza, J, et al. Visceral adiposity, anthropometric and liver function indexes for identifying metabolic dysfunction associated Steatotic liver disease (MASLD) in adolescents with obesity: which performs better? J Clin Med. (2025) 14. doi: 10.3390/jcm14062085
45. Vizzuso, S, Del Torto, A, Dilillo, D, Calcaterra, V, Di Profio, E, Leone, A, et al. Visceral adiposity index (VAI) in children and adolescents with obesity: no association with daily energy intake but promising tool to identify metabolic syndrome (MetS). Nutrients. (2021) 13. doi: 10.3390/nu13020413
46. Ritchie, SA, and Connell, JMC. The link between abdominal obesity, metabolic syndrome and cardiovascular disease. Nutr Metab Cardiovasc Dis. (2007) 17:319–26. doi: 10.1016/j.numecd.2006.07.005
47. Kelsey, MM, Forster, JE, Van Pelt, RE, Reusch, JEB, and Nadeau, KJ. Adipose tissue insulin resistance in adolescents with and without type 2 diabetes. Pediatr Obes. (2014) 9:373–80. doi: 10.1111/j.2047-6310.2013.00189.x
48. Kanety, H, Feinstein, R, Papa, MZ, Hemi, R, and Karasik, A. Tumor necrosis factor α-induced phosphorylation of insulin receptor Substrate-1 (IRS-1). J Biol Chem. (1995) 270:23780–4. doi: 10.1074/jbc.270.40.23780
49. Murray, B, and Rosenbloom, C. Fundamentals of glycogen metabolism for coaches and athletes. Nutr Rev. (2018) 76:243–59. doi: 10.1093/NUTRIT/NUY001
50. Purdom, T, Kravitz, L, Dokladny, K, and Mermier, C. Understanding the factors that effect maximal fat oxidation. J Int Soc Sports Nutr. (2018) 15:3–10. doi: 10.1186/s12970-018-0207-1
51. Men, J, Zou, S, Ma, J, Xiang, C, Li, S, and Wang, J. Effects of high-intensity interval training on physical morphology, cardiorespiratory fitness and metabolic risk factors of cardiovascular disease in children and adolescents: a systematic review and metaanalysis. PLoS One. (2023) 18:e0271845. doi: 10.1371/journal.pone.0271845
52. Weihrauch-Blüher, S, Schwarz, P, and Klusmann, J-H. Childhood obesity: increased risk for cardiometabolic disease and cancer in adulthood. Metabolism. (2019) 92:147–52. doi: 10.1016/j.metabol.2018.12.001
53. Denimal, D. Antioxidant and anti-inflammatory functions of high-density lipoprotein in type 1 and type 2 diabetes. Antioxidants. (2024) 13. doi: 10.3390/antiox13010057
54. Vinciguerra, F, Tumminia, A, Baratta, R, Ferro, A, Alaimo, S, Hagnäs, M, et al. Prevalence and clinical characteristics of children and adolescents with metabolically healthy obesity: role of insulin sensitivity. Life. (2020) 10. doi: 10.3390/life10080127
55. D’Alleva, M, Lazzer, S, Tringali, G, De Micheli, R, Bondesan, A, Abbruzzese, L, et al. Effects of combined training or moderate intensity continuous training during a 3-week multidisciplinary body weight reduction program on cardiorespiratory fitness, body composition, and substrate oxidation rate in adolescents with obesity. Sci Rep. (2023) 13:17609. doi: 10.1038/s41598-023-44953-3
56. Rodríguez-Gómez, I, Martín-García, M, Alegre, LM, García-Cuartero, B, González-Vergaz, A, Carcavilla, A, et al. Fat oxidation rates during exercise in pre-pubertal children: the role of obesity, fitness and lean mass. Med Sci Sports Exerc. (2025) 57:1333–41. doi: 10.1249/MSS.0000000000003690
57. Chung, YL, and Rhie, Y-J. Metabolic syndrome in children and adolescents. The Ewha Medical Journal. (2022) 45. doi: 10.12771/emj.2022.e13
Keywords: obesity, metabolic syndrome, respiratory quotient, cardiometabolic index, fat-free mass
Citation: D’Alleva M, Lazzer S, De Martino M, Mari L, Rejc E, Zaccaron S, Stafuzza J, Isola M, Bondesan A, Caroli D, Frigerio F, Abbruzzese L, Ventura E and Sartorio A (2025) The role of body composition, cardiometabolic parameters, and resting substrate oxidation in protecting against metabolic syndrome in adolescents with obesity. Front. Nutr. 12:1624696. doi: 10.3389/fnut.2025.1624696
Edited by:
Roberto Fernandes Da Costa, Autonomous University of Chile, ChileReviewed by:
Josianne Rodrigues-Krause, Federal University of Rio Grande do Sul, BrazilGeorge Panayiotou, European University Cyprus, Cyprus
Copyright © 2025 D’Alleva, Lazzer, De Martino, Mari, Rejc, Zaccaron, Stafuzza, Isola, Bondesan, Caroli, Frigerio, Abbruzzese, Ventura and Sartorio. This is an open-access article distributed under the terms of the Creative Commons Attribution License (CC BY). The use, distribution or reproduction in other forums is permitted, provided the original author(s) and the copyright owner(s) are credited and that the original publication in this journal is cited, in accordance with accepted academic practice. No use, distribution or reproduction is permitted which does not comply with these terms.
*Correspondence: Mattia D’Alleva, bWF0dGlhLmRhbGxldmFAdW5pdWQuaXQ=
†These authors have contributed equally to this work and share first authorship