 Ju Luo
 Zhe Chen1†
 Yingjie Su
- 1Department of Geriatrics, The Affiliated Changsha Central Hospital, Hengyang Medical School, University of South China, Changsha, Hunan, China
- 2Department of Emergency Medicine, The Affiliated Changsha Central Hospital, Hengyang Medical School, University of South China, Changsha, Hunan, China
Background: The relationship between triglyceride–glucose (TyG) index and acute respiratory distress syndrome (ARDS) in acute pancreatitis (AP) patients is still lacking. This study aimed to explore the association between the TyG index and ARDS in AP patients using an 8-year retrospective dataset.
Methods: This study was performed in Changsha Central Hospital from January 2015 to December 2022. Univariate analysis was done to discuss the relationship between different characteristics and ARDS in AP. Multivariate regression analysis was employed to investigate the relationship between the TyG index and ARDS in AP. Eight machine learning models were employed to assess the in-hospital ARDS risk in AP patients. The SHapley Additive exPlanations (SHAP) method was utilized to verify the importance of TyG in the models.
Results: A total of 2,382 AP patients were finally enrolled, and ARDS occurred in 137 patients. With per-unit increment in TyG index, the risk of ARDS in AP increased by 133%(OR = 2.33, 95%CI: 1.51–3.60, p = 0.0001) after adjusting all potential confounders. The relationship between the TyG index and ARDS in AP was non-linear. The XGBoost (AUC = 0.857 ± 0.034) and Random Forest (AUC = 0.851 ± 0.045) algorithms were the best two performance methods. In the SHAP analysis, TyG was the second most important feature in the RF model and the seventh in the XGBoost model.
Conclusion: TyG index was associated with in-hospital ARDS in AP. The XGBoost and Random Forest models based on the TyG index had the best performance for predicting ARDS in AP patients. The SHAP method further confirmed that the TyG index serves as a significant predictor for the development of ARDS in patients with acute pancreatitis.
Introduction
Acute pancreatitis (AP) is a general digestive disease with a comparatively high morbidity, which is characterized by abdominal symptoms and increased pancreatic enzymes, partly leading to organ dysfunction and life-threatening condition (1). Due to the regional differences, the incidence of AP varies from 30 to 40 cases/100,000 persons every year globally (2, 3). Around 20% of the AP patients might develop into severe acute pancreatitis (SAP), which is characterized by persistent organ failure and a high mortality increase from 20 to 40% (4, 5), thereby increasing both the therapeutic challenges and economic burden of the disease.
Previous studies demonstrate that in SAP, the respiratory system is usually affected, and ARDS could be one of the most common organ dysfunction disorders (3, 6). About one-third of SAP patients develop ARDS, accounting for approximately 60% of deaths in the first week of onset (7, 8). Recently, although there have been many advances in the treatment of ARDS, its prognosis is still poor (9). Therefore, early identification of high-risk patients with early intervention and treatment to prevent and delay the occurrence and development of ARDS is significant for improving patient outcomes.
Previous researches show that some predictive models, including the Lung Injury Prediction Score (LIPS) and the Early Acute Lung Injury (EALI) score, have been used to evaluate the risk of ARDS from various disorders (3, 10). However, these scoring systems lack specificity in predicting the occurrence of ARDS with AP. However, most of the models developed in previous studies to predict ARDS related to SAP contain excessive parameters, relatively complex calculations, and strong dependence on imaging or unconventional clinical examinations, which greatly limit their clinical application (2, 11, 12).
The triglyceride glucose (TyG) index is derived from fasting triglyceride (TG) and blood glucose (FBG) levels and has become a simple alternative biomarker for insulin resistance (IR). An increasing amount of research evidence suggests that IR plays a critical role in AP and its complications, and the TyG index is associated with the prognosis of SAP (3, 13). Zhang et al. reported that in animal models of ARDS, it was found that insulin signaling was significantly downregulated, and IR played a crucial role in the occurrence and development of ARDS (14). Another study included 206 patients with COVID-19, and the results suggest that the TyG index is closely related to the severity and prognosis of ARDS (15). However, there is still a lack of research on the relationship between the TyG index and ARDS in AP patients.
The aim of this study is to explore the association between the TyG index and ARDS in AP patients using data collected over 8 years, providing a new biomarker for identifying early ARDS in AP patients and promoting timely clinical intervention.
Methods
Study cohort
This retrospective study was performed on the basis of the clinical data from Changsha Central Hospital. In the study, all the AP patients with records of fasting blood sugar (FBG) and triglyceride (TG) within 24 h after admission to the hospital from January 2015 to December 2022 were enrolled (n = 2,787) (Figure 1). Patients with following criteria were excluded (n = 405): (1) < 18-year-old (n = 18); (2) pregnant (n = 5); (3) tumor (n = 12); (4) liver cirrhosis (n = 1); (5) chronic obstructive pulmonary disease (COPD) (n = 18); (6) rheumatic autoimmune diseases (n = 3); (7) onset of AP > 72 h (n = 348) (Figure 1). Finally, 2,383 AP patients were included.

Figure 1. Flow chart for patients’ enrollment and study design. ARDS, acute respiratory distress syndrome; AP, acute pancreatitis; TG, triglyceride; FBG, fasting blood glucose; COPD, chronic obstructive pulmonary disease; XGBoost, eXtreme Gradient Boosting; LR, Logistic Regression; DT, Decision Tree; KNN, K-Nearest Neighbors; GaussianNB, Gaussian Naive Bayes; MultinomialNB, Multinomial Naive Bayes; MLP, Multilayer perceptron; RF, Random Forest; SHAP, SHapley Additive exPlanations.
Definitions
The definition of AP was confirmed when at least two out of three these criteria were met as follows: (1) digestive symptoms such as abdominal pain or abdominal distention; (2) the levels of serum amylase or lipase increased by three times compared with the normal levels of serum amylase or lipase; (3) ultrasonic or CT/MRI scan findings show the AP (16, 17). The etiology of hypertriglyceridemia (HTG) in AP was confirmed as follows: (1) TG ≥ 1,000 mg/dL; (2) TG ≥ 500 mg/dL with milky serum (18, 19). The definition of ARDS was based on the Berlin definition (20) and the new global definition of ARDS (2021) (21).
Exposure and endpoint
TyG index was defined by {ln [TG(mg/dL) × FBG(mg/dL)/2]}. The endpoint was in-hospital ARDS.
Characteristics
Baseline characteristics, such as age, gender, etiology (HTG, biliary), comorbidity [diabetes, hypertension, and coronary artery disease (CAD)], vital signs [heart rate (HR), systolic blood pressure (SBP), respiratory rate (RR), diastolic blood pressure (DBP)], and length of stay (LOS) in hospital were included. Lab findings within 24 h after admission in hospital were collected: TG, FBG, white blood cell (WBC), creatinine, aspartate aminotransferase (AST), platelet (PLT), total bilirubin, prothrombin time (PT), albumin, globulin, alanine aminotransferase (ALT), urea nitrogen, amylase, lipase, total cholesterol, total calcium, high-density lipoprotein (HDL), ionized calcium, and low-density lipoprotein (LDL). Scores within 24 h after admission to the hospital were collected: Ranson, bedside index of severity in acute pancreatitis (BISAP), acute physiology, and chronic health evaluation (APACHEII).
Statistical analysis
We used the Packages R1 and EmpowerStats2 software for statistical analysis. Statistically significant difference was considered with the p-value < 0.05.
First, on the basis of the tertiles of the TyG index, the study cohort was divided into three groups (T1–T3 groups). Baseline characteristics between T1 and T3 groups were analyzed. Continuous characteristics were expressed by the median with interquartile ranges (Median, Q1–Q3). Categorical characteristics were shown by the percentages (Number, %). Mann–Whitney U-test or Chi-squared test was used. Second, univariate analysis was done to discuss the relationship between different characteristics and ARDS in AP. Third, multivariate regression analysis was utilized to investigate the relationship between the TyG index and ARDS in AP. Three different models were performed as follows: Crude model (adjusted for none), Model I (adjusted for gender, age, diabetes, hypertension, CAD, HTG, biliary), Model II (adjusted for gender, age, comorbidities, etiology, vital signs, laboratory variables, scores of Ranson, BISAP, and APACHEII). Fourth, we explored whether the relationship between TyG and ARDS in AP was a linear or non-linear feature. The non-linear model was considered with the p-value less than 0.05. Moreover, the generalized additive model was used for performing the smooth fitting curve. Fifth, the receiver-operator characteristic (ROC) with accuracy, sensitivity, and specificity of the TyG index was used for predicting ARDS in AP. In addition, subgroup analysis was performed.
Machine learning method
For dealing with missing data, the multiple imputation method Miceforest was utilized (22).
It is based on the multiple imputation of the chain equation of random forest using the process of predictive mean matching to select the value to be estimated. The Boruta algorithm in machine learning was used to rank the features according to their importance of the predictive ability of in-hospital ARDS. We use the random forest chain equation for multiple imputation and employ a predictive mean matching process to select estimated values. We use the Boruta algorithm in machine learning to assess the importance of predictive ability for ARDS in hospitalized patients and to rank features accordingly.
Then, the acceptable variables are integrated into the machine learning (ML) algorithm. The Logistic Regression (LR), eXtreme Gradient Boosting (XGBoost), K-Nearest Neighbors (KNN), Decision Tree (DT), Multinomial Naive Bayes (MultinomialNB), Random Forest (RF), Multilayer perceptron (MLP), and Gaussian Naive Bayes (GaussianNB) were used to evaluate the in-hospital ARDS risk of AP patients. The patient dataset was randomly divided into a development set and a validation set in an 8:2 ratio. A fivefold cross validation is used for internal verification. ROC curve and AUC are used to evaluate the performance of the model. The SHapley Additive exPlans (SHAP) method is used to validate the role of TyG in the model. All relevant machine learning methods and codes can be accessed for free at the following website https://github.com/philiplaw1984/TyG/.
Results
Baseline characteristics of the AP patient’s cohort
Based on the flow chart (Figure 1), 405 patients were excluded and 2,382 AP patients were finally enrolled in this study. In the study cohort, the median age was 43 years, and men accounted for 74.06% (n = 1764) (Table 1). The number of AP patients based on the different etiologies, such as alcohol, HTG, and biliary were 509 (21.37%), 1,234 (51.81%), and 423 (17.76%), respectively. The number of patients with diabetes, hypertension, and CAD was 458 (19.23%), 436 (18.30%), and 72 (3.02%), respectively. The median TyG index was 10.58 (9.14–11.81).

Table 1. Comparison of general variables between ARDS group and non-ARDS group in AP patients.
Comparison of general variables between ARDS group and non-ARDS group in AP patients
In Table 1, general variables between the ARDS group (n = 137) and the non-ARDS group (n = 2,245) were compared. In the ARDS group, the ratio of HTG-AP was 71.58% (n = 98), and men accounted for 83.94% (n = 115) (both p < 0.05). The proportion of diabetes was significantly higher in the ARDS group (p = 0.017). Variables including DBP, HR, RR, TyG, TG, FBG, WBC, PT, globulin, urea nitrogen, creatinine, amylase, lipase, and total cholesterol were significantly higher in the ARDS group (all p < 0.05), while the levels of total calcium, ionized calcium, and HDL were significantly lower in the ARDS group (all p < 0.05). The LOS in hospital was longer and the scores of Ranson, BISAP, and APACHEII were higher in the ARDS group (all p < 0.001).
Comparison of baseline characteristics between three groups based on tertiles of TyG index in AP patients
In Table 2, on the basis of the tertile levels of the TyG index, the AP patients were divided into three groups: T1 group (n = 794, TyG index<9.51), T2 group (n = 794, TyG index: 9.51–11.45), and T3 group (n = 794, TyG index>11.45). The incidences of ARDS in T1, T2, and T3 groups were 2.90% (n = 23), 3.40% (n = 27), and 10.96% (n = 87), respectively (p < 0.001). In the T3 group, the age was significantly lower, and the proportions of HTG, men, and diabetes were significantly higher (all p < 0.001). The median levels of TG, FBG, and TyG index in the T3 group were 2223.12 mg/dL, 198.00 mg/dL, and 12.15, respectively. The vital sign indexes, such as SBP, DBP, HR, and RR were all higher in the T3 group (all p < 0.001). Lab findings, such as WBC, PLT, PT, albumin, globulin, ALT, AST, total bilirubin, urea nitrogen, creatinine, amylase, lipase, total calcium, ionized calcium, total cholesterol, HDL, and LDL, were significantly different between the three groups.
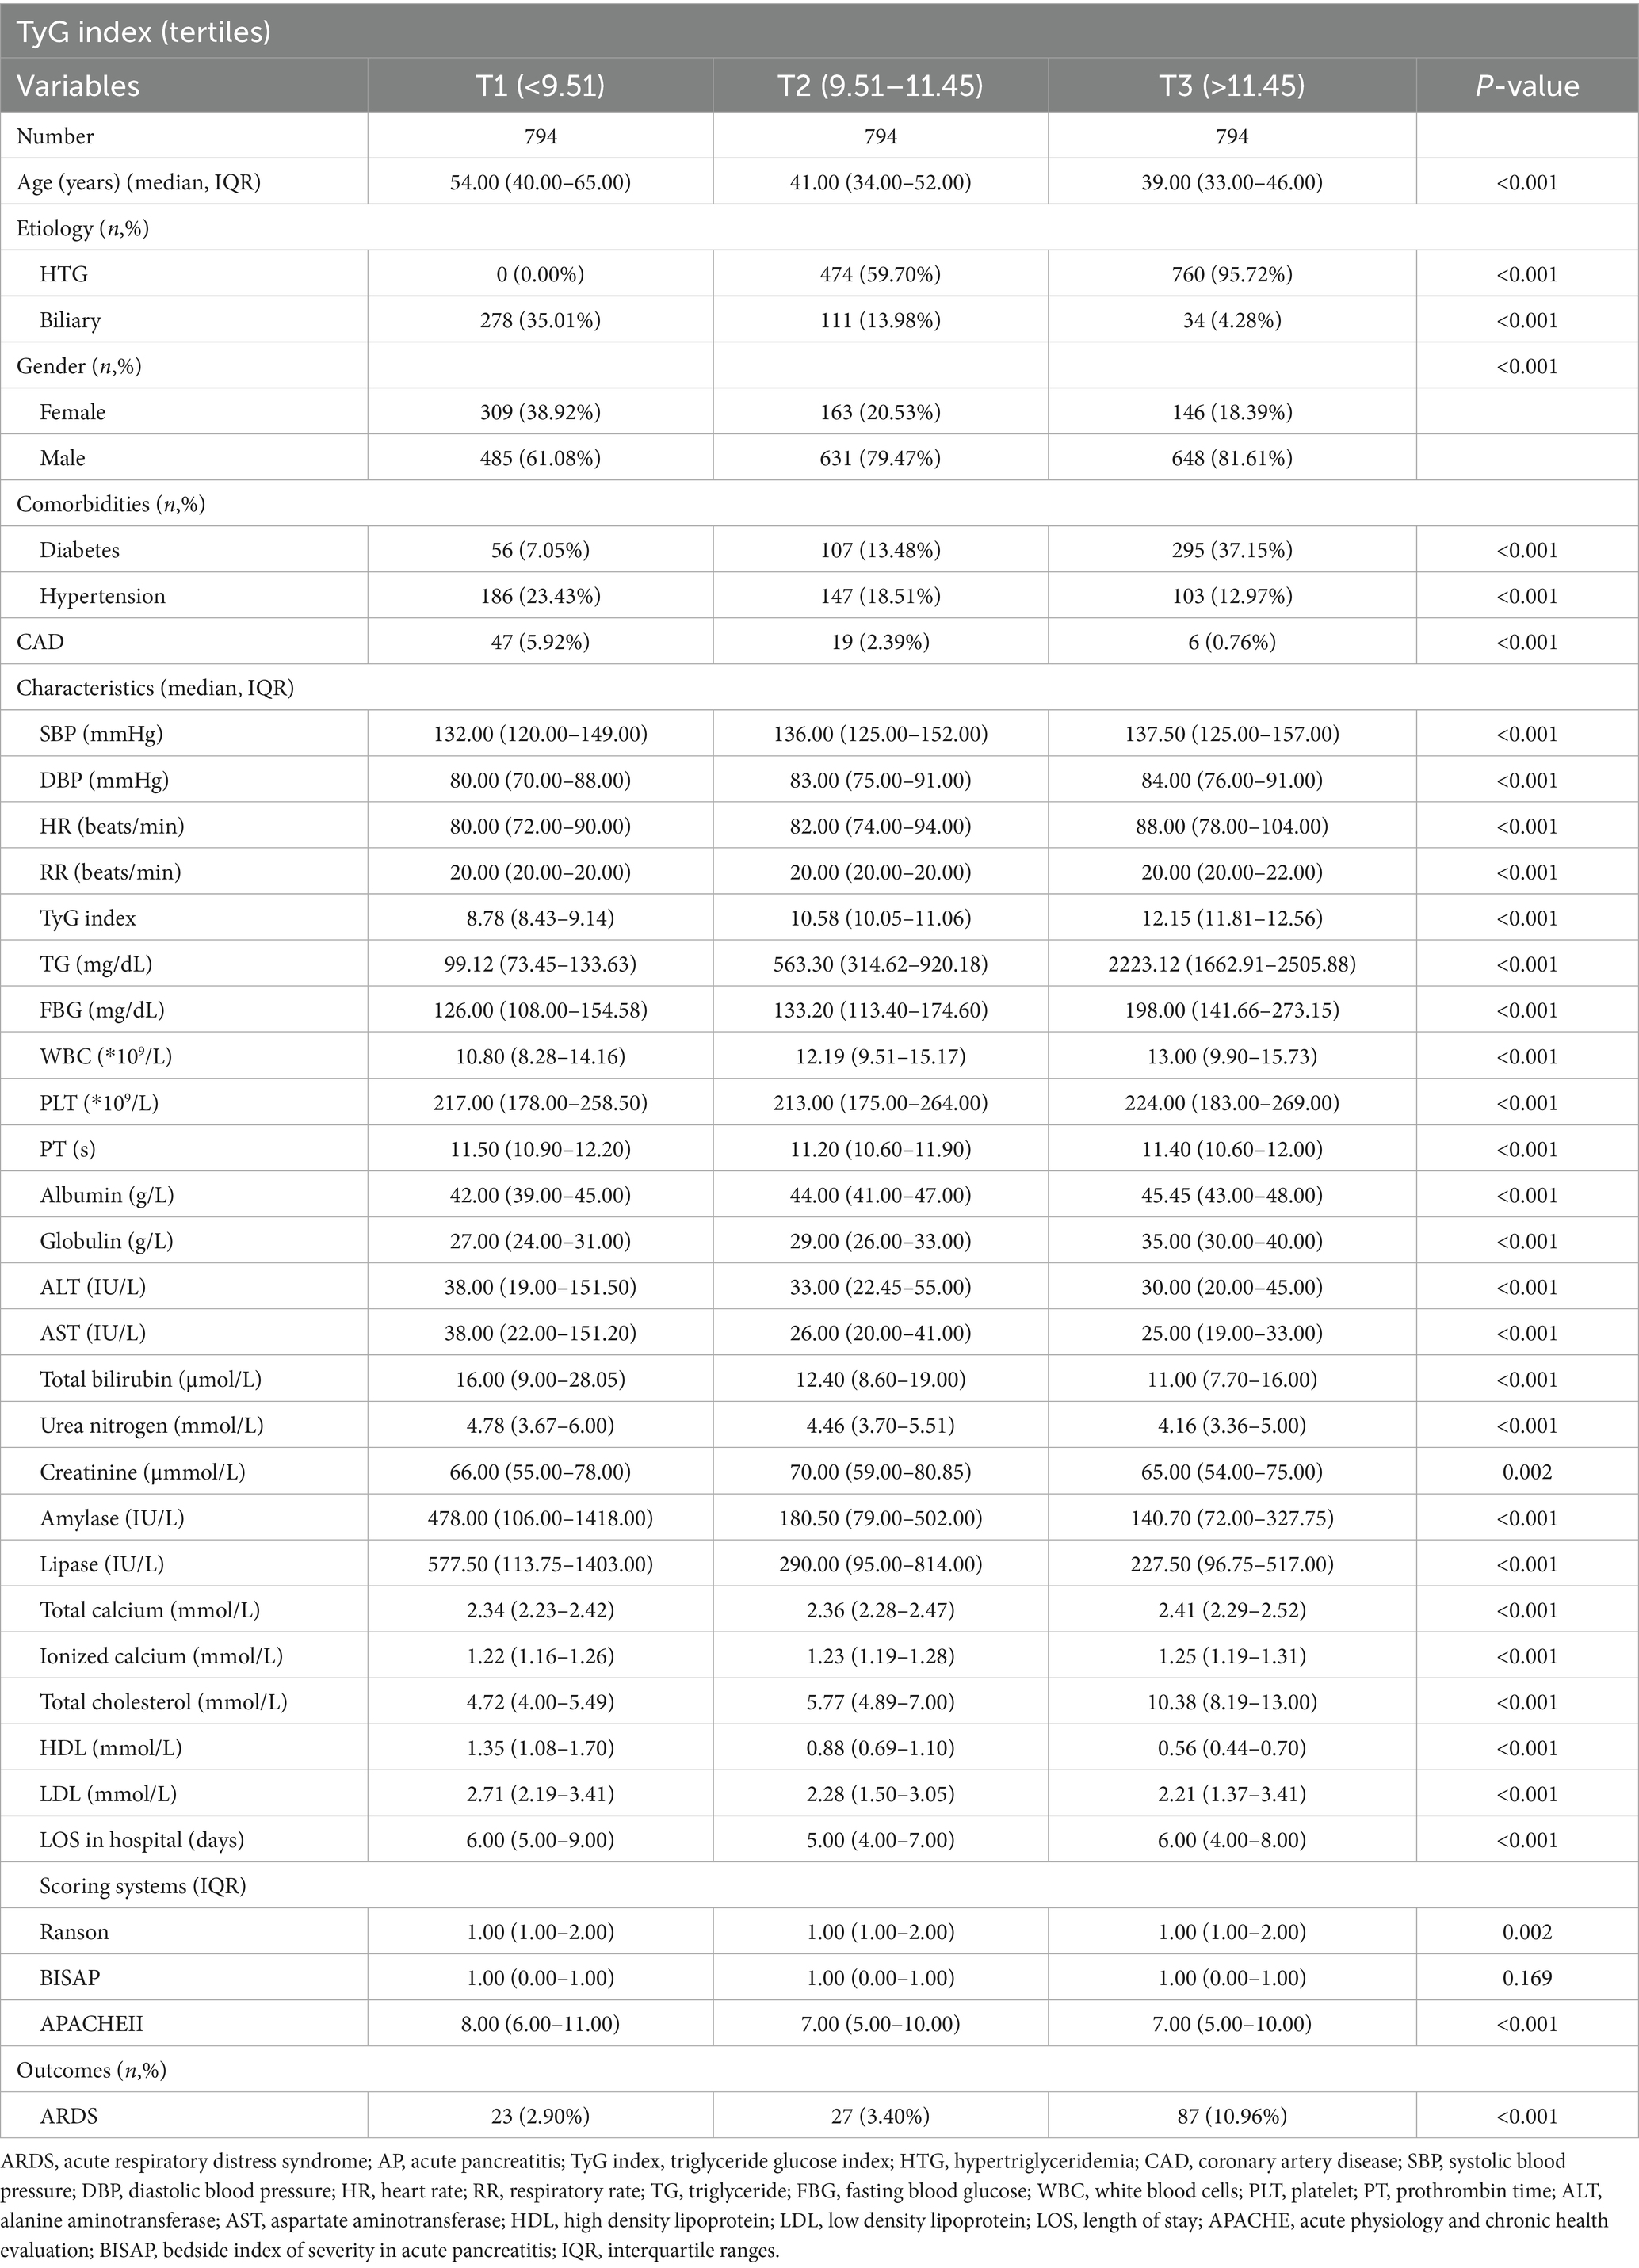
Table 2. Comparison of baseline characteristics between three groups based on tertiles of TyG index in AP patients.
Univariate analysis for ARDS in AP patients
In Table 3, variables including men (p = 0.0074), HTG (p < 0.0001), biliary (p = 0.0058), diabetes (p = 0.0182), DBP (p = 0.0248), HR (p < 0.0001), RR (p < 0.0001), TyG index (p < 0.0001), TG (p < 0.0001), FBG (p < 0.0001), WBC (p < 0.0001), PT (p < 0.0001), globulin (p = 0.0045), urea nitrogen (p = 0.0061), creatinine (p < 0.0001), amylase (p = 0.0083), lipase (p = 0.0007), total calcium (p = 0.0001), ionized calcium (p = 0.0004), total cholesterol (p < 0.0001), HDL (p = 0.0003), Ranson (p < 0.0001), BISAP (p < 0.0001), and APACHEII (p < 0.0001) were associated with ARDS in AP patients.

Table 3. Univariate analysis for ARDS in AP patients.
Associations between the TyG index and ARDS in AP patients in different models
In Table 4, with a per-unit increment in the TyG index, the risk of ARDS in AP in the crude model, adjusted model I, and model II increased by 66% (OR = 1.66, 95%CI: 1.45–1.90, p < 0.0001), 166% (OR = 2.66, 95%CI: 2.03–3.50, p < 0.0001), and 133% (OR = 2.33, 95%CI:1.51–3.60, p < 0.0001), respectively. Compared to the T1 group, the ORs of ARDS in the T3 group in the crude model, adjusted model I, and model II were 4.13 (95%CI: 2.58–6.60, p < 0.0001), 7.30 (95%CI:2.88–18.49, p < 0.0001), and 5.64 (95%CI:1.50–21.21, p = 0.0104), respectively.
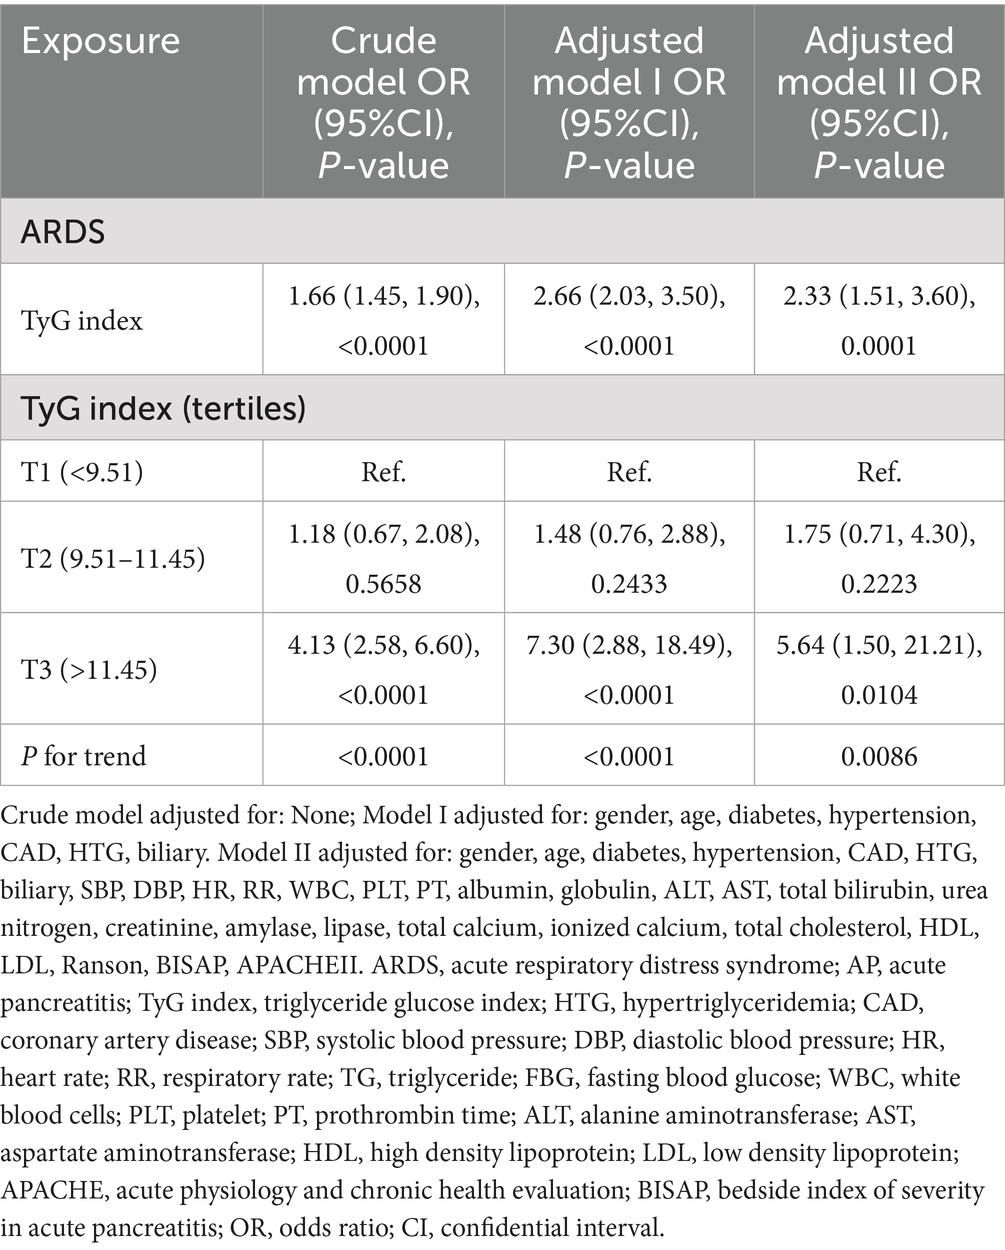
Table 4. Associations between TyG index and ARDS in AP patients in different models.
The linear and non-linear models for the relationship between TyG index and ARDS in AP patients
In Table 5, we compared the linear model and non-linear model, and the results showed that the non-linear relationship for indicating the association of TyG index and ARDS in AP was better [P for the log-likelihood ratio test was less than 0.05 (p = 0.010)]. When the TyG index≤11.31 (slope I), the OR was 1.40 (95%CI:0.79–2.48, p = 0.2528) (Figure 2). When the TyG index >11.31 (slope II), the OR was 4.30 (95%CI:2.26–8.19, p < 0.0001) (Figure 2). We also compared the two groups: TyG ≤ 11.31 (slope I) and TyG > 11.31 (slope II). The results showed that OR = 3.08 (95%CI: 1.31–7.25, p = 0.0100) when comparing slope II to slope I.
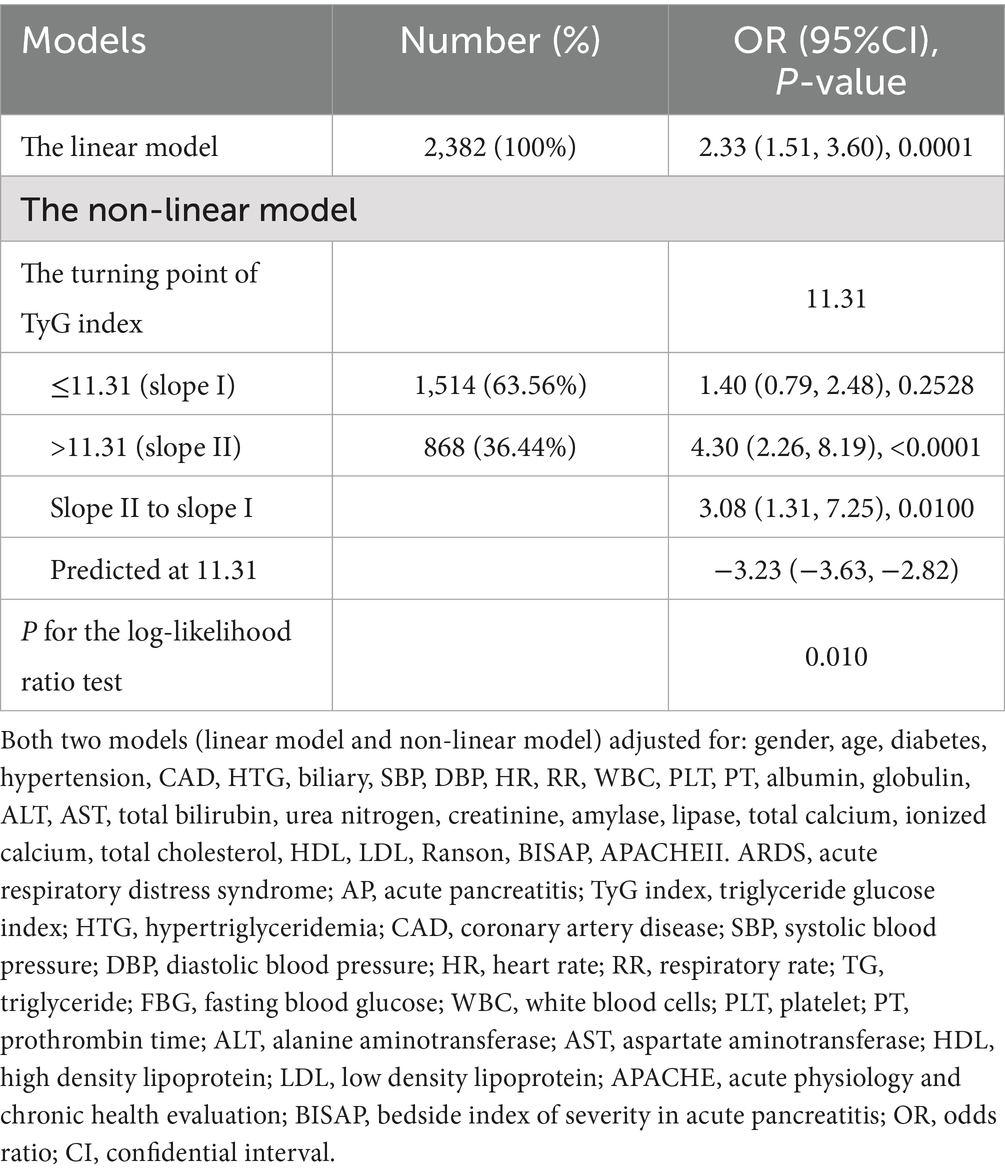
Table 5. The linear and non-linear models for the relationship between TyG index and ARDS in AP patients.
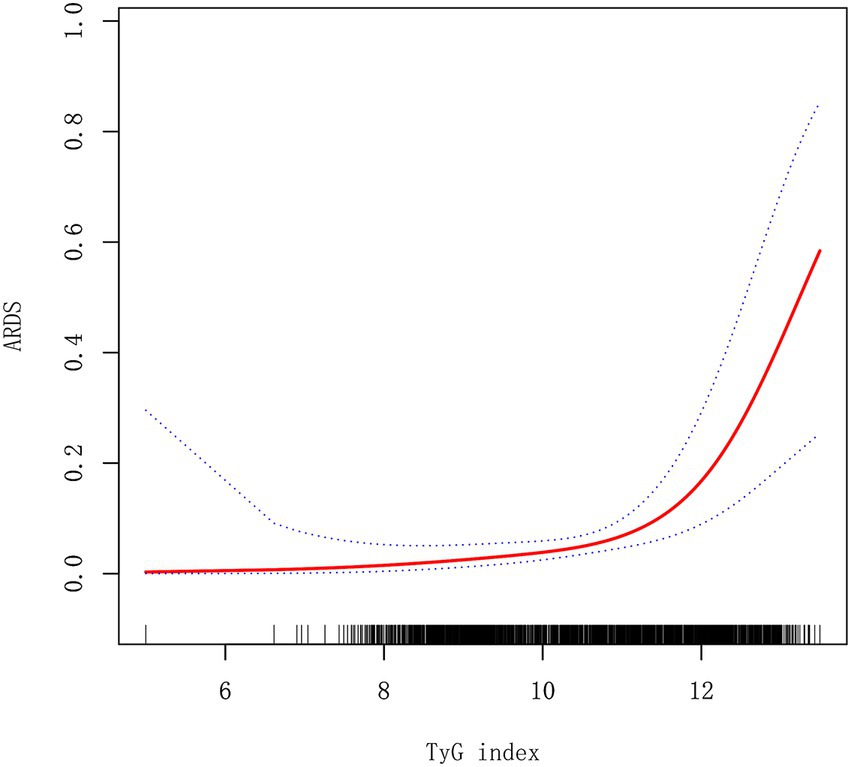
Figure 2. A smooth fitting curve shows the relationship between TyG index and ARDS in AP patients. ARDS, acute respiratory distress syndrome.
Subgroup analysis
In Table 6, subgroup analysis is shown. In AP with men (OR = 1.87, 95%CI: 1.58–2.21, p < 0.0001), low age (OR = 3.37, 95%CI: 2.25–5.06, p < 0.0001) and HTG (OR = 3.37, 95%CI: 2.41–4.70, p < 0.0001) had a higher risk of ARDS.
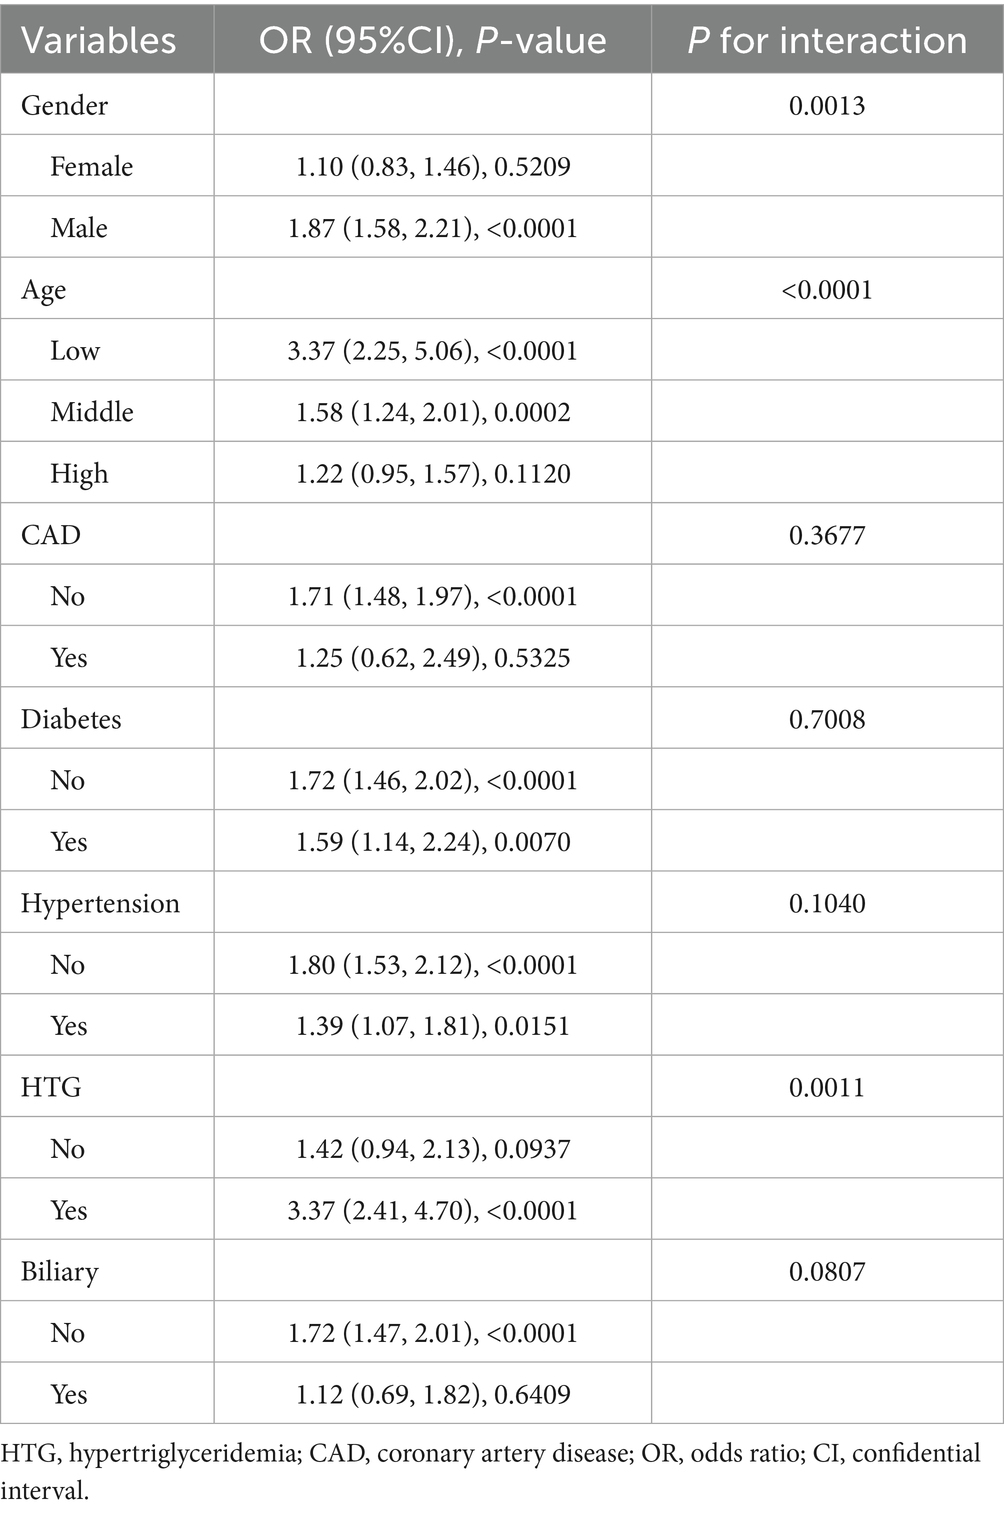
Table 6. Subgroup analysis.
Importance of factors in the impact on in-hospital ARDS ranked by Boruta algorithm
In the report from Boruta algorithm, RR, LOS in hospital, TyG, total cholesterol, lipase, TG, and all the variables in the green area were defined as important factors, which demonstrate the important roles in the model. On the contrary, the variables in the yellow and red areas were tentative and rejected factors. As shown in Figure 3, TyG was one of the key factors in the impact on in-hospital ARDS, ranked by Boruta algorithm.

Figure 3. Importance of factors in the impact on in-hospital ARDS ranked by Boruta algorithm. ARDS, acute respiratory distress syndrome; AP, acute pancreatitis; TyG index, triglyceride glucose index; HTG, hypertriglyceridemia; CAD, coronary artery disease; SBP, systolic blood pressure; DBP, diastolic blood pressure; HR, heart rate; RR, respiratory rate; TG, triglyceride; FBG, fasting blood glucose; WBC, white blood cells; PLT, platelet; PT, prothrombin time; ALT, alanine aminotransferase; AST, aspartate aminotransferase; HDL, high density lipoprotein; LDL, low density lipoprotein; LOS, length of stay; APACHE, acute physiology and chronic health evaluation; BISAP, bedside index of severity in acute pancreatitis.
Establishment and validation of the ML models
In Figure 4, the ROC curves of different ML prediction models are illustrated. The AUCs of RF, XGBoost, DT, MNB, GaussianNB, MLP, KNN, and LR were 0.851 ± 0.045, 0.857 ± 0.034, 0.654 ± 0.059, 0.613 ± 0.018, 0.842 ± 0.037, 0.610 ± 0.067, 0.632 ± 0.025, and 0.795 ± 0.049, respectively, which indicated that the Random Forest and XGBoost models were the best two performance models. To further evaluate the model’s performance in excluding the two components (TG and FBG) that constitute the TyG index. We retrained the XGBoost and Random Forest models, and the AUC values of these two models were 0.850 ± 0.036 and 0.843 ± 0.056, respectively. The results were shown in Supplementary Figure S1. In order to strengthen the generalizability and credibility, we conducted further experiments and generated the Precision-Recall curve, Decision curve, and Calibration curve based on the XGBoost model. The results are shown in Supplementary Figure S2. A comparative analysis revealed that the XGBoost model outperformed the BISAP scoring system in predicting ARDS with significant improvement. The results are shown in Supplementary Figure S3.
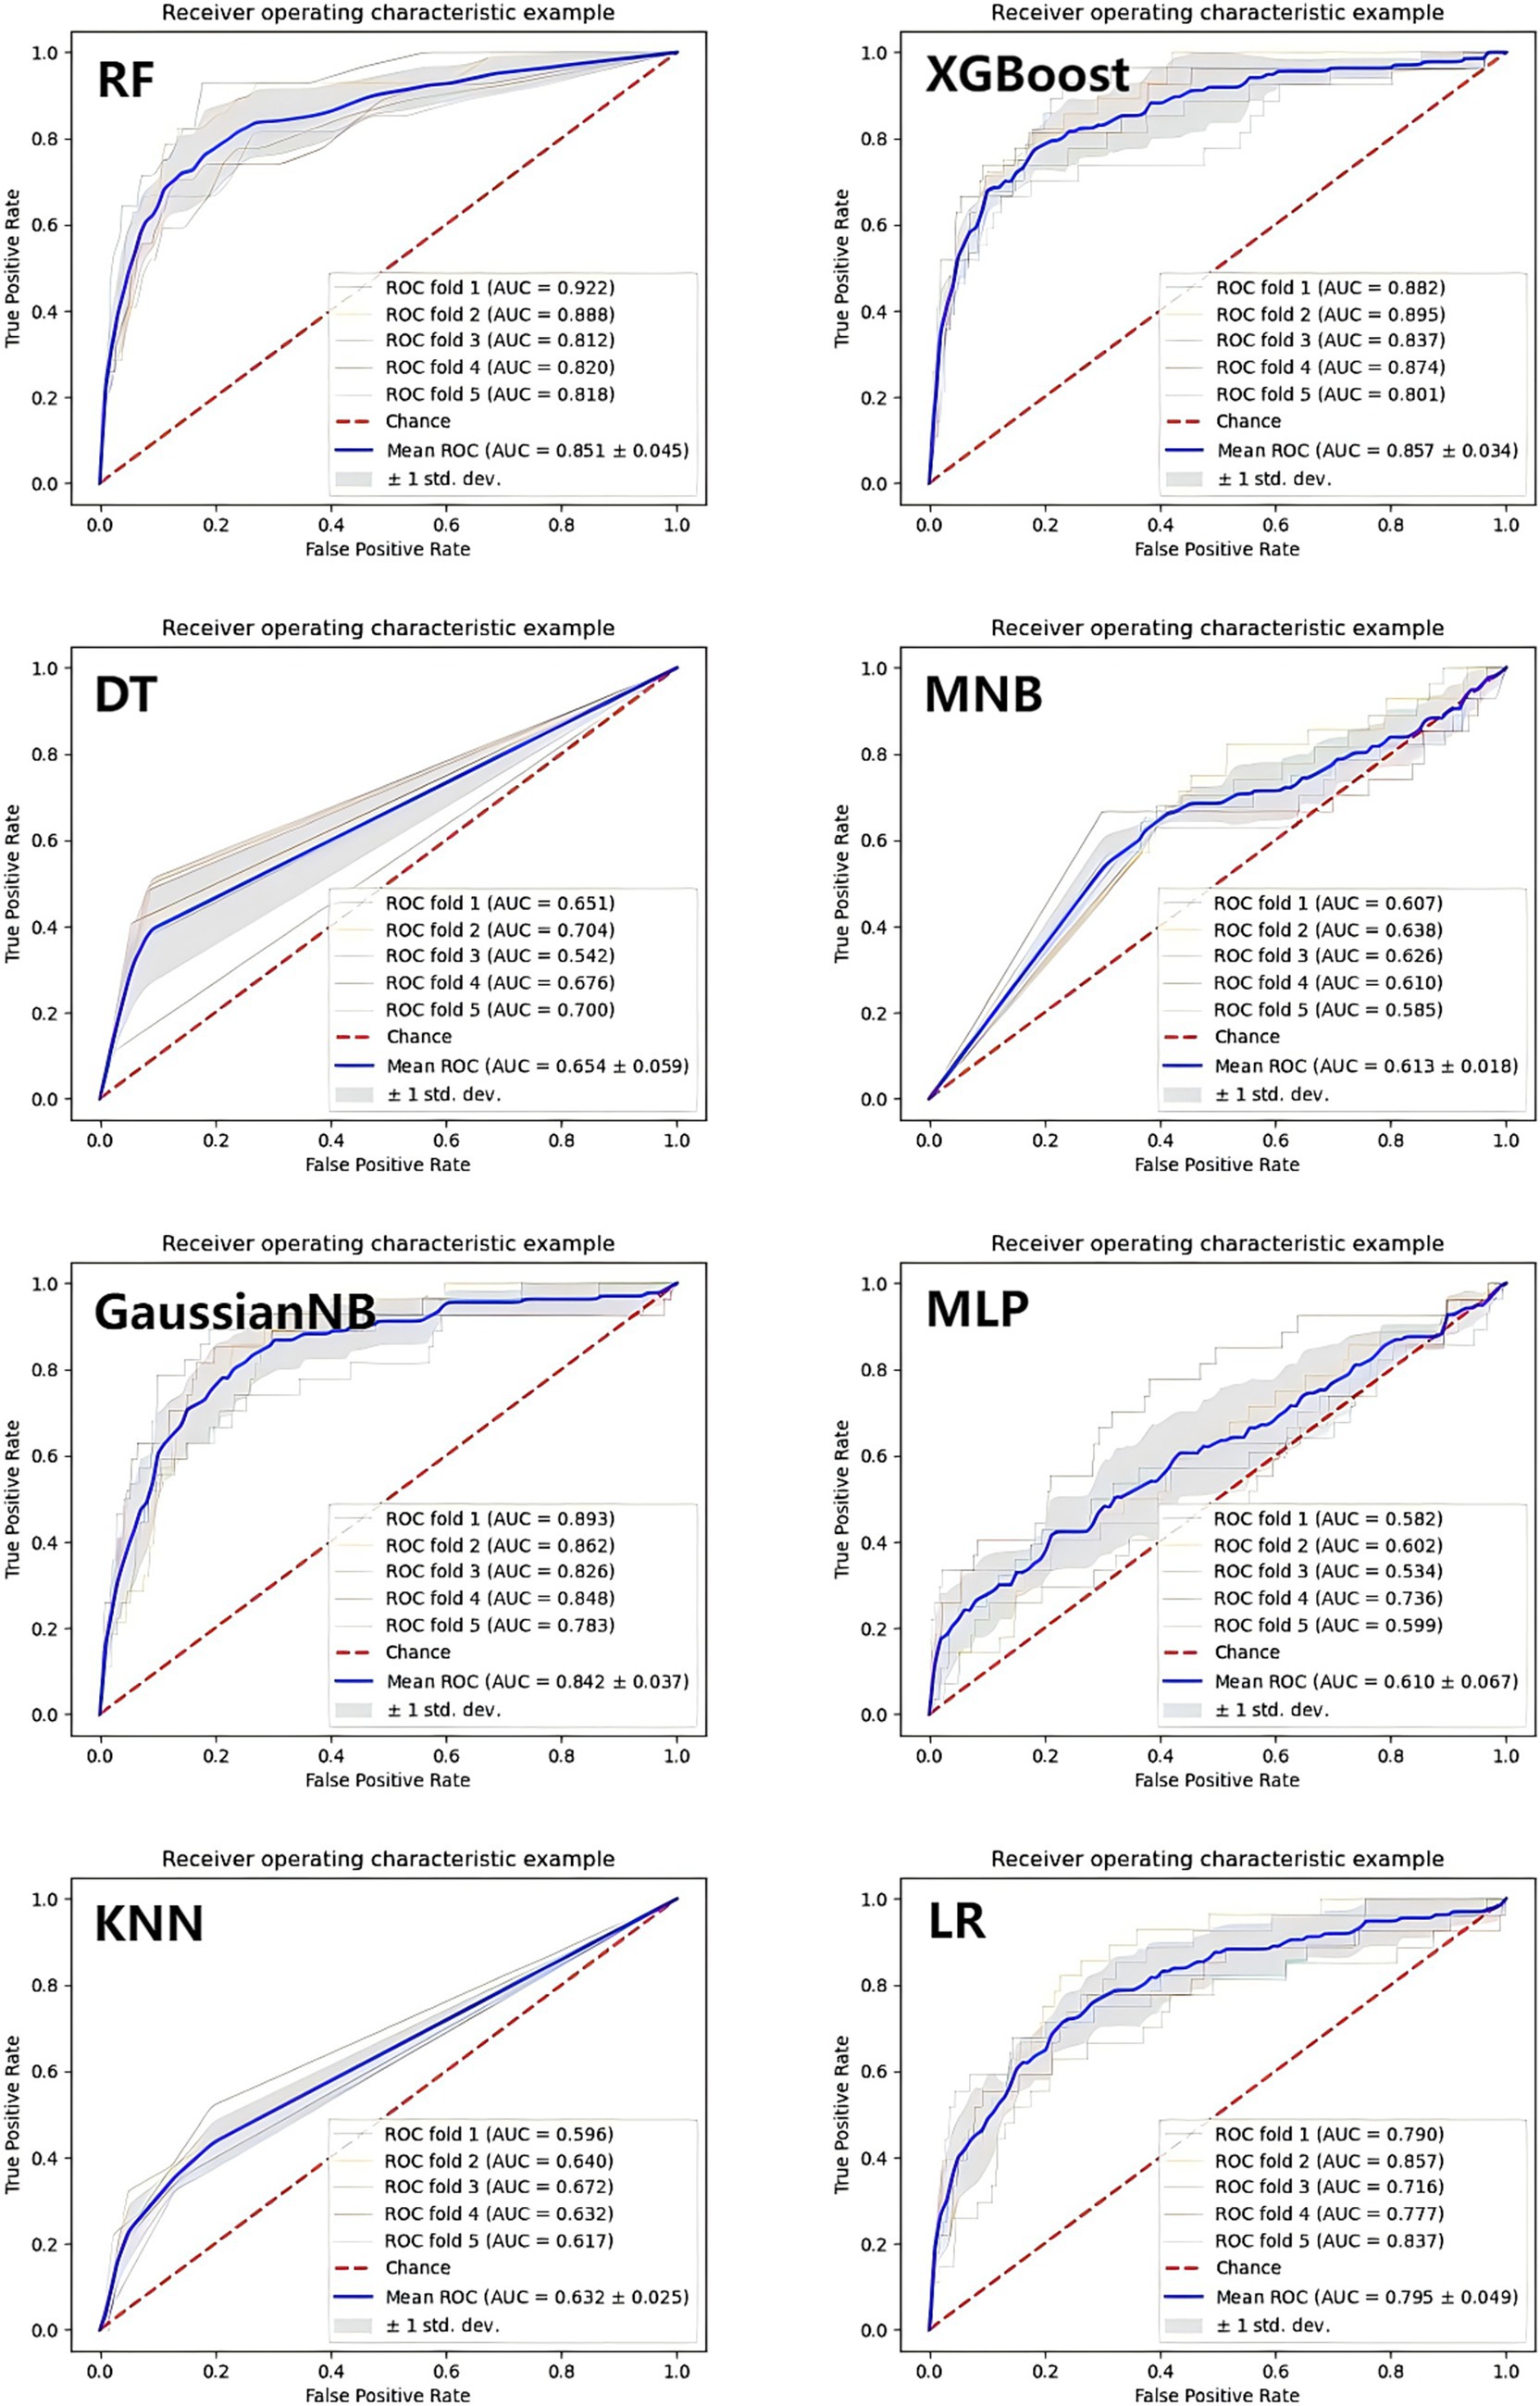
Figure 4. The ROC curves of the machine learning prediction model. XGBoost, eXtreme Gradient Boosting; LR, Logistic Regression; DT, Decision Tree; KNN, K-Nearest Neighbors; GaussianNB, Gaussian Naive Bayes; MultinomialNB, Multinomial Naive Bayes; MLP, Multilayer perceptron; RF, Random Forest.
Interpretability for ML models
In this study, in order to verify the importance of the TyG, the SHAP method was applied to explain the ML models. In the RF model, the results showed that TyG was the second important factor (Figure 5). In addition, TyG was also one of the most important factors in the XGBoost model (Figure 6). In the SHAP method, each point represents a case. The higher the TyG is, the higher the corresponding SHAP value is, and the greater the contribution to the ARDS prediction.
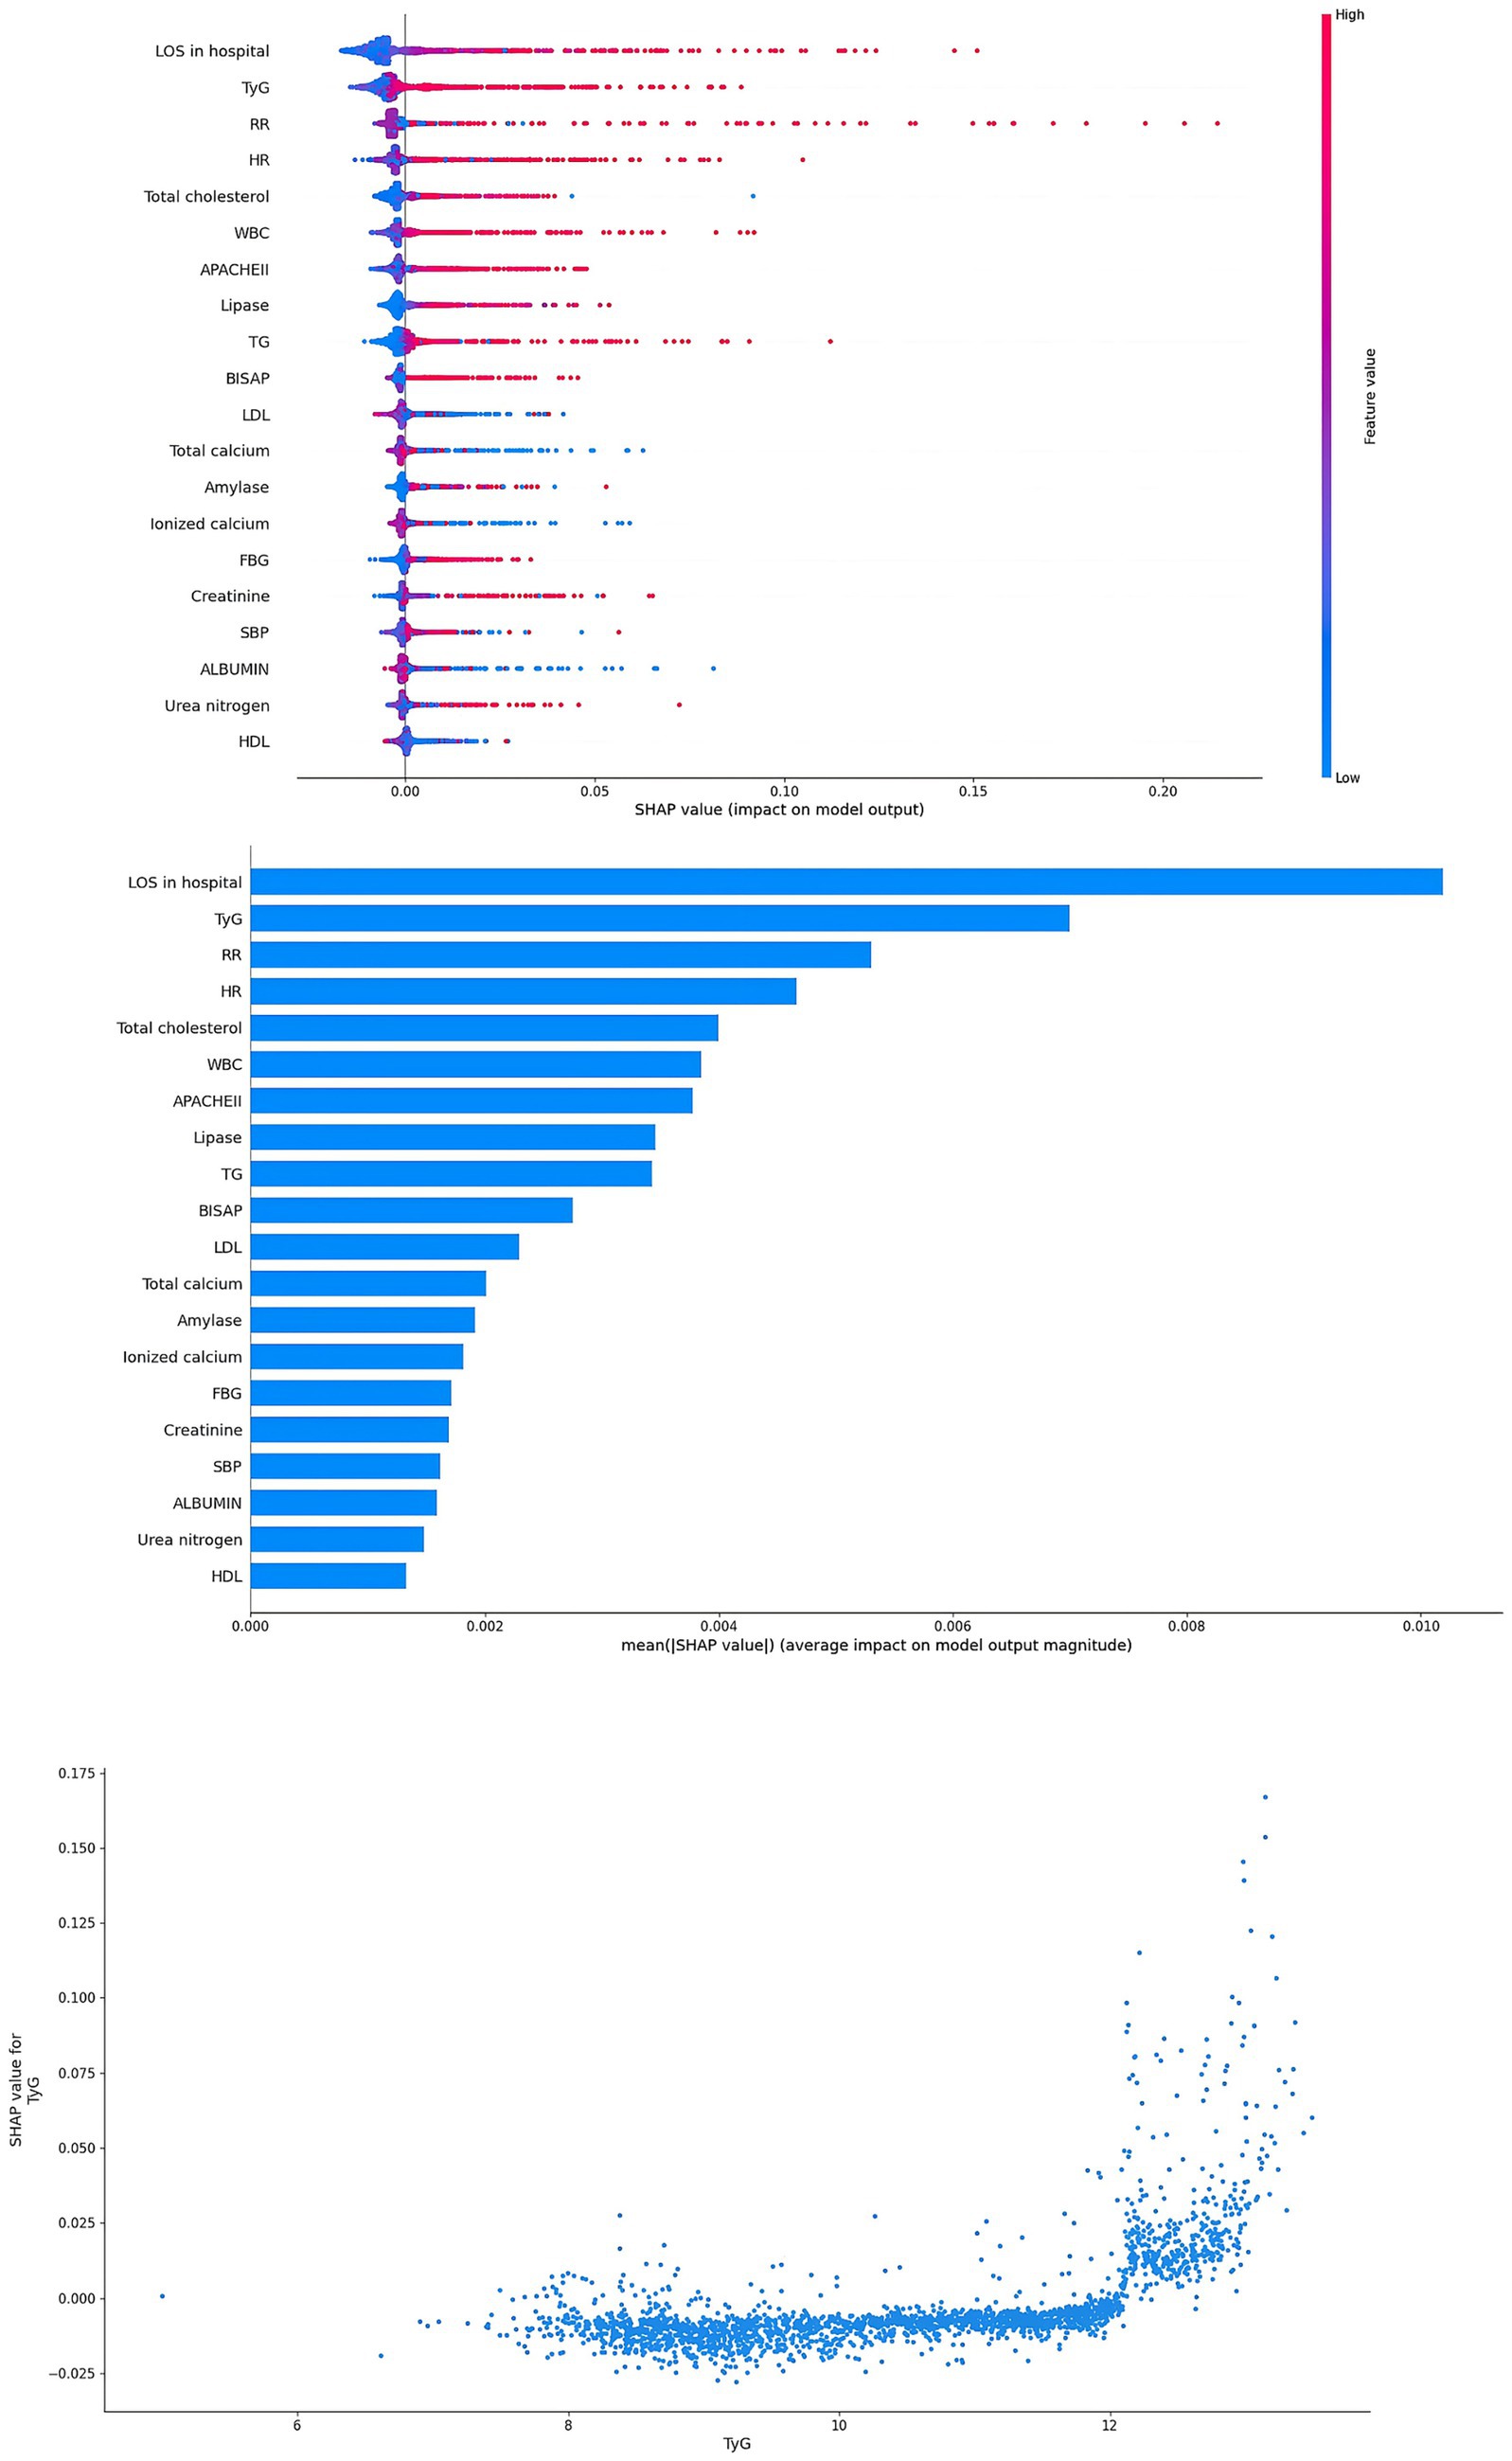
Figure 5. Interpretability for the RF model. TyG index, triglyceride glucose index; SBP, systolic blood pressure; HR, heart rate; RR, respiratory rate; TG, triglyceride; FBG, fasting blood glucose; WBC, white blood cells; HDL, high density lipoprotein; LDL, low density lipoprotein; LOS, length of stay; APACHE, acute physiology and chronic health evaluation; BISAP, bedside index of severity in acute pancreatitis.
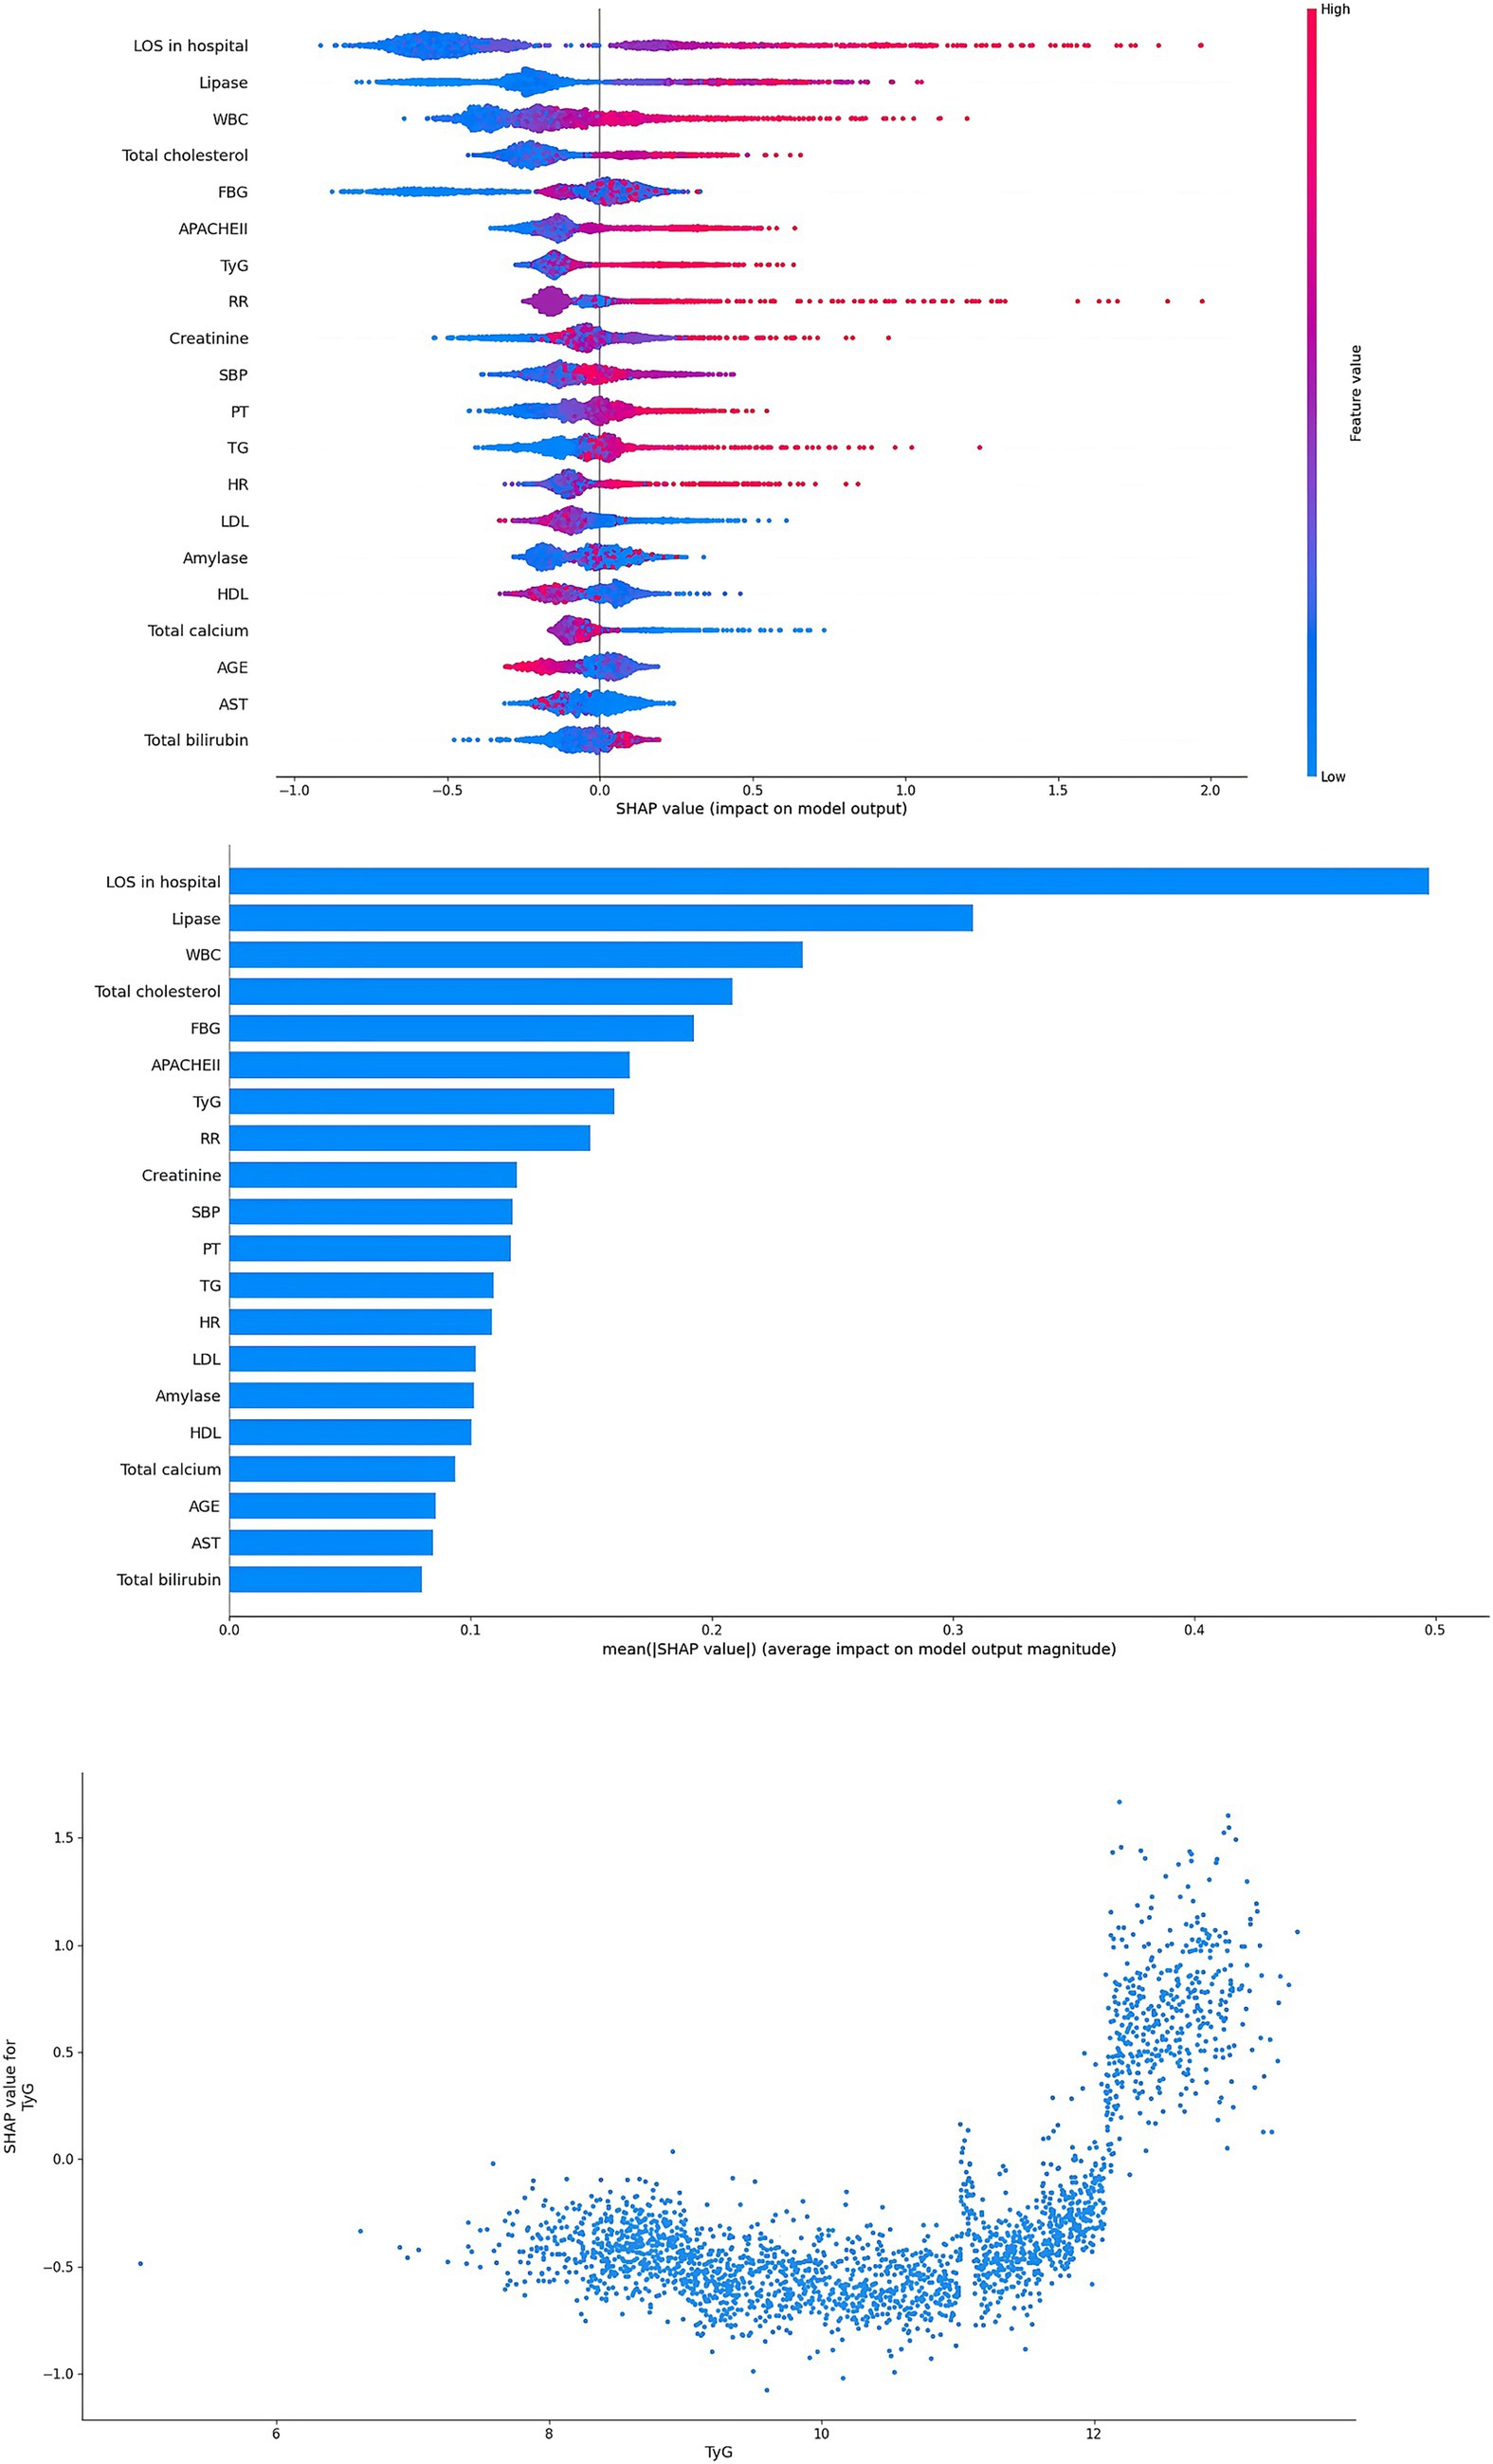
Figure 6. Interpretability for the XGBoost model. Abbreviations: TyG index, triglyceride glucose index; SBP, systolic blood pressure; HR, heart rate; RR, respiratory rate; TG, triglyceride; FBG, fasting blood glucose; WBC, white blood cells; PLT, platelet; PT, prothrombin time; AST, aspartate aminotransferase; LDL, low density lipoprotein; LOS, length of stay; APACHE, acute physiology and chronic health evaluation.
Discussion
Recent epidemiological analysis suggests that the incidence rate of hypertriglyceridemia acute pancreatitis (HTG-AP) is relatively high in China and is increasing year by year (13, 23). Compared with AP related to other etiologies, patients with HTG-AP have a more severe disease severity and a higher risk of life-threatening complications (24). This study included 2,382 patients with acute pancreatitis, of which HTG-AP accounted for 51.81%. In the ARDS group, the proportion of HTG-AP was higher, reaching 71.58%. This is consistent with previous literature. This may be due to the high levels of free fatty acids in HTG-AP patients, leading to fat embolism syndrome, which may result in pulmonary endothelial damage and microcirculation disorders (25).
The univariate analysis showed that a lower total calcium, ionized calcium, and HDL level, as well as a higher HR, RR, DBP, TyG, TG, FBG, WBC, PT, globulin, urea nitrogen, creatinine, amylase, lipase, and total cholesterol at admission were associated with a higher risk of developing ARDS in AP patients. Similar conclusions have been documented in prior studies (8, 26, 27).
AP patients with metabolic abnormalities such as hypertriglyceridemia, diabetes, and low HDL levels have a higher incidence of ARDS, suggesting that insulin resistance (IR) may play a role in the pathogenesis of ARDS. But the underlying mechanisms remain unknown.
IR can cause metabolic disorders, exacerbate oxidative stress in the body, enhance systemic inflammation, disrupt endothelial cell function, and stimulate the proliferation of vascular smooth muscle cells (28). These corresponding pathological changes may lead to ischemia–hypoxia-related damage to lung tissue, resulting in the occurrence and development of ARDS. Therefore, evaluating the IR of AP patients plays an important role in predicting the development of ARDS. The use of IR-related biomarkers, such as HOMA-IR index, cannot achieve accuracy because insulin measurement cannot distinguish between endogenous insulin and therapeutic exogenous insulin (29). Therefore, the TyG index has become a simple, reliable, and effective IR biomarker.
Research has indicated that there was a correlation between the TyG index and the severity of AP disease (13, 30). At the same time, the respiratory system is mainly affected, and ARDS is the most common form of organ failure. Therefore, our aim is to explore the relationship between the TyG index and ARDS in AP patients, with the aim of providing a new biomarker for identifying early ARDS in AP patients and promoting timely clinical management.
Interestingly, our research findings suggest a close and statistically significant association between the TyG index and ARDS in various models, including the crude model, adjusted model I, and model II. In addition, there is a non-linear relationship between them. When the TyG index is higher than 11.31, the incidence rate of ARDS increases significantly, indicating that there is a threshold effect. Previous research reports have shown a non-linear relationship between TyG index and arterial stiffness (31), major adverse cardiovascular events in patients with acute coronary syndrome (32), and the occurrence of acute respiratory failure in patients with AP (3). However, this study reports for the first time a non-linear association between the TyG index and ARDS risk in patients with AP.
In subgroup analysis, a higher incidence of ARDS was observed in men, individuals of lower age, and hypertriglyceridemia. This finding may be related to the higher prevalence of glycolipid metabolism disorders in younger individuals, which is frequently associated with unhealthy lifestyles such as alcohol consumption, physical inactivity, late-night eating, and sleep deprivation. Studies have shown that estrogen can ameliorate IR (33). 17β-Estradiol (E2) has been proven to be a key hormone signal for energy homeostasis, enhancing the adaptability of pancreatic islets to metabolic stress, improving the survival rate of pancreatic islet cells, and enhancing glucose-stimulated insulin biosynthesis and secretion effects. However, androgens may counteract this potential IR effect and benefit (3). This may explain why male AP patients have a higher risk of ARDS.
Our research indicates a significant correlation between the TyG index and the risk of ARDS in AP patients. Therefore, dynamically measuring the TyG index of AP patients can identify the risk of developing ARDS in AP patients at an early stage and intervene in the occurrence and development of ARDS through clinical treatment as early as possible. Of course, our research also has some limitations. First, as a single-center retrospective design study, it cannot establish a clear causal relationship with Ty. Despite conducting multivariate adjustments and subgroup analysis, residual confounding factors may still affect the results. In addition, this study only analyzed baseline TyG index levels and did not consider dynamic changes during hospitalization. Therefore, a larger multicenter prospective cohort design is needed to validate our findings and explore the predictive value of TyG index changes.
Conclusion
TyG index was associated with hospital ARDS in AP patients. The XGBoost and Random Forest models based on the TyG index had the best performance for predicting ARDS in patients with AP. The SHAP method further confirmed that the TyG index serves as a significant predictor for the development of ARDS in patients with acute pancreatitis.
Data availability statement
The raw data supporting the conclusions of this article will be made available by the authors, without undue reservation.
Ethics statement
The studies involving humans were approved by the Clinical Research Ethics Committee of the Changsha Central Hospital (NO.2023–045 KTSB). The studies were conducted in accordance with the local legislation and institutional requirements. The Ethics Committee/Institutional review board waived the requirement of written informed consent for participation from the participants or the participants’ legal guardians/next of kin because Informed consent was waived due to the nature of the retrospective study.
Author contributions
JL: Methodology, Writing – review & editing, Conceptualization, Funding acquisition, Writing – original draft, Formal analysis. ZC: Visualization, Software, Writing – original draft. CG: Writing – original draft, Formal analysis, Supervision, Data curation. YS: Data curation, Software, Writing – review & editing. ND: Investigation, Writing – review & editing, Conceptualization, Funding acquisition, Writing – original draft, Methodology.
Funding
The author(s) declare that financial support was received for the research and/or publication of this article. This work was supported by the National Key Clinical Specialty Scientific Research Project (Z2023047), Scientific Research Project of the Hunan Education Department for Young Scholars (24B0414), and Hunan Provincial Natural Science Foundation (2025JJ80547).
Conflict of interest
The authors declare that the research was conducted in the absence of any commercial or financial relationships that could be construed as a potential conflict of interest.
Generative AI statement
The authors declare that no Gen AI was used in the creation of this manuscript.
Any alternative text (alt text) provided alongside figures in this article has been generated by Frontiers with the support of artificial intelligence and reasonable efforts have been made to ensure accuracy, including review by the authors wherever possible. If you identify any issues, please contact us.
Publisher’s note
All claims expressed in this article are solely those of the authors and do not necessarily represent those of their affiliated organizations, or those of the publisher, the editors and the reviewers. Any product that may be evaluated in this article, or claim that may be made by its manufacturer, is not guaranteed or endorsed by the publisher.
Supplementary material
The Supplementary material for this article can be found online at: https://www.frontiersin.org/articles/10.3389/fnut.2025.1662379/full#supplementary-material
Footnotes
References
1. Yang, AL, and McNabb-Baltar, J. Hypertriglyceridemia and acute pancreatitis. Pancreatology. (2020) 20:795–800. doi: 10.1016/j.pan.2020.06.005
2. Lin, F, Lu, R, Han, D, Fan, Y, Zhang, Y, and Pan, P. A prediction model for acute respiratory distress syndrome among patients with severe acute pancreatitis: a retrospective analysis. Ther Adv Respir Dis. (2022) 16:17534666221122592. doi: 10.1177/17534666221122592
3. Lv, J, Zhou, Y, Tao, C, Cai, Y, Yang, H, Xu, J, et al. Association between the triglyceride glucose index and the risk of acute respiratory failure in patients with acute pancreatitis. BMC Gastroenterol. (2025) 25:182. doi: 10.1186/s12876-025-03771-9
4. Xinyu, X, Jiang, Z, Qing, A, Lihua, L, Xiehong, L, and Lin, Z. Clinical significance of PCT, CRP, IL-6, NLR, and TyG index in early diagnosis and severity assessment of acute pancreatitis: a retrospective analysis. Sci Rep. (2025) 15:2924. doi: 10.1038/s41598-025-86664-x
5. Bang, JY, Wilcox, CM, Arnoletti, JP, and Varadarajulu, S. Superiority of endoscopic interventions over minimally invasive surgery for infected necrotizing pancreatitis: meta-analysis of randomized trials. Dig Endosc. (2020) 32:298–308. doi: 10.1111/den.13470
6. Schepers, NJ, Bakker, OJ, Besselink, MG, Ahmed Ali, U, Bollen, TL, Gooszen, HG, et al. Impact of characteristics of organ failure and infected necrosis on mortality in necrotising pancreatitis. Gut. (2019) 68:1044–51. doi: 10.1136/gutjnl-2017-314657
7. Zou, K, Ren, W, Huang, S, Jiang, J, Xu, H, Zeng, X, et al. The role of artificial neural networks in prediction of severe acute pancreatitis associated acute respiratory distress syndrome: a retrospective study. Medicine. (2023) 102:e34399. doi: 10.1097/MD.0000000000034399
8. Zhang, M, and Pang, M. Early prediction of acute respiratory distress syndrome complicated by acute pancreatitis based on four machine learning models. Clinics. (2023) 78:100215. doi: 10.1016/j.clinsp.2023.100215
9. Shah, J, and Rana, SS. Acute respiratory distress syndrome in acute pancreatitis. Indian J Gastroenterol. (2020) 39:123–32. doi: 10.1007/s12664-020-01016-z
10. Liang, M, He, M, Tang, J, He, X, Liu, Z, Feng, S, et al. Novel risk scoring system for predicting acute respiratory distress syndrome among hospitalized patients with coronavirus disease 2019 in Wuhan, China. BMC Infect Dis. (2020) 20:960. doi: 10.1186/s12879-020-05561-y
11. Li, YL, Zhang, DD, Xiong, YY, Wang, RF, Gao, XM, Gong, H, et al. Development and external validation of models to predict acute respiratory distress syndrome related to severe acute pancreatitis. World J Gastroenterol. (2022) 28:2123–36. doi: 10.3748/wjg.v28.i19.2123
12. Song, LJ, and Xiao, B. Medical imaging for pancreatic diseases: prediction of severe acute pancreatitis complicated with acute respiratory distress syndrome. World J Gastroenterol. (2022) 28:6206–12. doi: 10.3748/wjg.v28.i44.6206
13. Wei, Y, and Guo, J. High triglyceride-glucose index is associated with poor prognosis in patients with acute pancreatitis. Dig Dis Sci. (2023) 68:978–87. doi: 10.1007/s10620-022-07567-9
14. Zhang, L, Li, B, Zhang, D, Wang, Z, Zhao, Y, and Yu, Q. Uridine alleviates LPS-induced ARDS and improves insulin sensitivity by decreasing oxidative stress and inflammatory processes. Physiol Int. (2022) 109:215–29. doi: 10.1556/2060.2022.00169
15. Alvarado, M, Campos-Campos, L, Guerrero-Romero, F, and Simental-Mendía, LE. The triglycerides and glucose index is an independent risk factor for acute respiratory distress syndrome in patients with COVID-19. Metab Syndr Relat Disord. (2024) 22:276–80. doi: 10.1089/met.2023.0247
16. Banks, PA, Bollen, TL, Dervenis, C, Gooszen, HG, Johnson, CD, Sarr, MG, et al. Classification of acute pancreatitis-2012: revision of the Atlanta classification and definitions by international consensus. Gut. (2013) 62:102–11. doi: 10.1136/gutjnl-2012-302779
17. Yang, K, Song, Y, Su, Y, Li, C, and Ding, N. Establishment and validation of an early predictive model for severe acute pancreatitis. J Inflamm Res. (2024) 17:3551–61. doi: 10.2147/JIR.S457199
18. Forsmark, CE, Vege, SS, and Wilcox, CM. Acute pancreatitis. N Engl J Med. (2016) 375:1972–81. doi: 10.1056/NEJMra1505202
19. Chen, WW, Yang, Q, Li, XY, Shi, XL, Pu, N, Lu, GT, et al. Identification of a novel and heterozygous LMF1 nonsense mutation in an acute pancreatitis patient with severe hypertriglyceridemia, severe obesity and heavy smoking. Lipids Health Dis. (2019) 18:68. doi: 10.1186/s12944-019-1012-9
20. Ranieri, VM, Rubenfeld, GD, Thompson, BT, ARDS Definition Task ForceFerguson, ND, Caldwell, E, et al. Acute respiratory distress syndrome: the Berlin definition. JAMA. (2012) 307:2526–33. doi: 10.1001/jama.2012.5669
21. Matthay, MA, Arabi, Y, Arroliga, AC, Bernard, G, Bersten, AD, Brochard, LJ, et al. A new global definition of acute respiratory distress syndrome. Am J Respir Crit Care Med. (2024) 209:37–47. doi: 10.1164/rccm.202303-0558WS
22. Stekhoven, DJ, and Bühlmann, P. Missforest--non-parametric missing value imputation for mixed-type data. Bioinformatics. (2012) 28:112–8. doi: 10.1093/bioinformatics/btr597
23. Mukherjee, R, Nunes, Q, Huang, W, and Sutton, R. Precision medicine for acute pancreatitis: current status and future opportunities. Precis Clin Med. (2019) 2:81–6. doi: 10.1093/pcmedi/pbz010
24. Iqbal, K, Rathore, SS, Jain, NK, Singh, S, Kannappan, M, and Adhikari, R. A case of recurrent acute pancreatitis secondary to hypertriglyceridemia. Cureus. (2022) 14:e24223. doi: 10.7759/cureus.24223
25. Owattanapanich, N, Lewis, M, Biswas, S, Benjamin, ER, and Demetriades, D. Epidemiology and risk factors for fat embolism in isolated lower extremity long bone fractures. Eur J Trauma Emerg Surg. (2024) 50:1775–81. doi: 10.1007/s00068-024-02516-9
26. Ding, N, Guo, C, Song, K, Li, C, Zhou, Y, Yang, G, et al. Nomogram for the prediction of in-hospital incidence of acute respiratory distress syndrome in patients with acute pancreatitis. Am J Med Sci. (2022) 363:322–32. doi: 10.1016/j.amjms.2021.08.009
27. Zhang, W, Zhang, M, Kuang, Z, Huang, Z, Gao, L, and Zhu, J. The risk factors for acute respiratory distress syndrome in patients with severe acute pancreatitis: a retrospective analysis. Medicine. (2021) 100:e23982. doi: 10.1097/MD.0000000000023982
28. Gao, S, Ma, W, Huang, S, Lin, X, and Yu, M. Impact of triglyceride-glucose index on long-term cardiovascular outcomes in patients with myocardial infarction with nonobstructive coronary arteries. Nutr Metab Cardiovasc Dis. (2021) 31:3184–92. doi: 10.1016/j.numecd.2021.07.027
29. Reiterer, M, Rajan, M, Gómez-Banoy, N, Lau, JD, Gomez-Escobar, LG, Ma, L, et al. Hyperglycemia in acute COVID-19 is characterized by insulin resistance and adipose tissue infectivity by SARS-CoV-2. Cell Metab. (2021) 33:2484. doi: 10.1016/j.cmet.2021.10.014
30. Park, JM, Shin, SP, Cho, SK, Lee, JH, Kim, JW, Kang, CD, et al. Triglyceride and glucose (TyG) index is an effective biomarker to identify severe acute pancreatitis. Pancreatology. (2020) 20:1587–91. doi: 10.1016/j.pan.2020.09.018
31. Liu, F, Ling, Q, Xie, S, Xu, Y, Liu, M, Hu, Q, et al. Association between triglyceride glucose index and arterial stiffness and coronary artery calcification: a systematic review and exposure-effect meta-analysis. Cardiovasc Diabetol. (2023) 22:111. doi: 10.1186/s12933-023-01819-2
32. Akbar, MR, Pranata, R, Wibowo, A, Irvan,, Sihite, TA, and Martha, JW. The association between triglyceride-glucose index and major adverse cardiovascular events in patients with acute coronary syndrome - dose-response meta-analysis. Nutr Metab Cardiovasc Dis. (2021) 31:3024–30. doi: 10.1016/j.numecd.2021.08.026
Keywords: triglyceride-glucose index, ARDS, acute pancreatitis, machine learning, prognosis
Citation: Luo J, Chen Z, Guo C, Su Y and Ding N (2025) Triglyceride–glucose index as a key predictor of ARDS in acute pancreatitis: SHAP analysis reveals its critical role in risk stratification. Front. Nutr. 12:1662379. doi: 10.3389/fnut.2025.1662379
Edited by:
Qiang Tang, Zhejiang University, ChinaReviewed by:
Chen Yuan, Jiangxi Cancer Hospital, ChinaXu Zhang, Third Affiliated Hospital of Sun Yat-sen University, China
Copyright © 2025 Luo, Chen, Guo, Su and Ding. This is an open-access article distributed under the terms of the Creative Commons Attribution License (CC BY). The use, distribution or reproduction in other forums is permitted, provided the original author(s) and the copyright owner(s) are credited and that the original publication in this journal is cited, in accordance with accepted academic practice. No use, distribution or reproduction is permitted which does not comply with these terms.
*Correspondence: Yingjie Su, ZG9jdG9yc3V5aW5namllQHNpbmEuY29t; Ning Ding, ZG9jdG9yZGluZ25pbmdAc2luYS5jb20=; ZG9jdG9yZGluZ25pbmdAMTYzLmNvbQ==
†These authors have contributed equally to this work
‡ORCID: Ning Ding, orcid.org/0000-0001-7805-2191