 Jingxuan Huang
 Lingyu Zhang
 Qirui Jiang
 Shichan Wang
 Yi Xiao
 Ningning Che
 Junyu Lin
 Bi Zhao
 Yangfan Cheng
 Chunyu Li
 Huifang Shang*†
- Laboratory of Neurodegenerative Disorders, Department of Neurology, Rare Diseases Center, West China Hospital, Sichuan University, Chengdu, China
Background: Serum total cholesterol (TC) is associated with the risk of multiple system atrophy (MSA). However, the potential impact of the serum TC levels on the mortality of patients with MSA remains to be elucidated. The study aims to clarify the association between baseline level of serum TC and survival of patients with early MSA.
Methods: A total of 364 patients with MSA were recruited and assessed at baseline and follow-up. Patients with MSA were stratified into three groups based on the serum TC tertiles. The role of serum TC on survival was analyzed using Kaplan–Meier survival analysis and Cox regression models. Restricted Cubic Spline regression was employed to investigate the non-linear relationship between serum TC levels and survival.
Results: During a median follow-up period of 4.75 years, the survival duration of patients with MSA was shorter in the lowest serum TC group compared to the other two groups (Log-rank p = 0.004). In the multivariable Cox regression model, individuals in the intermediate serum TC group demonstrated a reduced mortality compared to those in the lowest group (HR: 0.47; 95% CIs: 0.23–0.96). There was a non-linear relationship between serum TC level and survival with the lowest risk of death at the value of 4.38 mmol/L.
Conclusion: Serum TC level at baseline negatively correlated with survival of patients with MSA. Serum TC emerges as a significant predictor of mortality in patients with early-stage MSA.
Background
Multiple system atrophy (MSA) is an adult-onset α-synucleinopathy characterized by a poor prognosis (1, 2). The disease progresses rapidly, with patients requiring walking aids within 3 years, transitioning to wheelchair dependence after 5 years, and becoming bedridden within 6 ~ 8 years (3, 4). The median survival time of patients with MSA varies from 6 to 10 years, depending on region and ethnicity (5–7). The pathophysiology of MSA is obscure even though glial cytoplasmic inclusions (GCIs) were regarded as the histopathological hallmark of MSA (8). Therefore, it is necessary to identify early-stage prognostic factors for MSA to elucidate the pathophysiological mechanisms and to explore potential pharmacological interventions in the future.
Cholesterol, an indispensable component of cellular membranes in mammalian cells, has been implicated in various neurodegenerative diseases, including Alzheimer’s disease (AD) (9, 10), Parkinson’s disease (PD) (11, 12), etc. Given that the pathology of MSA primarily affects oligodendrocytes, which are rich in membranes that form the myelin sheath, it is hypothesized that cholesterol may play a significant role in MSA. Furthermore, patients with MSA have been observed to exhibit abnormal serum total cholesterol (TC) levels (13). Some cross-sectional studies suggest that serum TC may serve as a risk factor for MSA (13, 14). Besides, serum TC levels have been associated with critical symptoms such as orthostatic hypotension (OH) in MSA (15).
To date, several cohorts have investigated various predictors of survival in MSA, including neurofilament light chain levels (16), neutrophil-to-lymphocyte ratio (17), and nutritional status (18), etc. However, longitudinal studies examining the predictive value of serum TC on prognosis of MSA are lacking. Therefore, the present study aims to explore the relationship between levels of serum TC at baseline and survival in early stage of patients with MSA.
Methods
Study participants and design
This is a prospective, single-center observational study conducted in West China Hospital of Sichuan University from January 2012 to June 2022. Patients with MSA were continuously screened, and early stage of MSA with disease duration less than 3 years was identified. Baseline exclusion criteria included patients with other neurological disorders (such as severe stroke, traumatic brain injury, epilepsy, leukoencephalopathy, brain tumors, etc.), severe liver and kidney function impairment. Besides, all patients had no family history and spinocerebellar ataxia (SCA) genes, including SCA-1, 2, 3, 6, and 7. With regular follow-up, a total of 508 patients with complete hematological information included at baseline. During follow-up appointment, 70 patients with possible MSA, 3 patients with PD, and 2 with progressive supranuclear palsy were excluded. Besides, 69 patients were lost to follow-up. At last, the data at baseline and follow-up of 364 patients with probable MSA were included in the final analysis (19). All patients signed informed consent, and the study was approved by the Ethics Committee of West China Hospital of Sichuan University.
Baseline indicators measurements assessment
At baseline and follow-up, experienced neurologists collected basic data, including age, sex, body mass index (BMI), smoking and drinking history, etc. and clinical information, including disease duration, age of onset, etc. BMI was calculated by weight (kg)/height2 (m). The severity and progression of MSA were evaluated by the Unified Multiple System Atrophy Rating Scale (UMSARS) score with part I to part IV, representing 4 aspects (activities of daily living, motor examination, autonomic examination, and global disability, respectively). The total UMSARS score was calculated by the sum of UMSARS-I and -II scores (20). Orthostatic hypertension (OH) was defined as a reduction of systolic blood pressure (SBP) ≥ 20 mmHg and/or of diastolic blood pressure (DBP) ≥ 10 mmHg within 10 min orthostatic test (21). Symptom onset was recorded as the date of initial presentation of any symptom, including motor and autonomic features (except for erectile dysfunction). Disease duration was considered as the course of the time of symptom onset to assessment. Survival time was defined as the interval between the symptom onset and the date of death, otherwise the interval between the symptom onset and the date of the last follow-up appointment of the surviving patients. MSA-P refers to patients with predominant parkinsonism, and MSA-C refers to predominant cerebellar ataxia (18). Among the comorbidities, diabetes was defined as patients meeting one of the following criteria: (1) having been diagnosed with diabetes or taking hypoglycemic drugs, (2) glycated hemoglobin (HbA1c ≥ 6.5%), and (3) fasting blood glucose (FBG) ≥ 7.0 mmol/L. Patients with hypertension is considered as one of the followings: (1) having been diagnosed with hypertension or taking antihypertensive drugs, (2) SBP ≥ 140 mmHg or DBP ≥ 90 mmHg. Baseline serum TC referred to the levels of serum TC at the time of the patient’s first visit. Fasting venous blood was collected from patients in the early morning following admission to analyze the levels of serum TC and other serological parameters by standard laboratory methods.
Statistical analysis
Descriptive data were presented in the form of mean ± standard deviation or frequencies (percentage). In the comparison between surviving and deceased patients with MSA, Student’s t-test or Wilcoxon rank sum test were used for continuous variables, and Chi-square test or Fisher exact test for categorical variables. According to the distribution of serum TC levels at baseline in patients with MSA, levels of serum TC were further classified into three groups, and the lowest tertile group was defined as the reference group. An analysis of variance (ANOVA) test or Kruskal-Wallis’s test was used to compare continuous variables between different groups regarding the level of serum TC, as appropriate. The cumulative event rates and survival were analyzed by Kaplan–Meier curve, and the Kaplan–Meier hazard ratios (HRs) were evaluated by log-rank test. Cox proportional hazard regression model was used to analyze the relationship between levels of serum TC and survival. In the multivariate Cox proportional hazards regression model, covariates were selected for regression model correction according to clinical significance. These results were presented in HRs with 95% confidence intervals (CIs). The nonlinear relationship between TC and survival was tested by Cox regression model with Restricted Cubic Spline (RCS) regression, with 5-knot fitting correlation was applied. Based on the RCS Cox model, we generated a predicted risk score for each patient and evaluated the accuracy for survival outcomes at different time points using time-dependent receiver operating characteristic (ROC) curves. Subgroup analysis was conducted to analyze the association between TC and survival as a continuous variable in the groups of age (≤60 and >60 years), sex, BMI (<18.5, 18.5 ~ 23.9, >23.9 kg/m2), MSA subtypes (parkinsonian and cerebellar, abbreviated as MSA-P and MSA-C), diabetes, and hypertension. Statistical analyses were performed with SPSS (version 25.0) and R software (version 4.2.2), along with MSTATA software.1 All p-values were 2-tailed, and the statistical significance was set at <0.05.
Results
Clinical and hematological characteristics between different groups of serum TC at baseline
We subsequently divided patients with MSA into three groups according to serum TC tertiles (Q1, <3.91 mmol/L; Q2, 3.91 ~ 4.75 mmol/L; Q3, >4.75 mmol/L). As shown in Table 1, 183 (50.27%) patients were female, and 191 (54.27%) patients were MSA-C subtypes. The mean age and age of onset at baseline were 60.05 ± 8.52 and 58.39 ± 8.49 years, respectively. The mean disease duration at baseline was 1.66 ± 0.77 years. There were no significant differences in subtypes, age, age of onset, BMI, disease duration, score of UMSARS-II, score of UMSARS-IV, total UMSARS score, OH, smoking and drinking status between three groups according to the serum TC tertiles. Of note, the group 1 (Q1, <3.91 mmol/L) had lower proportion of female (43, 34.68% vs. 70, 59.83% vs. 70, 56.91%, p < 0.001), higher UMSARS-I score (14.83 ± 6.86 vs. 13.40 ± 6.39 vs. 12.32 ± 6.18, p = 0.010) and higher proportion of comorbidity of diabetes (29, 23.39% vs. 14, 11.97% vs. 13, 10.57%, p = 0.019). In the hematological characteristics (Table 2), we found that the group 1 (Q1, <3.91 mmol/L) had lower levels of albumin and other lipid markers (TG, HDL-C, and LDL-C). We failed to find the association between serum TC levels and other hematological index in this cohort.
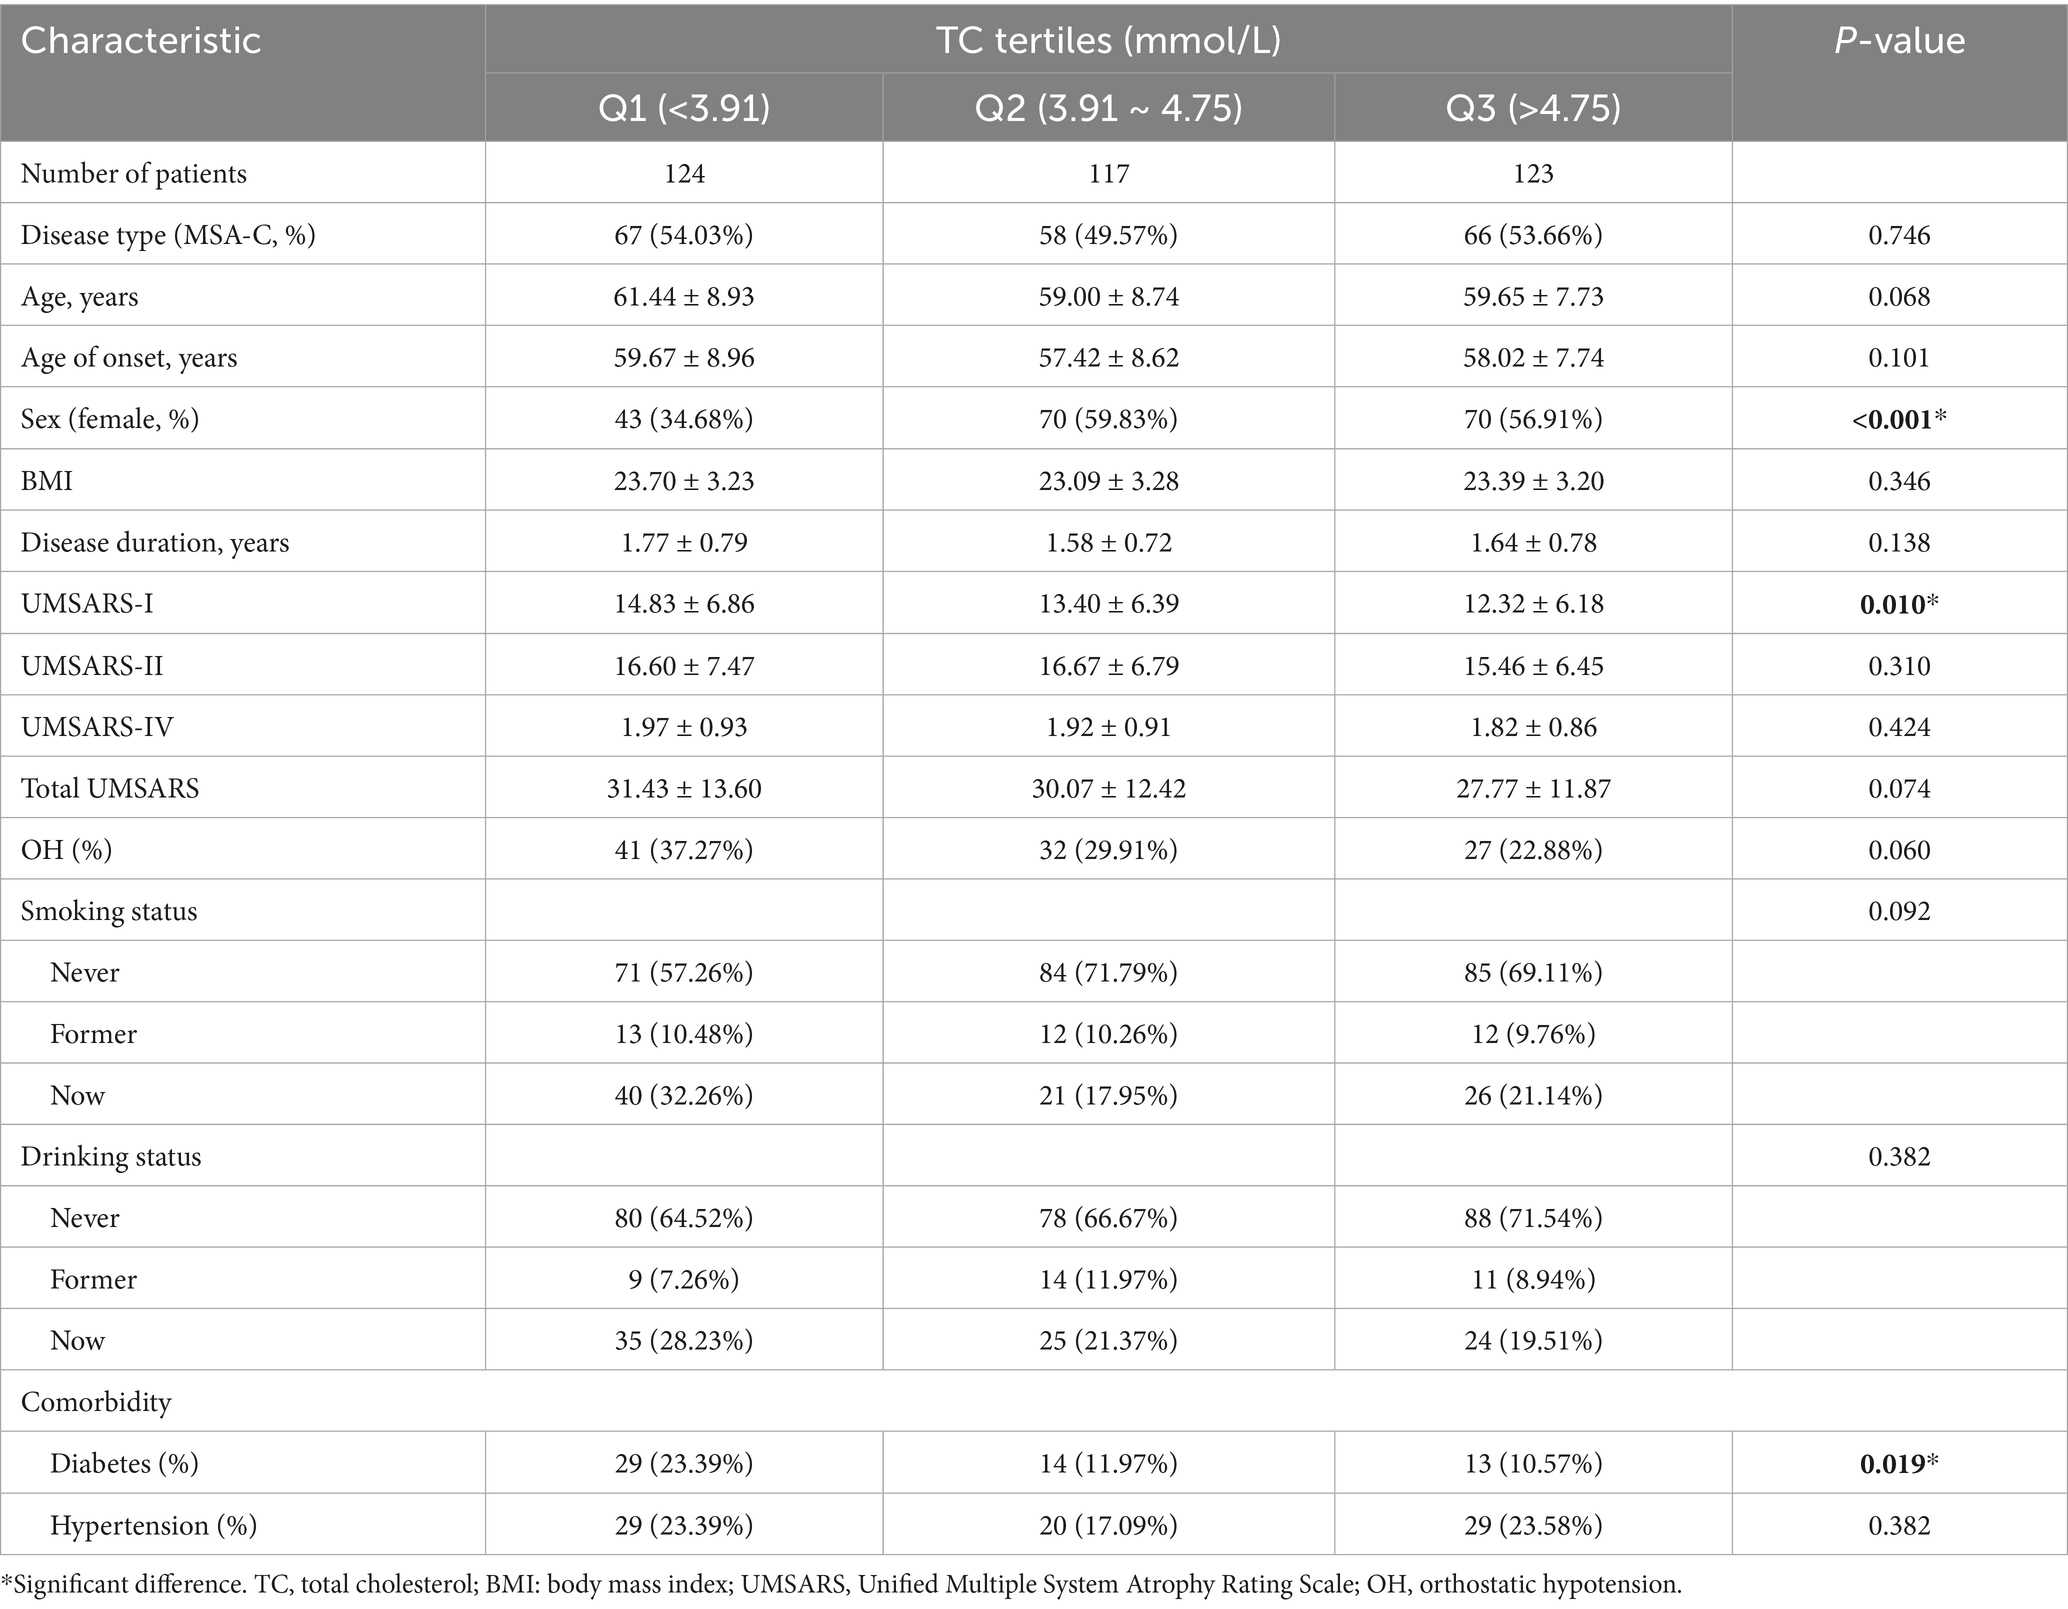
Table 1. Baseline demographics in patients with MSA stratified by serum TC tertiles.
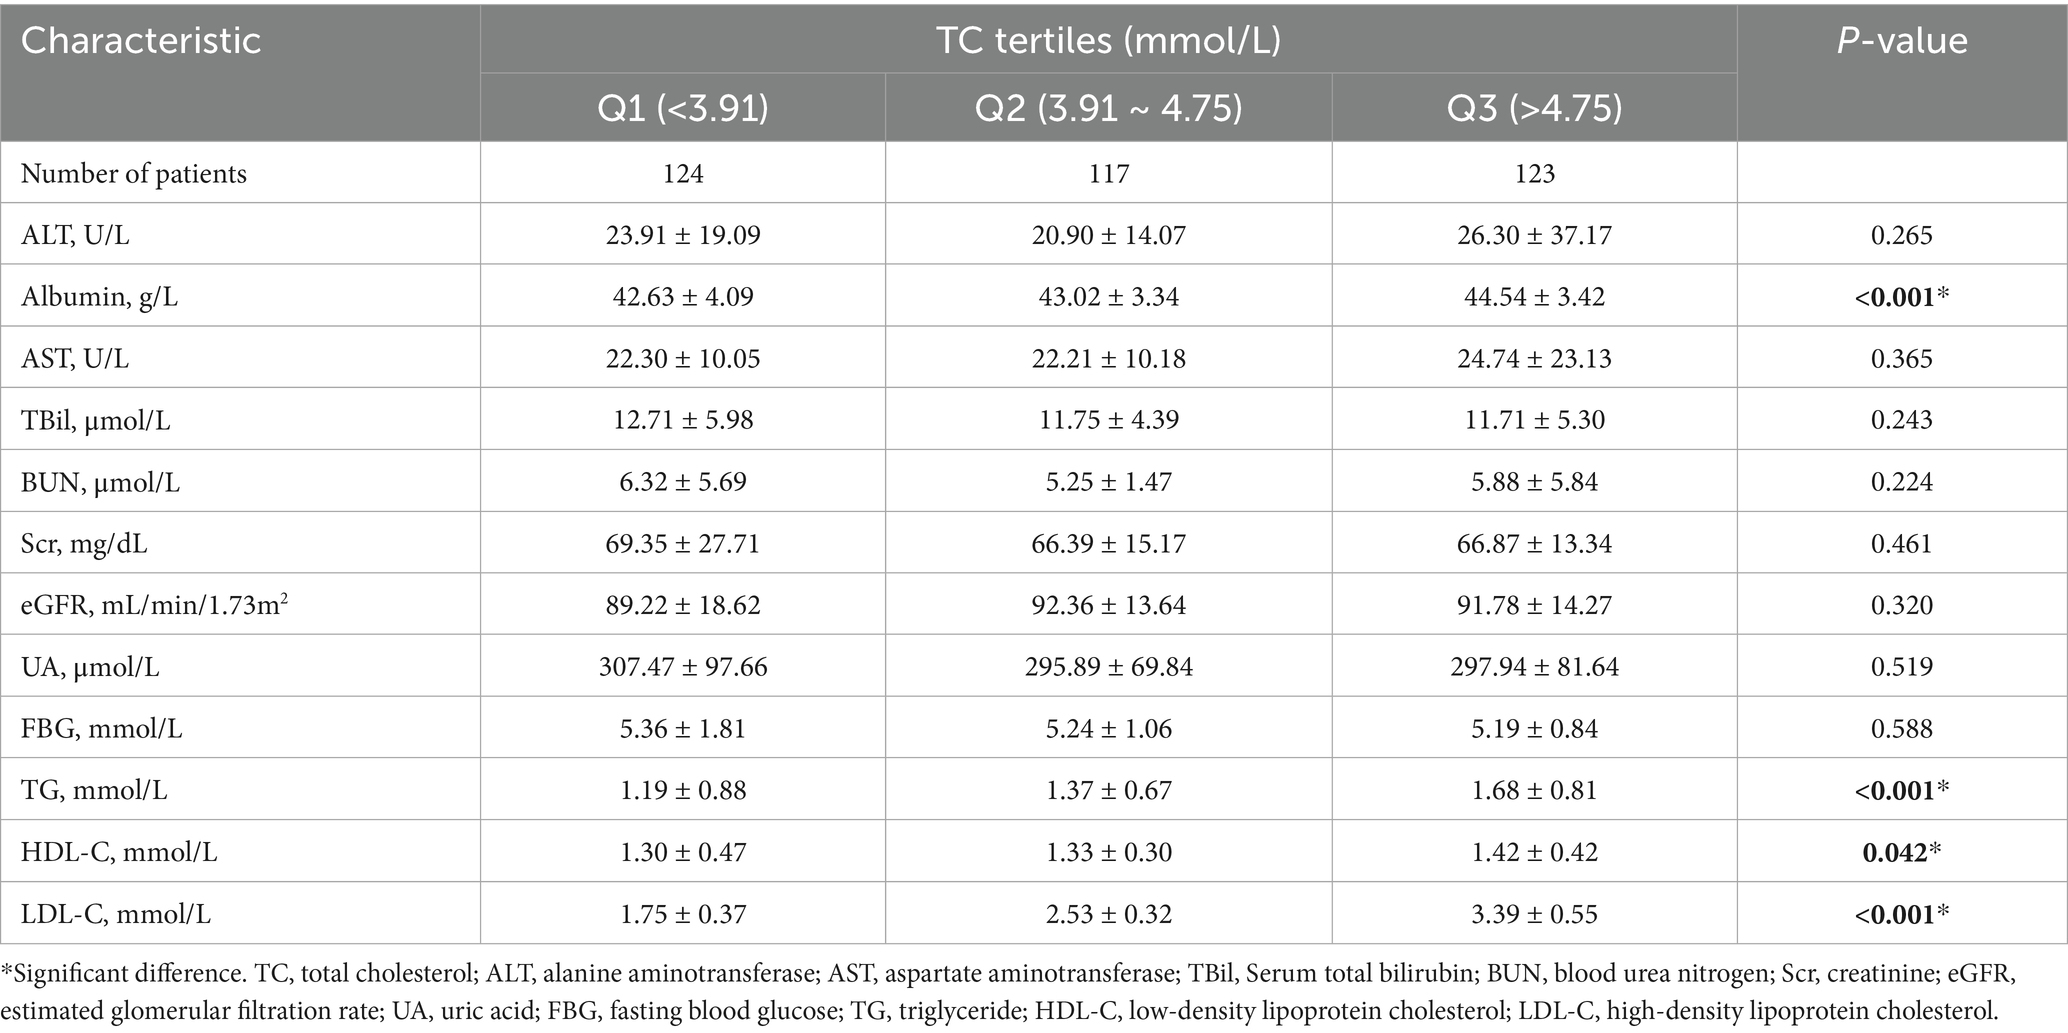
Table 2. Baseline hematological characteristics in patients with MSA stratified by TC tertiles.
Survival analysis and predictive ability of serum TC in patients with MSA
Kaplan–Meier survival analysis was used to analyze the relationship between serum lipid levels and survival. As mentioned above, we divided patients with MSA into three groups according to the distribution of serum TC. The survival duration was significantly different among the three groups of TC (Log-rank p = 0.004) (Figure 1A). According to the tertiles of TC, the survival duration of patients in group 1 (the lowest group of serum TC level) was shorter than those in group 2 (the intermediate group of serum TC level) (mean survival time: 6.2 vs. 7.6 years, log-rank p = 0.012) and group 3 (the highest group of serum TC level) (mean survival time: 6.2 vs. 7.2 years, log-rank p = 0.025). The unadjusted Cox analysis demonstrated significantly decreased risk of mortality across increasing TC [HRs and 95% CIs: 0.70, (0.57–0.86), p < 0.001] (Supplementary Figure 1). Although multivariate Cox analysis using TC as a continuous variable revealed no significant association with survival (Supplementary Figure 1), analysis using TC as a categorical variable demonstrated that the level of TC in group 2 decreased the risk of mortality of patients with MSA compared to the level of TC in group 1, after adjusting for age, sex, subtype, BMI, disease duration, total UMSARS score, OH, diabetes, hypertension, albumin, TG, HDL-C and LDL-C (HRs and 95% CIs of group 2: 0.47, [0.23–0.96]; group 1 for reference; p = 0.038). Additionally, after adjusting for age, sex, subtype, BMI, disease duration, total UMSARS score, OH, diabetes, hypertension, albumin, TG, HDL-C and LDL-C, the RCS analysis showed a non-linear relationship between serum TC level and survival with the lowest risk of death at the value of 4.38 mmol/L (Figure 1B). According to the predicted risk score, the time-dependent ROC analysis revealed discriminatory performance in various time points, with area under the curve (AUC) values of 0.852 (95% CI: 0.525–0.999) at 3 years, 0.861 (95% CI: 0.777–0.946) at 4 years, 0.791 (95% CI: 0.721–0.861) at 5 years, 0.771 (95% CI: 0.711–0.830) at 6 years, 0.863 (95% CI: 0.818–0.907) at 7 years (Figure 1C). This indicates that the model incorporating the nonlinear effect of serum TC effectively predicted mortality in MSA (Table 3).
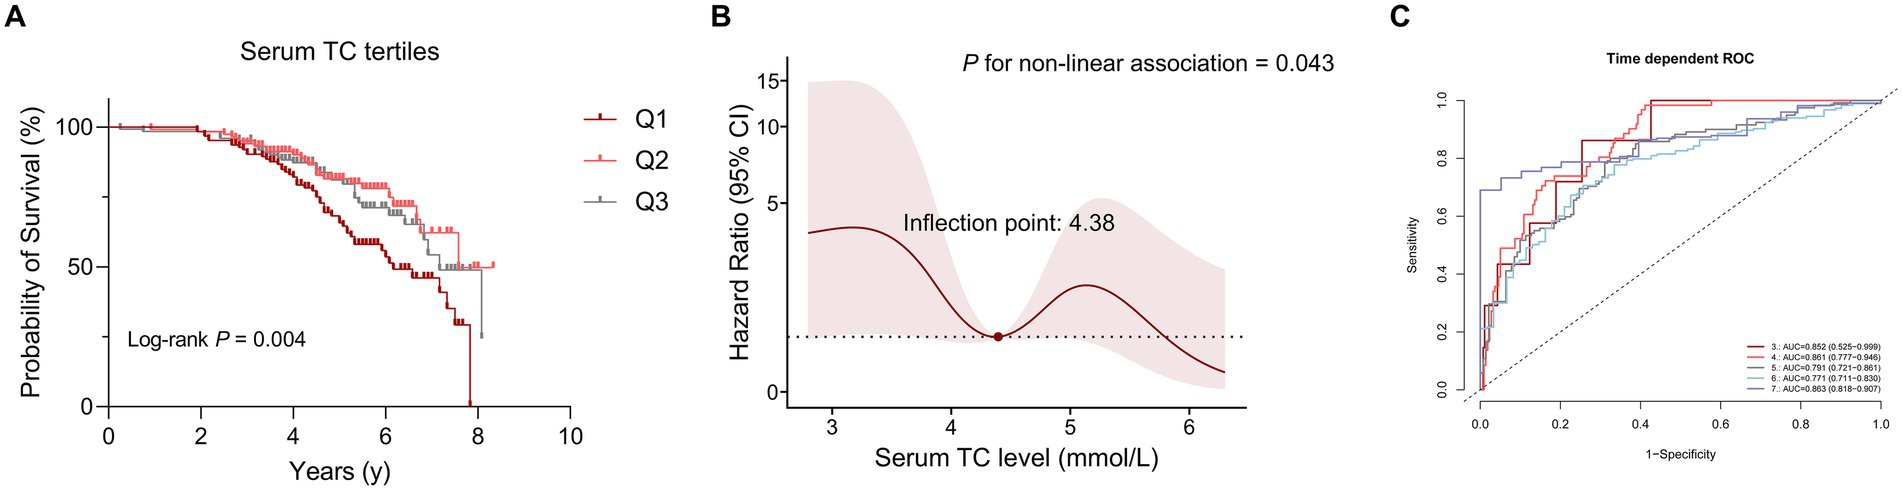
Figure 1. The correlation between serum total cholesterol (TC) levels and survival in patients with multiple system atrophy (MSA). (A) Comparison of survival between the three groups according to serum TC tertiles. (B) Association between serum TC (mmol/L) and survival using a multivariable-adjusted Restricted Cubic Spline (RCS) model. (C) Time-dependent receiver operating characteristic (ROC) curves in predicting MSA mortality using RCS models.
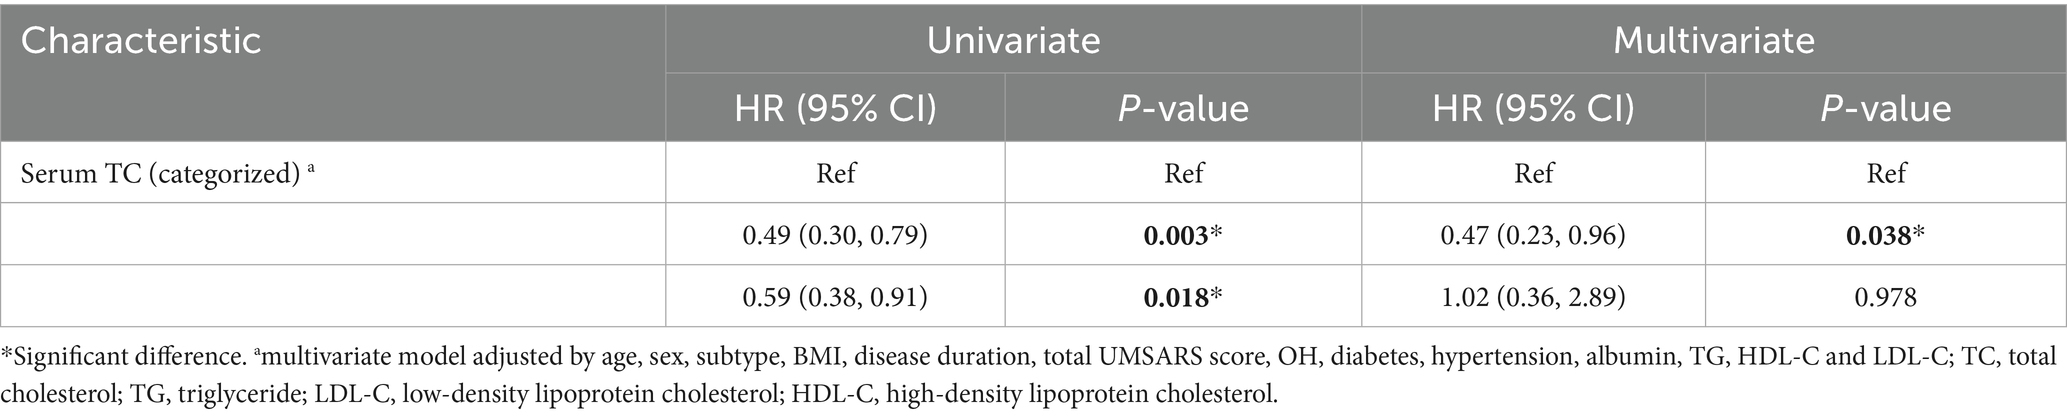
Table 3. Univariate and multivariate Cox proportional-hazards regression analyses for survival according to serum TC level.
Subgroup analysis
The stratified analyses of the predictive level of serum TC (continuous) on the mortality in patients with MSA according to age, sex, BMI, MSA subtype, diabetes, and hypertension. A negative correlation between TC and mortality were detected among patients older than 60 years [HRs and 95% CIs: 0.73, (0.55–0.97), p = 0.003], those with normal BMI [HRs and 95% CIs: 0.64, (0.48–0.85), p = 0.002], MSA-C [HRs and 95% CIs: 0.71, (0.53–0.94), p = 0.018], without hypertension [HRs and 95% CIs: 0.71, (0.56–0.93), p = 0.011] or diabetes [HRs and 95% CIs: 0.72, (0.56–0.92), p = 0.003]. In the subgroup analysis, the effect of serum TC levels on mortality of patients with MSA was consistent in these subgroups (Figure 2).
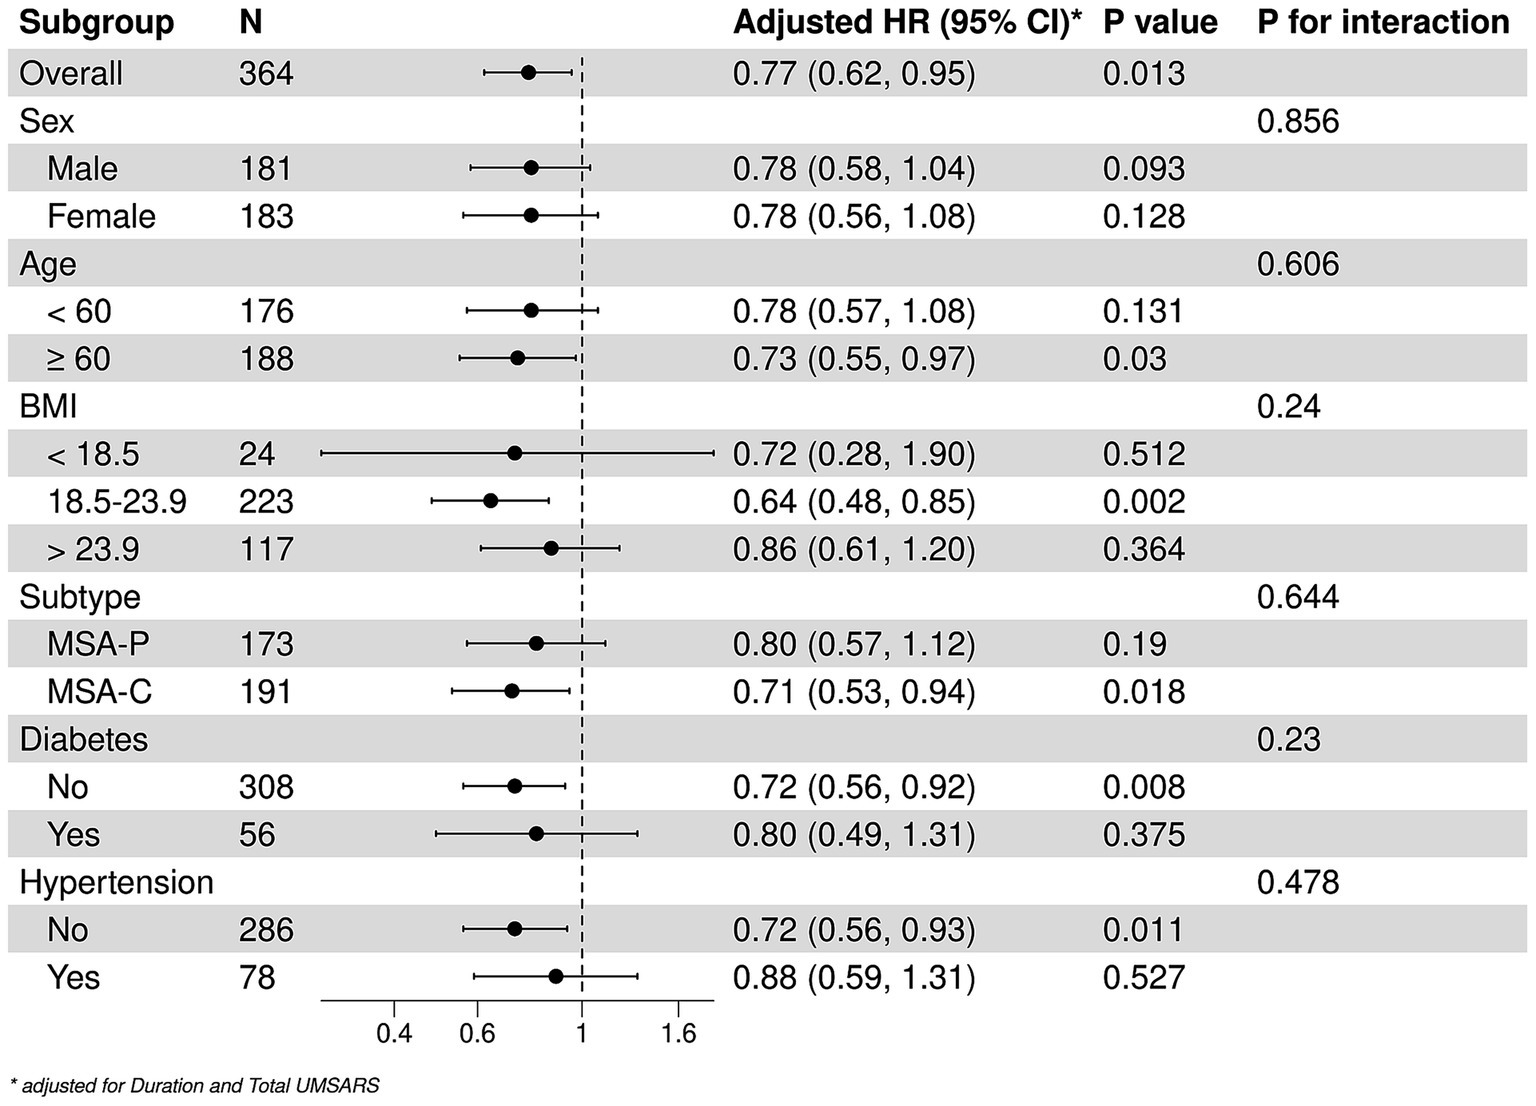
Figure 2. Stratified analysis of the associations between serum TC and survival. *Adjusted by disease duration and total UMSARS scores.
Discussion
This study explored the relationship between serum TC and survival of patients with MSA in the early stages. Our findings indicated that the serum TC was a significant factor to impact the survival of patients with MSA. Patients with lower levels of serum TC had greater risk of mortality compared to those with higher level of serum TC. Moreover, the RCS model suggested that the serum TC value of 4.38 mmol/L was the threshold for the lower risk of mortality of patients with MSA. A negative trend was observed in the mortality of patients with MSA as the level of serum TC lower than 4.38 mmol/L. The risk score from RCS Cox model also demonstrated an effective prediction in mortality over years.
Our cohort study firstly explored the prognostic implications of serum TC levels in patients with MSA in the early stage. Given that elevated serum TC is associated with vascular risk factors, we propose that maintaining serum TC levels lower than 5.0 mmol/L may represent a more beneficial lifestyle for patients with MSA. Our previous cohort and other cross-sectional studies demonstrated that serum TC levels were lower in patients with MSA than in healthy controls, suggesting that reduced serum TC levels increase the risk of MSA (13, 14). In addition, subgroup analyses revealed that in patients with MSA over the age of 60 years, the serum TC levels were correlated with survival. Previous studies have indicated that lipid metabolism disorders with the changes of TC levels, occur with aging in healthy elderly populations (22). It has been observed that serum TC levels tend to decline in individuals over 60 years old (23, 24). Consequently, we speculated that the low serum TC levels may exacerbate the pathophysiological mechanisms associated with aging, thereby worsening the progression of MSA. We did not identify the relationship between the serum TC levels and survival in patients with MSA who were classified as overweight or underweight. Notably, patients with a high BMI exhibited a greater prevalence of dyslipidemia, while low body weight group with worse nutritional status. These factors may influence the relationship between serum TC and survival in these two groups of MSA. Additionally, we observed a significant negative correlation between the level of serum TC levels and mortality in patients with MSA-C. Serum TC levels were also negatively correlated with the risk of OH in patients with MSA (15). These findings suggested that cerebellar pathophysiology and autonomic nervous system dysfunction may be particularly vulnerable to the disturbances in serum lipid levels, especially the serum TC (25).
Cholesterol serves as a critical component of cytoplasmic membranes, including the myelin sheath within the central nervous system (26). Given that α-synuclein aggregates with oligodendrocyte involvement as the main pathological feature of MSA (27), disruptions of cholesterol synthesis and metabolism may influence the abnormal development of oligodendrocytes and the formation of myelin (28–30). Current research suggests that deficiencies in the myelin sheath are associated with α-synuclein aggregation (31, 32). In addition, phosphatidylcholine, which predominantly composed of cholesterol, interacts with α-synuclein monomers, facilitating the formation and stabilization of toxic α-synuclein oligomers (33). Notably, knockout specific upstream genes responsible for cholesterol production in oligodendrocytes in vivo induced ataxia and dyskinesia in murine models (34), underscoring the essential role of cholesterol in maintaining the physiological functions in oligodendrocytes.
Some limitations remained in the study. First, the investigation was confined to measuring cholesterol levels in peripheral blood, which may not accurately reflect cholesterol levels within the central nervous system. Consequently, further research is warranted to determine whether serum cholesterol levels can serve as a reliable indicator of cholesterol metabolism in neurons, oligodendrocytes, and other glial cells. Second, the study was conducted as a single-center prospective investigation, primarily representing patients from western China. Additionally, while the patients included in the study met the clinical criteria for MSA, none had undergone autopsy confirmation. Considering these limitations, multicenter collaborations with extended follow-up periods and pathological diagnoses are needed to be carried out to validate our findings.
Conclusion
Our prospective cohort study indicated that low serum TC levels are associated with an increased risk of mortality in patients with MSA, exhibiting a non-linear form. The association between serum TC levels and survival was particularly pronounced among the elderly patients and those with the MSA-C subtype. Abnormal cholesterol metabolism may represent a significant pathophysiological factor influencing the survival of MSA.
Data availability statement
The raw data supporting the conclusions of this article will be made available by the corresponding author, on reasonable request.
Ethics statement
The studies involving humans were approved by the Ethics Committee of West China Hospital of Sichuan University. The studies were conducted in accordance with the local legislation and institutional requirements. The participants provided their written informed consent to participate in this study.
Author contributions
JH: Writing – original draft, Writing – review & editing. LZ: Funding acquisition, Project administration, Resources, Supervision, Validation, Writing – review & editing, Writing – original draft. QJ: Data curation, Formal analysis, Investigation, Methodology, Project administration, Software, Writing – review & editing. SW: Data curation, Formal analysis, Investigation, Methodology, Project administration, Software, Writing – review & editing. YX: Data curation, Formal analysis, Investigation, Methodology, Project administration, Software, Writing – review & editing. NC: Data curation, Formal analysis, Investigation, Methodology, Software, Validation, Visualization, Writing – review & editing. JL: Data curation, Formal analysis, Investigation, Methodology, Validation, Writing – review & editing. BZ: Data curation, Investigation, Project administration, Validation, Writing – review & editing. YC: Data curation, Investigation, Supervision, Validation, Writing – review & editing. CL: Conceptualization, Project administration, Resources, Supervision, Validation, Visualization, Writing – review & editing. HS: Conceptualization, Funding acquisition, Resources, Supervision, Validation, Visualization, Writing – review & editing.
Funding
The author(s) declare that financial support was received for the research and/or publication of this article. This study was supported by the Sichuan Science and Technology Program (Grant Nos. 2022ZDZX0023, 2022ZYD0051, and 2024NSFSC1642) and the National Natural Science Foundation of China (Grant No. 82301602).
Acknowledgments
This study thanks the cooperation of all patients and all the staff of Department of Neurology and Laboratory of Neurodegenerative Disorders of West China Hospital of Sichuan University.
Conflict of interest
The authors declare that the research was conducted in the absence of any commercial or financial relationships that could be construed as a potential conflict of interest.
The author(s) declared that they were an editorial board member of Frontiers, at the time of submission. This had no impact on the peer review process and the final decision.
Generative AI statement
The authors declare that no Gen AI was used in the creation of this manuscript.
Any alternative text (alt text) provided alongside figures in this article has been generated by Frontiers with the support of artificial intelligence and reasonable efforts have been made to ensure accuracy, including review by the authors wherever possible. If you identify any issues, please contact us.
Publisher’s note
All claims expressed in this article are solely those of the authors and do not necessarily represent those of their affiliated organizations, or those of the publisher, the editors and the reviewers. Any product that may be evaluated in this article, or claim that may be made by its manufacturer, is not guaranteed or endorsed by the publisher.
Supplementary material
The Supplementary material for this article can be found online at: https://www.frontiersin.org/articles/10.3389/fnut.2025.1663881/full#supplementary-material
Supplementary Figure 1 | Univariate and multivariate Cox regression model proportional-hazards regression analyses for MSA survival according to baseline characteristics.
Abbreviations
AD, Alzheimer’s disease; BMI, body mass index; GCI, glial cytoplasmic inclusion; MSA, Multiple system atrophy; MSA-P, multiple system atrophy with predominant parkinsonism; MSA-C, multiple system atrophy with predominant cerebellar ataxia; OH, orthostatic hypotension; PD, Parkinson’s disease; SCA, spinocerebellar ataxia; TC, total cholesterol; UMSARS, Unified Multiple System Atrophy Rating Scale.
Footnotes
References
1. Tison, F, Yekhlef, F, Chrysostome, V, and Sourgen, C. Prevalence of multiple system atrophy. Lancet. (2000) 355:495–6. doi: 10.1016/S0140-6736(00)82050-4
2. Kaplan, S. Prevalence of multiple system atrophy: a literature review. Rev Neurol. (2024) 180:438–50. doi: 10.1016/j.neurol.2023.11.013
3. Low, PA, Reich, SG, Jankovic, J, Shults, CW, Stern, MB, Novak, P, et al. Natural history of multiple system atrophy in the USA: a prospective cohort study. Lancet Neurol. (2015) 14:710–9. doi: 10.1016/S1474-4422(15)00058-7
4. Zhang, L, Hou, Y, Gu, X, Cao, B, Wei, Q, Ou, R, et al. Prediction of early-wheelchair dependence in multiple system atrophy based on machine learning algorithm: a prospective cohort study. Clin Park Relat Disord. (2023) 8:100183. doi: 10.1016/j.prdoa.2023.100183
5. Schrag, A, Wenning, GK, Quinn, N, and Ben-Shlomo, Y. Survival in multiple system atrophy. Mov Disord. (2008) 23:294–6. doi: 10.1002/mds.21839
6. Cao, B, Zhang, L, Zou, Y, Wei, Q, Ou, R, Chen, Y, et al. Survival analysis and prognostic nomogram model for multiple system atrophy. Parkinsonism Relat Disord. (2018) 54:68–73. doi: 10.1016/j.parkreldis.2018.04.016
7. Zhang, L, Cao, B, Zou, Y, Wei, QQ, Ou, R, Liu, W, et al. Causes of death in Chinese patients with multiple system atrophy. Aging Dis. (2018) 9:102–8. doi: 10.14336/AD.2017.0711
8. Poewe, W, Stankovic, I, Halliday, G, Meissner, WG, Wenning, GK, Pellecchia, MT, et al. Multiple system atrophy. Nat Rev Dis Primers. (2022) 8:56. doi: 10.1038/s41572-022-00382-6
9. Bai, B, Vanderwall, D, Li, Y, Wang, X, Poudel, S, Wang, H, et al. Proteomic landscape of Alzheimer's disease: novel insights into pathogenesis and biomarker discovery. Mol Neurodegener. (2021) 16:55. doi: 10.1186/s13024-021-00474-z
10. Presećki, P, Mück-Seler, D, Mimica, N, Pivac, N, Mustapić, M, Stipcević, T, et al. Serum lipid levels in patients with Alzheimer's disease. Coll Antropol. (2011) 35:115–20.
11. Hurh, K, Park, M, Jang, SI, Park, EC, and Jang, SY. Association between serum lipid levels over time and risk of Parkinson's disease. Sci Rep. (2022) 12:21020. doi: 10.1038/s41598-022-25180-8
12. Macías-García, D, Periñán, MT, Muñoz-Delgado, L, Jimenez-Jaraba, MV, Labrador-Espinosa, M, Jesús, S, et al. Serum lipid profile among sporadic and familial forms of Parkinson's disease. NPJ Parkinsons Dis. (2021) 7:59. doi: 10.1038/s41531-021-00206-6
13. Lee, PH, Lim, TS, Shin, HW, Yong, SW, Nam, HS, and Sohn, YH. Serum cholesterol levels and the risk of multiple system atrophy: a case-control study. Mov Disord. (2009) 24:752–8. doi: 10.1002/mds.22459
14. Cao, B, Guo, X, Chen, K, Song, W, Huang, R, Wei, QQ, et al. Serum lipid levels are associated with the prevalence but not with the disease progression of multiple system atrophy in a Chinese population. Neurol Res. (2014) 36:150–6. doi: 10.1179/1743132813Y.0000000277
15. Shi, Z, Zhang, J, Wang, P, Han, J, Li, X, Liu, S, et al. Serum lipid levels are associated with orthostatic hypotension in multiple system atrophy patients. Parkinsonism Relat Disord. (2023) 114:105803. doi: 10.1016/j.parkreldis.2023.105803
16. Liu, M, Cai, Y, Pan, J, Wang, T, Li, Y, Yu, Q, et al. Serum neurofilament light chain as a diagnostic and prognostic biomarker in multiple system atrophy: a prospective cohort study. J Neurol. (2024) 272:74. doi: 10.1007/s00415-024-12784-5
17. Zhang, L, Cao, B, Hou, Y, Wei, Q, Ou, R, Zhao, B, et al. High neutrophil-to-lymphocyte ratio predicts short survival in multiple system atrophy. NPJ Parkinsons Dis. (2022) 8:11. doi: 10.1038/s41531-021-00267-7
18. Li, S, Zhang, L, Hou, Y, Yang, T, Li, C, Wei, Q, et al. Prevalence and prognostic significance of malnutrition in early-stage multiple system atrophy. Front Nutr. (2023) 10:1248349. doi: 10.3389/fnut.2023.1248349
19. Gilman, S, Wenning, GK, Low, PA, Brooks, DJ, Mathias, CJ, Trojanowski, JQ, et al. Second consensus statement on the diagnosis of multiple system atrophy. Neurology. (2008) 71:670–6. doi: 10.1212/01.wnl.0000324625.00404.15
20. Wenning, GK, Tison, F, Seppi, K, Sampaio, C, Diem, A, Yekhlef, F, et al. Development and validation of the unified multiple system atrophy rating scale (UMSARS). Mov Disord. (2004) 19:1391–402. doi: 10.1002/mds.20255
21. Pavy-Le Traon, A, Piedvache, A, Perez-Lloret, S, Calandra-Buonaura, G, Cochen-De Cock, V, Colosimo, C, et al. New insights into orthostatic hypotension in multiple system atrophy: a European multicentre cohort study. J Neurol Neurosurg Psychiatry. (2016) 87:554–61. doi: 10.1136/jnnp-2014-309999
22. Zeng, Q, Gong, Y, Zhu, N, Shi, Y, Zhang, C, and Qin, L. Lipids and lipid metabolism in cellular senescence: emerging targets for age-related diseases. Ageing Res Rev. (2024) 97:102294. doi: 10.1016/j.arr.2024.102294
23. Saher, G. Cholesterol metabolism in aging and age-related disorders. Annu Rev Neurosci. (2023) 46:59–78. doi: 10.1146/annurev-neuro-091922-034237
24. Downer, B, Estus, S, Katsumata, Y, and Fardo, DW. Longitudinal trajectories of cholesterol from midlife through late life according to apolipoprotein E allele status. Int J Environ Res Public Health. (2014) 11:10663–93. doi: 10.3390/ijerph111010663
25. Younger, DS. Autonomic failure: Clinicopathologic, physiologic, and genetic aspects. Handb Clin Neurol. (2023) 195:55–102. doi: 10.1016/B978-0-323-98818-6.00020-0
26. Cantuti-Castelvetri, L, Fitzner, D, Bosch-Queralt, M, Weil, MT, Su, M, Sen, P, et al. Defective cholesterol clearance limits remyelination in the aged central nervous system. Science. (2018) 359:684–8. doi: 10.1126/science.aan4183
27. Burn, DJ, and Jaros, E. Multiple system atrophy: cellular and molecular pathology. Mol Pathol. (2001) 54:419–26. doi: 10.1136/mp.54.6.419
28. Saher, G, and Stumpf, SK. Cholesterol in myelin biogenesis and hypomyelinating disorders. Biochim Biophys Acta. (2015) 1851:1083–94. doi: 10.1016/j.bbalip.2015.02.010
29. Saher, G, Quintes, S, and Nave, KA. Cholesterol: a novel regulatory role in myelin formation. Neuroscientist. (2011) 17:79–93. doi: 10.1177/1073858410373835
30. Berghoff, SA, Spieth, L, and Saher, G. Local cholesterol metabolism orchestrates remyelination. Trends Neurosci. (2022) 45:272–83. doi: 10.1016/j.tins.2022.01.001
31. Mavroeidi, P, Arvanitaki, F, Karakitsou, AK, Vetsi, M, Kloukina, I, Zweckstetter, M, et al. Endogenous oligodendroglial alpha-synuclein and TPPP/p25α orchestrate alpha-synuclein pathology in experimental multiple system atrophy models. Acta Neuropathol. (2019) 138:415–41. doi: 10.1007/s00401-019-02014-y
32. Grigoletto, J, Pukaß, K, Gamliel, A, Davidi, D, Katz-Brull, R, Richter-Landsberg, C, et al. Higher levels of myelin phospholipids in brains of neuronal α-Synuclein transgenic mice precede myelin loss. Acta Neuropathol Commun. (2017) 5:37. doi: 10.1186/s40478-017-0439-3
33. Mazzulli, JR, Xu, YH, Sun, Y, Knight, AL, McLean, PJ, Caldwell, GA, et al. Gaucher disease glucocerebrosidase and α-synuclein form a bidirectional pathogenic loop in synucleinopathies. Cell. (2011) 146:37–52. doi: 10.1016/j.cell.2011.06.001
Keywords: serum total cholesterol, MSA, survival, prospective observational cohort, predictor
Citation: Huang J, Zhang L, Jiang Q, Wang S, Xiao Y, Che N, Lin J, Zhao B, Cheng Y, Li C and Shang H (2025) Low level of serum total cholesterol predicts mortality in early-stage multiple system atrophy: a prospective-cohort study. Front. Nutr. 12:1663881. doi: 10.3389/fnut.2025.1663881
Edited by:
K. Jayasankara Reddy, Christ University, IndiaReviewed by:
Harsh Kishore, Dayanand Medical College and Hospital, IndiaNikunja Kishor Mishra, College of Pharmaceutical Sciences, India
Copyright © 2025 Huang, Zhang, Jiang, Wang, Xiao, Che, Lin, Zhao, Cheng, Li and Shang. This is an open-access article distributed under the terms of the Creative Commons Attribution License (CC BY). The use, distribution or reproduction in other forums is permitted, provided the original author(s) and the copyright owner(s) are credited and that the original publication in this journal is cited, in accordance with accepted academic practice. No use, distribution or reproduction is permitted which does not comply with these terms.
*Correspondence: Huifang Shang, aGZzaGFuZzIwMDJAMTI2LmNvbQ==
†ORCID: Huifang Shang, http://orcid.org/0000-0003-0947-1151