 Maria Julia Miele1,2*
 Priscila Pereira Coltri3
 Camila Ferreira Soares4
 Renato Teixeira Souza2
 Rodolfo Carvalho Pacagnella2
 José Guilherme Cecatti2Barbara Teruel1
- 1School of Agricultural Engineering, University of Campinas (UNICAMP), Campinas, Brazil
- 2Department of Obstetrics and Gynecology, School of Medical Sciences, University of Campinas (UNICAMP), Campinas, Brazil
- 3Center for Meteorological and Climatic Research Applied to Agriculture (CEPAGRI), University of Campinas, Campinas, Brazil
- 4Department of Demography, Institute of Philosophy and Human Sciences, University of Campinas (UNICAMP), Campinas, Brazil
A Correction on
From field to plate: 50 years of plant-based food production and emerging risks to planetary and women's health
by Miele, M. J., Pereira Coltri, P., Ferreira Soares, C., Teixeira Souza, R., Carvalho Pacagnella, R., Cecatti, J. G., and Teruel, B. (2025). Front. Nutr. 12:1619844. doi: 10.3389/fnut.2025.1619844
In the published article, there was an error in Figure 7 as published. Figure 7 (titled 2008) was inadvertently duplicated from Figure 8 (titled 2018). All numerical values, legends, and captions for Figures 7 and 8 are correct, only the image in Figure 7 should be replaced with the correct version corresponding to data from 2008.
The corrected Figure 7 image is provided below.
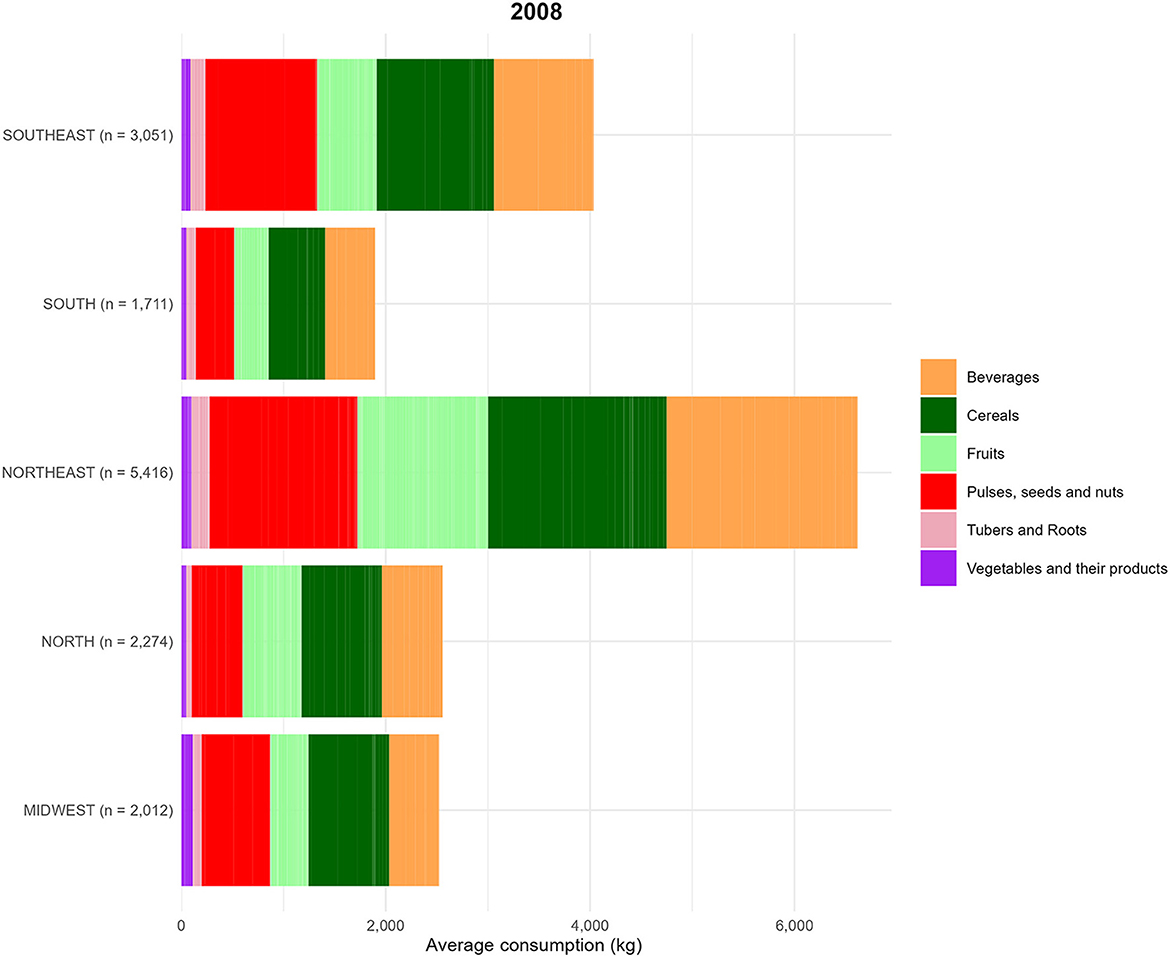
Figure 7. Food consumption (kg) by food groups, based on data from the Household Budget Survey (POF) 2008. Food groups are represented as follows (Table 1). The average food amount consumption (g) by region is described below: (1) Midwest = Beverages: 19.4%; Cereals: 31.3%; Fruits: 14.8%; Pulses, seeds and nuts: 26.6%; Tubers and Roots: 3.5%; Vegetables and their products: 4.4%. (2) North = Beverages: 23.3%; Cereals: 30.8%; Fruits: 22.5%; Pulses, seeds and nuts: 19.5%; Tubers and Roots: 2.1%; Vegetables and their products: 1.9%. (3) Northeast = Beverages: 28.3%; Cereals: 26.4%; Fruits: 19.3%; Pulses, seeds and nuts: 21.9%; Tubers and Roots: 2.7%; Vegetables and their products: 1.5%. (4) South = Beverages: 25.9%; Cereals: 29.1%; Fruits: 17.8%, Pulses, seeds and nuts: 19.8%, Tubers and Roots: 4.9%, Vegetables and their products: 2.5%. (5) Southeast = Beverages: 24.2%, Cereals: 28.4%, Fruits: 14.4%, Pulses, seeds and nuts: 27.1%, Tubers and Roots: 3.6%, Vegetables and their products: 2.2.
The original article has been updated.
Publisher's note
All claims expressed in this article are solely those of the authors and do not necessarily represent those of their affiliated organizations, or those of the publisher, the editors and the reviewers. Any product that may be evaluated in this article, or claim that may be made by its manufacturer, is not guaranteed or endorsed by the publisher.
Keywords: agri-food systems, dietary patterns, planetary health, pesticide residues, reproductive age
Citation: Miele MJ, Pereira Coltri P, Ferreira Soares C, Teixeira Souza R, Carvalho Pacagnella R, Cecatti JG and Teruel B (2025) Correction: From field to plate: 50 years of plant-based food production and emerging risks to planetary and women's health. Front. Nutr. 12:1666757. doi: 10.3389/fnut.2025.1666757
Received: 15 July 2025; Accepted: 22 July 2025;
Published: 04 August 2025.
Edited and reviewed by: Abhishek Das, International Crops Research Institute for the Semi-Arid Tropics (ICRISAT), India
Copyright © 2025 Miele, Pereira Coltri, Ferreira Soares, Teixeira Souza, Carvalho Pacagnella, Cecatti and Teruel. This is an open-access article distributed under the terms of the Creative Commons Attribution License (CC BY). The use, distribution or reproduction in other forums is permitted, provided the original author(s) and the copyright owner(s) are credited and that the original publication in this journal is cited, in accordance with accepted academic practice. No use, distribution or reproduction is permitted which does not comply with these terms.
*Correspondence: Maria Julia Miele, bW1pZWxlQHVuaWNhbXAuYnI=