 Linghong Cheng
 Liyang Chang
 Ruchun Yang
 Rongrong Tian
 Manting Xiong
 Hongmei Zhang
- 1Department of Nephrology, Hangzhou TCM Hospital Affiliated to Zhejiang Chinese Medical University, Hangzhou, Zhejiang, China
- 2School of Nursing, Shanghai Jiao Tong University, Shanghai, China
Background: The relationship between phase angle (PhA) and sarcopenic obesity (SO) in patients undergoing hemodialysis (HD) has not been well established. Therefore, this study aimed to evaluate the relationship between PhA and SO in patients undergoing HD and to determine the cutoff value of PhA that can predict SO.
Methods: We conducted a cross-sectional study of 436 patients undergoing HD. The PhA was measured by bioelectrical impedance analysis. SO was diagnosed according to the revised definition of the Asian Working Group for Sarcopenia combined with obesity based on body fat percentage. The association between PhA and SO was assessed using multinomial logistic regression. The PhA cutoff values for SO were determined using receiver operating characteristic (ROC) curve analysis.
Results: Among the participants, 119 (27.3%) had SO. After adjusting for various confounders, PhA was significantly associated with a lower SO risk [odds ratio (OR) = 0.098, 95% confidence interval (CI): 0.048–0.200]. Furthermore, PhA showed a stronger association with SO than with sarcopenia or obesity alone. ROC analysis indicated excellent predictive ability for SO in both sexes (area under the curve (AUC): 0.841 for males, 0.836 for females; cutoff values: 4.49° for males, 4.18° for females).
Conclusion: PhA exhibited good accuracy in detecting SO in patients undergoing HD, suggesting its utility as a reliable screening tool for the early identification of at-risk individuals.
1 Introduction
Sarcopenic obesity (SO) is characterized by the coexistence of sarcopenia and excess adiposity. SO is recognized as an emerging public health concern worldwide (1). The adverse clinical consequences of SO are considered extremely important and more severe than those of sarcopenia or obesity alone (2). Highlighting its significance, a joint consensus statement from the European Society for Clinical Nutrition and Metabolism and the European Association for the Study of Obesity underscored the urgent need for standardized diagnostic criteria (1). The pathophysiology of SO involves a detrimental interplay between adipose tissue expansion and muscle wasting. Key mechanisms include chronic inflammation, insulin resistance, hormonal alterations, and ectopic fat infiltration. These pathways collectively drive muscle protein breakdown and impair anabolic signaling (3). These mechanisms are highly relevant in patients with chronic kidney disease, who exhibit accelerated aging phenotypes due to uremic toxins, chronic inflammation, and hormonal imbalances (4, 5). In patients with end-stage renal disease (ESRD), the most common body composition trajectory over time is an increase in body fat accompanied by a loss of lean mass (6–8). Consequently, the impact of SO on patients undergoing dialysis has garnered increasing attention. The prevalence of SO has been reported to vary among studies because of the differences in the definition, diagnostic tools, and study population; however, it is thought to be 16–22% in hemodialysis (HD) patients (9–11), a prevalence notably higher than that reported in the general elderly population (8–11%) (12, 13). In the HD population, SO is independently associated with poor prognosis, including poor gait performance, weakness, decreased quality of life, increased risk of cardiovascular events, and high mortality (10, 14–17). However, early stages of SO are frequently undetected, leading to delays in diagnosis and treatment. Therefore, implementing routine screening for SO in patients undergoing HD is crucial to facilitate early detection and intervention, thereby preventing disease progression.
The phase angle (PhA), a parameter derived from bioelectrical impedance analysis (BIA), is calculated as the ratio of reactance (Xc) to resistance (R). Xc is the membrane’s ability to sustain electrical potential, and R is the opposition offered by body fluids and electrolytes. Consequently, PhA provides information on tissue hydration, cell membrane mass, cellular health, membrane integrity, and cellular function (18). Notably, PhA may serve as a low-cost, real-time alternative for assessing inflammatory status. During states of inflammation and oxidative stress, reactive oxygen species disrupt cell membranes and disturb the intracellular-extracellular fluid balance, which in turn impairs membrane capacitance and thereby lowers PhA (19, 20). Consequently, lower PhA values are increasingly recognized as markers of systemic inflammation and oxidative stress—core mechanisms linking sarcopenia and obesity (21). Given these properties, PhA has been proposed as an independent predictor of disease severity in conditions such as malnutrition (22), nutritional risk (23), and sarcopenia (24). However, its utility for identifying SO in the HD population remains systematically unexplored.
Given that SO is common among patients undergoing HD and seriously endangers their health, a better understanding of the relationship between SO and PhA may spark interest in the nephrological community. Therefore, we conducted this cross-sectional study to investigate the association between PhA and SO in a Chinese HD cohort and to establish the optimal cutoff values of PhA for identifying SO.
2 Methods
2.1 Study design and participants
We conducted this cross-sectional study between December 2018 and September 2020 at the HD center of the Hangzhou Traditional Chinese Medicine Hospital in Hangzhou, China. The study recruited adult patients aged 18–80 years who were on maintenance HD three times per week for at least 3 months. The exclusion criteria were patients who had metallic joint prostheses, implanted defibrillators, or cardiac pacemakers; those diagnosed with malignant tumors, advanced liver dysfunction, acute systemic infections, or severe nutritional deficiencies; and those who had experienced any cardiovascular event, including myocardial infarction or stroke, within 3 months before enrollment. A total of 436 patients undergoing HD were included in the final analysis. To ensure an adequate sample size, we conducted a statistical power analysis. Using the pwr package in R with the current sample size (N = 436), α = 0.05, and the observed large between-group effect size (Cohen’s f = 1.299), the statistical power of this study reached 99%. Furthermore, a reverse power calculation indicated that with 80% power and α = 0.05, this study would be sufficient to detect an effect size as small as 0.292 (Cohen’s f). Together, these results demonstrate that the sample size of this study is adequate to reliably detect significant effects present in the model (25). This study was conducted in accordance with the ethical principles of the Declaration of Helsinki and approved by the Institutional Ethics Committee of Hangzhou Traditional Chinese Medicine Hospital (No. 2018SQ119). Written informed consent was obtained from all participants prior to enrollment in the study.
2.2 Patient characteristics
Demographic characteristics, etiology of renal failure, comorbidities, and dialysis data were systematically extracted from the patients’ medical records at the time of study enrollment. Residual renal function was defined as a 24-h urine output exceeding 200 mL. Laboratory tests were performed on fasting blood samples collected within 1 month of enrollment. Routine hematological and biochemical parameters, including high-sensitivity C-reactive protein (hs-CRP), hemoglobin, albumin, total serum cholesterol, triglycerides, blood urea nitrogen, serum creatinine, serum phosphate, and serum calcium, were measured. Dialysis efficiency was assessed by calculating Kt/V using a single-pool urea kinetic model.
2.3 Diagnosis of SO
SO, which is distinguished by the simultaneous presence of sarcopenia and obesity, was thus defined. Sarcopenia was assessed using handgrip strength (HGS) and skeletal muscle mass index (SMI) in accordance with the Asian Working Group’s revised definition of sarcopenia (AWGS 2019). According to these criteria, sarcopenia was diagnosed in patients with low muscle mass (SMI < 7 kg/m2 for men and <5.7 kg/m2 for women) and low muscle strength (HGS < 28 kg for men and <18 kg for women) (26). Obesity was identified based on the criteria of possessing a body fat percentage (BFP) ≥ 25% in men and ≥35% in women, values which are routinely applied to patients with chronic kidney disease (9, 11, 27). BFP was derived by dividing fat mass (kg) by body weight (kg), while SMI was derived by calculating appendicular skeletal muscle mass (ASM) in kilograms as a function of height squared (m2). Participants were subsequently classified into the following categories: sarcopenia without obesity (sarcopenia group), no sarcopenia with obesity (obesity group), SO group, and normal group.
2.4 BIA measurements
Participants’ body composition was evaluated using a whole-body bioimpedance spectroscopy device (body composition monitor [BCM], Fresenius Medical Care, Bad Homburg, Germany). The BCM system operates by applying alternating currents at 50 different frequencies (ranging from 5 to 1,000 kHz) and measuring the impedance for each. This device employs a three-compartment model, which presupposes a constant hydration factor for both lean tissue mass and fat tissue mass, and excessive extracellular water was classified into a distinct compartment referred to as “overhydration.” This methodological approach offers theoretical advantages for muscle and fat mass assessment, as it minimizes the confounding effects of hydration status on body composition measurements. Measurements were performed before the HD session by a qualified and experienced dialysis nurse who placed four standard electrodes on the patient while supine: two on each hand and foot, positioned on the side opposite to the vascular access. To ensure consistency and minimize variability, all tests were performed by the same operator in strict accordance with the manufacturer’s instructions. PhA, lean tissue mass, fat mass, overhydration, and total body water were obtained directly through BCM. ASM was determined using Ting-Yun Lin’s prediction equation: ASM (kg) = −1.838 + 0.395 × total body water (L) + 0.105 × body weight (kg) + 1.231 × male sex −0.026 × age (years) (R2 = 0.914, standard error of estimate = 1.35 kg). This equation was specifically developed and validated in an Asian HD cohort and demonstrated excellent agreement with dual-energy X-ray absorptiometry-derived ASM, exhibiting a minimal mean bias of only 0.098 kg in the validation group (28).
2.5 Muscle strength measurement
Muscle strength was assessed using an electronic HGS meter (Guangdong Xiangshan Weighing Apparatus Group, Guangdong, China). Patients grasped the meter with the hand on the non-fistula side, with the elbow fully extended. Each test was performed twice, and the highest HGS value was recorded as the result.
2.6 Statistical analysis
Descriptive data for continuous variables are expressed as means ± standard deviations or medians (interquartile ranges) based on their distribution, while categorical variables are presented as frequencies (percentages). Patients were classified into four groups: sarcopenia, obesity, SO, and normal.
Group differences were assessed using chi-square tests for categorical variables and one-way analysis of variance (ANOVA) or Kruskal–Wallis tests for continuous variables based on their distribution. For PhA comparisons across the four groups, one-way ANOVA with Bonferroni post-hoc testing was employed. To address multiple testing in these group comparisons, false discovery rate (FDR) correction using the Benjamini–Hochberg procedure was applied, maintaining a 5% false discovery rate.
Multinomial logistic regression models were applied to evaluate the association between PhA, sarcopenia, and obesity status, with PhA as the independent variable. Four sequential adjustment models were used: Model 1: unadjusted; Model 2: adjusted for age, dialysis vintage, and Body Mass Index (BMI); Model 3: additionally adjusted for albumin, serum calcium, phosphate, hs-CRP, triglyceride, serum creatinine, and blood urea nitrogen; Model 4: further adjusted for diabetes and cardiovascular disease. For regression analyses, we applied both FDR and Bonferroni corrections (α = 0.017) to account for multiple comparisons across the outcome groups. Variance inflation factors (VIF) were calculated to assess multicollinearity.
Receiver operating characteristic (ROC) curve analysis, with the area under the curve (AUC), was used to identify PhA cutoff values indicating the presence of SO. Sex-specific cutoff points were established using the Youden index, which is defined as the maximum [sensitivity + specificity − 1]. Internal validation through bootstrapping with 1,000 resamples provided 95% confidence intervals for these cutoff values.
All analyses were performed using R software (version 4.3.0). A two-tailed p-value of <0.05 was considered statistically significant.
3 Results
3.1 Participant characteristics
The flow diagram of this study is shown in Figure 1. Of the 498 patients initially assessed, 436 met the inclusion criteria and were included in the final analysis. The baseline characteristics of the participants according to body composition categories (obese, SO, sarcopenic, and normal) are shown in Table 1. The mean age of the participants was 58.5 ± 13.1 years, and 282 (64.7%) were male. The rates of sarcopenia, obesity, and SO were 7.6%, 35.8%, and 27.3%, respectively. The mean PhA was 4.47 ± 0.90 for all participants, with values of 4.60 ± 0.97 in men and 4.23 ± 0.70 in women. The differences in body weight, body fat, lean tissue mass, BFP, BMI, SMI, and HGS between the groups were in the expected direction. Furthermore, significant differences were found among the four groups in terms of age, sex, dialysis vintage, diabetes and cardiovascular disease, PhA, triglycerides, albumin, hs-CRP, serum phosphate, serum creatinine, and blood urea nitrogen.
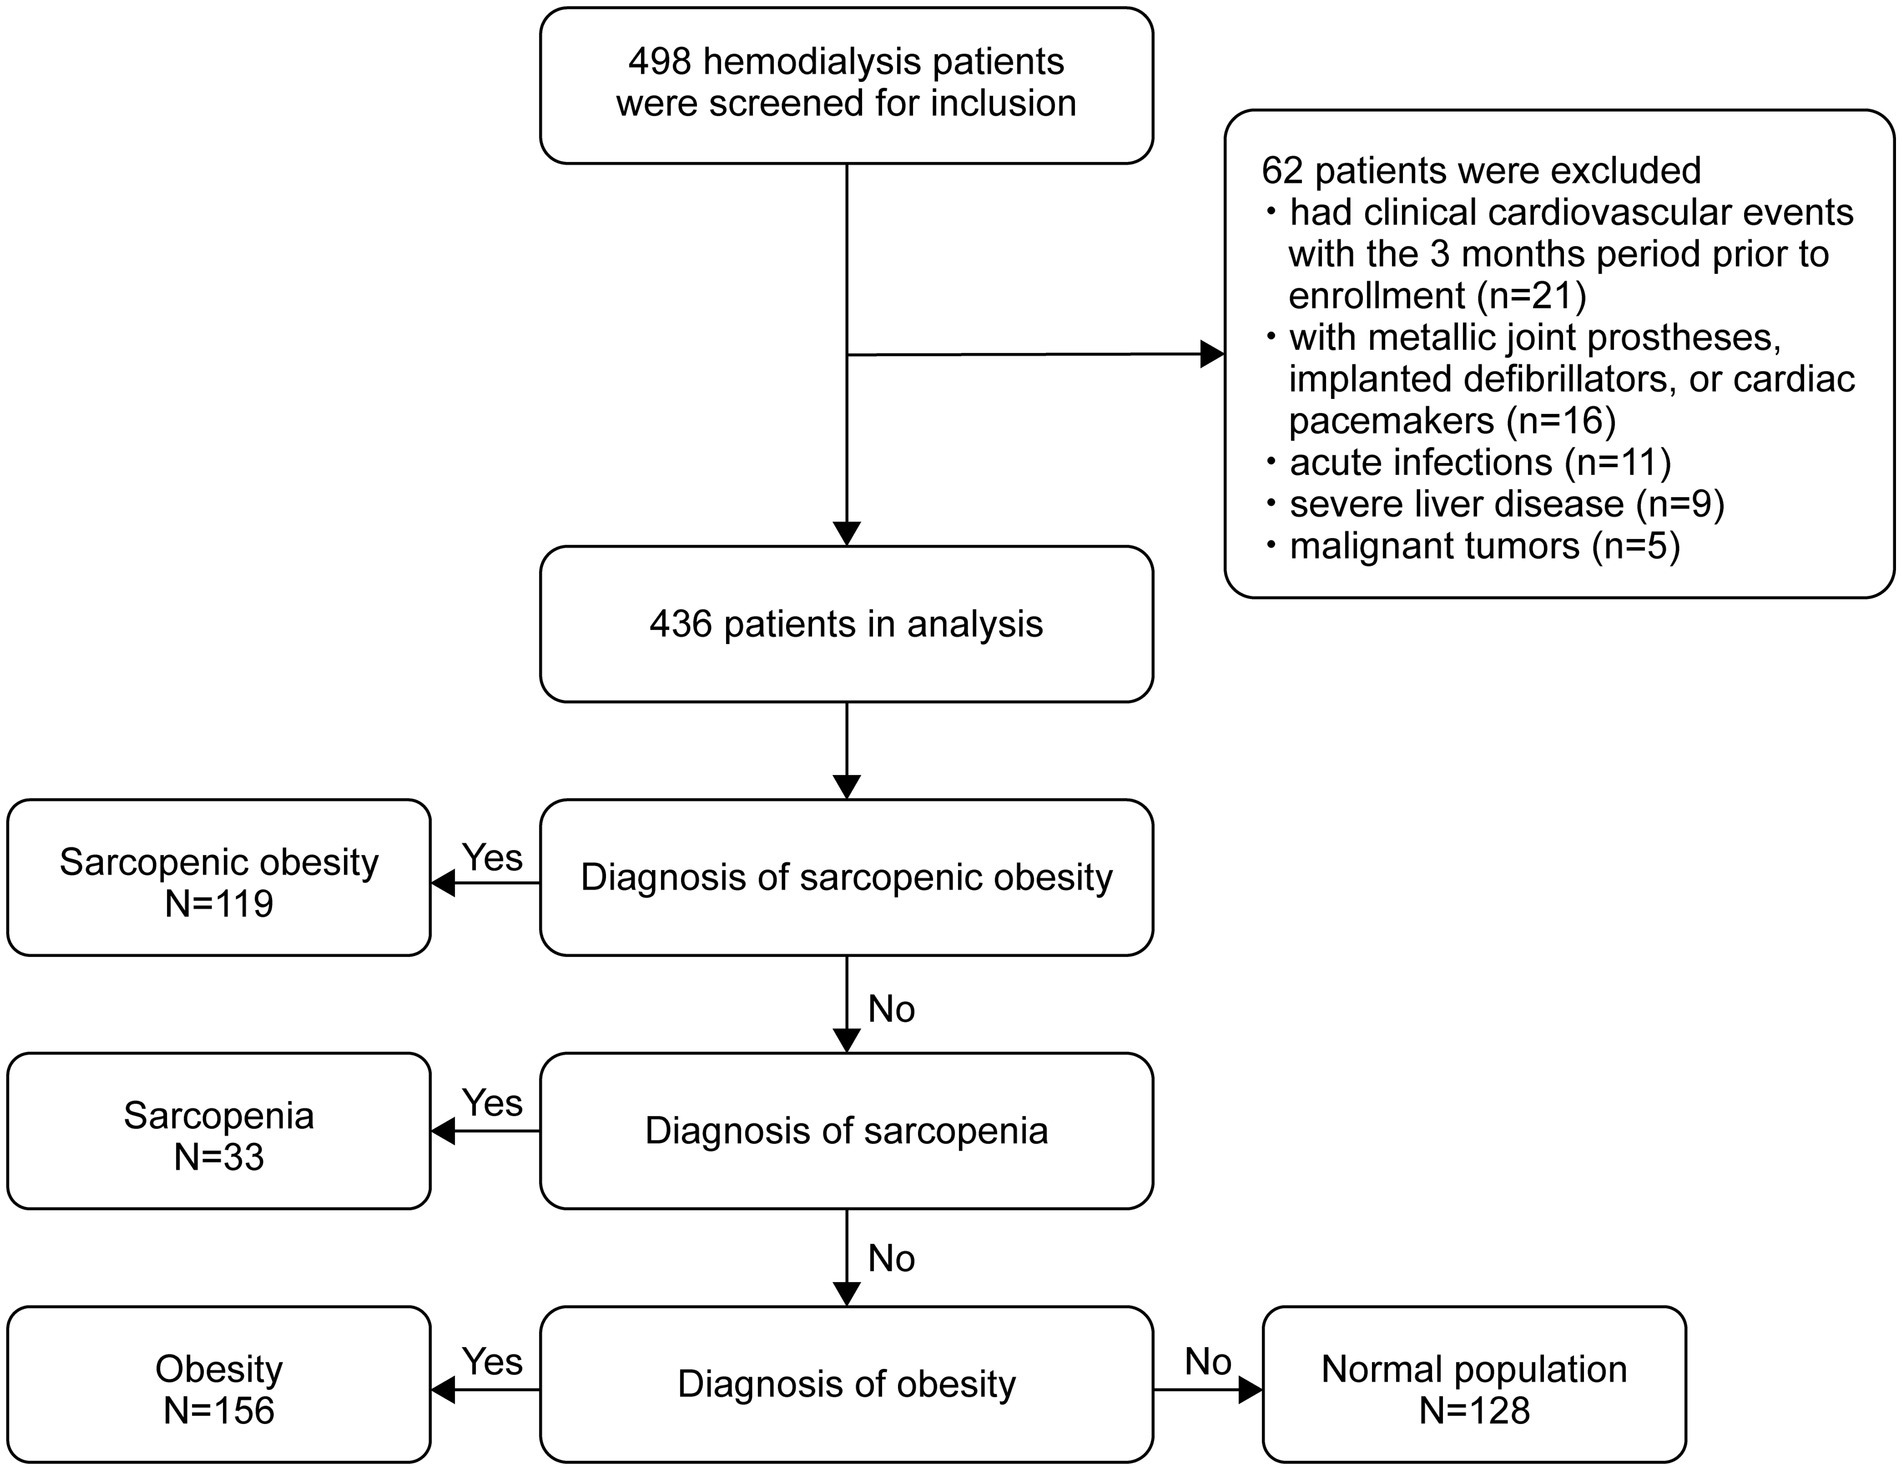
Figure 1. Flow diagram of the study participants.
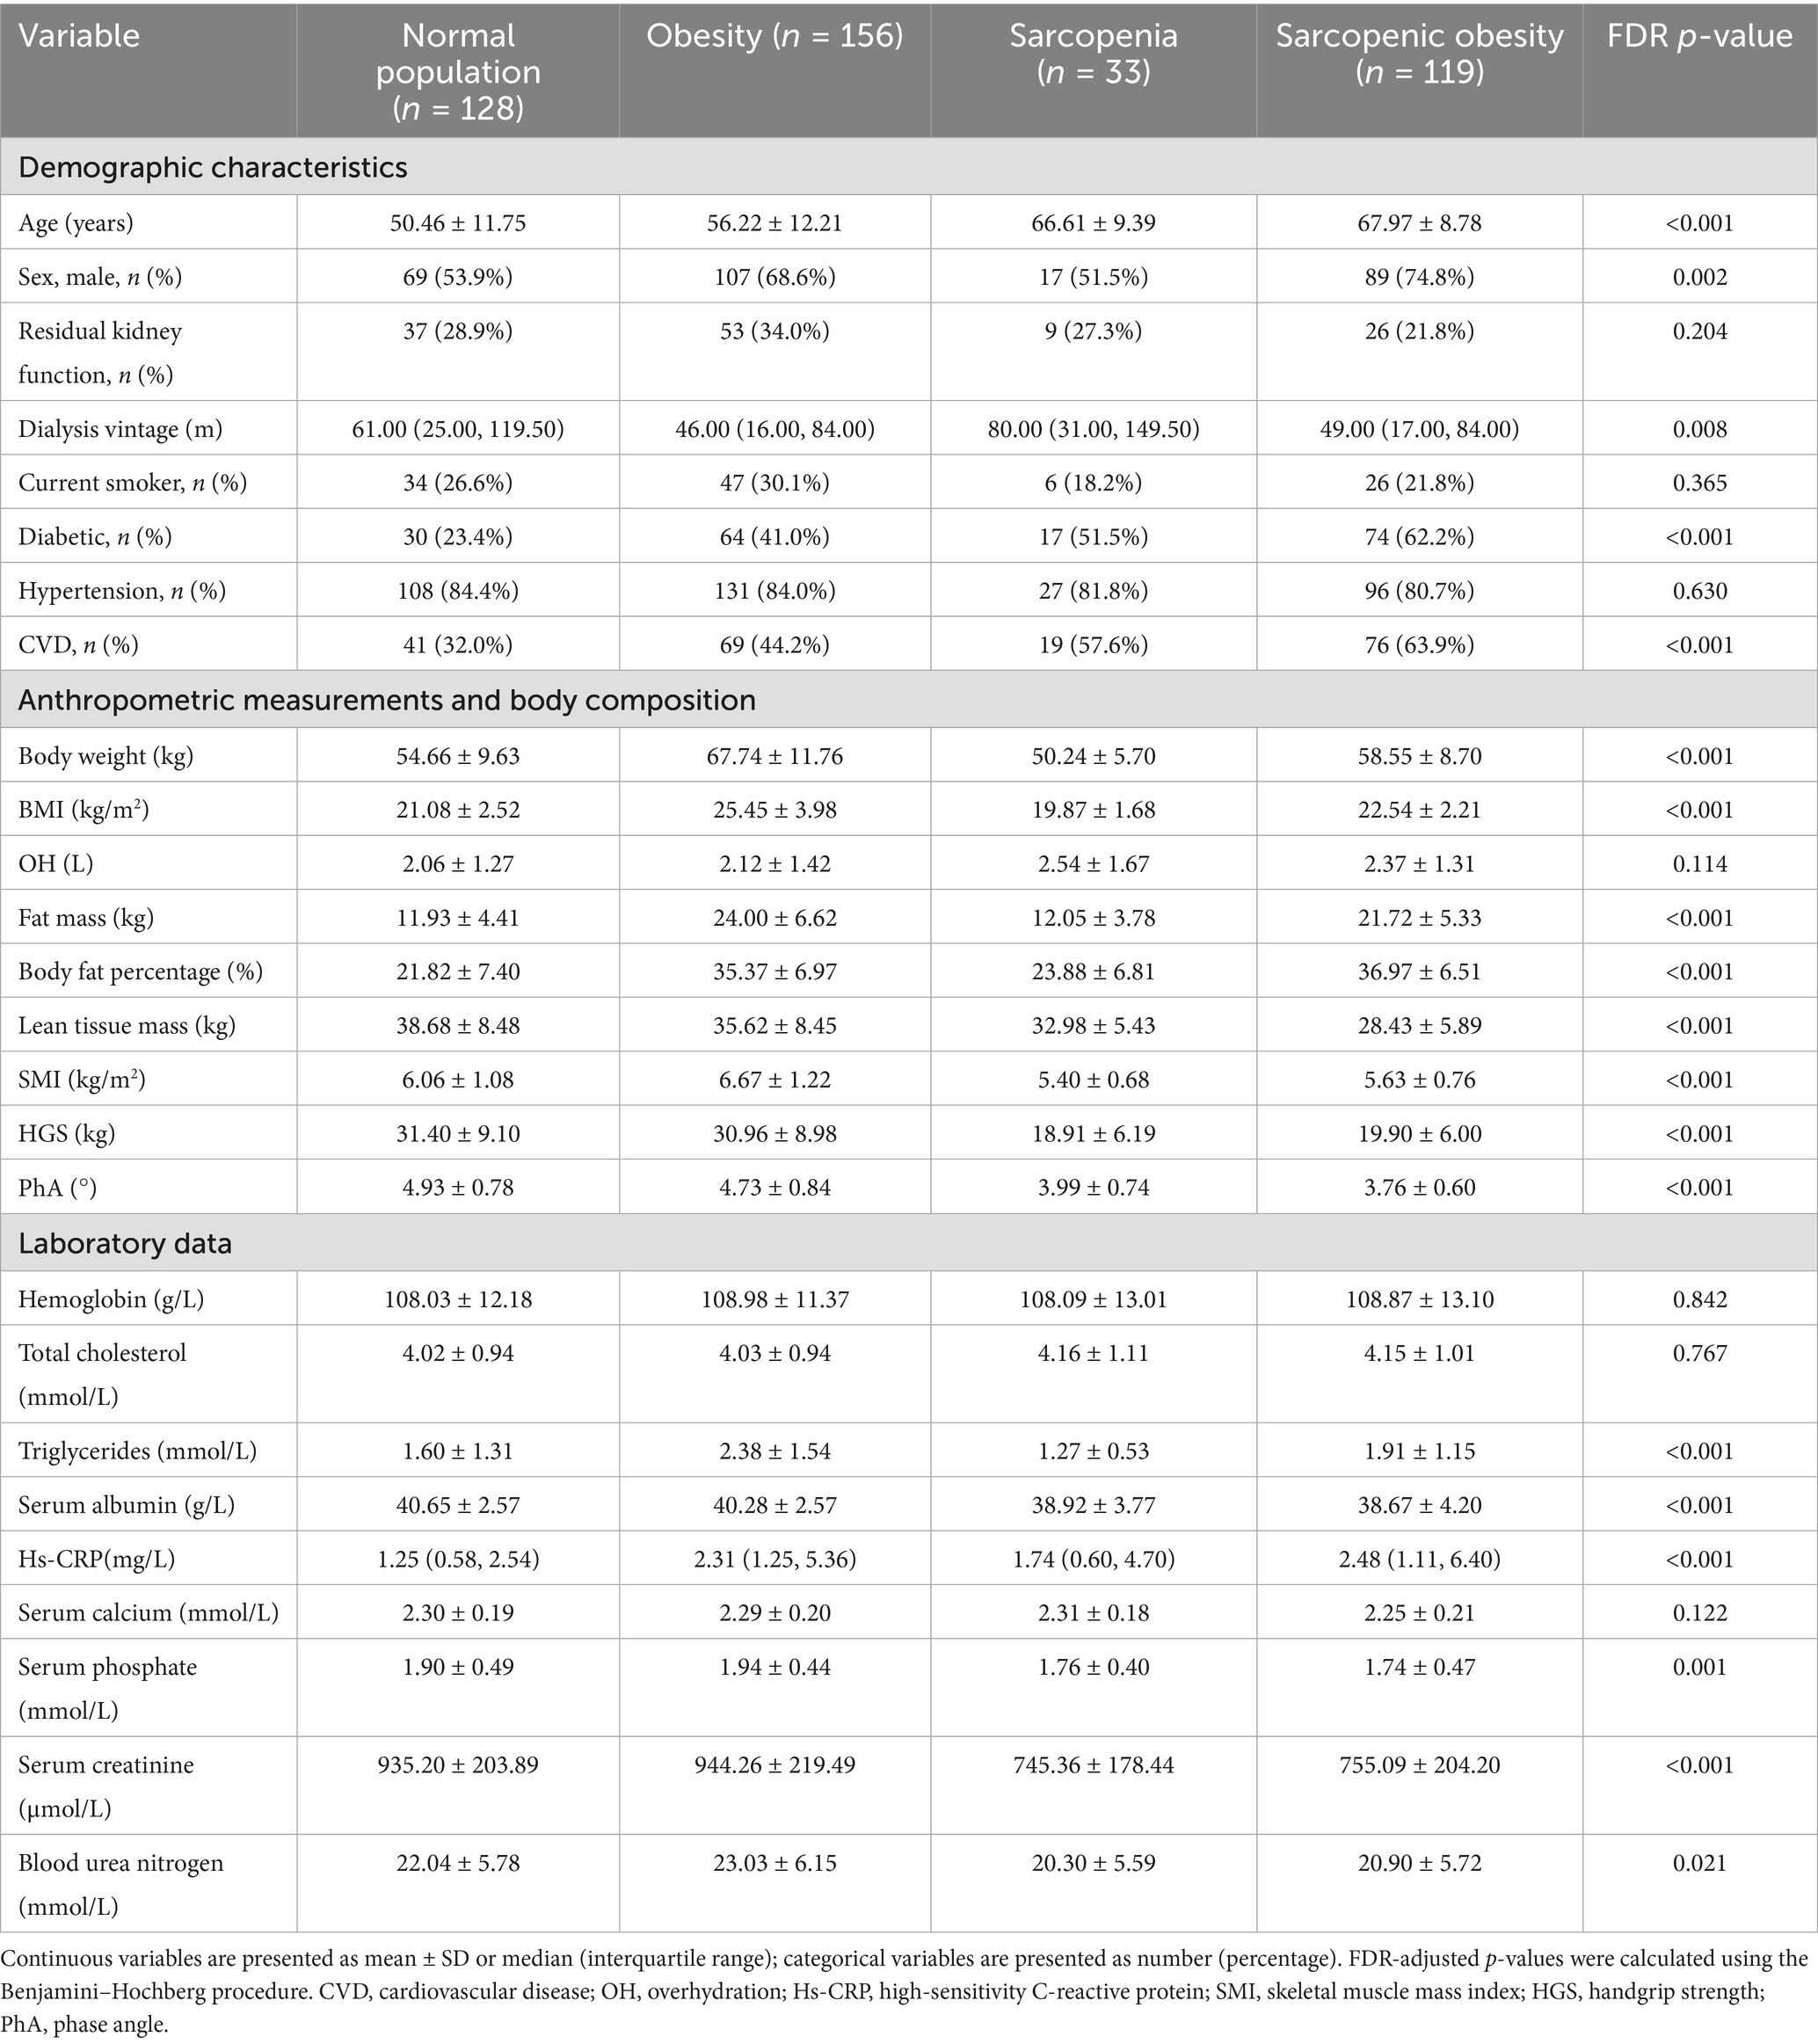
Table 1. Characteristics of participants by sarcopenia and obesity status.
A comparison of PhA values among the four groups (sarcopenia, obesity, SO, and normal) using one-way ANOVA with a post-hoc test (Bonferroni method) is shown in Figure 2. The PhA values in the sarcopenia, obesity, and SO groups were significantly lower than those in the normal group (all p < 0.05). PhA was significantly lower in the sarcopenia group than in the obesity group (3.99 ± 0.74 vs. 4.73 ± 0.8, p < 0.001). PhA was significantly lower in the SO group than in the obesity group (3.76 ± 0.60 vs. 4.73 ± 0.8, p < 0.001).
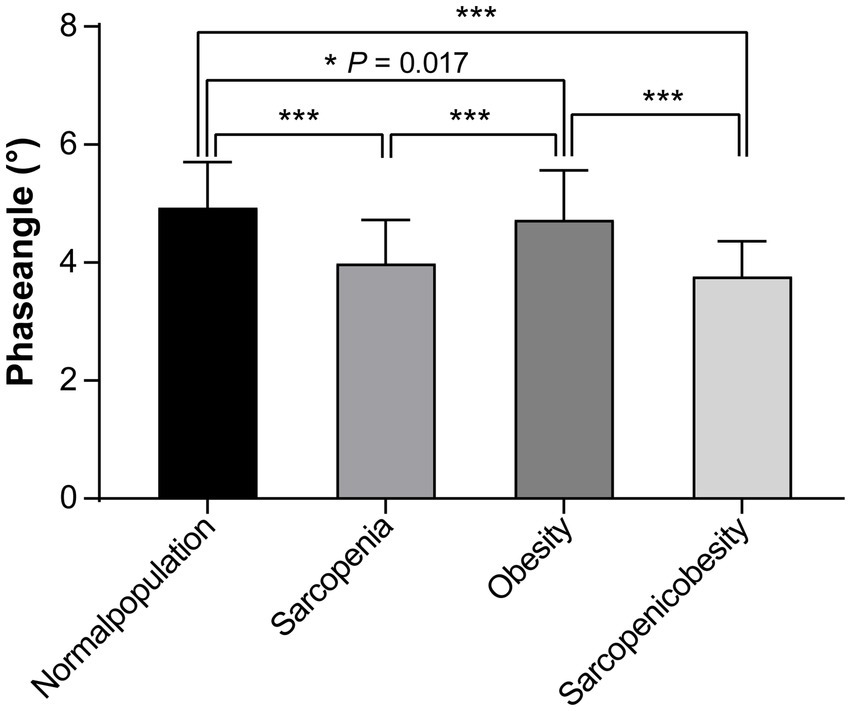
Figure 2. Comparison of the phase angles among the sarcopenia, obesity, sarcopenic obesity, and normal groups.
3.2 The association between PhA and sarcopenia and obesity status
In the multinomial logistic regression, the normal group was employed as the reference, and the relationship between the PhA and SO categories was evaluated (Table 2). In Models 1–3, we observed that the higher the PhA, the lower the risk of sarcopenia, obesity, and SO in all patients. Notably, even in the final adjusted model (model 4), after adjustments for age, dialysis vintage, BMI, albumin, serum calcium, serum phosphate, hs-CRP, triglycerides, serum creatinine, blood urea nitrogen, diabetes, and cardiovascular disease, a higher PhA was still associated with lower risks of obesity (OR = 0.231, 95% CI: 0.127–0.421, p < 0.001, pBonferroni < 0.001) and SO (OR = 0.098, 95% CI: 0.048–0.200, p < 0.001, pBonferroni < 0.001), but not with sarcopenia (OR = 0.517, 95% CI: 0.218–1.223, p = 0.133, pBonferroni = 0.376) (Supplementary Table S1). Furthermore, the association of PhA with SO was stronger than that with obesity (OR = 0.424, 95% CI: 0.233–0.771, p = 0.005). To test whether the association between the PhA and SO categories was stable across sexes, subgroup analyses were performed, and the results were comparable after adjusting for the same variables in Model 4. The VIF values for all models were below 2.14, well below the commonly accepted threshold of 5 (Supplementary Table S2). Model fit and explanatory power were assessed using pseudo R-squared statistics, as shown in Supplementary Table S3. Nagelkerke’s R2 value, which is a normalized metric, increased sequentially from 0.330 in the unadjusted model (Model 1) to 0.715 in the fully adjusted model (Model 4).
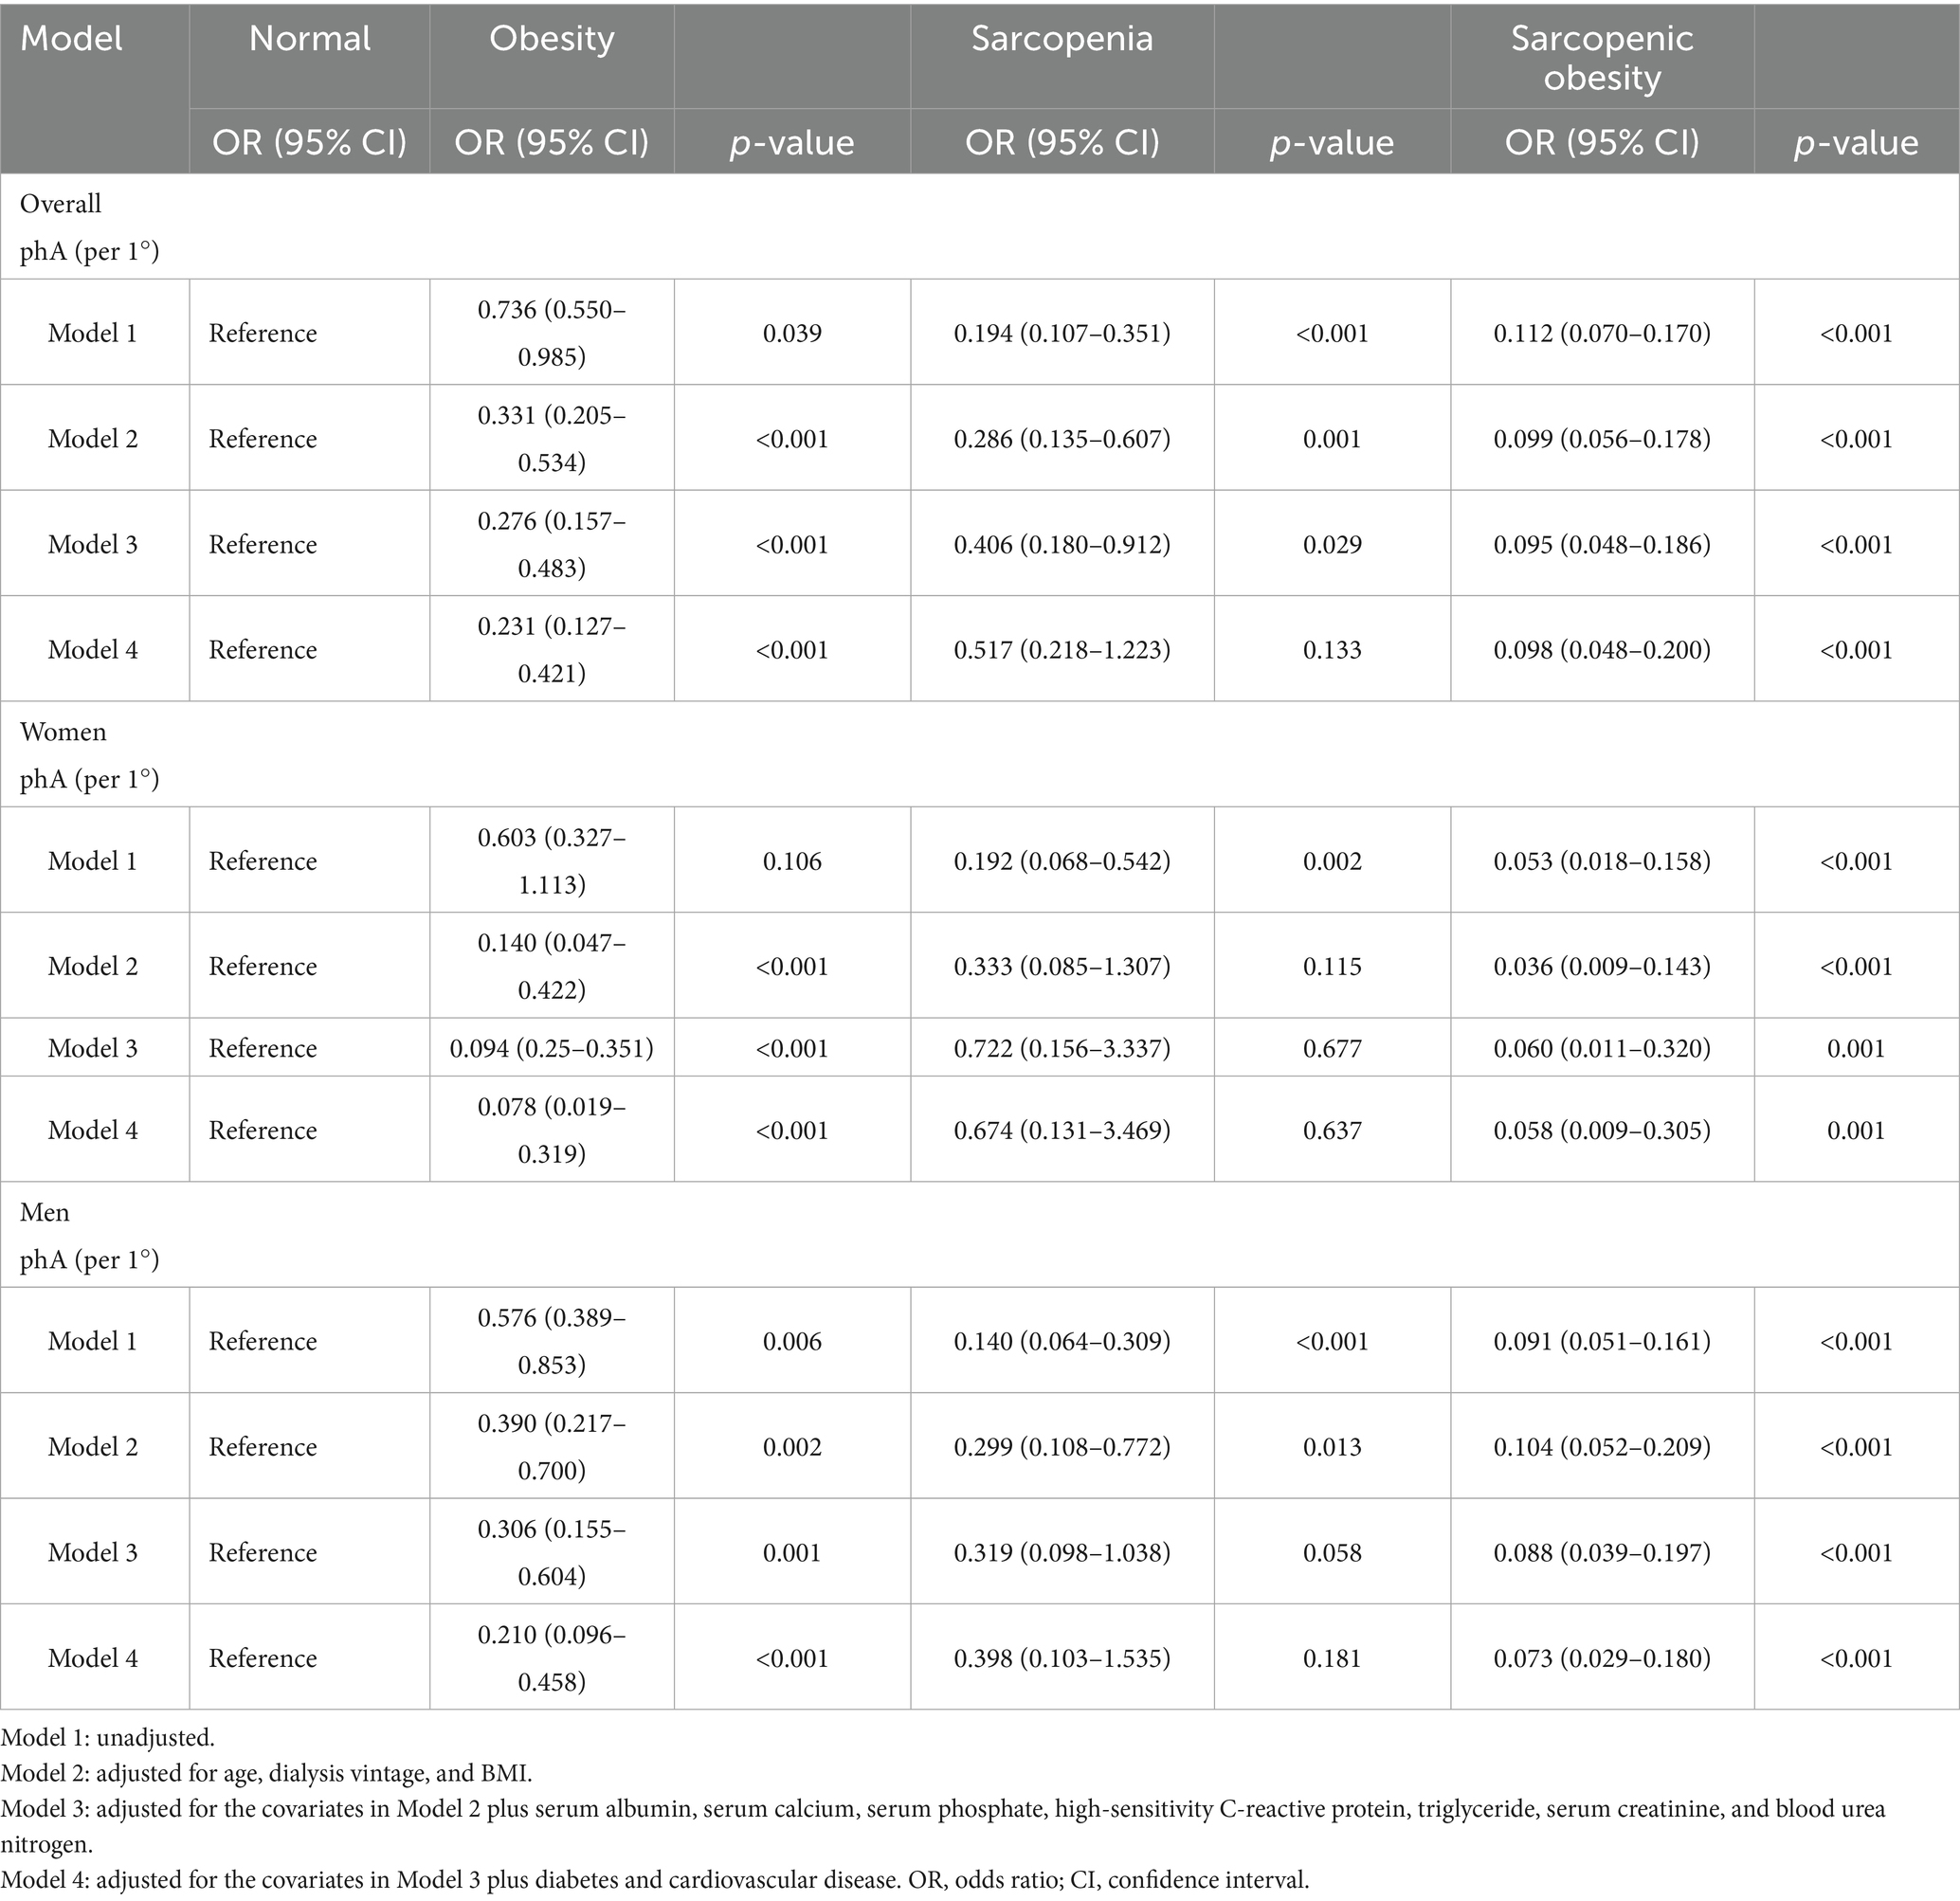
Table 2. Multinomial logistic regression analysis of sarcopenic obesity risk according to phase angle values.
Assessment of the dose–response relationship between PhA and SO using restricted cubic spline analysis revealed that the overall model was highly statistically significant (p < 0.0001) and demonstrated good discriminative ability (C-statistic = 0.818). Although the nonlinear term did not reach statistical significance (p-nonlinear = 0.222), a clear inverse dose–response relationship was observed between PhA and the risk of SO (Figure 3).
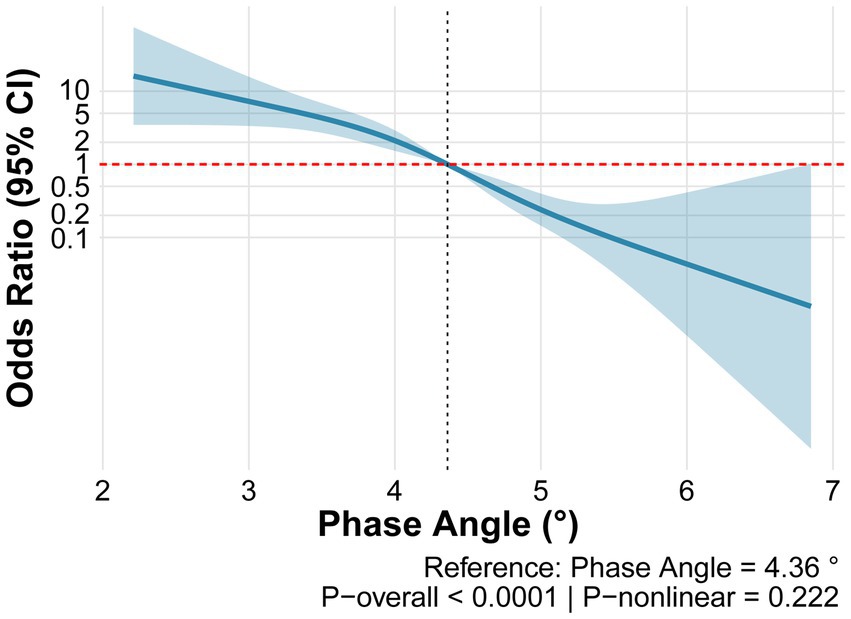
Figure 3. Restricted cubic spline analysis of phase angle and sarcopenic obesity.
To precisely evaluate the independent association between PhA and body composition, Model 5 was constructed by further incorporating Kt/V and overhydration into the fully adjusted model (Model 4). As shown in Supplementary Table S4, after controlling for these two key dialysis-related confounders, the protective associations between PhA and all adverse body composition phenotypes were substantially strengthened: the adjusted odds ratio for SO decreased from 0.098 to 0.008 and for obesity from 0.231 to 0.045, and the association for sarcopenia alone shifted from non-significant to significant, with its odds ratio decreasing from 0.517 to 0.250.
To test for sex differences in the association between PhA angle and body composition phenotypes, we included an interaction term (PhA * sex) in the fully adjusted model. As shown in Supplementary Table S5, the sex interaction effect did not reach statistical significance for any of the body composition phenotypes (all p > 0.05). This indicates that the association between the PhA and body composition is consistent across the sexes.
Across all three dialysis vintage subgroups (short: <1 year, medium: 1–3 years, long: >3 years), PhA demonstrated significant inverse associations with SO, with highly consistent effect sizes (OR = 0.152, 0.158, and 0.173, respectively) (Supplementary Table S6).
3.3 ROC analysis for PhA to identify patients at risk of SO
Results of the ROC analyses are shown in Figure 4 and Table 3. PhA demonstrated moderate predictive accuracy for SO in all (AUC = 0.818, 95% CI: 0.777–0.859, p < 0.001), male (AUC = 0.841, 95% CI: 0.795–0.887, p < 0.001), and female (AUC = 0.836, 95% CI: 0.772–0.900, p < 0.001) participants. The cutoff value of PhA to discriminate SO from non-SO was 4.48° for all participants with 92.4% sensitivity and 60.3% specificity, 4.49° for male participants with 89.9% sensitivity, and 70.5% specificity, and 4.18° for female participants with 96.7% sensitivity and 62.1% specificity. To validate the stability of these cutoff values, we performed bootstrap resampling with 1,000 repetitions. The bootstrap means were highly consistent with the original estimates. The narrow bootstrap confidence intervals and minimal bias from the original values confirm the robustness of the proposed PhA cutoff values for identifying SO.
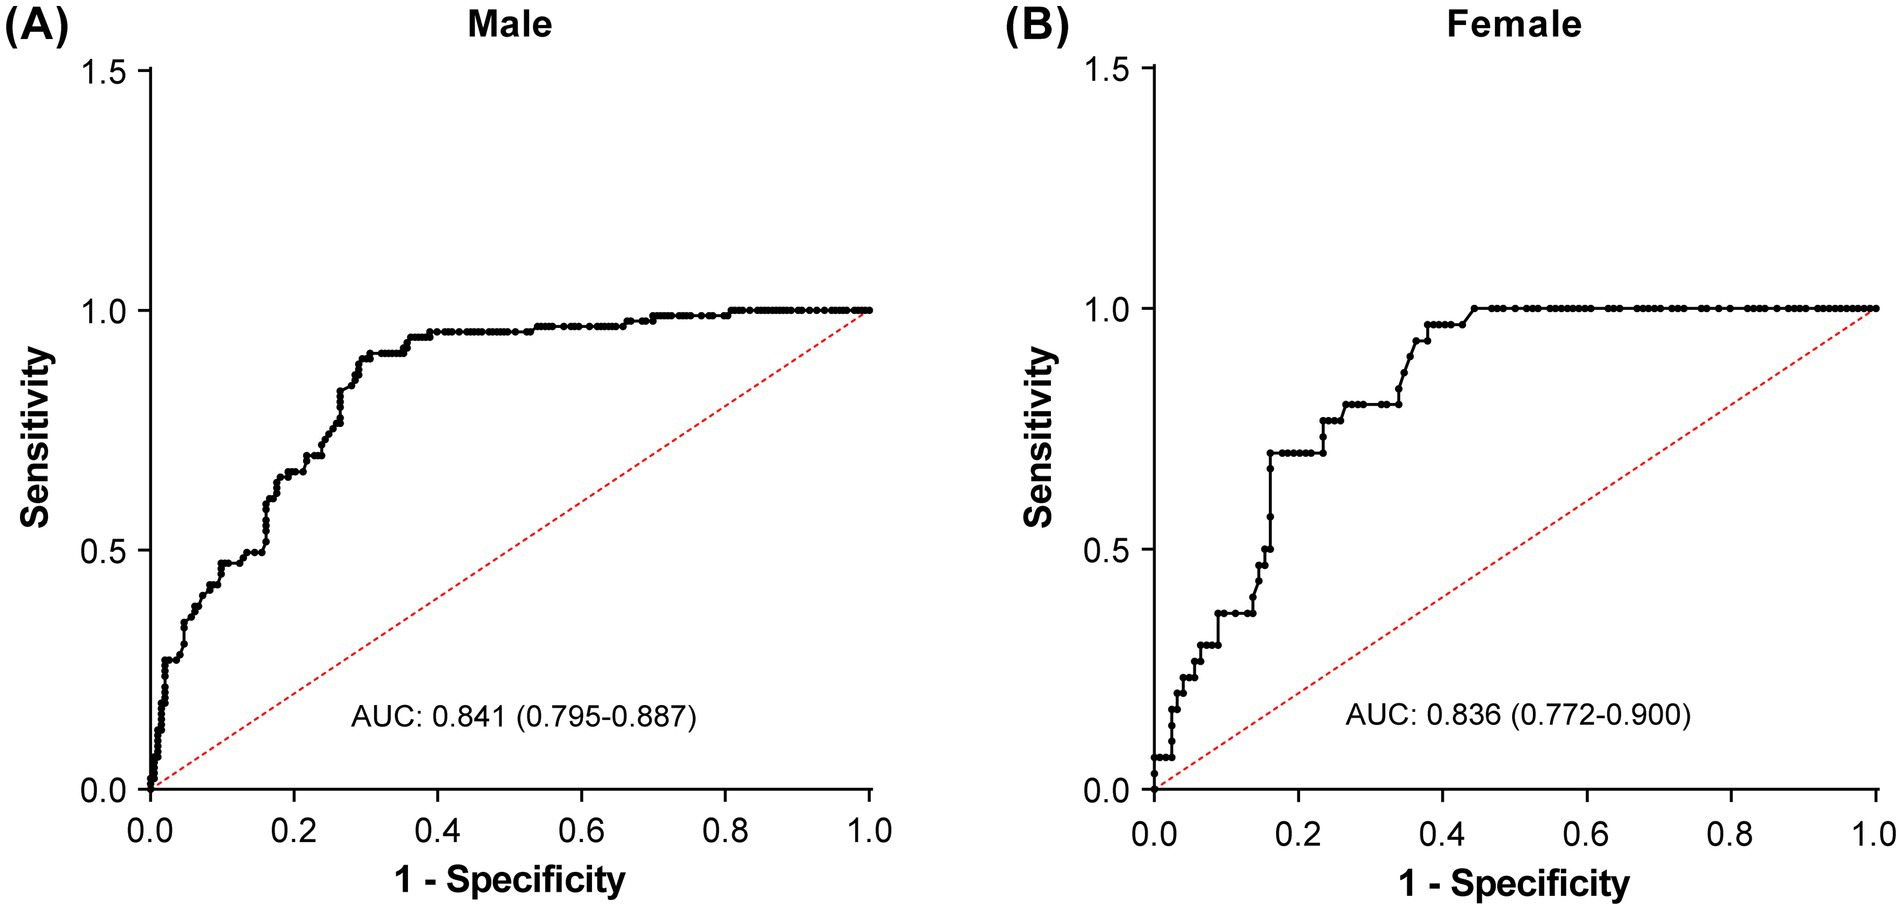
Figure 4. Receiver operating characteristic curves to identify the optimal phase angle cutoff values for detecting sarcopenic obesity in male (A) and female (B) participants.
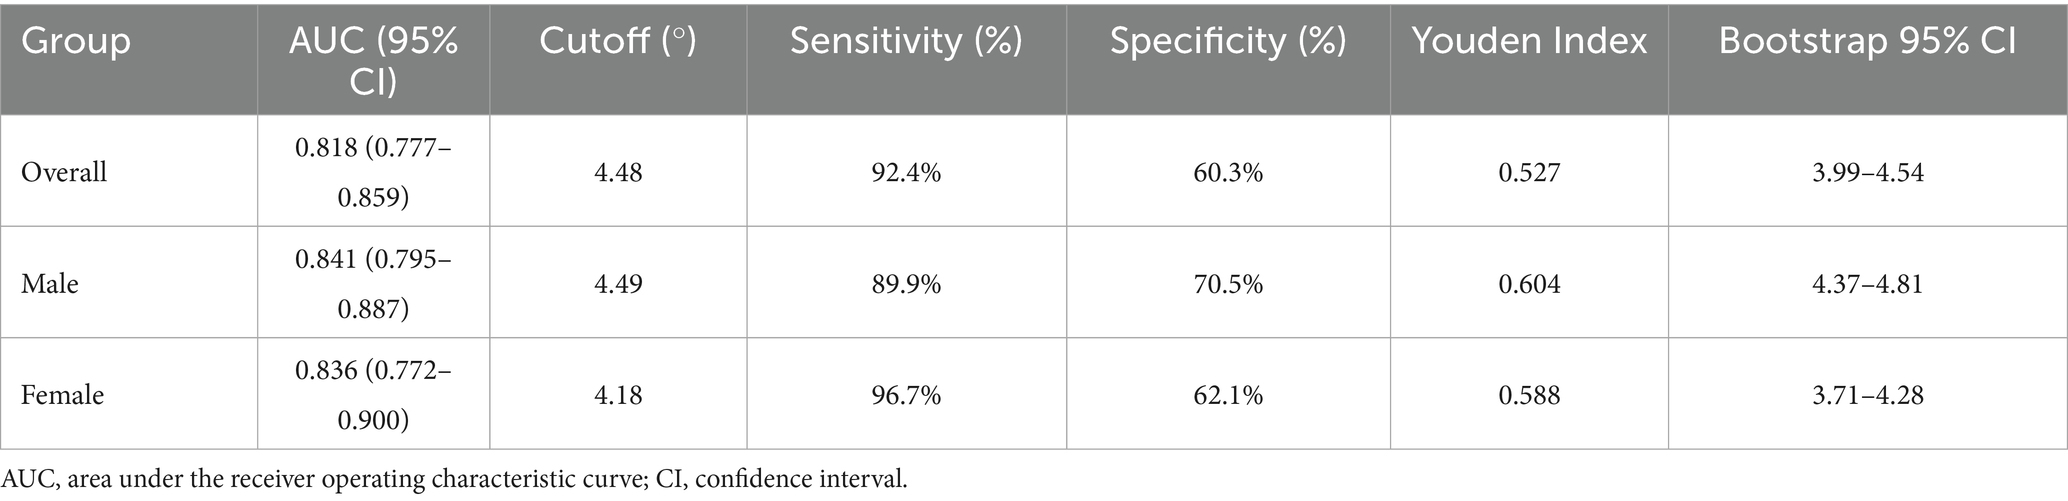
Table 3. Predictive ability of phase angle and cutoff values for sarcopenic obesity.
4 Discussion
To our knowledge, this is the first study to investigate the association between PhA and SO in patients undergoing HD. This study reports several major findings. First, PhA was significantly associated with SO, even after multivariable adjustments. Second, PhA was more strongly associated with SO than sarcopenia or obesity alone. Third, the optimal cutoff values of PhA for predicting SO were 4.49° for men and 4.18° for women. These findings suggest that PhA is suitable for SO risk stratification, as it is an objective, easily obtainable, non-invasive, and low-cost indicator that minimizes bias for both patients and evaluators.
According to previous studies, the prevalence of SO is increasing because of the aging population worldwide. Its prevalence ranges from 8 to 10% among older adults (12, 13). In our study, SO was present in 27% of patients with ESRD, a prevalence comparable to that in previous studies on patients undergoing HD (11, 29), but obviously higher than that in older adults. However, sarcopenia is frequently overlooked in obese patients. Many patients have excess adiposity concurrent with sarcopenia (9), a condition often missed by BMI assessment alone, leading to clinical misclassification. Notably, patients with SO face a higher mortality risk compared to those with either obesity or sarcopenia alone (10). These findings highlight the critical need to manage SO and develop convenient, non-invasive, and objective tools for its routine assessment in patients undergoing HD.
PhA is a measure of cell stability estimated and interpreted using BIA and serves as a simple and rapid tool in clinical settings (30). As a raw parameter not derived from specific equations, PhA has been shown to reflect cell membrane structure, cell mass, cellular integrity, and cell function, with higher PhA levels indicating better overall cellular health (31). Age, sex, and BMI constitute some of the most important determinants of PhA in healthy populations. Higher PhA values are typically observed in younger individuals and men, attributable to a more favorable body composition characterized by a lower fat percentage and higher muscle mass (32). The present study also found that PhA decreased with age and was lower in women compared to men. Furthermore, after adjusting for multiple variables, logistic regression analysis in our study showed that a low PhA remained significantly associated with SO in patients undergoing HD, regardless of sex. Similarly, Guida et al. (33) demonstrated that overweight and obese patients exhibited a significantly lower PhA, indicating impaired cellular integrity despite higher adiposity. Ding et al. (34) identified PhA as an independent predictor of sarcopenia in patients undergoing HD. This association is consistently observed in populations with diabetes mellitus (35) and post-stroke status (36). Furthermore, PhA was more strongly associated with SO than with sarcopenia or obesity alone, further expanding our understanding of the clinical value of PhA.
Although the exact mechanisms responsible for the association between low PhA and SO remain unclear, studies have shown that PhA is associated with inflammation (37), muscle mass (32), and physical function (38). Specifically, lower PhA values are closely linked to elevated levels of pro-inflammatory cytokines and oxidative stress markers, which collectively promote muscle protein breakdown via ubiquitin-proteasome activation and impair insulin/IGF-1 anabolic signaling pathways (20, 21). Moreover, PhA has been studied as a prognostic marker in several clinical conditions often linked to obesity, including metabolic dysfunction, insulin resistance, and disability, likely due to alterations in cell size and cell membrane permeability (39). These inflammatory and metabolic disturbances create a state of anabolic resistance, further accelerating muscle loss while promoting ectopic fat infiltration into the skeletal muscle (40). It is important to note that these potential mechanistic pathways, while supported by the existing literature, were not directly assessed in this study.
In patients undergoing HD, typical body composition changes over time include body fat gain accompanied by loss of lean mass (41). Muscle loss reduces the basal metabolic rate, physical activity, and energy expenditure in the body, leading to increased fat storage. Higher fat mass produces an excess of proinflammatory cytokines, which stimulate muscle degradation (14). In addition, obesity-related hormonal disturbances can lead to resistance to growth factors, other hormones, amino acids, and the effects of physical exercise, also known as anabolic resistance, which contributes to sarcopenia (42). Thus, the significant association between low PhA and SO suggests that PhA may serve as an indicator of the underlying vicious cycle involving chronic inflammation, oxidative stress, and anabolic resistance. Therefore, assessing PhA might offer a practical approach for early screening and initial stage management of SO.
PhA is a widely used nutritional assessment tool in conditions such as colorectal cancer, liver cirrhosis, and head and neck cancer (43, 44), and it also reflects nutritional status in ESRD (45). A previous study suggested a PhA cutoff value of 4.6° for detecting protein-energy wasting in patients undergoing dialysis (46). Ding et al. (34) subsequently confirmed that a PhA of <4.67° is an independent risk predictor for patients undergoing dialysis with sarcopenia. Despite studies on the association between PhA and nutritional status, none have explored the threshold of PhA for SO identification in patients undergoing HD. In our study, the optimal PhA cutoff value for SO was 4.48°, which is lower than these values. This lower cutoff value likely reflects more severe conditions and poorer cellular function in patients undergoing HD with SO compared to those with protein-energy wasting or sarcopenia (14, 29). Notably, our cutoff value was higher than that reported for post-stroke patients (4.29° for men and 3.84° for women) (36), underscoring the substantial variation in PhA thresholds across disease contexts. Moreover, the ROC analysis in our study demonstrated that PhA exhibited good discriminative ability for predicting SO (AUC = 0.818) in the overall cohort. The optimal PhA cutoff value was 4.48°, yielding a sensitivity of 92.4% and a specificity of 60.3%. High sensitivity indicates effectiveness in identifying true SO cases and minimizing false negatives, establishing PhA as a highly sensitive screening tool. We therefore propose integrating PhA assessment into routine HD care to enable early SO identification in this high-risk population.
This study had several strengths. First, this study investigated the association between PhA and SO and established optimal PhA cutoff values for SO identification in patients undergoing HD, thus providing valuable tools for improving nutritional assessment and risk stratification. Second, this study indicated a stronger association between PhA and SO than between PhA and sarcopenia or obesity alone in patients undergoing HD. Subgroup analyses and detailed ascertainment of potential confounders increased the reliability of the results. Despite all the research efforts, this study had some limitations. First, as this is a cross-sectional study, the design inherently precludes the inference of causality. Thus, it could only examine the associations between the PhA and SO categories. To establish a temporal sequence and verify our findings, future longitudinal cohort studies or interventional trials are necessary. Second, the focus on a Chinese cohort may limit generalizability, as ethnicity, geography, and population characteristics significantly influence PhA values. Asian populations typically exhibit lower PhA baselines due to differences in body composition and cellular integrity compared to Western groups (47). While our findings provide critical insights into similar East Asian demographics, external validation in multiethnic cohorts is essential to establish universally applicable cutoff values and clinical standards. Third, residual confounding may exist from unmeasured lifestyle factors, such as detailed dietary intake and physical activity levels, which could influence both PhA and body composition outcomes. Finally, we acknowledge that BIA is not the gold standard for body composition assessment compared to computed tomography or magnetic resonance imaging. Nevertheless, it is a noninvasive, economical, portable, and safe method. Bioimpedance measurements are comparable to those of dual-energy X-ray absorptiometry (48). Recently, BIA has been recognized as an ideal tool for assessing body composition in both the general population and in patients undergoing HD (49, 50).
5 Conclusion
In summary, this study found that low PhA values were independently associated with an increased risk of SO in both men and women. Additionally, PhA showed moderate accuracy in detecting SO, with cutoff values of 4.49° for men and 4.18° for women. These findings suggest that PhA may be a potential marker for identifying patients undergoing HD at risk for SO, although further studies are needed to confirm its clinical applicability.
Data availability statement
The raw data supporting the conclusions of this article will be made available by the authors, without undue reservation.
Ethics statement
The studies involving humans were approved by the Ethics Committee of Hangzhou TCM Hospital Affiliated to Zhejiang Chinese Medical University. The studies were conducted in accordance with the local legislation and institutional requirements. The participants provided their written informed consent to participate in this study. Written informed consent was obtained from the individual(s) for the publication of any potentially identifiable images or data included in this article.
Author contributions
LinC: Conceptualization, Formal analysis, Investigation, Methodology, Software, Writing – original draft, Writing – review & editing. LiyC: Data curation, Formal analysis, Investigation, Writing – original draft. RY: Conceptualization, Data curation, Methodology, Writing – original draft. RT: Data curation, Formal analysis, Supervision, Writing – review & editing. MX: Writing – review & editing. HZ: Conceptualization, Data curation, Formal analysis, Funding acquisition, Investigation, Project administration, Resources, Validation, Writing – original draft, Writing – review & editing.
Funding
The author(s) declare that financial support was received for the research and/or publication of this article. This study was supported by the Medical Scientific Research Foundation of Zhejiang Province, China (Grant No. 2019KY138), and the Major Project of the Hangzhou Health Science and Technology Program (Grant No. Z20240017).
Acknowledgments
We are grateful to all participants in this study for their support, time, and patience. We also thank the staff at the HD center for their patience and cooperation.
Conflict of interest
The authors declare that the research was conducted in the absence of any commercial or financial relationships that could be construed as a potential conflict of interest.
Generative AI statement
The authors declare that no GenAI was used in the creation of this manuscript.
Any alternative text (alt text) provided alongside figures in this article has been generated by Frontiers with the support of artificial intelligence and reasonable efforts have been made to ensure accuracy, including review by the authors wherever possible. If you identify any issues, please contact us.
Publisher’s note
All claims expressed in this article are solely those of the authors and do not necessarily represent those of their affiliated organizations, or those of the publisher, the editors and the reviewers. Any product that may be evaluated in this article, or claim that may be made by its manufacturer, is not guaranteed or endorsed by the publisher.
Supplementary material
The Supplementary material for this article can be found online at: https://www.frontiersin.org/articles/10.3389/fnut.2025.1684789/full#supplementary-material
References
1. Donini, LM, Busetto, L, Bischoff, SC, Cederholm, T, Ballesteros-Pomar, MD, Batsis, JA, et al. Definition and diagnostic criteria for sarcopenic obesity: ESPEN and EASO consensus statement. Obes Facts. (2022) 15:321–35. doi: 10.1159/000521241
2. Seo, DH, Suh, YJ, Cho, Y, Ahn, SH, Seo, S, Hong, S, et al. Effect of low skeletal muscle mass and sarcopenic obesity on chronic kidney disease in patients with type 2 diabetes. Obesity. (2022) 30:2034–43. doi: 10.1002/oby.23512
3. Hong, S, and Choi, KM. Sarcopenic obesity, insulin resistance, and their implications in cardiovascular and metabolic consequences. Int J Mol Sci. (2020) 21:494. doi: 10.3390/ijms21020494
4. Kooman, JP, Kotanko, P, Schols, AMWJ, Shiels, PG, and Stenvinkel, P. Chronic kidney disease and premature ageing. Nat Rev Nephrol. (2014) 10:732–42. doi: 10.1038/nrneph.2014.185
5. Duarte, MP, Almeida, LS, Neri, SGR, Oliveira, JS, Wilkinson, TJ, Ribeiro, HS, et al. Prevalence of sarcopenia in patients with chronic kidney disease: a global systematic review and meta-analysis. J Cachexia Sarcopenia Muscle. (2024) 15:501–12. doi: 10.1002/jcsm.13425
6. Carrero, JJ, Zawada, AM, Wolf, M, Stuard, S, Canaud, B, Gauly, A, et al. Evolution of body composition and wasting indicators by time of day of haemodialysis. Nephrol Dial Transplant. (2021) 36:346–54. doi: 10.1093/ndt/gfaa253
7. Ng, JK-C, Chan, GC-K, Kam, KK-H, Tian, N, Than, WH, Cheng, PM-S, et al. The impact of volume overload on the longitudinal change of adipose and lean tissue mass in incident Chinese peritoneal dialysis patients. Nutrients. (2022) 14:4076. doi: 10.3390/nu14194076
8. Parthasarathy, R, Oei, E, and Fan, SL. Clinical value of body composition monitor to evaluate lean and fat tissue mass in peritoneal dialysis. Eur J Clin Nutr. (2019) 73:1520–8. doi: 10.1038/s41430-019-0391-3
9. Ishimura, E, Okuno, S, Nakatani, S, Mori, K, Miyawaki, J, Okazaki, H, et al. Significant association of diabetes with mortality of chronic hemodialysis patients, independent of the presence of obesity, sarcopenia, and sarcopenic obesity. J Ren Nutr. (2022) 32:94–101. doi: 10.1053/j.jrn.2021.07.003
10. Sabatino, A, Avesani, CM, Regolisti, G, Adinolfi, M, Benigno, G, Delsante, M, et al. Sarcopenic obesity and its relation with muscle quality and mortality in patients on chronic hemodialysis. Clin Nutr. (2023) 42:1359–68. doi: 10.1016/j.clnu.2023.06.032
11. Tian, M, Yuan, J, Yu, F, He, P, Zhang, Q, and Zha, Y. Decreased intracellular water is associated with sarcopenic obesity in chronic haemodialysis patients. BMC Geriatr. (2023) 23:630. doi: 10.1186/s12877-023-04357-4
12. Rossi, AP, Urbani, S, Fantin, F, Nori, N, Brandimarte, P, Martini, A, et al. Worsening disability and hospitalization risk in sarcopenic obese and dynapenic abdominal obese: a 5.5 years follow-up study in elderly men and women. Front Endocrinol. (2020) 11:314. doi: 10.3389/fendo.2020.00314
13. Gao, Q, Mei, F, Shang, Y, Hu, K, Chen, F, Zhao, L, et al. Global prevalence of sarcopenic obesity in older adults: a systematic review and meta-analysis. Clin Nutr. (2021) 40:4633–41. doi: 10.1016/j.clnu.2021.06.009
14. De Oliveira Matos, B, da Costa Rosa, CS, Ribeiro, HS, Marcos, NM, Losilla, MPR, Monteiro, HL, et al. Obesity phenotypes are, in part, associated with physical activity in diabetic hemodialysis patients. Int Urol Nephrol. (2022) 54:1751–9. doi: 10.1007/s11255-021-03060-w
15. Tian, SL, Zhang, K, and Xu, PC. Increased prevalence of peripheral arterial disease in patients with obese sarcopenia undergoing hemodialysis. Exp Ther Med. (2018) 15:5148–52. doi: 10.3892/etm.2018.6002
16. Kato, A, Ishida, J, Endo, Y, Takita, T, Furuhashi, M, Maruyama, Y, et al. Association of abdominal visceral adiposity and thigh sarcopenia with changes of arteriosclerosis in haemodialysis patients. Nephrol Dial Transplant. (2011) 26:1967–76. doi: 10.1093/ndt/gfq652
17. Martinson, M, Ikizler, TA, Morrell, G, Wei, G, Almeida, N, Marcus, RL, et al. Associations of body size and body composition with functional ability and quality of life in hemodialysis patients. Clin J Am Soc Nephrol. (2014) 9:1082–90. doi: 10.2215/CJN.09200913
18. Martins, PC, Alves Junior, CAS, Silva, AM, and Silva, DAS. Phase angle and body composition: a scoping review. Clin Nutr ESPEN. (2023) 56:237–50. doi: 10.1016/j.clnesp.2023.05.015
19. Da Silva, BR, Gonzalez, MC, Cereda, E, and Prado, CM. Exploring the potential role of phase angle as a marker of oxidative stress: a narrative review. Nutrition. (2022) 93:111493. doi: 10.1016/j.nut.2021.111493
20. da Silva, BR, Orsso, CE, Gonzalez, MC, JMF, S, Mialich, MS, Jordao, AA, et al. Phase angle and cellular health: inflammation and oxidative damage. Rev Endocr Metab Disord. (2023) 24:543–62. doi: 10.1007/s11154-022-09775-0
21. Jung, UJ. Sarcopenic obesity: involvement of oxidative stress and beneficial role of antioxidant flavonoids. Antioxidants. (2023) 12:1063. doi: 10.3390/antiox12051063
22. Player, EL, Morris, P, Thomas, T, Chan, WY, Vyas, R, Dutton, J, et al. Bioelectrical impedance analysis (BIA)-derived phase angle (PA) is a practical aid to nutritional assessment in hospital in-patients. Clin Nutr. (2019) 38:1700–6. doi: 10.1016/j.clnu.2018.08.003
23. Ramos da Silva, B, Mialich, MS, Cruz, LP, Rufato, S, Gozzo, T, and Jordao, AA. Performance of functionality measures and phase angle in women exposed to chemotherapy for early breast cancer. Clin Nutr ESPEN. (2021) 42:105–16. doi: 10.1016/j.clnesp.2021.02.007
24. Ruiz-Margáin, A, Xie, JJ, Román-Calleja, BM, Pauly, M, White, MG, Chapa-Ibargüengoitia, M, et al. Phase angle from bioelectrical impedance for the assessment of sarcopenia in cirrhosis with or without ascites. Clin Gastroenterol Hepatol. (2021) 19:1941–9.e2. doi: 10.1016/j.cgh.2020.08.066
25. Faul, F, Erdfelder, E, Lang, AG, and Buchner, A. G*power 3: a flexible statistical power analysis program for the social, behavioral, and biomedical sciences. Behav Res Methods. (2007) 39:175–91. doi: 10.3758/bf03193146
26. Chen, LK, Woo, J, Assantachai, P, Auyeung, TW, Chou, MY, Iijima, K, et al. Asian working group for sarcopenia: 2019 consensus update on sarcopenia diagnosis and treatment. J Am Med Dir Assoc. (2020) 21:300–307.e2. doi: 10.1016/j.jamda.2019.12.012
27. Lin, TY, Liu, JS, and Hung, SC. Obesity and risk of end-stage renal disease in patients with chronic kidney disease: a cohort study. Am J Clin Nutr. (2018) 108:1145–53. doi: 10.1093/ajcn/nqy200
28. Lin, TY, Wu, MY, Chen, HS, Hung, SC, and Lim, PS. Development and validation of a multifrequency bioimpedance spectroscopy equation to predict appendicular skeletal muscle mass in hemodialysis patients. Clin Nutr. (2021) 40:3288–95. doi: 10.1016/j.clnu.2020.10.056
29. Zhou, C, Zhan, L, He, P, Yuan, J, and Zha, Y. Associations of sarcopenic obesity vs either sarcopenia or obesity alone with cognitive impairment risk in patients requiring maintenance hemodialysis. Nutr Clin Pract. (2023) 38:1115–23. doi: 10.1002/ncp.11044
30. Xu, Y, Xie, X, Duan, Y, Wang, L, Cheng, Z, and Cheng, J. A review of impedance measurements of whole cells. Biosens Bioelectron. (2016) 77:824–36. doi: 10.1016/j.bios.2015.10.027
31. Lukaski, HC. Evolution of bioimpedance: a circuitous journey from estimation of physiological function to assessment of body composition and a return to clinical research. Eur J Clin Nutr. (2013) 67:S2–9. doi: 10.1038/ejcn.2012.149
32. Akamatsu, Y, Kusakabe, T, Arai, H, Yamamoto, Y, Nakao, K, Ikeue, K, et al. Phase angle from bioelectrical impedance analysis is a useful indicator of muscle quality. J Cachexia Sarcopenia Muscle. (2022) 13:180–9. doi: 10.1002/jcsm.12860
33. Guida, B, De Nicola, L, Pecoraro, P, Trio, R, Di Paola, F, Iodice, C, et al. Abnormalities of bioimpedance measures in overweight and obese hemodialyzed patients. Int J Obes. (2001) 25:265–72. doi: 10.1038/sj.ijo.0801475
34. Ding, Y, Chang, L, Zhang, H, and Wang, S. Predictive value of phase angle in sarcopenia in patients on maintenance hemodialysis. Nutrition. (2022) 94:111527. doi: 10.1016/j.nut.2021.111527
35. Hafızoğlu, M, Yıldırım, HK, Öztürk, Y, Şahiner, Z, Karaduman, D, Atbaş, C, et al. Assessment of phase angle as a novel indicator for sarcopenic obesity according to the ESPEN/EASO criteria in older adults with diabetes mellitus. Nutrition. (2024) 123:112412. doi: 10.1016/j.nut.2024.112412
36. Yoshimura, Y, Wakabayashi, H, Nagano, F, Matsumoto, A, Shimazu, S, Shiraishi, A, et al. Phase angle is associated with sarcopenic obesity in post-stroke patients. Clin Nutr. (2023) 42:2051–7. doi: 10.1016/j.clnu.2023.08.018
37. Bae, E, Lee, TW, Bae, W, Kim, S, Choi, J, Jang, HN, et al. Impact of phase angle and sarcopenia estimated by bioimpedance analysis on clinical prognosis in patients undergoing hemodialysis. Medicine (Baltimore). (2022) 101:e29375. doi: 10.1097/MD.0000000000029375
38. De Souza Francisco, D, Moraes, IG, Brito, CP, Righetti, RF, and Yamaguti, WP. The phase angle cut-off point capable of discriminating hemodialysis patients with reduced exercise tolerance: a cross-sectional study. BMC Sports Sci Med Rehabil. (2024) 16:34. doi: 10.1186/s13102-024-00825-5
39. Cancello, R, Brunani, A, Brenna, E, Soranna, D, Bertoli, S, Zambon, A, et al. Phase angle (PhA) in overweight and obesity: evidence of applicability from diagnosis to weight changes in obesity treatment. Rev Endocr Metab Disord. (2023) 24:451–64. doi: 10.1007/s11154-022-09774-1
40. Addison, O, Marcus, RL, LaStayo, PC, and Ryan, AS. Intermuscular fat: a review of the consequences and causes. Int J Endocrinol. (2014) 2014:309570. doi: 10.1155/2014/309570
41. Marcelli, D, Brand, K, Ponce, P, Milkowski, A, Marelli, C, Ok, E, et al. Longitudinal changes in body composition in patients after initiation of hemodialysis therapy: results from an international cohort. J Ren Nutr. (2016) 26:72–80. doi: 10.1053/j.jrn.2015.10.001
42. Tantisattamo, E, Kalantar-Zadeh, K, Halleck, F, Duettmann, W, Naik, M, and Budde, K. Novel approaches to sarcopenic obesity and weight management before and after kidney transplantation. Curr Opin Nephrol Hypertens. (2021) 30:14–26. doi: 10.1097/MNH.0000000000000673
43. Grundmann, O, Yoon, SL, and Williams, JJ. The value of bioelectrical impedance analysis and phase angle in the evaluation of malnutrition and quality of life in cancer patients—a comprehensive review. Eur J Clin Nutr. (2015) 69:1290–7. doi: 10.1038/ejcn.2015.126
44. Małecka-Massalska, T, Mlak, R, Smolen, A, and Morshed, K. Bioelectrical impedance phase angle and subjective global assessment in detecting malnutrition among newly diagnosed head and neck cancer patients. Eur Arch Otorrinolaringol. (2016) 273:1299–305. doi: 10.1007/s00405-015-3626-5
45. Han, BG, Lee, JY, Kim, JS, and Yang, JW. Clinical significance of phase angle in non-Dialysis CKD stage 5 and peritoneal Dialysis patients. Nutrients. (2018) 10:1331. doi: 10.3390/nu10091331
46. Tan, R, Liang, D, Liu, Y, Zhong, X, Zhang, D, and Ma, J. Bioelectrical impedance analysis–derived phase angle predicts protein–energy wasting in maintenance hemodialysis patients. J Ren Nutr. (2019) 29:295–301. doi: 10.1053/j.jrn.2018.09.001
47. Gonzalez, MC, Barbosa-Silva, TG, Bielemann, RM, Gallagher, D, and Heymsfield, SB. Phase angle and its determinants in healthy subjects: influence of body composition. Am J Clin Nutr. (2016) 103:712–6. doi: 10.3945/ajcn.115.116772
48. Thomson, R, Brinkworth, GD, Buckley, JD, Noakes, M, and Clifton, PM. Good agreement between bioelectrical impedance and dual-energy X-ray absorptiometry for estimating changes in body composition during weight loss in overweight young women. Clin Nutr. (2007) 26:771–7. doi: 10.1016/j.clnu.2007.08.003
49. Xu, Y, Li, X, Hu, T, Shen, Y, Xiao, Y, Wang, Y, et al. Neck circumference as a potential indicator of pre-sarcopenic obesity in a cohort of community-based individuals. Clin Nutr. (2024) 43:11–7. doi: 10.1016/j.clnu.2023.11.006
Keywords: sarcopenic obesity, nutritional status, phase angle, bioimpedance spectroscopy, hemodialysis
Citation: Cheng L, Chang L, Yang R, Tian R, Xiong M and Zhang H (2025) Phase angle as a novel indicator of sarcopenic obesity in patients undergoing hemodialysis. Front. Nutr. 12:1684789. doi: 10.3389/fnut.2025.1684789
Edited by:
Gerson Ferrari, University of Santiago, ChileReviewed by:
Adriyan Pramono, Diponegoro University, IndonesiaFatemeh Pourteymour Fard Tabrizi, Tabriz University of Medical Sciences, Iran
Mostafa Gouda, National Research Centre, Egypt
Copyright © 2025 Cheng, Chang, Yang, Tian, Xiong and Zhang. This is an open-access article distributed under the terms of the Creative Commons Attribution License (CC BY). The use, distribution or reproduction in other forums is permitted, provided the original author(s) and the copyright owner(s) are credited and that the original publication in this journal is cited, in accordance with accepted academic practice. No use, distribution or reproduction is permitted which does not comply with these terms.
*Correspondence: Hongmei Zhang, aHp6aGFuZ2hvbmdtZWlAMTYzLmNvbQ==