 Wenshuai Zheng
 Huaxin Chen2†
- 1Department of Hematology, Hainan Hospital of Chinese PLA General Hospital, Sanya, Hainan, China
- 2Department of Anesthesiology, Hainan Hospital of Chinese PLA General Hospital, Sanya, Hainan, China
- 3Department of Pediatrics, Hainan Hospital of Chinese PLA General Hospital, Sanya, Hainan, China
- 4Department of Osteology, Hainan Hospital of Chinese PLA General Hospital, Sanya, Hainan, China
- 5Department of Rehabilitation Medicine, Hainan Hospital of Chinese PLA General Hospital, Sanya, Hainan, China
Background: As a common complication of chronic kidney disease (CKD), anemia is associated with increased mortality and reduced quality of life. Despite its severe impact, there is a lack of high-quality data on the global burden of anemia attributed to CKD. This study aims to provide a comprehensive analysis of the anemia burden attributed to CKD.
Methods: Using data from the Global Burden of Disease study (GBD) 2021, we report the prevalence and years lived with disability (YLDs) of anemia attributed to CKD across different sexes, ages, and regions; assess the association between anemia burden attributed to CKD and the socio-demographic index (SDI); and quantify and predict temporal trends of anemia burden attributed to CKD.
Results: In 2021, there were 63.75 million (95% uncertainty interval [UI]: 59.05 to 68.37) cases and 1.70 million (95% UI: 1.13 to 2.43) YLDs of anemia attributed to CKD globally. Compared with 1990, the prevalence and YLDs increased by 96.24 and 74.78%, respectively, which was largely driven by population growth and aging. The global age-standardized prevalence rate (ASPR) and YLD rate per 100,000 were 762.12 (95% UI: 707.32 to 817.37) and 20.34 (95% UI: 13.54 to 29.09) in 2021, which decreased by 9.39 and 18.93% in comparison with those in 1990. However, the decline in ASPR stagnated after 2010, with a slight increase observed between 2010 and 2015. A negative relationship between SDI and the anemia burden attributed to CKD was observed at both regional and national levels. Women had higher ASPR and age-standardized YLD rates compared to men, and the burden attributed to CKD increased with age. Predictive analysis indicated that the prevalence of cases will continue to rise, while the YLDs, ASPR, and age-standardized YLD rates are expected to decline consistently.
Conclusion: Anemia attributed to CKD is a major public health issue across the world, with persistent regional and socioeconomic disparities. Continued efforts, including addressing socioeconomic disparities, improving access to healthcare, and innovative treatments, are essential to reduce the anemia burden attributed to CKD.
Introduction
Chronic kidney disease (CKD) represents a growing global public health challenge, imposing a substantial economic burden on both affected families and healthcare systems worldwide. Approximately 10% of adults are affected by CKD globally (1), with a prevalence exceeding 40% among individuals aged over 60 (2, 3).
Anemia is a frequent complication of CKD that typically arises from reduced erythropoietin production, impaired iron metabolism, nutritional deficits, and oxidative stress (4). Anemia attributed to CKD is associated with numerous adverse outcomes, including increased morbidity and mortality, as well as reduced quality of life (5–8). A Swedish cohort study involving 14,415 CKD patients reported that anemia was associated with a 2.5-fold higher risk of major adverse cardiovascular events (9). Previous studies on the anemia burden attributed to CKD have revealed a high and variable prevalence, ranging from 15.4 to 91.9% across different regions (10–14). This high prevalence represents a significant clinical and economic concern, as patients with both CKD and anemia utilize more healthcare resources and incur higher costs compared to those without anemia (15–17). Economic analyses underscore the considerable costs of anemia management, particularly among dialysis-dependent patients, with annual expenditures exceeding US$76.8 billion in the United States alone (18).
Early screening and optimal management of anemia attributed to CKD have been shown to reduce morbidity and mortality and improve patients’ quality of life (7, 19), particularly considering the fact that the incidence and mortality of CKD increased consistently (20, 21). However, high-quality, internally consistent, and comprehensive estimates of the anemia burden attributed to CKD are lacking, limiting the development of targeted intervention strategies. Previous evaluations have often addressed anemia attributed to CKD within the broader context of anemia burden or in specific regions (22–24). The Global Burden of Disease (GBD) Study 2021 provides a reliable framework for assessing the current prevalence and years lived with disability (YLDs) of anemia attributed to CKD (25). Although previous studies using GBD assessed the anemia burden for all causes, they did not specifically estimate the anemia burden attributed to CKD (22, 23). Therefore, this study aims to describe the global anemia burden attributed to CKD, including prevalence and YLDs, with emphasis on age, gender, and regional distributions, as well as temporal trends from 1990 to 2021, which have been rarely described in previous studies. These findings would inform specific interventions, including treatment planning, resource allocation, and the development of prevention strategies.
Methods
Data source
We conducted a secondary analysis of the GBD 2021 study.1 The detailed methods used for the GBD 2021 study have been described elsewhere (25, 26). In brief, the 2021 GBD study includes nationally representative surveys, censuses, and meta-analysis results and provides an accessible epidemiological assessment of 371 diseases, injuries, and impairments, as well as 88 risk factors, encompassing 204 nations and territories, utilizing the most recent epidemiological data and enhanced standardized methodologies. The GBD 2021 utilized data from a variety of sources, including peer-reviewed literature, survey data, disease registers, and hospital inpatient records, to ensure the quality and comprehensiveness of the anemia-related analysis. The data were then synthesized with the Cause of Death Ensemble model, spatiotemporal Gaussian process regression, and a Bayesian meta-regression modeling tool (DisMod-MR 2.1). The GBD study provides a standardized methodology for estimating the determinants and their 95% uncertainty interval (UI) of prevalence and YLDs in terms of absolute number, crude rate per 100,000 population, and age-standardized rate.
This study utilized the sociodemographic index (SDI)—a composite indicator based on estimates of total fertility rate in those younger than 25 years, mean years of education in individuals older than 15 years, and lag-distributed income per capita (27),—to explore the relationship between the anemia burden among WRA and the development status of a region or country. The SDI ranges from 0 (less developed) to 1 (most developed). The 204 countries and territories were classified into five SDI regions based on SDI quintiles in 2021: low, low-middle, middle, high-middle, and high.
This study adhered to the Guidelines for Accurate and Transparent Health Estimates Reporting (28). The study did not involve any personal or sensitive information. Consequently, no ethical approval was required for the execution of this study.
Disease definitions
Anemia is defined by reduced concentrations of hemoglobin (Hb) in the blood, irrespective of etiology, red blood cell morphology, or function. Anemia diagnosis follows the WHO hemoglobin thresholds (g/L) (29), including < 110 g/L for children aged 6–59 months and pregnant women, < 115 g/L for children aged 5–11 years of age, < 120 g/L for children aged 12–14 years and non-pregnant women (15 years of age and above), and < 130 g/L for men (15 years of age and above). CKD is defined as kidney injury or impaired renal function that persists for 3 months or longer, regardless of the cause (30). In the GBD 2021, the prevalence of anemia was estimated by generating counterfactual distributions based on age- and sex-specific prevalence of anemia-causing conditions and assessing their impact on blood hemoglobin concentration (25). The age- and sex-specific anemia prevalence for CKD was analyzed as part of the overall anemia causal attribution.
Statistical analysis
To identify the direction and magnitude of changes in the prevalence and YLDs of anemia attributed to CKD over time, we calculated the annual percentage change (APC) and the average APC (AAPC) and the corresponding 95% confidence interval (CI) with joinpoint regression analysis. A positive APC or AAPC indicates an increase, while a negative value indicates a decrease. In order to identify the year with the most marked changes, we detected trends in the data over time and fitted the optimal model curve to the data by segmenting the data into multiple linear pieces on a logarithmic graph using the joinpoint regression analysis. These segmented points are referred to as “joinpoints.” The “joinpoints” were data-driven, identified based on statistical significance. In detail, in the joinpoint regression analysis, a logarithmic linear model (ln y = β *x) is used for segmented regression, and the grid search method (GSM) is used to establish all possible connection points. The mean squared errors (MSEs) corresponding to each possible scenario are calculated, and the grid point with the smallest MSE is selected as the connection point. Then, the establishment of the optimal model for the regression of connection points (i.e., the number of connection points) is determined using the Monte Carlo permutation test. We set the maximum number of potential connection points to 4 and the minimum number of potential connection points to 0 (26, 31).
To examine potential non-linear associations between anemia burden attributed to CKD and SDI, we utilized Pearson correlation analysis to estimate the strength and direction of correlations between SDI and age-standardized YLD rates. This approach helped identify nations where anemia prevalence and YLDs substantially diverged from expectations based on socioeconomic status. Such a comprehensive analysis clarifies how socioeconomic factors influence the anemia burden attributed to CKD.
The Bayesian age-period-cohort (BAPC) model was used to predict the prevalence, number of YLDs, and the rate of anemia attributed to CKD from 2022 to 2035. In brief, the age-period-cohort model, a logarithmic linear Poisson model, postulates the multiplicative impact of age, period, and cohort, all following a Poisson distribution and utilizing a link function specific to the model. The BAPC model is expressed as nij = log(λij) = μ + αi + βj + γk, where λij denotes the count of cases, μ denotes the intercept, and αi, βj, and γk signify the effect of age, period, and cohort, respectively (32, 33).
A robust decomposition method was used for the data analysis. This method attributes differences in prevalence and YLDs between two time points to changes in three independent factors: (a) the age structure of the population, the shifting of which toward greater numbers of older individuals are referred to as population aging, (b) population size, and (c) age-specific rate, which reflects the joint effect of all factors other than age structure and population size. In this method, the three two-way interactions are equally divided into relevant factors. Detailed derivations have been described in previous studies (34).
All analyses and visualizations were conducted in R version 4.3.3 (https://www.r-project.org) and JD_GBDR (V2.24, Jingdong Medical Technology Co., Ltd.). All statistical tests were two-sided, and p-values of < 0.05 were considered statistically significant.
Results
Global level
In 2021, there were 63.75 million (95% UI: 59.05 to 68.37) prevalence cases and 1.70 million (95% UI: 1.13 to 2.43) YLDs in anemia attributed to CKD across the globe. Compared to 1990, prevalence cases and YLDs in 2021 increased by 96.24 and 74.78%, respectively. However, the global age-standardized prevalence rate (ASPR) and age-standardized YLD rate of anemia attributed to CKD have decreased over the past 30 years. The ASPR per 100,000 population decreased from 841.18 (95% UI: 783.12 to 906.48) in 1990 to 762.12 (95% UI: 707.32 to 817.37) in 2021, with an AAPC of −0.317 (95% CI: −0.323 to −0.312) (Table 1; Figure 1A). In the same period, the age-standardized YLD rate per 100,000 population decreased from 25.09 (95% UI: 16.78 to 35.65) in 1990 to 20.34 (95% UI: 13.54 to 29.09) in 2021, with an AAPC of −0.673 (95% CI: −0.681 to −0.663) (Table 1; Figure 1B). As shown in Figure 1, the most significant decline in global ASPR occurred between 1990 and 1999 [APC = −0.867 (95% CI: −0.897 to −0.837)]. However, the decreased trend of ASPR stagnated after 2010, and there was a rising trend between 2010 and 2015 [APC = 0.245 (95% CI: 0.121 to 0.369)], which primarily contributed to the increase of ASPR in the high SDI (Supplementary Figure S1).
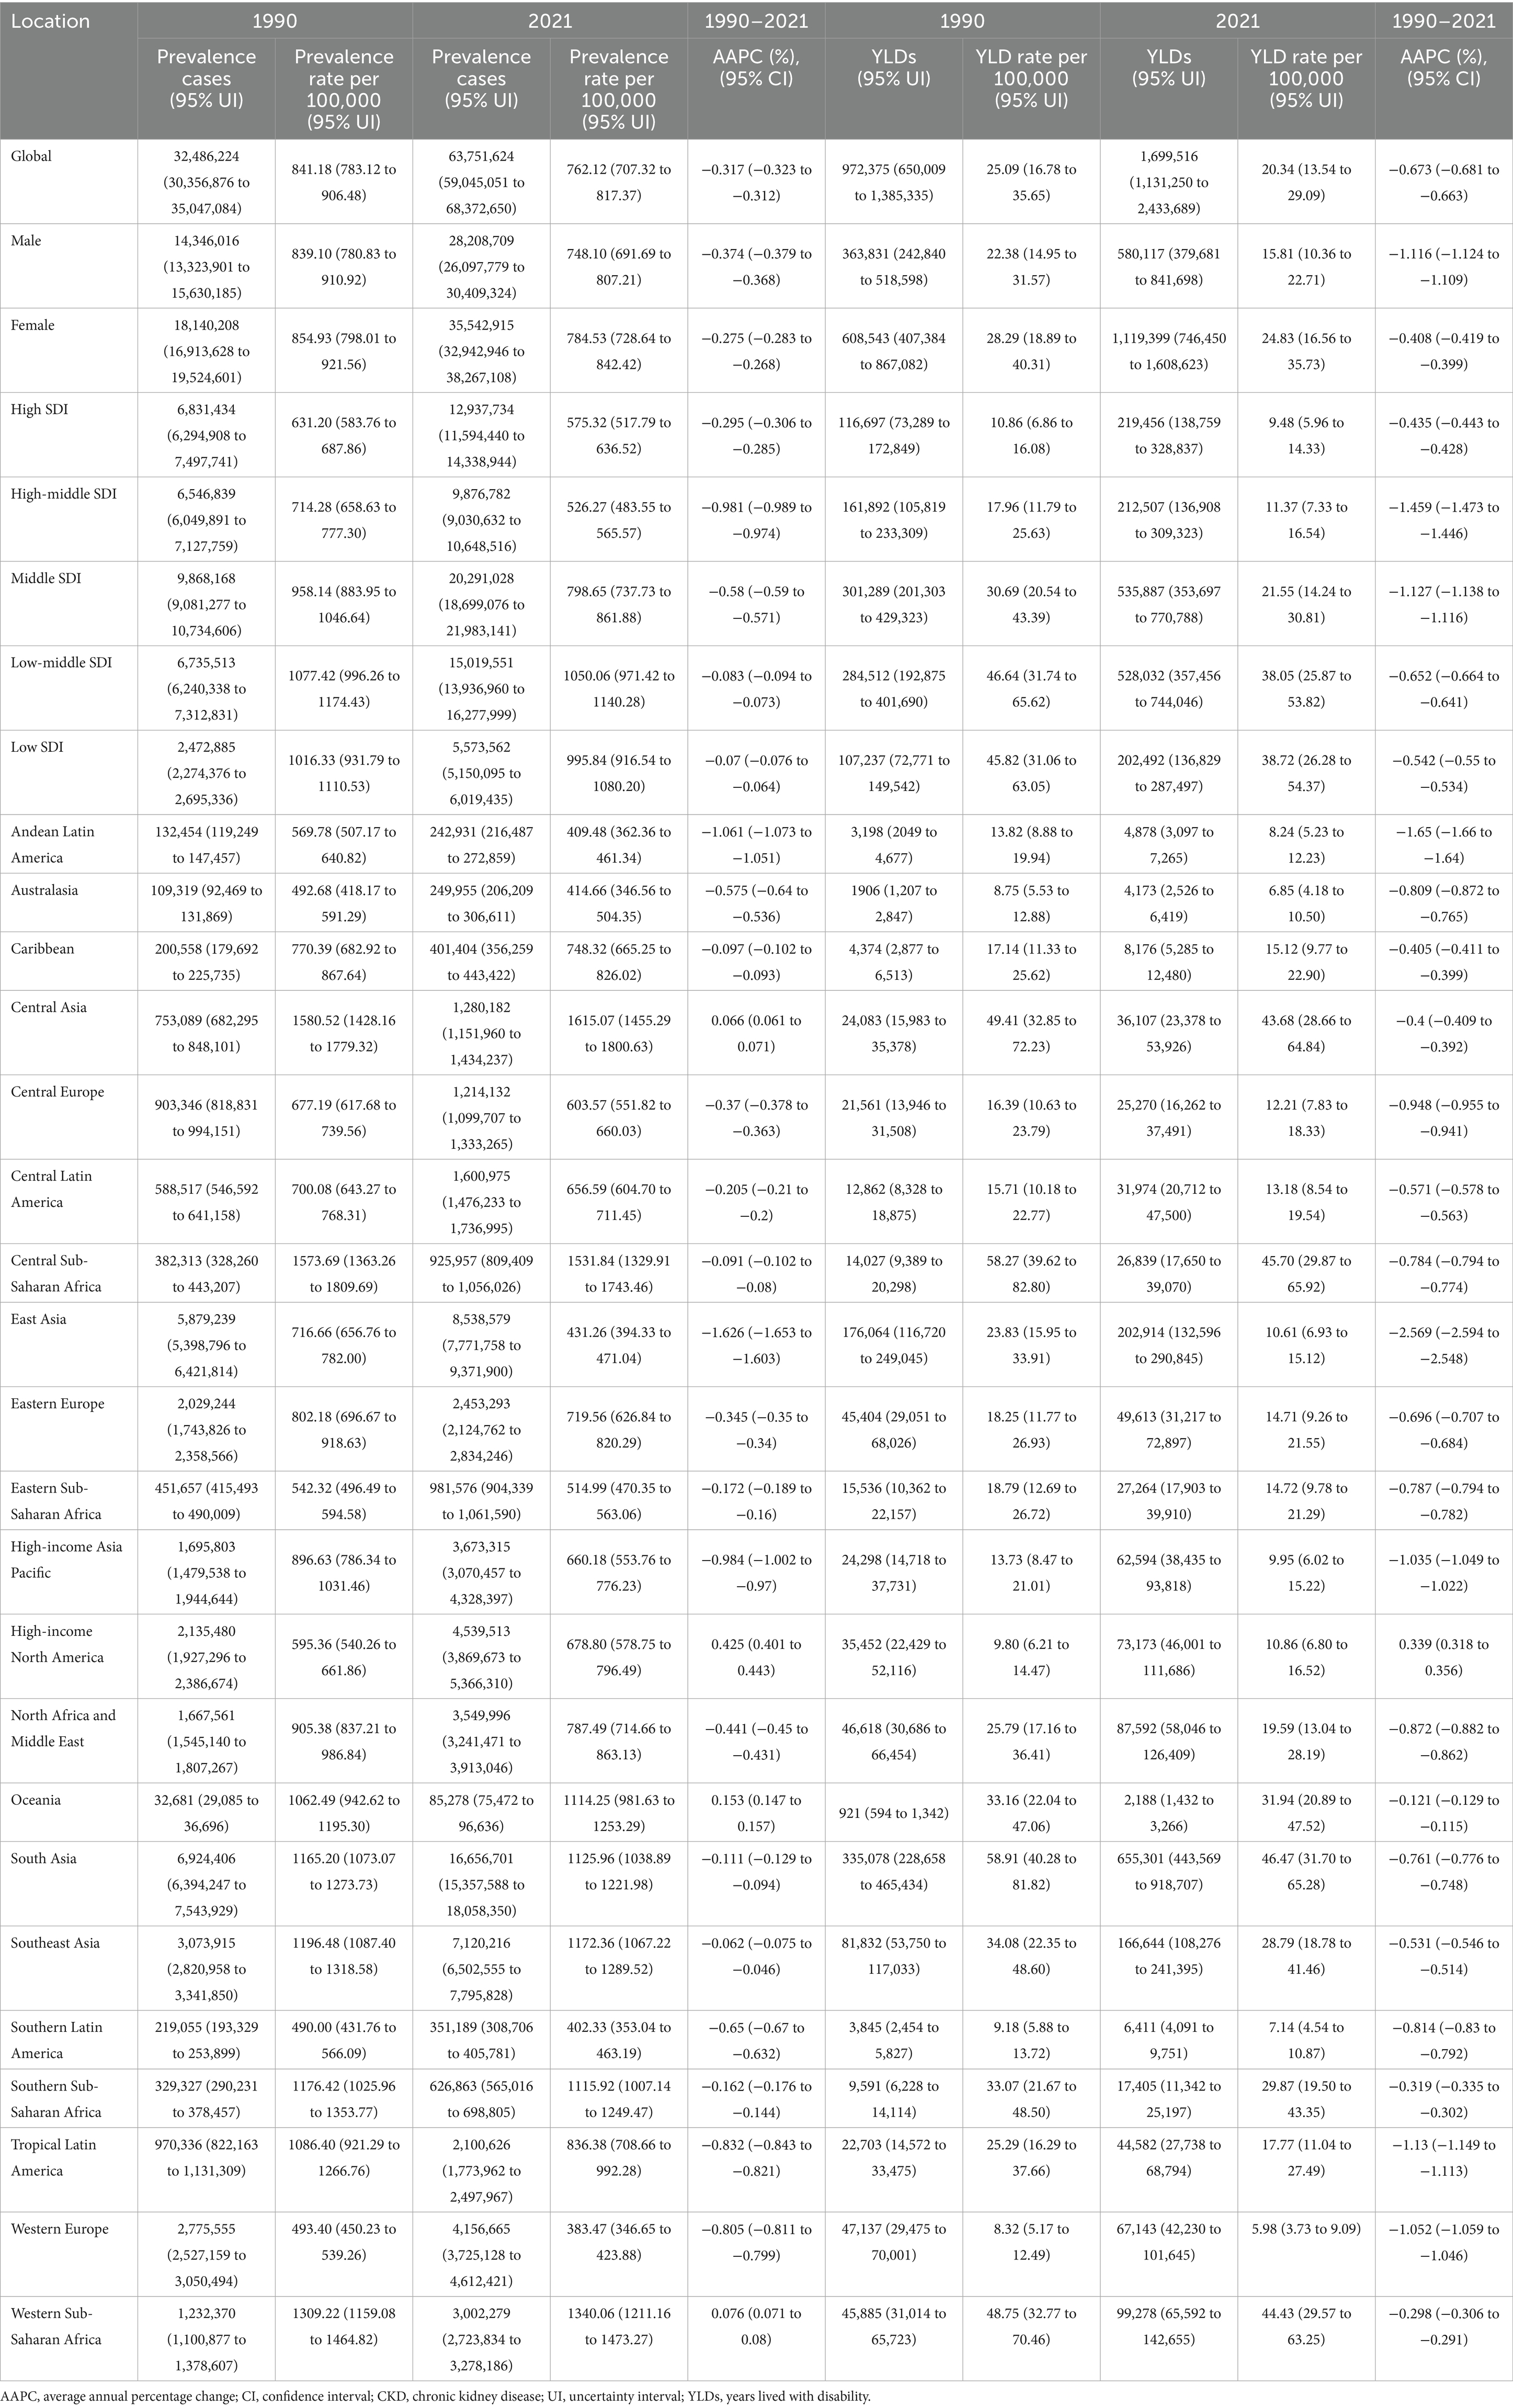
Table 1. Prevalence and YLDs of anemia attributed to CKD, and their temporal trends from 1990 to 2021 at the global and regional levels.
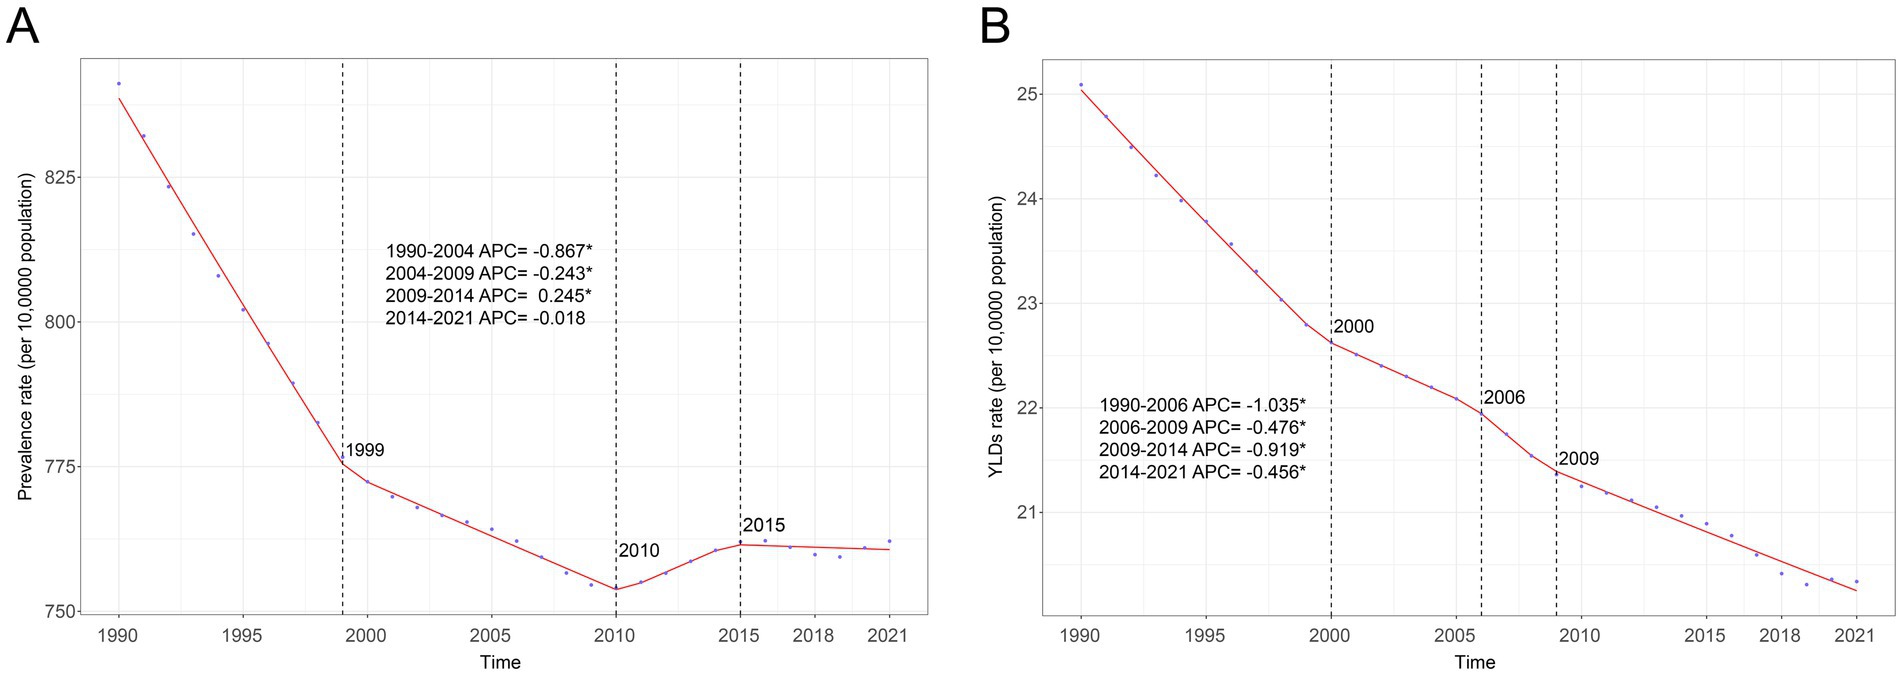
Figure 1. Joinpoint regression analysis of global anemia attributed to CKD. (A) Age-standardized prevalence rate per 100,000 from 1990 to 2021 and (B) age-standardized YLD rate per 100,000 from 1990 to 2021. APC, annual percentage change; CKD, chronic kidney disease; YLDs, years lived with disability.
Regional level
In 2021, the highest ASPR per 100,000 population for anemia attributed to CKD was observed in Central Asia [1615.07 (95% UI: 1455.29 to 1800.63)], followed by Central Sub-Saharan Africa [1531.84 (95% UI: 1329.91 to 1743.46)] and Western Sub-Saharan Africa [1340.06 (95% UI: 1211.16 to 1473.27)]. Western Europe [383.47 (95% UI: 346.65 to 423.88)], Southern Latin America [402.33 (95% UI: 353.04 to 463.19)], and Andean Latin America [409.48 (95% UI: 362.36 to 461.34)] had the lowest ASPR per 100,000 population. The majority of GBD regions showed downward trends in the ASPR from 1990 to 2021, with the most pronounced decrease being found in East Asia [AAPC = −1.626 (95% CI: −1.653 to −1.603)], Andean Latin America [AAPC = −1.061 (95% CI: −1.073 to −1.051)], and High-income Asia Pacific [AAPC = −0.984 (95% CI: −1.002 to −0.97)]. During the same period, all GBD regions showed downward trends in the age-standardized YLD rate, except High-income North America [AAPC = 0.339 (95% CI: 0.318 to 0.356)]. The largest decrease in the age-standardized YLD rate was found in the same regions with the most pronounced decrease in ASPR, while the highest and lowest age-standardized YLD rates were also found in the same regions with the highest and lowest ASPR (Table 1).
National level
Details of the burden of anemia attributed to CKD in various countries and territories are presented in Supplementary Table S1 and Figure 2. In 2021, the national ASPR per 100,000 population of anemia attributed to CKD ranged from 255.29 to 1832.39. Nepal [2298.92 (95% UI: 1904.13 to 2765.01)], Uzbekistan [1834.86 (95% UI: 1542.38 to 2205.31)], and Azerbaijan [1759.88 (95% UI: 1469.43 to 2127.35)] had the highest ASPR per 100,000 population in 2021. In contrast, Iceland [255.29 (95% UI: 210.36 to 314.62)], Canada [274.56 (95% UI: 224.78 to 340.89)], and France [290.97 (95% UI: 238.01 to 362.81)] had the lowest ASPR per 100,000 population. The ASPR of anemia attributed to CKD increased in approximately half of all national regions from 1990 to 2021. The most pronounced increase in ASPR was observed in Fiji [AAPC = 0.864 (95% CI: 0.847 to 0.879)], Benin [AAPC = 0.735 (95% CI: 0.729 to 0.740)], and Nepal [AAPC = 0.732 (95% CI: 0.719 to 0.746)]. Conversely, ASPR decreased in more than half of all national regions from 1990 to 2021, with Korea [AAPC = −2.569 (95% CI: −2.597 to −2.552)], China [AAPC = −1.668 (95% CI: 1.703 to −1.644)], and Singapore [AAPC = −1.516 (95% CI: −1.525 to −1.505)] having the most pronounced decrease. Nationally, the age-standardized YLD rate per 100,000 population of anemia attributed to CKD varied from 3.77 to 84.28 in 2021. The highest and lowest age-standardized rates were found in the same regions with the highest and lowest ASPR, while the largest decrease in age-standardized YLD rate was also found in the same regions with the most pronounced decrease in ASPR.
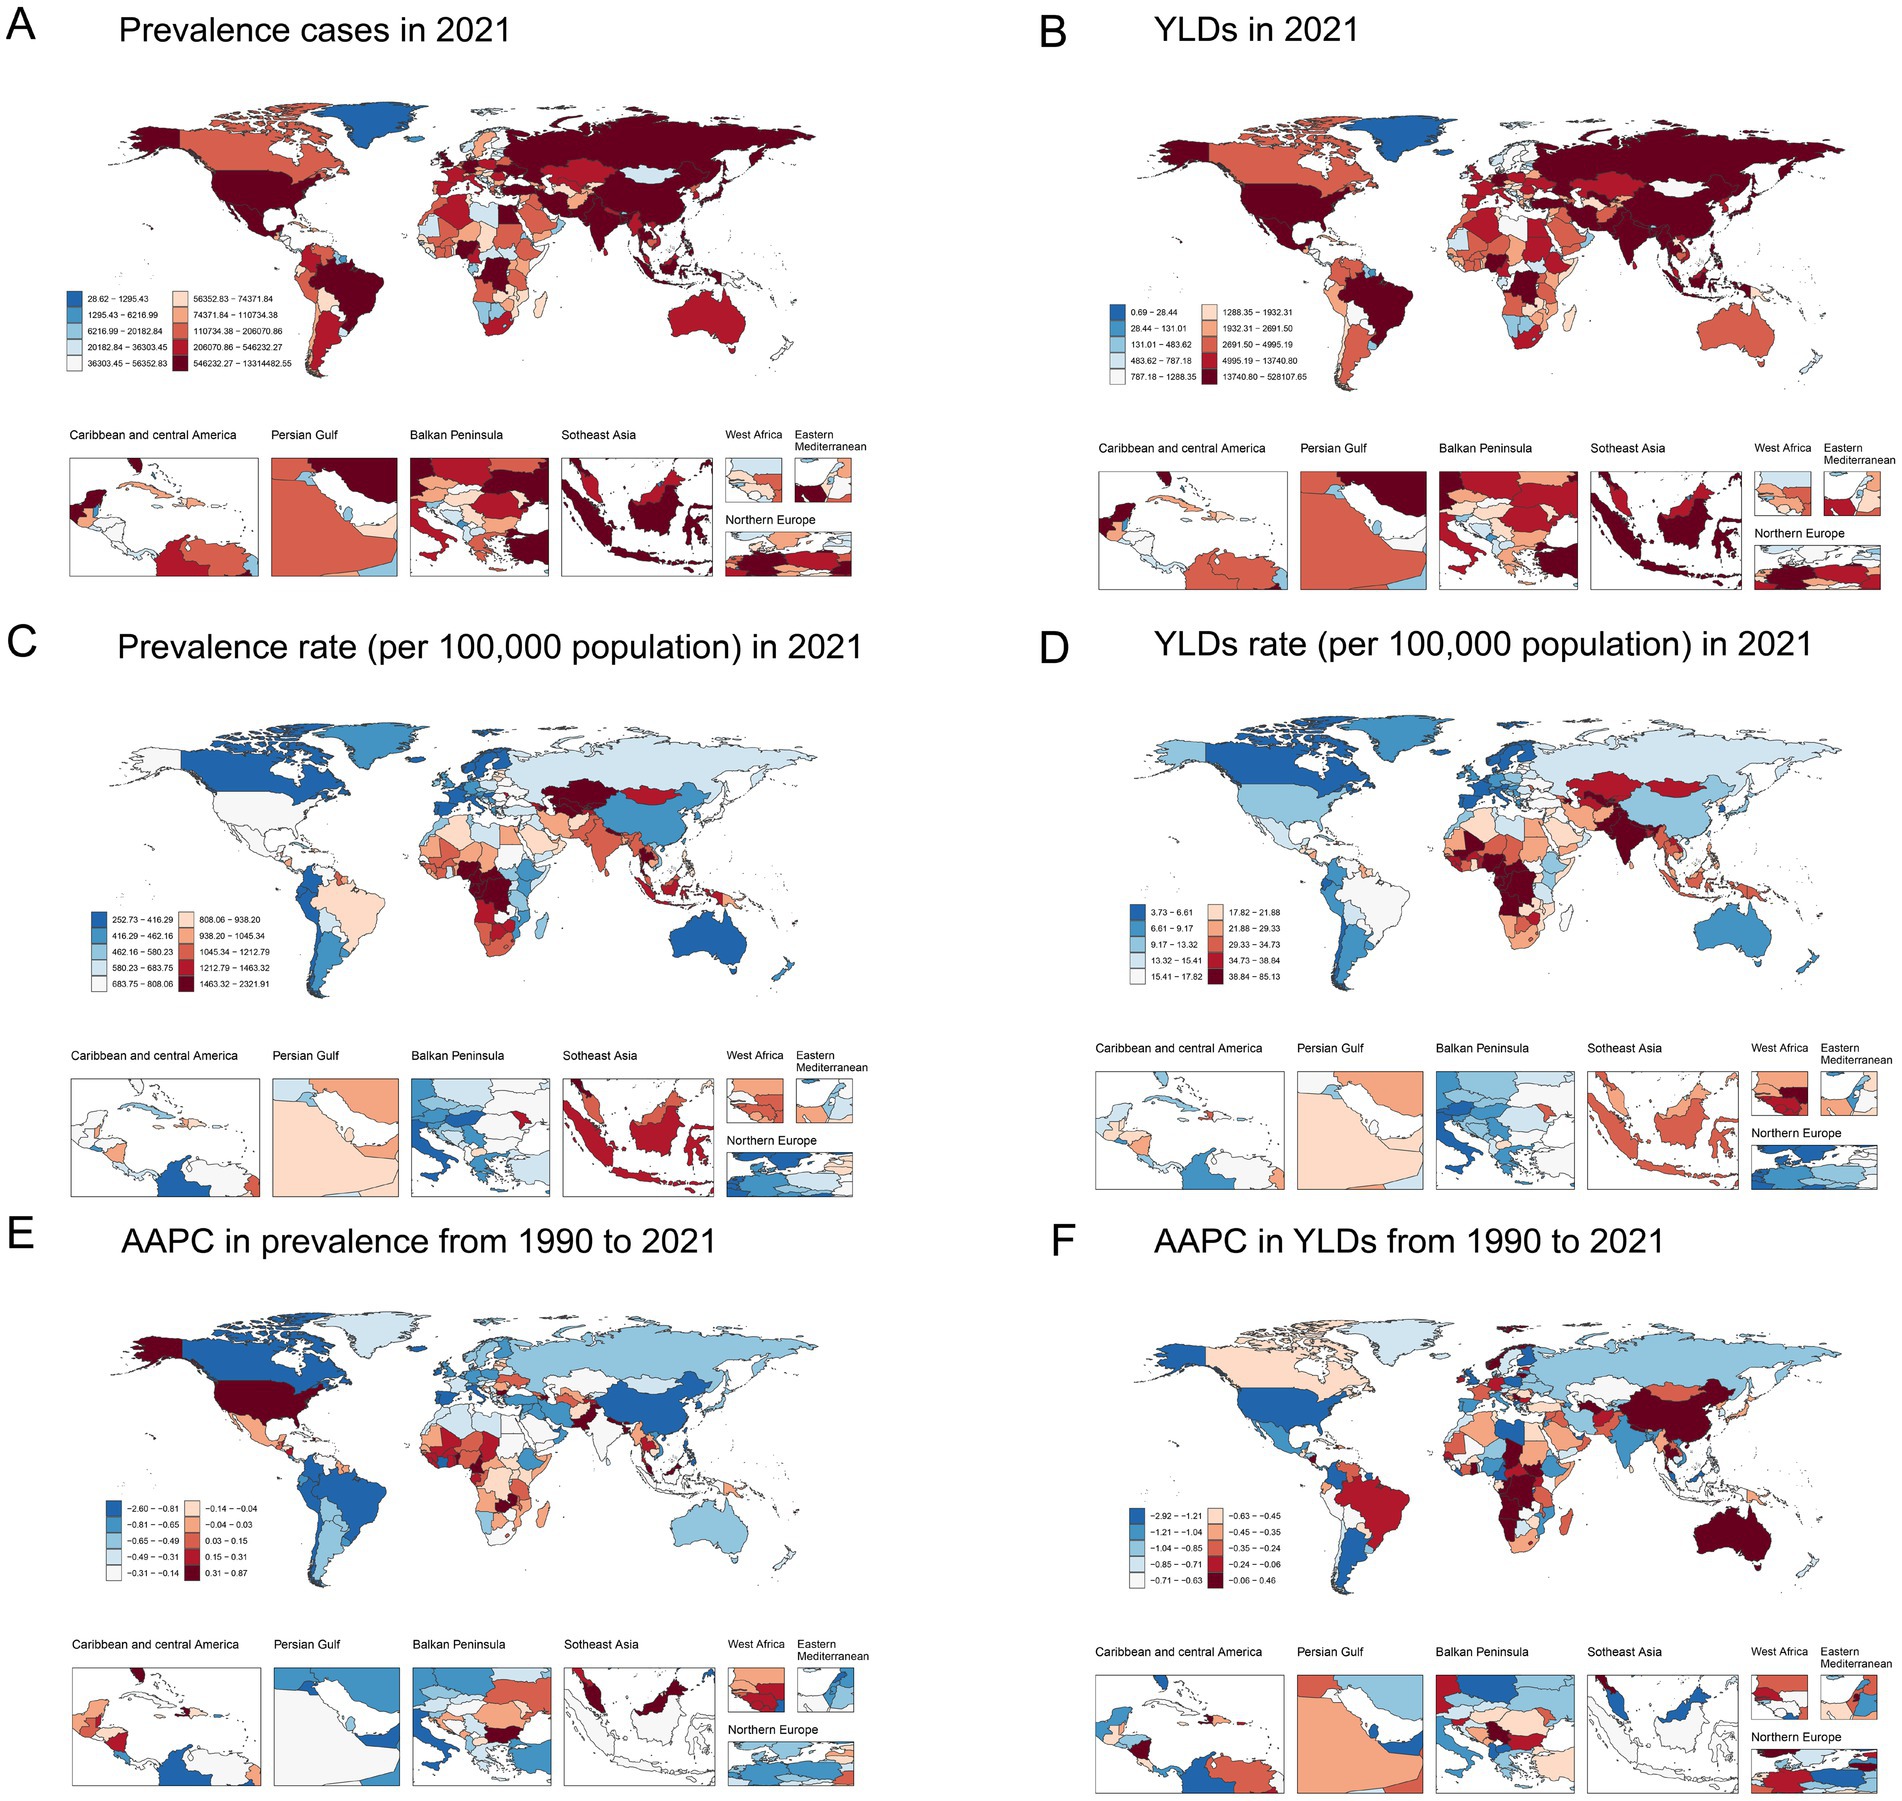
Figure 2. Global map of 2021 anemia attributed to CKD. (A) Prevalence cases, (B) YLDs, (C) age-standardized prevalence rate per 100,000, and (D) age-standardized YLD rate per 100,000; AAPC in (E) age-standardized prevalence rate and (F) age-standardized YLD rate from 1990 to 2021. AAPC, average annual percentage change; CKD, chronic kidney disease; YLDs, years lived with disability.
Age and sex patterns
In 2021, the ASPR and age-standardized YLD rates were 748.10 (95% UI: 691.69 to 807.21) and 15.81 (95% UI: 10.36 to 22.71) for men and 784.53 (95% UI: 728.64 to 842.42) and 24.83 (95% UI: 16.56 to 35.73) for women, respectively. The ASPR and age-standardized YLD rates of women were higher than those of men among most age groups. The number of prevalence cases and YLDs showed a unimodal distribution in men and women, and both peaked in the 70–79 years’ group. For both men and women, ASPR and age-standardized YLD rates increased with age (Table 1; Figures 3A,B).
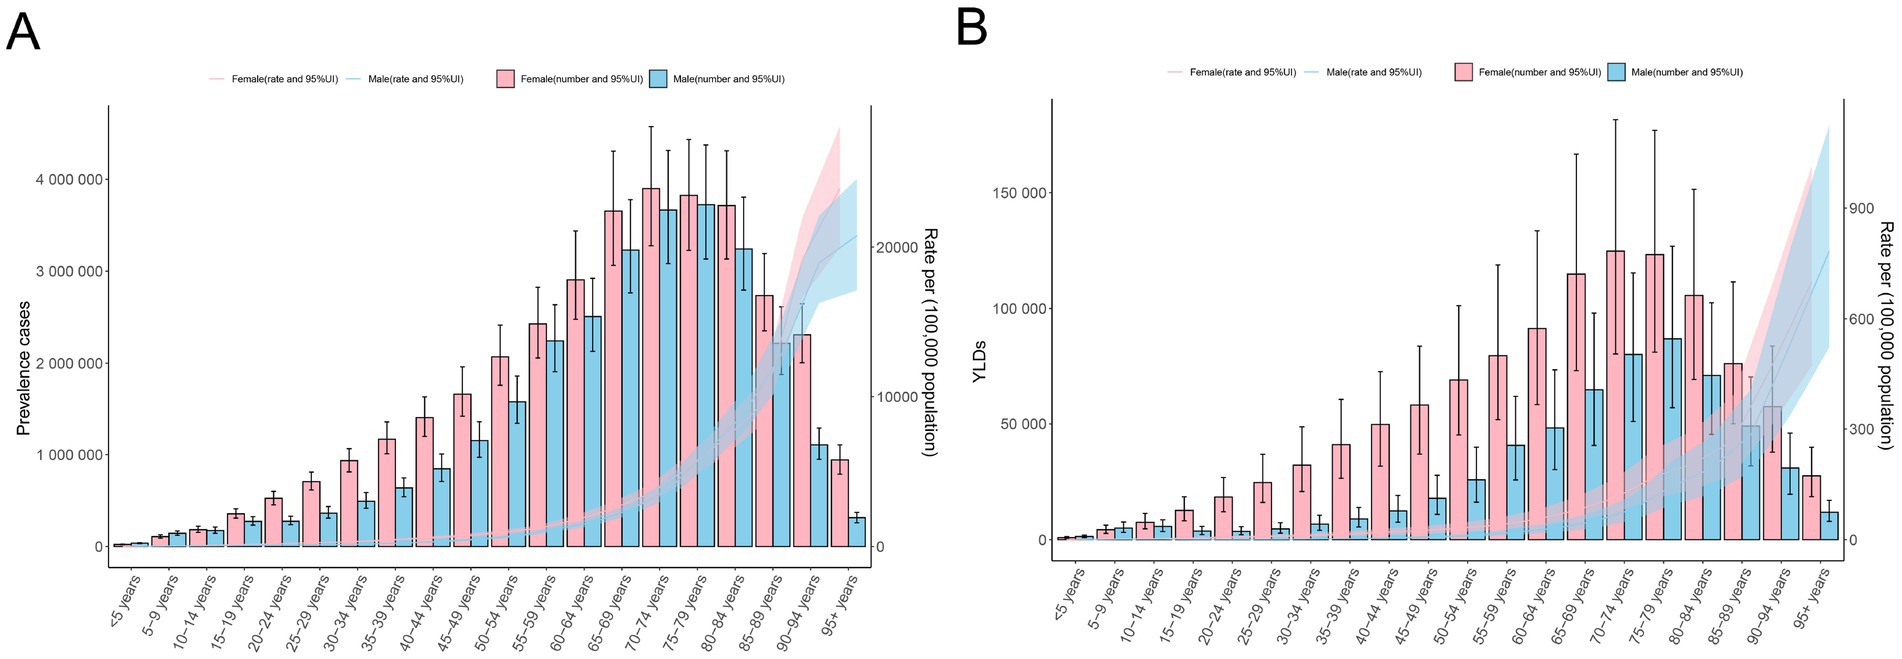
Figure 3. Age-specific counts and the rate of anemia attributed to CKD by sex, 2021. (A) Prevalence and (B) YLD rates. APC, annual percentage change; CKD, chronic kidney disease; YLDs, years lived with disability.
Association with the socio-demographic index
Across all five SDI regions, the low SDI regions had the highest age-standardized YLD rate per 100,000 population [38.72 (95% UI: 26.28 to 54.37)], and the age-standardized YLD rate decreased as SDI increased in 2021 (Table 1). At the regional level, a negative correlation was observed between SDI and the age-standardized YLD rate of anemia attributed to CKD from 1990 to 2019 (Table 1; Figure 4A). The association between SDI and anemia burden attributed to CKD at the national level was consistent with that at the regional level: countries with higher SDI tended to have lower age-standardized YLD rates (Supplementary Table S1; Figure 4B). In addition, at the national level, the AAPC of age-standardized YLD rate was positively correlated with the 2021 age-standardized YLD rate and negatively correlated with the 2021 SDI (Figures 4C,D).
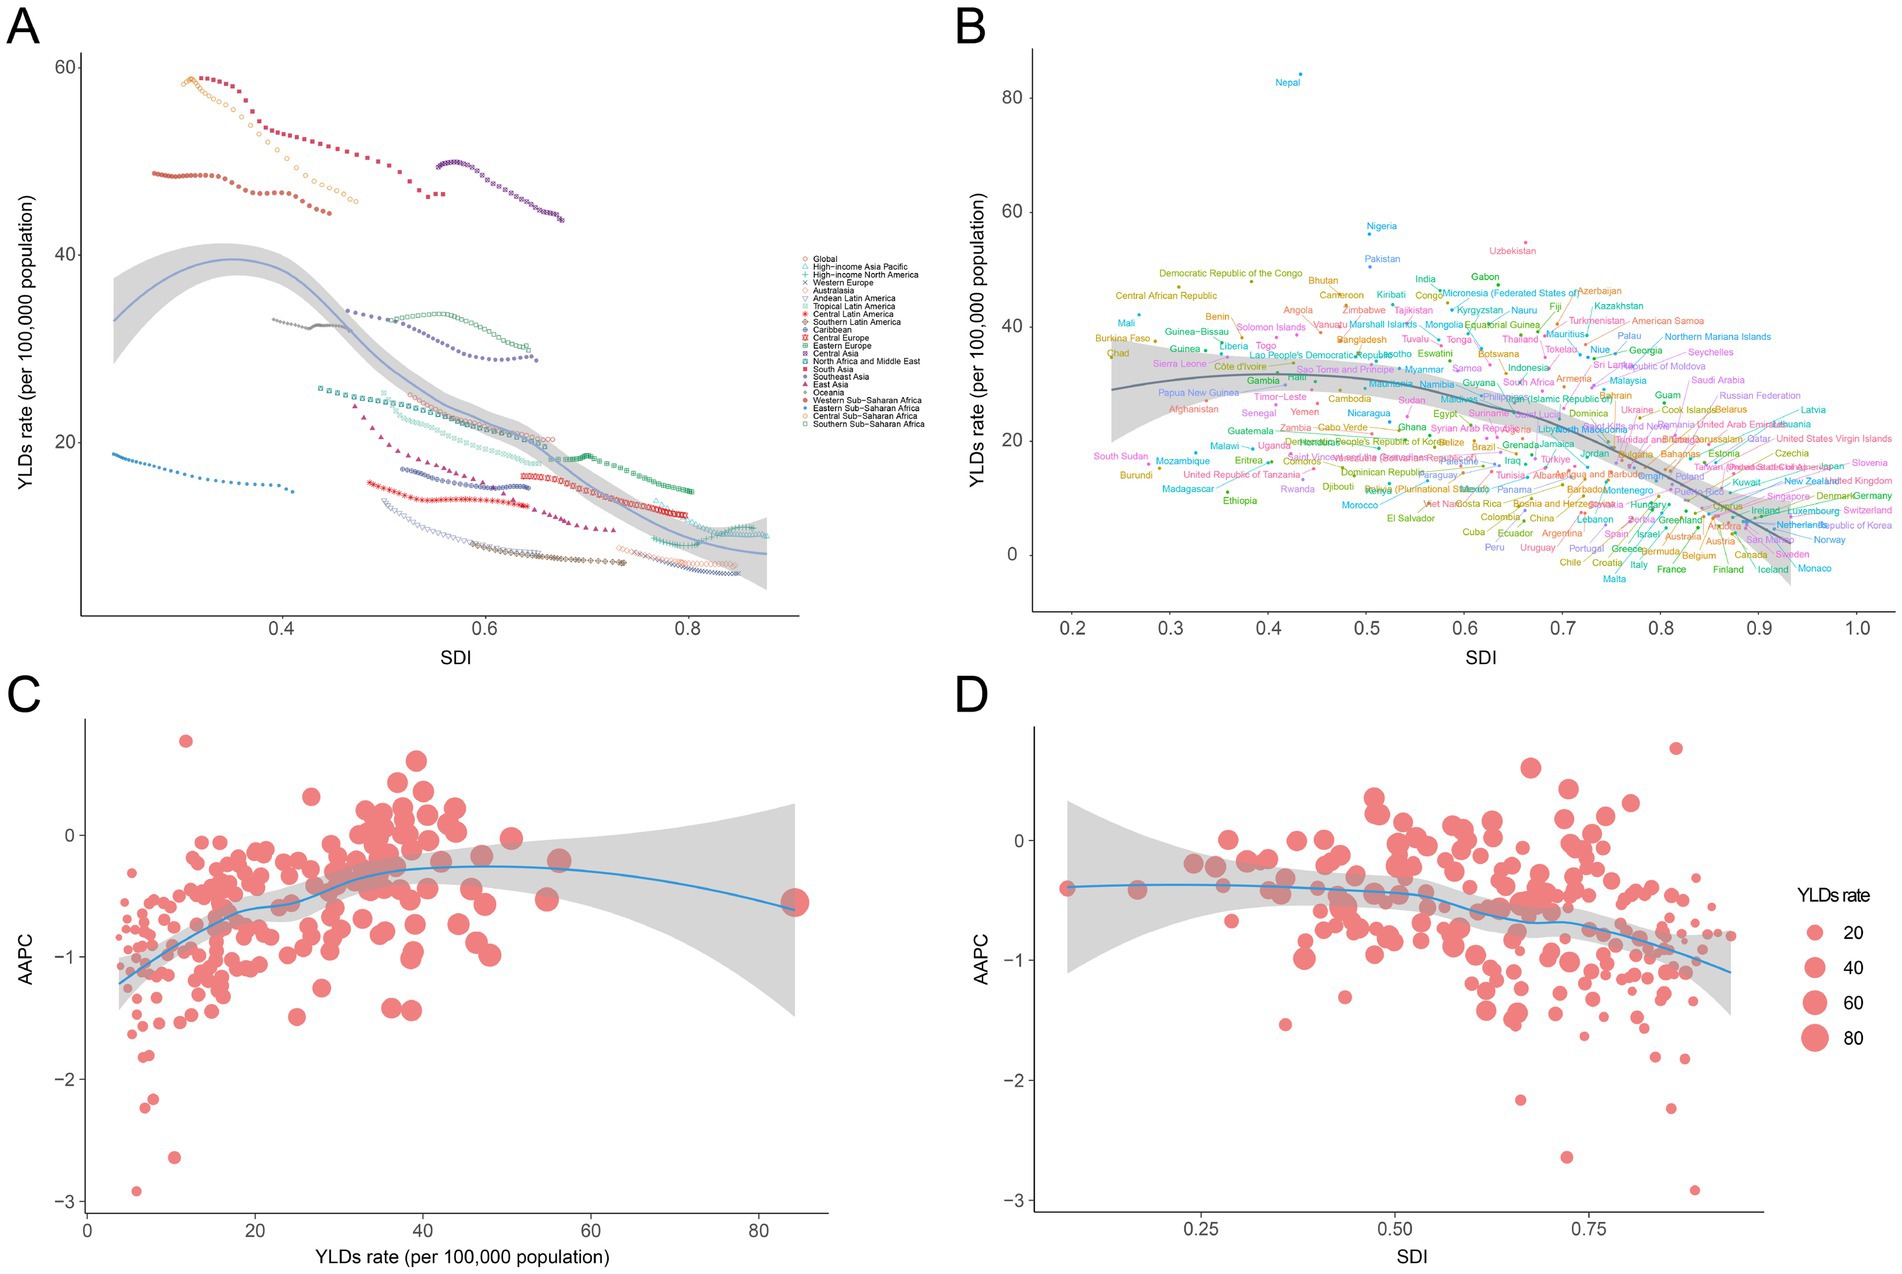
Figure 4. Correlation between SDI and anemia burden attributed to CKD by 21 GBD regions and 204 nations. (A) Trends in age-standardized YLD rate across 21 GBD regions, correlated with SDI from 1990 to 2021, (B) age-standardized YLD rate at the national level in relation to SDI in 2021, (C) AAPC of age-standardized YLD rate at the national level in relation to YLD rate of 2021, and (D) AAPC of age-standardized YLD rate at the national level in relation to SDI of 2021. GBD, Global Burden of Disease Study; SDI, socio-demographic index; CKD, chronic kidney disease; YLDs, years lived with disability.
Predictions of anemia burden attributed to CKD
Using BAPC analysis, we estimated that the prevalence of anemia cases attributed to CKD will consistently increase from 2022 to 2035, while YLDs are projected to rise initially and then gradually decline. Globally, there will be 63.92 million (95% UI: 60.11 to 67.74) prevalence cases and 1.61 million (95% UI: 1.54 to 1.69) YLDs in 2035. During the same period, the ASPR and age-standardized YLD rates are projected to decrease consistently. Globally, the ASPR and age-standardized YLD rates per 100,000 population are estimated to be 716.52 (95% UI: 673.75 to 759.30) and 18.10 (95% UI: 17.22 to 18.98) in 2035, representing declines of 5.72 and 11.01%, respectively, compared with 2021 (Supplementary Table S2; Figure 5).
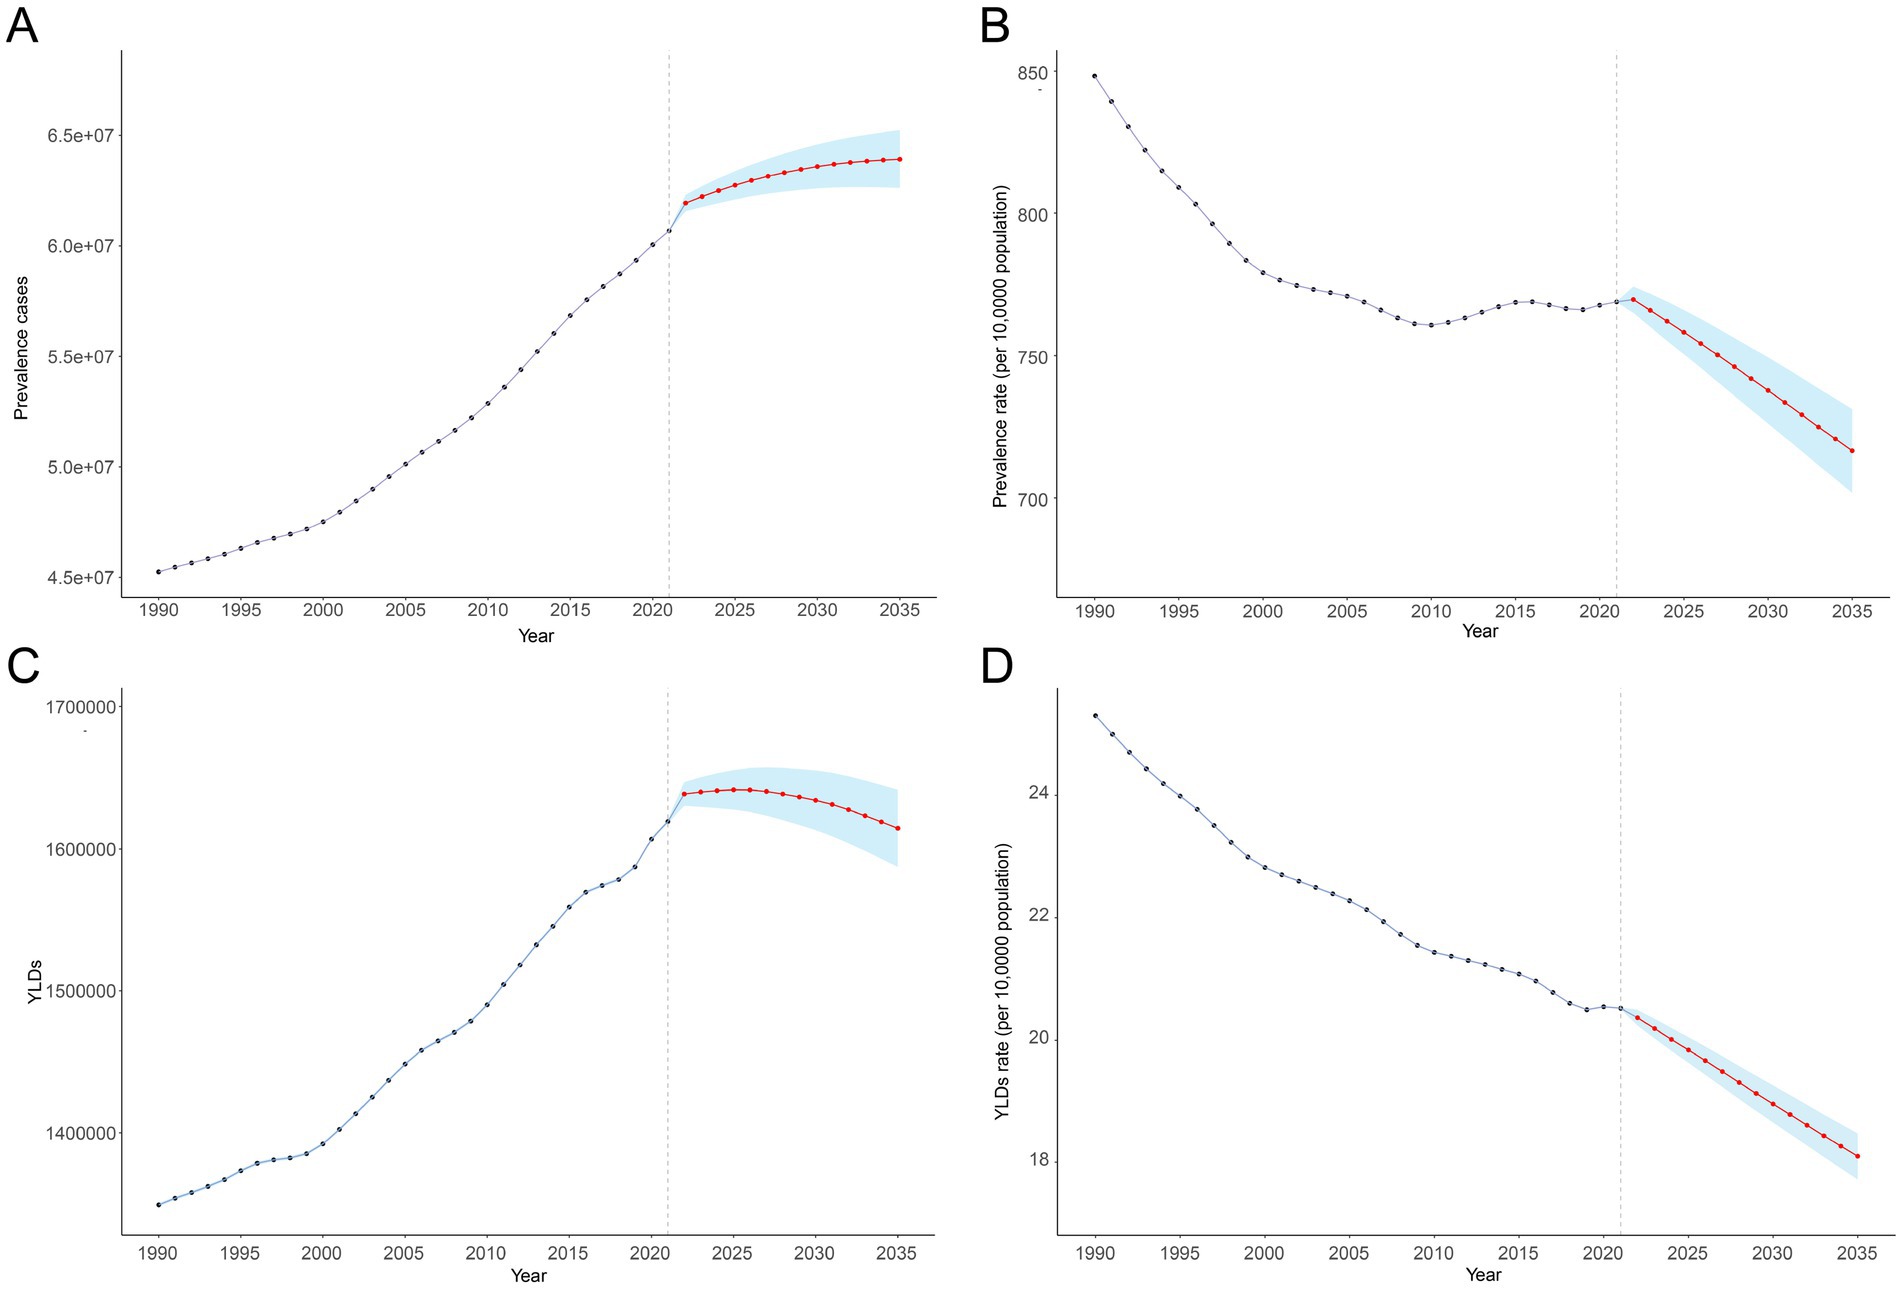
Figure 5. Anemia attributed to CKD from 1990 to 2021 and its predictions for 2035. (A) Prevalence cases, (B) age-standardized prevalence rate per 100,000, (C) YLD rates, and (D) age-standardized YLD rate per 100,000. The known data from 1990 to 2021 and predicted data from 2022 to 2030 were divided by a gray dashed line. The shaded area represents 95% uncertainty intervals. APC, annual percentage change; CKD, chronic kidney disease; YLDs, years lived with disability.
Decomposition analysis of anemia attributed to CKD from 1990 to 2021
Our decomposition analysis provided insights into the relative contributions of aging, population, and demographically adjusted changes in epidemiology to the prevalence cases and YLDs of anemia attributed to CKD. At the global level and at the five SDI regional levels, although demographically adjusted epidemiological changes decreased the anemia burden attributed to CKD, aging and population growth ultimately led to increases in prevalence and YLDs between 1990 and 2019. Similarly, all 21 GBD regions experienced rises in prevalence and YLDs during this period, primarily driven by aging and population growth, with South Asia showing the highest increases in prevalence and YLDs (Figure 6).
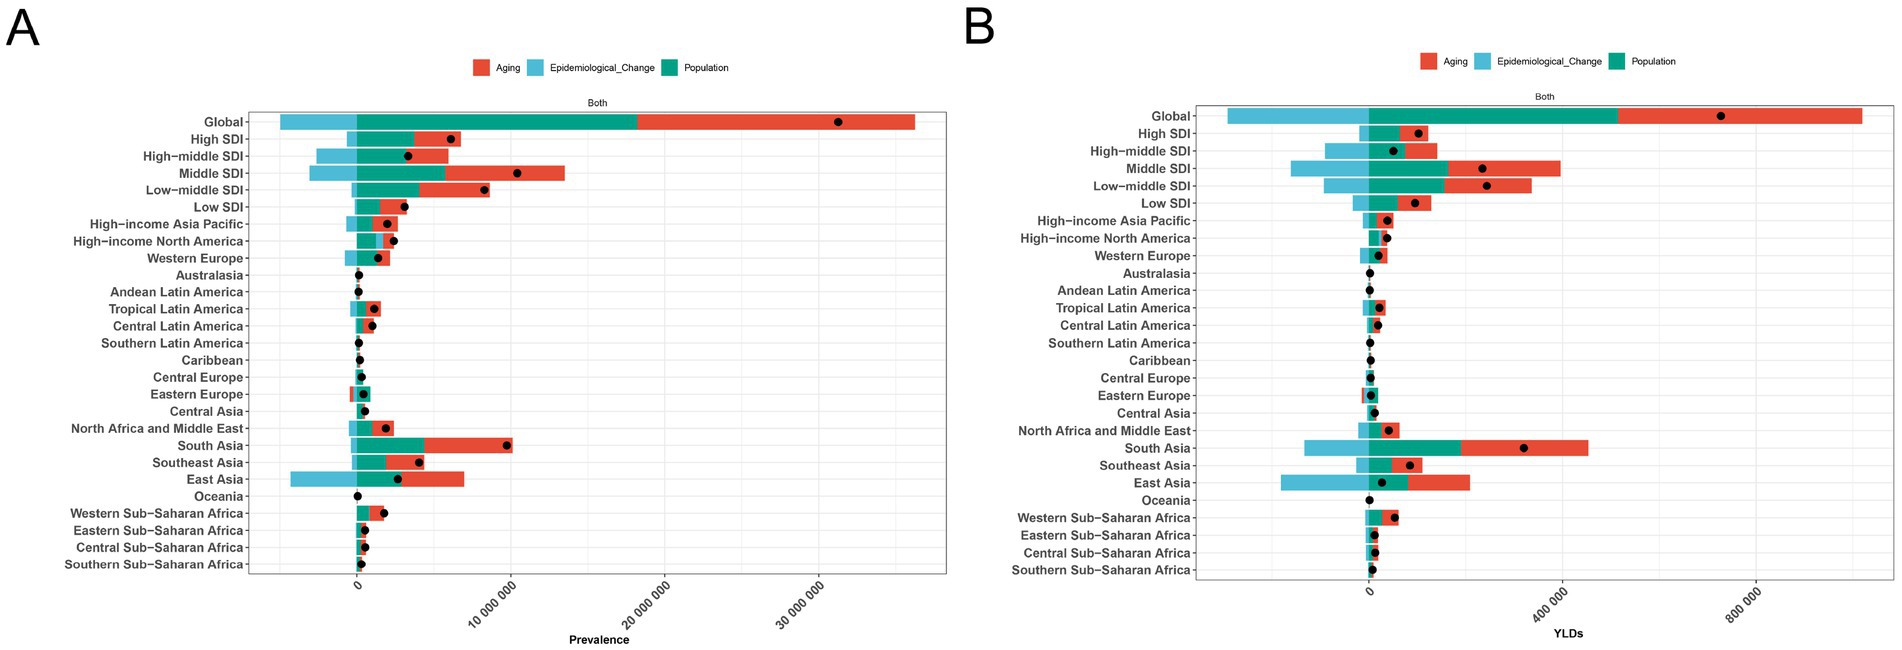
Figure 6. Decomposition analysis of anemia attributed to CKD. (A) Prevalence and (B) YLD rate. APC, annual percentage change; CKD, chronic kidney disease; YLDs, years lived with disability.
Discussion
CKD is a major global health issue affecting millions of people and placing a significant strain on healthcare systems. Anemia, a common complication of CKD, further increases the mortality associated with this condition (5–8). However, research specifically focused on the anemia burden attributed to CKD remains limited. To our knowledge, this is the first study to provide a comprehensive analysis of the global, regional, and national anemia burden attributed to CKD from 1990 to 2021 using data from the GBD 2021 study.
Globally, the prevalent cases of anemia attributed to CKD increased by 96.24% from 1990 to 2021, reaching 63.75 million in 2021. This condition accounted for approximately 1.70 million YLDs in 2021, representing a 74.78% increase since 1990. Decomposition analysis indicated that this increase in absolute numbers of prevalence and YLDs was largely driven by population growth and aging, both of which are known contributors to the increasing burden of CKD (35). Consequently, the rising prevalence of CKD36 has led to a corresponding increase in anemia attributed to CKD. Notably, although the ASPR for CKD showed a slight decrease, and the age-standardized disability-adjusted life years rate for CKD increased between 1990 and 2021 (36), the ASPR and age-standardized YLD rates for anemia attributed to CKD declined markedly during the same period. This suggests that, despite the growing burden of CKD, efforts in screening, prevention, and treatment of anemia attributed to CKD have helped reduce its specific burden (37–39). Additionally, although the global ASPR of anemia attributed to CKD decreased from 1990 to 2021, this decline stalled after 2010, with a slight increase observed between 2010 and 2015—primarily due to rising ASPR in high-SDI regions. This trend aligns with changes in the ASPR of CKD in high-SDI regions (36), where the increasing ASPR is largely attributed to diabetes and hypertension (40, 41), the most well-established drivers of CKD (42).
At the regional and national levels, the anemia burden attributed to CKD varied substantially. Our analysis revealed a clear negative correlation between SDI and the anemia burden attributed to CKD, with low-SDI regions experiencing higher age-standardized YLD rates. This disparity is largely due to lower per capita income, limited access to healthcare, and poorer educational outcomes in low- and middle-income countries (23). Moreover, at the national level, a negative correlation was observed between the AAPC of age-standardized YLD rates and the SDI in 2021, with high-SDI regions showing more pronounced declines. This likely reflects advancements in treatment and improvements in healthcare quality related to anemia attributed to CKD in high-income countries. These correlations highlight inequities in healthcare resources and variations in the effectiveness of public health interventions across regions, underscoring the need to address socioeconomic disparities as part of comprehensive strategies to prevent and control anemia attributed to CKD.
The anemia burden attributed to CKD also differed by gender and age. In 2021, both the ASPR and age-standardized YLD rates for anemia attributed to CKD increased with age in both men and women. This pattern aligns with the natural decline in kidney function associated with aging, influenced by factors such as nephron count at birth, genetic predisposition, and environmental exposures (35). Women exhibited higher ASPR and age-standardized YLD rates than men across most age groups. This gender disparity may be due to differences in baseline kidney function, hormonal influences, and access to healthcare (43). These findings suggest that greater attention should be directed toward women and older populations.
The results of this study have several important implications for public health interventions aimed at reducing the anemia burden attributed to CKD. First, early detection and management of CKD are essential for reducing the incidence of anemia. This includes regular kidney function screening, especially in high-risk groups such as individuals with diabetes and hypertension (42). Second, in low-SDI regions, where the anemia burden attributed to CKD is highest, efforts should focus on strengthening healthcare infrastructure, improving access to essential medications, and enhancing the capacity of healthcare providers to manage CKD and its complications. Furthermore, the stagnation in the decline in prevalence since 2010 underscores the need for more effective and sustainable interventions.
While this study provides valuable insights into the global anemia burden attributed to CKD, it still has several limitations. First, the accuracy of our estimates depends on the quality and availability of data, which varies across countries and regions. For example, data from low-SDI regions may be less reliable due to limited healthcare infrastructure and incomplete reporting systems. Second, the GBD study relies on modeling techniques to estimate anemia prevalence and YLDs, which may introduce uncertainty. Third, attributing each case of anemia to a single underlying cause is a limitation, as many individuals with anemia likely have multiple comorbid conditions contributing to their diagnosis. Finally, although this study assessed trends and projected future burden based on GBD 2021, the inherent time lag in the database (currently including data only up to 2021) may affect the accuracy of predictions.
In conclusion, despite a global decline in ASPR and age-standardized YLD rates over the past three decades, the anemia burden attributed to CKD remains a significant public health challenge, particularly in low- and middle-income countries. Additionally, women and older adults bear a higher anemia burden attributed to CKD. These findings provide valuable insights for targeting intervention and prevention efforts.
Data availability statement
The original contributions presented in the study are included in the article/Supplementary material, further inquiries can be directed to the corresponding authors.
Author contributions
WZhe: Formal analysis, Methodology, Data curation, Conceptualization, Writing – original draft. HC: Data curation, Formal analysis, Writing – original draft. WZha: Data curation, Formal analysis, Writing – original draft. YC: Supervision, Data curation, Conceptualization, Writing – original draft. ZW: Conceptualization, Writing – review & editing, Supervision, Data curation. LG: Writing – review & editing, Conceptualization, Supervision, Writing – original draft.
Funding
The author(s) declare that no financial support was received for the research and/or publication of this article.
Acknowledgments
We acknowledge the exceptional contributions made by the collaborators of the Global Burden of Diseases, Injuries, and Risk Factors Study 2021. We sincerely appreciate the IHME institution for providing the GBD data.
Conflict of interest
The authors declare that the research was conducted in the absence of any commercial or financial relationships that could be construed as a potential conflict of interest.
Generative AI statement
The authors declare that no Gen AI was used in the creation of this manuscript.
Any alternative text (alt text) provided alongside figures in this article has been generated by Frontiers with the support of artificial intelligence and reasonable efforts have been made to ensure accuracy, including review by the authors wherever possible. If you identify any issues, please contact us.
Publisher’s note
All claims expressed in this article are solely those of the authors and do not necessarily represent those of their affiliated organizations, or those of the publisher, the editors and the reviewers. Any product that may be evaluated in this article, or claim that may be made by its manufacturer, is not guaranteed or endorsed by the publisher.
Supplementary material
The Supplementary material for this article can be found online at: https://www.frontiersin.org/articles/10.3389/fnut.2025.1690686/full#supplementary-material
Footnotes
References
1. Hill, NR, Fatoba, ST, Oke, JL, Hirst, JA, O’Callaghan, CA, Lasserson, DS, et al. Global prevalence of chronic kidney disease - a systematic review and Meta-analysis. PLoS One. (2016) 11:e0158765. doi: 10.1371/journal.pone.0158765
2. Hirst, JA, Hill, N, O’Callaghan, CA, Lasserson, D, McManus, RJ, Ogburn, E, et al. Prevalence of chronic kidney disease in the community using data from OxRen: a UK population-based cohort study. Br J Gen Pract. (2020) 70:e285–93. doi: 10.3399/bjgp20X708245
3. Mazhar, F, Sjölander, A, Fu, EL, Ärnlöv, J, Levey, AS, Coresh, J, et al. Estimating the prevalence of chronic kidney disease while accounting for nonrandom testing with inverse probability weighting. Kidney Int. (2023) 103:416–20. doi: 10.1016/j.kint.2022.10.027
4. Babitt, JL, and Lin, HY. Mechanisms of anemia in CKD. J Am Soc Nephrol. (2012) 23:1631–4. doi: 10.1681/ASN.2011111078
5. Vlagopoulos, PT, Tighiouart, H, Weiner, DE, Griffith, J, Pettitt, D, Salem, DN, et al. Anemia as a risk factor for cardiovascular disease and all-cause mortality in diabetes: the impact of chronic kidney disease. J Am Soc Nephrol. (2005) 16:3403–10. doi: 10.1681/ASN.2005030226
6. Toft, G, Heide-Jørgensen, U, van Haalen, H, James, G, Hedman, K, Birn, H, et al. Anemia and clinical outcomes in patients with non-dialysis dependent or dialysis dependent severe chronic kidney disease: a Danish population-based study. J Nephrol. (2020) 33:147–56. doi: 10.1007/s40620-019-00652-9
7. Palaka, E, Grandy, S, van Haalen, H, McEwan, P, and Darlington, O. The impact of CKD anaemia on patients: incidence, risk factors, and clinical outcomes-a systematic literature review. Int J Nephrol. (2020) 2020:7692376. doi: 10.1155/2020/7692376
8. Covic, A, Jackson, J, Hadfield, A, Pike, J, and Siriopol, D. Real-world impact of cardiovascular disease and Anemia on quality of life and productivity in patients with non-Dialysis-dependent chronic kidney disease. Adv Ther. (2017) 34:1662–72. doi: 10.1007/s12325-017-0566-z
9. Evans, M, Bower, H, Cockburn, E, Jacobson, SH, Barany, P, and Carrero, JJ. Contemporary management of anaemia, erythropoietin resistance and cardiovascular risk in patients with advanced chronic kidney disease: a nationwide analysis. Clin Kidney J. (2020) 13:821–7. doi: 10.1093/ckj/sfaa054
10. Abate, A, Birhan, W, and Alemu, A. Association of anemia and renal function test among diabetes mellitus patients attending Fenote Selam hospital, west Gojam, Northwest Ethiopia: a cross sectional study. BMC Hematol. (2013) 13:6. doi: 10.1186/2052-1839-13-6
11. Haupt, L, and Weyers, R. Determination of functional iron deficiency status in haemodialysis patients in Central South Africa. Int J Lab Hematol. (2016) 38:352–9. doi: 10.1111/ijlh.12492
12. Fiseha, T, Adamu, A, Tesfaye, M, and Gebreweld, A. Prevalence of anemia in diabetic adult outpatients in Northeast Ethiopia. PLoS One. (2019) 14:e0222111. doi: 10.1371/journal.pone.0222111
13. Stauffer, ME, and Fan, T. Prevalence of anemia in chronic kidney disease in the United States. PLoS One. (2014) 9:e84943. doi: 10.1371/journal.pone.0084943
14. Taderegew, MM, Wondie, A, Terefe, TF, Tarekegn, TT, GebreEyesus, FA, Mengist, ST, et al. Anemia and its predictors among chronic kidney disease patients in sub-saharan African countries: a systematic review and meta-analysis. PLoS One. (2023) 18:e0280817. doi: 10.1371/journal.pone.0280817
15. Nissenson, AR, Wade, S, Goodnough, T, Knight, K, and Dubois, RW. Economic burden of anemia in an insured population. J Manag Care Pharm. (2005) 11:565–74. doi: 10.18553/jmcp.2005.11.7.565
16. Maddux, FW, Shetty, S, del Aguila, MA, Nelson, MA, and Murray, BM. Effect of erythropoiesis-stimulating agents on healthcare utilization, costs, and outcomes in chronic kidney disease. Ann Pharmacother. (2007) 41:1761–9. doi: 10.1345/aph.1K194
17. Garlo, K, Williams, D, Lucas, L, Wong, R, Botler, J, Abramson, S, et al. Severity of anemia predicts hospital length of stay but not readmission in patients with chronic kidney disease: a retrospective cohort study. Medicine (Baltimore). (2015) 94:e964. doi: 10.1097/MD.0000000000000964
18. Collins, AJ, Li, S, Peter, WS, Ebben, J, Roberts, T, Ma, JZ, et al. Death, hospitalization, and economic associations among incident hemodialysis patients with hematocrit values of 36 to 39%. J Am Soc Nephrol. (2001) 12:2465–73. doi: 10.1681/ASN.V12112465
19. Van Haalen, H, Jackson, J, Spinowitz, B, Milligan, G, and Moon, R. Impact of chronic kidney disease and anemia on health-related quality of life and work productivity: analysis of multinational real-world data. BMC Nephrol. (2020) 21:88. doi: 10.1186/s12882-020-01746-4
20. Shahbazi, F, Doosti-Irani, A, Soltanian, A, and Poorolajal, J. Global forecasting of chronic kidney disease mortality rates and numbers with the generalized additive model. BMC Nephrol. (2024) 25:286. doi: 10.1186/s12882-024-03720-w
21. Shahbazi, F, Doosti-Irani, A, Soltanian, A, and Poorolajal, J. Global trends and projection of aetiology-based chronic kidney disease incidence from 1990 to 2030: a Bayesian age-period-cohort modelling study. BMJ Open. (2025) 15:e088104. doi: 10.1136/bmjopen-2024-088104
22. GBD 2021 Anaemia Collaborators. Prevalence, years lived with disability, and trends in anaemia burden by severity and cause, 1990-2021: findings from the global burden of disease study 2021. Lancet Haematol. (2023) 10:e713–34. doi: 10.1016/S2352-3026(23)00160-6
23. Safiri, S, Kolahi, A-A, Noori, M, Nejadghaderi, SA, Karamzad, N, Bragazzi, NL, et al. Burden of anemia and its underlying causes in 204 countries and territories, 1990–2019: results from the global burden of disease study 2019. J Hematol Oncol. (2021) 14:185. doi: 10.1186/s13045-021-01202-2
24. Endrias, EE, Geta, T, Israel, E, Belayneh Yayeh, M, Ahmed, B, and Moloro, AH. Prevalence and determinants of anemia in chronic kidney disease patients in Ethiopia: a systematic review and meta-analysis. Front Med (Lausanne). (2025) 12:1529280. doi: 10.3389/fmed.2025.1529280
25. GBD 2021 Diseases and Injuries Collaborators. Global incidence, prevalence, years lived with disability (YLDs), disability-adjusted life-years (DALYs), and healthy life expectancy (HALE) for 371 diseases and injuries in 204 countries and territories and 811 subnational locations, 1990-2021: a systematic analysis for the global burden of disease study 2021. Lancet. (2024) 403:2133–61. doi: 10.1016/S0140-6736(24)00757-8
26. Zheng, W, Peng, B, Wu, Y, Gauan, L, Wang, S, and Ning, H. Global, regional, and national anemia burden among women of reproductive age (15–49 years) from 1990 to 2021: an analysis of the global burden of disease study 2021. Front Nutr. (2025) 12:496. doi: 10.3389/fnut.2025.1588496
27. GBD 2019 Demographics Collaborators. Global age-sex-specific fertility, mortality, healthy life expectancy (HALE), and population estimates in 204 countries and territories, 1950-2019: a comprehensive demographic analysis for the global burden of disease study 2019. Lancet. (2020) 396:1160–203. doi: 10.1016/S0140-6736(20)30977-6
28. Stevens, GA, Alkema, L, Black, RE, Boerma, JT, Collins, GS, Ezzati, M, et al. Guidelines for accurate and transparent health estimates reporting: the GATHER statement. Lancet. (2016) 388:e19–23. doi: 10.1016/S0140-6736(16)30388-9
29. World Health Organization. Haemoglobin concentrations for the diagnosis of anemia and assessment of severity. Geneva: World Health Organization (2011). Available online at: https://www.academia.edu/4215770.
30. Stevens, PE, and Levin, A. Evaluation and management of chronic kidney disease: synopsis of the kidney disease: improving global outcomes 2012 clinical practice guideline. Ann Intern Med. (2013) 158:825–30. doi: 10.7326/0003-4819-158-11-201306040-00007
31. Yang, C, Jia, Y, Zhang, C, Jin, Z, Ma, Y, Bi, X, et al. Global, regional, and national burdens of heart failure in adolescents and young adults aged 10–24 years from 1990 to 2021: an analysis of data from the global burden of disease study 2021. eClinicalMedicine. (2025) 79:102998. doi: 10.1016/j.eclinm.2024.102998
32. Jürgens, V, Ess, S, Cerny, T, and Vounatsou, P. A Bayesian generalized age-period-cohort power model for cancer projections. Stat Med. (2014) 33:4627–36. doi: 10.1002/sim.6248
33. Zhang, T, Sun, L, Yin, X, Chen, H, Yang, L, and Yang, X. Burden of drug use disorders in the United States from 1990 to 2021 and its projection until 2035: results from the GBD study. BMC Public Health. (2024) 24:142. doi: 10.1186/s12889-024-19142-0
34. Cheng, X, Tan, L, Gao, Y, Yang, Y, Schwebel, DC, and Hu, G. A new method to attribute differences in total deaths between groups to population size, age structure and age-specific mortality rate. PLoS One. (2019) 14:e0216613. doi: 10.1371/journal.pone.0216613
35. Chesnaye, NC, Ortiz, A, Zoccali, C, Stel, VS, and Jager, KJ. The impact of population ageing on the burden of chronic kidney disease. Nat Rev Nephrol. (2024) 20:569–85. doi: 10.1038/s41581-024-00863-9
36. Deng, L, Guo, S, Liu, Y, Zhou, Y, Liu, Y, Zheng, X, et al. Global, regional, and national burden of chronic kidney disease and its underlying etiologies from 1990 to 2021: a systematic analysis for the global burden of disease study 2021. BMC Public Health. (2025) 25:636. doi: 10.1186/s12889-025-21851-z
37. Portolés, J, Martín, L, Broseta, JJ, and Cases, A. Anemia in chronic kidney disease: from pathophysiology and current treatments, to future agents. Front Med. (2021) 8:8. doi: 10.3389/fmed.2021.642296
38. Hanna, RM, Streja, E, and Kalantar-Zadeh, K. Burden of anemia in chronic kidney disease: beyond erythropoietin. Adv Ther. (2020) 38:52–75. doi: 10.1007/s12325-020-01524-6
39. Badura, K, Janc, J, Wąsik, J, Gnitecki, S, Skwira, S, Młynarska, E, et al. Anemia of chronic kidney disease—a narrative review of its pathophysiology, diagnosis, and management. Biomedicine. (2024) 12:191. doi: 10.3390/biomedicines12061191
40. Liu, Y, He, Q, Li, Q, Tian, M, Li, X, Yao, X, et al. Global incidence and death estimates of chronic kidney disease due to hypertension from 1990 to 2019, an ecological analysis of the global burden of diseases 2019 study. BMC Nephrol. (2023) 24:352. doi: 10.1186/s12882-023-03391-z
41. Wang, Y, Lin, T, Lu, J, He, W, Chen, H, Wen, T, et al. Trends and analysis of risk factor differences in the global burden of chronic kidney disease due to type 2 diabetes from 1990 to 2021: a population-based study. Diabetes Obes Metab. (2025) 27:1902–19. doi: 10.1111/dom.16183
42. Wang, M, Li, J, Li, Y, Yao, S, Zhao, M, Wang, C, et al. The effects of hypertension and diabetes on new-onset chronic kidney disease: a prospective cohort study. J Clin Hypertens (Greenwich). (2020) 22:39–46. doi: 10.1111/jch.13768
Keywords: anemia burden, chronic kidney disease, epidemiology, global burden of disease study, prevalence
Citation: Zheng W, Chen H, Zhang W, Cai Y, Wu Z and Guan L (2025) Global burden of anemia attributed to chronic kidney disease: prevalence, years lived with disability, and predictions to 2035 (Global burden of disease 2021). Front. Nutr. 12:1690686. doi: 10.3389/fnut.2025.1690686
Edited by:
Bing Yang, Tianjin Medical University, ChinaReviewed by:
Santosh Chokkakula, Chungbuk National University, Republic of KoreaFatemeh Shahbazi, Hamadan University of Medical Sciences, Iran
Copyright © 2025 Zheng, Chen, Zhang, Cai, Wu and Guan. This is an open-access article distributed under the terms of the Creative Commons Attribution License (CC BY). The use, distribution or reproduction in other forums is permitted, provided the original author(s) and the copyright owner(s) are credited and that the original publication in this journal is cited, in accordance with accepted academic practice. No use, distribution or reproduction is permitted which does not comply with these terms.
*Correspondence: Lixun Guan, Z3VhbmxpeHVuaG5AMTYzLmNvbQ==; Zongze Wu, MTU2OTI1MzcyNTVAMTYzLmNvbQ==; Yibo Cai, Y2FpeWlibzMwMUAxNjMuY29t
†These authors have contributed equally to this work