- Space Plasma, Power and Propulsion Laboratory, Research School of Physics and Engineering, The Australian National University, Canberra, ACT, Australia
A spatiotemporal study of neutral gas temperature during the first 100 s of operation for a radio-frequency electrothermal plasma micro-thruster operating on nitrogen at 60 W and 1.5 Torr is performed to identify the heating mechanisms involved. Neutral gas temperature is estimated from rovibrational band fitting of the nitrogen second positive system. A set of baffles are used to restrict the optical image and separate the heating mechanisms occurring in the central bulk discharge region and near the thruster walls. For each spatial region there are three distinct gas heating mechanisms being fast heating from ion-neutral collisions with timescales of tens of milliseconds, intermediate heating with timescales of 10 s from ion bombardment on the inner thruster tube surface creating wall heating, and slow heating with timescales of 100 s from gradual warming of the entire thruster housing. The results are discussed in relation to optimizing the thermal properties of future thruster designs.
1. Introduction
Electrothermal micro-thrusters are a class of small thrusters designed for use on micro- or nano-satellites, based around propellant gas heating using electrical means [1–3]. Two common types of electrothermal thruster are the resistojet and arcjet, both variants having previously been deployed on satellite missions. The resistojet heats the propellant gas through resistively heated walls, or by flowing the gas around a heater element within the thruster [2, 4]. An arcjet operates on similar principles, but instead of heating the propellant through contact with hot surfaces, the propellant volume is heated through contact with a high current arc [1, 5].
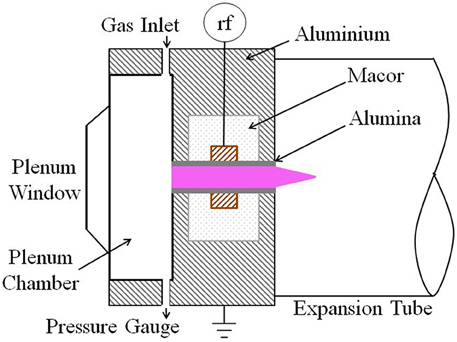
A radio-frequency (RF) electrothermal plasma micro-thruster being developed at The Australian National University is based around gas heating from ion-neutral charge exchange collisions, and has been shown to reach steady state neutral gas temperatures of ~430 K for nitrogen (N2) and ~1100 K for argon with 1% N2, during 10 W continuous operation [6]. The thruster, known as ‘Pocket Rocket’ [7, 8] and shown in Figure 1, consists of a 18 mm long, 4.2 mm inner diameter, 6.3 mm outer diameter alumina (Al2O3) tube. Radio-frequency power at 13.56 MHz and 60 W, coupled to the system through a 5 mm wide, 12 mm outer diameter copper electrode placed at the axial midpoint of the alumina tube, creates a weakly ionized plasma within the tube. Two 3 mm wide aluminum grounded electrodes located at each end of the tube join onto a 60 mm diameter solid aluminum experiment housing. The powered and grounded electrodes are separated by a 15 mm outer diameter, 3–4 mm thick insulating Macor housing in two parts surrounding the powered electrode.
Power is supplied from an ENI ACG-10 RF generator through a large variable capacitance π-matching network, although recent work has miniaturized the matching network to be suitable for micro-satellite operation [9]. Nitrogen (N2) gas is introduced through an upstream plenum chamber with the pressure in the chamber at 1.5 Torr. The plenum chamber contains a viewport located on the rear wall, providing optical access to the plasma volume within the alumina tube. Downstream the plume expands into a 50 mm diameter evacuated glass tube connected to a vacuum chamber fitted with a rotary pump giving a pressure gradient of four between the plenum and chamber. Although this is significantly lower than the pressure gradient that would occur during operation in orbit, recent simulations and experiments have shown that above a pressure gradient of approximately two the flow becomes choked and the downstream pressure becomes independent of the plasma parameters within the tube [10, 11].
Computational fluid dynamics (CFD) simulations of the Pocket Rocket thruster have shown the discharge operates in a gamma mode and is driven by ion-induced secondary electrons ejected from the inner alumina tube walls [12]. The large asymmetry of the device creates a direct current (DC) self bias on the alumina tube in the vicinity of the powered electrode, acting to accelerate the ion-induced secondary electrons into the center of the discharge bulk. This results in a peak in ion density within the center of the tube, both axially and radially, which has also been observed in experiments [7].
Volume averaged, temporally resolved, neutral gas temperature measurements in Pocket Rocket for a 60 W, 1.5 Torr N2 discharge, showed three different heating timescales [13]. Fast heating, with a time constant of 80 μs, was suggested to be occurring through ion-neutral charge-exchange collisions within the discharge volume. Slow heating, with a time constant of 100 s, was suggested to be occurring through wall heating caused by ion bombardment and vibrational de-excitation on the alumina tube walls. An intermediate heating with a time constant of 8 s was also measured, but the cause of which not identified.
Here, a spatiotemporal study of neutral gas temperature (Tg) in Pocket Rocket is performed for a 1.5 Torr (~110 sccm), 60 W, N2 discharge to confirm the two heating mechanisms suggested in the volume average temporal study and identify the third currently unknown heating mechanism [13]. Volume heating effects from ions will occur uniformly throughout the discharge volume, whereas surface heating effects will be more pronounced in regions in close proximity to the heated surface.
2. Rovibrational Spectroscopy Method
The neutral gas temperature is estimated using rovibrational spectroscopy of the N2 second positive system (C3 → B3) between the wavelengths of 365 nm and 381 nm, capturing the (0,2), (1,3), (2,4), and (3,5) vibrational transition bands [14]. Simulated spectra are iteratively fitted to the experimental data to extract both vibrational temperature (Tv) and rotational temperature(Tr) using the same method as previously fully outlined in Greig et al. [6]. At pressures of a few Torr, the collision frequency is sufficiently high to assume that the rotational and translational temperatures are in thermal equilibrium [15–17].
The experimental setup used here to capture temporal evolution of neutral gas temperature is the same as previously described [6, 13], with a 4 mm diameter optic fiber used in conjunction with a monochromator to direct discharge photons onto a charge coupled device (CCD) array. Spectral resolution is 0.02 nm, which is sufficient to resolve the band head and tail region of the N2 second positive system bands. The individual rotational bands are not resolved but this is not a requirement for this technique and does not affect accuracy [14].
A specially written Labview program simultaneously controls the RF generator used to power the discharge and the CCD array, to synchronize the plasma duration and spectra capture times. Rovibrational spectra are recorded every 5 s for the first 100 s of continuous mode operation. An integration time of 1 s is used to allow sufficient light from the discharge to be collected. The procedure was repeated 8 times with the collected spectra averaged to reduce noise. A 95% confidence interval from the iterative fitting procedure is used to give an error range on the estimated temperatures. An example rovibrational spectrum and corresponding fitted spectrum are shown in Figure 2, giving a temperature estimate of 547 ±20 K.
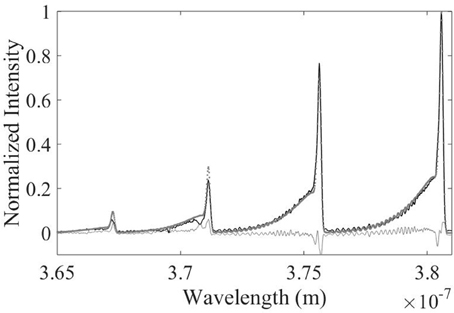
Figure 2. An example rovibrational spectrum with corresponding fitted spectrum for a 60 W, 1.5 Torr N2 plasma, giving a gas temperature estimate of 547 ±20 K. The experimental data is shown as a solid black line, the simulated spectrum is overlayed as gray dots. The error between the experimental and simulated spectra is shown as a thin gray line as an indication to the quality of the fit.
Spatial resolution is achieved by isolating three regions of interest to allow temperature measurements both in the centre of the discharge and near the walls. Using the convention of the axial centerline of the thruster as r = 0 mm, the three regions are the center of the discharge (r1 = 0–1.1 mm), a broad annular region near the walls encompassing the sheath and some of the plasma bulk (r2 = 0.8–2.1 m), and a narrow annular region near the walls (r3 = 1.4–2.1 mm) encompassing just the sheath region based on previous estimates for sheath width of up to 0.6 mm [18]. The broad wall region is used as well as the narrow region for comparison, as the brightness of the discharge in the sheath region is significantly lower than in the plasma bulk, and noise in the rovibrational spectra may introduce errors in the temperature estimates.
To isolate the regions of interest opaque disks constructed from thin (~1–2 mm thick) aluminum with (1) a 0.5 mm diameter central hole, (2) an annular ring with inner diameter of 1 mm and outer diameter of 1.5 mm, and (3) an annular ring with inner diameter of 1.5 mm and outer diameter of 2.25 mm are placed over the plenum viewport. When used in conjunction with the 4 mm diameter optical fiber placed 13 cm to the rear of the plenum window these disks isolate the required regions of interest as shown in Figure 3 (drawn to scale but resized in the vertical direction for clarity here).
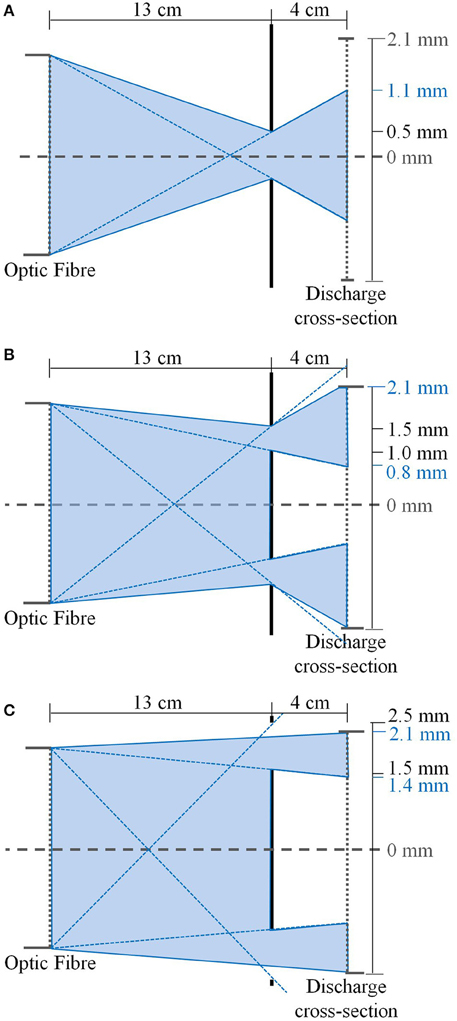
Figure 3. Optical ray diagrams showing spatial regions of interest for (A) 0–0.5 mm radius circular mask giving a region of interest r1 = 0 − 1.1 mm, (B) 1–1.5 mm radius annular mask giving a region of interest r2 = 0.8 − 2.1 mm and (C) 1.5–2.25 mm radius annular mask giving a region of interest r3 = 1.4 − 2.1 mm (drawn to scale but resized in the vertical direction for clarity here).
The discharge volume is spatially resolved across the radius, but it is not resolved axially, so the resulting temperature measurements are axially line averaged results. However, the plasma density is an over an order of magnitude higher at the axial midpoint of the tube in a region covering only about 2 mm axial length [12], and the majority of light emission captured is from this region. Therefore, the radial cross sections stated above are those located at the axial midpoint of the discharge tube.
3. Spatiotemporal Temperature Results
Spatiotemporal results for rotational temperature, hence neutral gas temperature (Tg), is shown in Figure 4 for N2 at 60 W and 1.5 Torr. The measured temperatures at each spatial and temporal co-ordinate recorded are shown as filled circles, with corresponding error bars shown as thin black lines. Error bars are based on a 95% confidence interval from the iterative fitting procedure, and are between ±15 and ±20 K for each point. Each region is given a single spatial co-ordinate for the purposes of plotting, and are defined as 0 mm for the central circular region of interest r1, and half the difference between the inner and outer diameters for the annular regions of interest, being 1.45 mm for r2 and 1.75 mm for r3. Colors indicating temperature and an extrapolated grid connecting the measurement points are also included as visual aids.
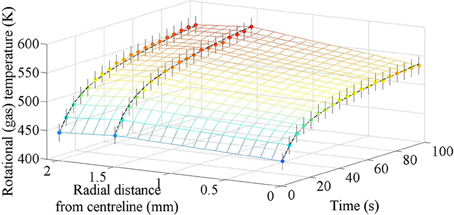
Figure 4. Spatiotemporal results for rotational (hence neutral gas) temperatures for a 60 W, 1.5 Torr nitrogen discharge during the first 100 s of operation. Measured temperature results are shown as filled circles with corresponding error bars as thin black lines. Colors are indicative of temperature and an extrapolated grid connecting the measurement points is included as a visual aid. The thicker dashed black lines represent the fit lines shown in Equations (2)–(4).
Neutral gas temperature at the time of the first measurement (during the first 1 s of operation), is between 440 and 460 K across the entire radius. This value is in excellent agreement with the volume averaged result of 450 K after 1 s of operation [13]. After 100 s, the temperature near the walls has risen to 570 K, while the temperature on the centreline has risen to 535 K. Both these results are slightly lower than the volume averaged result of 580 K but are still in reasonable agreement.
Volume heating from ion-neutral collisions is expected to be fairly uniform over the discharge volume, whereas wall heating is more localized, increasing temperatures closer to the hot wall more than in the center of the discharge. Based on visual inspection of the temperature results in Figure 4, it appears as though the initial temperature increase being uniform across the volume is from ion-neutral collisions within the discharge, with wall heating increasing the temperatures nearer the walls at longer times.
The contribution to Tg from each heating method is estimated by fitting lines to the data with the form shown in Equation (1), where T0 is the initial temperature, ΔT is the change in temperature, t the time in seconds and τ the heating time constant in seconds. The fit lines are determined manually, using the number of experimental data points the line passes through as an indication of the quality. Fitting the lines manually limits the accuracy of the final equation, but still provides estimates for the heating time constants to within an order of magnitude. Different heating mechanisms within the discharge occur on different timescales with significantly different τ values over many orders of magnitude, and hence can be separated and identified using Equation (1).
Fit lines for each spatial region are shown in Equations (2)–(4), and are overlayed on the experimental data in Figure 4 as dashed black lines. Tr1 corresponds to the central discharge region (r1 = 0 − 1.1 mm) and is overlayed on Figure 4 at r = 0 mm, Tr2 corresponds to the broad annular wall region (r2 = 0.8 − 2.1 mm) and is overlayed on Figure 4 at r = 1.45 mm, and Tr3 corresponds to the narrow annular wall region (r1 = 1.4 − 2.1 mm) and is overlayed on Figure 4 at r = 1.75 mm. The initial fast heating can not be resolved using the present experimental data as the first measurement occurs at 1 s, so the same values as previously measured in the volume averaged temporal evolution study (τ1 = 80 μs and ΔT = 140 K) are used [13].
For each spatial region there are three distinct gas heating mechanisms, identified by three distinct time constants of τ1 = 80 μs, τ2 = 10 s and τ3 = 100 s, which are the same for all spatial co-ordinates as expected, as the same three heating mechanisms are present throughout the volume. The intermediate and slow time constants, τ2 = 10 s and τ3 = 100 s, are similar to those previously found for the volume averaged heating [13] of τ2 = 8 s and τ3 = 100 s.
4. Discussion
In all three spatial regions, the fast heating mechanism (τ1 = 80 μs) has equal effect throughout the volume increasing the temperature uniformly by 140 K, confirming this heating is from ion-neutral collisions within the discharge volume. The slow heating mechanism (τ3 = 100 s) was previously suggested to be caused by heating of the thruster housing from ion bombardment and metastable quenching on the discharge tube walls [13]. A lumped thermal model of the thruster housing confirmed a time constant of 100 s is suitable for wall heating in Pocket Rocket and is supported by the spatiotemporal results demonstrating that at longer timescales the temperature near the walls increases more than in the center of the discharge.
Transit time for the propellant gas through the discharge tube is on the order of 100 ms, assuming a gas speed around 300 ms−1, therefore the intermediate heating must be from an external source and not from particle effects within the discharge. Also, the center of the discharge has a slightly smaller overall contribution from the intermediate heating than nearer the walls [see Figure 4 and Equations (2)–(4)], suggesting the heating mechanism is focused at the walls.
The Pocket Rocket discharge is a gamma discharge, driven by ion-induced secondary electrons [12], and the intermediate heating could potentially be caused by thermionic secondary electron emission becoming more dominant as the wall temperatures rises, increasing plasma density and heating from ion-neutral charge exchange collisions. However, a Langmuir probe measurement using a 1 mm diameter circular flat probe tip inserted through the rear plenum viewport and positioned on the central axis of the discharge tube at the axial midpoint shows no change in ion saturation current (hence ion density) throughout the first 100 s of continuous thruster operation.
Alternatively, various components of the thruster and housing are constructed from different materials with different densities, specific heats and thermal conductivities, as given in Table 1, and will each respond thermally at a different rate. To further investigate heating of the thruster housing and the resulting effect on propellant (gas) heating, a lumped thermal model approach is used.
Based on the housing configuration shown in Figure 1 and discussed in the Introduction, there are three possible thermal paths for heat flow from the inner alumina tube surface through the housing to the external environment. These are (1) through the alumina tube, copper electrode, Macor casing and aluminum housing, (2) through the alumina tube, Macor casing and aluminum housing, or (3) through the alumina tube and aluminum housing directly. The thermal resistance through path 3 is significantly lower than the other two paths that involve passing through Macor which is an excellent thermal insulator, hence the majority of the heat flow through the housing will be through the alumina tube and aluminum housing directly.
The lumped thermal model of the housing is therefore simplified to consider only the alumina to aluminum path. The thermal model is deconstructed into three nodes, being the alumina tube (node 1), the bulk aluminum housing (node 2) and the outer surface of the aluminum housing (node 3). The temperature of node 3, the temperature of the outer surface of the aluminum housing, was measured during the spatiotemporal experiment using a standard k-type thermocouple to provide a boundary condition for the lumped thermal model.
At node 1, the power input onto the inner tube wall by the plasma (Qin) is balanced by the increase in temperature (internal energy) of the alumina tube with density ρ1, volume V1 and specific heat cp1, the heat transfer through convection to the neutral gas over area Ag with heat transfer coefficient hg, and the loss through conduction to the aluminum housing over contact area Ac with thermal conductance coefficient hc. Radiative losses are assumed to be small and are therefore neglected. This is represented mathematically by Equation (5).
No experimental data is available for hg, so an estimate of 100 W m−2 K−1 is used based on a low pressure flowing gas [19]. As the gas flow is due to the pressure gradient between the plenum and vacuum chamber, and not a temperature gradient within the tube, it is considered to be forced convection. Power input to the inner tube wall is taken to be 19.5 W, based on a 60 W pre-match power input with 20 W (33%) lost in the matching network, 19.5 W lost to the vibrational modes and 1 W power loss in the plume. Plume power is estimated as the plume jet kinetic energy, given in Equation (6), where ṁ is the mass flow rate and vex is the plume exit velocity [20].
The thermal conductance coefficient hc depends on contact pressure and surface roughness of the alumina tube and aluminum housing, and as no data is available must be estimated. An estimate for hc can be made from the heat flow (Qin) from the inner alumina tube surface to the outer housing surface, as represented by Equation (7) [21], where L1 and k1 are the width and thermal conductivity of the alumina tube, respectively, and L2 and k2 are the width and thermal conductivity of the aluminum housing, respectively. The temperature difference between the inner alumina tube surface and outer housing surface (ΔT) is estimated as the difference between the maximum gas temperature measured in the spatiotemporal experiment and ambient (300 K).
At node 2, power input (Qin) is balanced by the increase in temperature of the aluminum housing with density ρ2, volume V2 and specific heat cp2, and the heat loss through convection to the ambient air over area Aa with heat transfer coefficient ha, as shown in Equation (8). No data is available for ha, so an estimate of 300 W m−2 K−1 is used based on natural convection from a heated plate into still atmospheric pressure air [19]. The temperature of the outer surface of the thruster housing (node 3) increases less than 15 K throughout the experiment and the use of a constant value for ha should not significantly increase errors.
Results of the lumped thermal model are shown in Figure 5. The temperature of node 1 (alumina tube) is shown as a dot-dashed blue line, the temperature at node 2 (aluminum housing) is shown as a dotted red line, the temperature of node 3 (outer aluminum surface) is shown as a solid green line, and for reference, the measured gas temperature by the wall is shown as a dotted purple line. At 300 s the wall temperature is slightly higher than the gas temperature, which indicates an probably overestimation in power input to the inner alumina tube wall in the lumped thermal model.
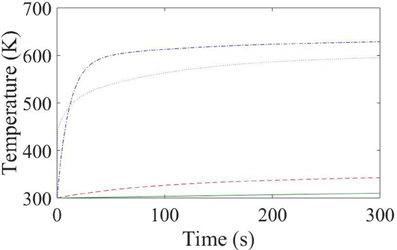
Figure 5. Lumped thermal model results for temporal heating in Pocket Rocket, showing temperature of the alumina tube (node 1—dot-dashed blue line), aluminum housing (node 2—dashed red line), and the measured outer surface temperature of the aluminum housing (node 3—solid green line) for the first 300 s of operation. Measured gas temperature near the wall is also shown as a dotted purple line for reference.
Figure 5 clearly shows that the temperature of node 1 exhibits two heating rates, one faster and one slower, whereas node 2 only exhibits one constant heating rate which approximately matches the slower heating rate of node 1. This is supported by analyzing the heating rate for a solid. The heating rate or time constant of heating for a solid with volume (V) and heat transfer surface area (A) is given by Equation (9) [19], assuming the solid heats uniformly throughout the volume.
Using the dimensions given in Figure 1 and thermal property values listed in Table 1, the heating time constant for the alumina is τAl2O3 ≈ 10 s, and the heating time constant for the aluminum is τAl ≈ 100 s. These values match the time constants found during the spatiotemporal studies for the intermediate and slow heating (τ2 = 10 s and τ3 = 100 s), confirming that heating of the alumina tube and thruster housing accounts for both the intermediate and slow neutral gas heating measured in Pocket Rocket.
The lumped thermal model assumes that each node has a uniform temperature thoughout the volume. In reality, thermal gradients develop across different housing components, with the magnitude of the gradient dependant on the thermal conductivity of the material. A low thermal conductivity material resists heat flow and a large thermal gradient will develop between the inner and outer surfaces, whereas a high thermal conductivity allows heat to flow readily and little or no thermal gradient will develop.
For a cylindrical system with length L and thermal conductivity k, the temperature difference (ΔT1 − 2) between two points at radius r1 and r2 for a total heat flow of Q is given by Equation (10) [21].
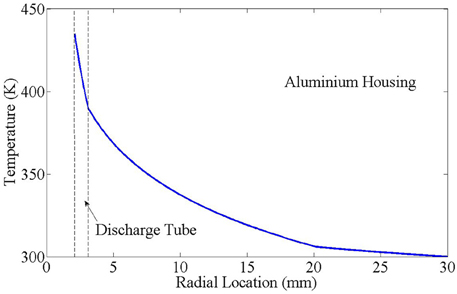
Using Equation (10), the thermal gradient through the Pocket Rocket housing after 20 s of operation is shown in Figure 6. The temperature gradient across the alumina tube (the region between the two dotted lines) is significantly sharper than the temperature gradient across the aluminum housing, due to the lower thermal conductivity of alumina compared to aluminum.
Combining the thermal gradient results from Figure 6 and spatiotemporal experiment results from Figure 4, it is concluded that in Pocket Rocket a power input from the plasma to the alumina tube through ion bombardment and metastable quenching results in heating of the alumina tube (with τ ≈ 10 s) and a thermal gradient developing across the alumina tube radius. Once the thermal gradient develops fully, the temperature of the inner surface of the alumina tube becomes limited by the outer surface of the alumina tube being in contact with the cold aluminum housing. As the bulk aluminum housing begins to slowly heat (with τ ≈ 100 s), the outer alumina tube surface temperature increases, the thermal gradient across the alumina is no longer limiting and the inner discharge tube surface continues to increase in temperature (with τ ≈ 100 s). This results in the two distinct time scales for neutral gas heating of the propellant.
To maximize the efficiency of surface heating on propellant heating in Pocket Rocket, the inner surface of the discharge tube should heat to the highest possible temperature as quickly as possible. Heating of the main thruster housing bulk should be limited and slow, as in the vacuum of space, radiation is the only mechanism available to remove heat and problems with thermal expansion and stress may arise if the housing heats significantly [22].
The lower the thermal conductance of the discharge tube material, the larger the temperature gradient that develops across the discharge tube and the hotter the inner discharge tube surface becomes. Additionally, based on Equation (9), the lower the density and specific heat of a material, the faster the final temperature will be reached. Therefore, discharge tube materials with low thermal conductance, low density and low specific heat are best suited to electrothermal plasma micro-thrusters such as Pocket Rocket.
5. Conclusions
Spatiotemporal studies of neutral gas temperature in an electrothermal plasma micro-thruster operating on N2 at 60 W and 1.5 Torr plenum pressure, demonstrate that fast (sub-millisecond) neutral gas heating occurs evenly across the discharge volume, resulting from collisional processes within the plasma. Slower neutral gas heating (tens to hundreds of seconds) from ion bombardment of the thruster walls resulting in surface heating is enhanced in regions near the walls.
Two distinct timescales for surface heating in Pocket Rocket are observed, being from heating of the alumina discharge tube initially, followed by slower heating of the entire housing bulk. The thermal design of Pocket Rocket, and other similar electrothermal devices, can therefore be optimized for future design iterations by using discharge tube materials with low thermal conductances. This will create large temperature gradients between the inner and outer surfaces of the discharge tube, optimizing the amount of heat retained in the tube for gas heating while minimizing the heat transferred into the thruster housing and associated satellite components. Further investigations into thruster housing materials and thermal design optimization should be performed as part of the development of a flight ready prototype.
Author Contributions
The conceptual design of the experiment and interpretation of the data was a collaboration between all three authors (AG, CC, RB), with the experiment performed by AG. Drafting of the manuscript was performed by AG with critical review and final approval given by CC and RB.
Funding
This research was partially funded by the Australian Space Research Program (APT project) and the Australian Research Council Discovery Project (DP140100571).
Conflict of Interest Statement
The authors declare that the research was conducted in the absence of any commercial or financial relationships that could be construed as a potential conflict of interest.
Acknowledgments
Aspects of this research made use of software developed by the Inversion Laboratory (ilab). Ilab is part of the Auscope AGOS project - an initiative of the Australian Government funded through the Education Investment Fund.
References
1. Martinez-Sanchez M, Pollard JE. Spacecraft electric propulsion - an overview. J Propul Power (1998) 14:688–99. doi: 10.2514/2.5331
2. Mueller J. Thruster options for microspacecraft. In: Micci MM, Ketsdever AD, editors. Micropropulsion for Small Spacecraft. Reston, VA: AIAA (2000). p. 45–137.
3. Arakoni RA, Ewing JJ, Kushner MJ. Microdischarges for use as microthrusters: modelling and scaling. J Phys D Appl Phys. (2008) 41:105208. doi: 10.1088/0022-3727/41/10/105208
4. Goebel DM, Katz I. Fundamentals of Electric Propulsion: Ion and Hall Thrusters. John Wiley and Sons (2008). Available online at: http://descanso.jpl.nasa.gov/SciTechBook/series1/Goebel__cmprsd_opt.pdf
5. Glocker B, Auweter-Kurtz M. Performance characteristics of a medium power hydrogen arcjet. J Propul Power (1993) 9:779–81. doi: 10.2514/3.23690
6. Greig A, Charles C, Hawkins R, Boswell RW. Direct measurement of neutral gas heating in a radio-frequency electrothermal plasma micro-thruster. Appl Phys Lett. (2013) 103:074101. doi: 10.1063/1.4818657
7. Charles C, Boswell RW. Measurement and modeling of a radiofrequency micro-thruster. Plasma Sourc Sci Technol. (2012) 21:022002. doi: 10.1088/0963-0252/21/2/022002
8. Boswell R, Charles C, Alexander P, Dedrick J, Takahashi K. Plasma expansion from a radio frequency microdischarge. Plasma Sci IEEE Trans. (2011) 39:2512–3. doi: 10.1109/TPS.2011.2143434
9. Charles C, Boswell RW, Bish A. Low-weight fixed ceramic capacitor impedance matching system for an electrothermal plasma microthruster. J Propul Power (2014) 30:1117–21. doi: 10.2514/1.B35119
10. Charles C, Bish A, Boswell RW, Dedrick J, Greig A, Hawkins R, et al. A short review of experimental and computational diagnostics for radiofrequency plasma micro-thrusters. Plasma Chem Plasma Process. (2015) 35:1–16. doi: 10.1007/s11090-015-9654-5
11. Greig AD. Pocket Rocket: An Electrothermal Plasma Microthruster. Canberra, ACT: Australian National University (2015).
12. Greig A, Charles C, Boswell RW. Simulation of main plasma parameters of a cylindrical asymmetric capacitively coupled plasma micro-thruster using computational fluid dynamics. Front Plasma Phys. (2015) 2:80. doi: 10.3389/fphy.2014.00080
13. Greig A, Charles C, Paulin N, Boswell RW. Volume and surface propellant heating in an electrothermal radio-frequency plasma micro-thruster. Appl Phys Lett. (2014) 105:054102. doi: 10.1063/1.4892656
14. Phillips DM. Determination of gas temperature from unresolved bands in the spectrum from a nitrogen discharge. J Phys D Appl Phys. (1976) 9:507. doi: 10.1088/0022-3727/9/3/017
15. Popov NA. Investigation of the mechanism for rapid heating of nitrogen and air in gas discharges. Plasma Phys Rep. (2001) 27:886–96. doi: 10.1134/1.1409722
16. Bai B, Sawin HH, Cruden BA. Neutral gas temperature measurements of high-power-density fluorocarbon plasmas by fitting swan bands of C2 molecules. J Appl Phys. (2006) 99:013308. doi: 10.1063/1.2159545
17. Huang XJ, Xin Y, Yang L, Yuan QH, Ning ZY. Spectroscopic study on rotational and vibrational temperature of N2 and N2+ in dual-frequency capacitively coupled plasma. Phys Plasma. (2008) 15:113504. doi: 10.1063/1.3025826
18. Greig A, Charles C, Boswell R. Plume characteristics of an electrothermal plasma microthruster. Plasma Sci IEEE Trans. (2014) 42:2728–9. doi: 10.1109/TPS.2014.2321176
19. Pitts DR, Sissom LE. Theory and Problems of Heat Transfer. New York, NY: McGraw-Hill Book Company Inc (1977).
20. White DBJ, Martinez-Sanchez M. Power Balance in a Helicon Plasma Source for Space Propulsion. Boston, MA: Massachusetts Institute of Technology (2008).
Keywords: plasma heating, rovibrational spectroscopy, electric propulsion, thermal conductivity, charge exchange collisions, ion bombardment
Citation: Greig A, Charles C and Boswell RW (2015) Spatiotemporal study of gas heating mechanisms in a radio-frequency electrothermal plasma micro-thruster. Front. Phys. 3:84. doi: 10.3389/fphy.2015.00084
Received: 02 September 2015; Accepted: 05 October 2015;
Published: 20 October 2015.
Edited by:
Earl E. Scime, West Virginia University, USAReviewed by:
Peter J. Bruggeman, University of Minnesota, USACostel Biloiu, Applied Materials - Varian Semiconductor, USA
Copyright © 2015 Greig, Charles and Boswell. This is an open-access article distributed under the terms of the Creative Commons Attribution License (CC BY). The use, distribution or reproduction in other forums is permitted, provided the original author(s) or licensor are credited and that the original publication in this journal is cited, in accordance with accepted academic practice. No use, distribution or reproduction is permitted which does not comply with these terms.
*Correspondence: Amelia Greig, YW1lbGlhLmdyZWlnQGFudS5lZHUuYXU=
 Amelia Greig
 Christine Charles
 Roderick W. Boswell