- 1State Key Laboratory of Space Weather, National Space Science Center, Chinese Academy of Sciences, Beijing, China
- 2College of Earth and Planetary Science, University of Chinese Academy of Sciences, Beijing, China
- 3Department of Physics, The University of Texas at Arlington, Arlington, TX, United States
The polar cap boundary (PCB) is a fundamental indicator of magnetospheric activities especially during a substorm cycle. Taking a period on 8 March 2008 as an example, we investigate the location of PCB and its dynamics during a substorm event. The PCB location is determined from the Piecewise Parabolic Method with a Lagrangian Remap (PPMLR) -Magnetohydrodynamic (MHD) simulation data and Defense Meteorological Satellite Program (DMSP) observations, respectively. Model-observation comparison indicates that the PPMLR-MHD model gives a reliable estimate of PCB location during a complex substorm sequence. We further analyze the evolution of PCB in that period. The polar cap expands under southward interplanetary magnetic field (IMF), since the low-latitude dayside reconnection produces new open magnetic flux. Meanwhile, more solar wind energy enters and stores in the magnetosphere with the decreasing SML (SuperMAG Auroral Lower) index. After the substorm expansion onset, the polar cap contracts for a while due to the explosive increase of nightside reconnection. When the IMF direction turns northward, the polar cap contracts continuously, since the dayside reconnection ceases and no more open magnetic flux are supplied, and the storage energy in the magnetosphere releases with the increasing SML index. The model results are in good accord with the features from observations.
Introduction
The high-latitude polar ionosphere has two characterized regions, namely the polar cap and the auroral oval. In the auroral oval, the geomagnetic field lines are closed and map to the plasma sheet and the plasma sheet boundary layer in the magnetosphere, whereas the field lines in the polar cap are open and connect to the solar wind. The separatrix boundary which separates these two basically different magnetic and plasma domains is named as polar cap boundary (PCB).
The polar cap region connects the interplanetary space with geospace. The variations of PCB location and polar cap area reflect the balance between the dayside merging and nightside reconnection [1, 2]. The dayside reconnection opens the original closed geomagnetic field lines, thus the polar cap area will increase and PCB will move to lower latitude with the increasing dayside reconnection rate. On the other hand, the nightside reconnection closes the open field lines. The polar cap area will decrease, and PCB will move to higher latitude with the increasing nightside reconnection rate. Since the upstream solar wind conditions have a major influence on the reconnection of magnetopause/magnetotail, its variations may lead to the dynamics of PCB. Especially, the Y component of IMF can cause an asymmetry of the two-cell plasma convection pattern at the high-latitude ionosphere (e.g., [3, 4]), thereby the dawn-dusk asymmetry of cutoff latitudes for protons and electrons [5], and polar cap boundary (e.g., [6, 7]). In many studies, the polar cap boundary and area were used as a diagnostic of magnetospheric activities specifically during a substorm cycle (e.g., [8–13]).
The magnetospheric substorm is a brief disturbance in the Earth's magnetosphere. Its main disturbance regions include the entire magnetotail, plasma sheet and ionosphere near the auroral zone. In general, the duration of a substorm case ranges from half hour to several hours. A typical substorm loading-unloading cycle includes the growth, expansion and recovery phase (e.g., [14]). During the growth phase solar wind energy is added to the magnetosphere and its configuration evolves toward an unstable state. This unstable situation is followed by a transient explosive unloading with a very high tail reconnection rate. The beginning time of this explosive unloading is named as substorm expansion onset. During the expansion phase the magnetosphere releases stored energy through a variety of processes. In recovery phase these die away and the magnetosphere becomes quiet [15]. Therefore, the magnetospheric substorm is closely related to the energy store and release in the solar wind-magnetosphere coupling.
In situ observation has the inevitable disadvantage of monitoring the entire coupling solar wind-magnetosphere system and its temporal evolution because of the poor data coverage of satellite. In comparison, the three-dimensional global magnetohydrodynamic (MHD) models which aim to model the fundamental physical processes in the coupling solar wind-magnetosphere system are powerful tools for simulating and analyzing the entire process of a real substorm event. Many studies have already employed global MHD models to simulate a real substorm event and checked the reliability of their results by comparing with observations. Using the Lyon-Fedder-Mobarry (LFM)—MHD model, Fedder et al. [16] reported the first global MHD simulation of an actual substorm event observed by Viking spacecraft on 19 October 1986. They compared model-derived synthetic auroral emissions to Viking images, and also compared synthetic AU (Auroral Upper) and AL (Auroral Lower) indices to geomagnetic measurements. Their simulation results are in reasonable agreement with the observations throughout the growth phase and expansion onset. Wiltberger et al. [11] presented LFM simulated results of a substorm that occurred on 10 December 1996, and obtained excellent agreement between the simulation results and the magnetotail observations during the growth and expansion phases including lobe field increasing, dipolarizations, and fast flows. Raeder et al. [17] has simulated a substorm event of 24 November 1996 using their Geospace General Circulation Model (GGCM)—MHD model. They compared the simulated results with ground magnetometers, Assimilative Mapping of Ionospheric Electrodynamics (AMIE) polar cap potential and field aligned current, open magnetic flux estimated by Polar Visible Imaging System, Geostationary Operational Environmental Satellite (GOES)-8 magnetometer data, International Monitoring Platform (IMP)-8 magnetic field data, and Geotail plasma and field data. The comparison showed their model reproduced the prominent substorm features of this event. Wang et al. [18] has simulated a substorm event of 28 September 2004 for the first time using Space Weather Modeling Framework (SWMF)-MHD model, and validated their results using Geotail and Cluster satellite observations. It was showed that the SWMF model can predict well the large-scale variations of the magnetospheric magnetic field and ionospheric currents during this substorm event. Using the Piecewise Parabolic Method with a Lagrangian Remap (PPMLR)-MHD model, Wang et al. [19] simulated the substorm event of 8 March 2008 and compared the equivalent current systems (ECS) in the ionosphere derived from the MHD model and geomagnetic observations using the KRM inversion algorithm. The magnetic latitude and local time distributions of the ECS from MHD simulation are in good agreement with the inversion results.
Recently, Wang et al. [20] showed the PPMLR-MHD model can present a reliable PCB location under steady magnetospheric conditions. However, the reliability of PPMLR simulated PCB and its dynamics under magnetospheric substorm activities are still unknown. Taking advantage of the simulation data used previously by Wang et al. [19], we will validate in this study the PPMLR simulated PCB by comparing with Defense Meteorological Satellite Program (DMSP) observations, and analyze further the dynamics of PCB during the substorm event on 8 March 2008.
The 8 March 2008 Event Outline
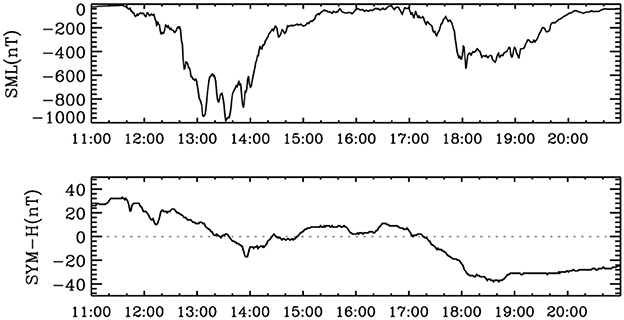
Figure 1 presents the SML (SuperMAG Auroral Lower) and SYM-H (Symmetric disturbance—Horizontal component) index during the 8 March 2008 event. The minimum SYM-H index is about −35 nT, implying there are no major magnetic storms. Indicated by the SML index, two isolated substorms occurred during this time period. The first one started at about 1,130 UT, reached its peak round 1,340 UT, then started to recover till 1,530 UT. The second one started at 1,650 UT and lasted more than 3 h before returning to the quiet level. The first substorm seems more intense than the second one, with the minimum SML value of about 950 nT compared with 550 nT for the second one.
The upstream solar wind observations of this event which are obtained from NASA OMNI data (http://cdaweb.gsfc.nasa.gov/) are plotted in Figure 2. It is noted that the simulation of 8 March 2008 event in Wang et al. [19] adopted three assumptions when they used these OMNI data as the input parameters of PPMLR-MHD model. (1) The OMNI data were used for the inflow boundary of MHD model without the correction of the time difference for the solar wind propagation from 30 Re to the bow shock nose (~5 min). (2) The IMF Bx was fixed as zero for keeping the divergence-free condition in the PPMLR-MHD simulation. (3) The Earth's dipole moment was assumed to be due southward. Figure 3 shows that the dipole tilt angle changes within the range from −5° to 5° during the 8 March 2008 event. Since a dipole tilt angle with the magnitude of 35° just brings 1–2° deviation degree to the PCB latitudes [21], we do not think that the assumption of zero dipole tilt angle will significantly affect the PCB determination.
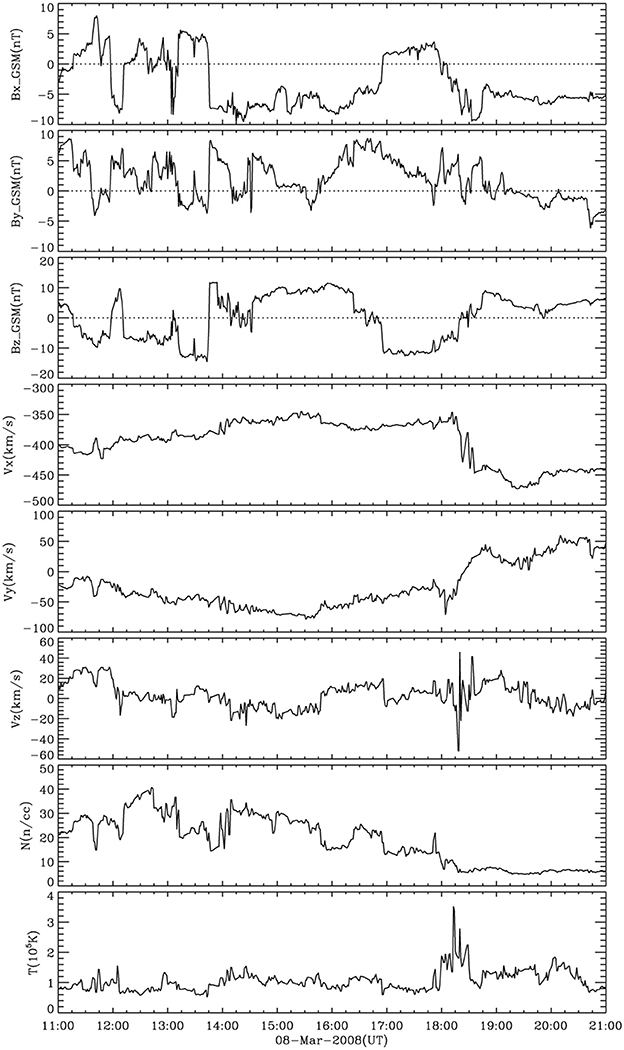
Figure 2. Solar wind properties of the 8 March 2008 event from the OMNI data; From the top to the bottom, the three components of interplanetary magnetic field (IMF) and solar wind velocity, the solar wind plasma number density and temperature, respectively.
Determination of PCB from Simulation Data
We diagnose the PCB location from the PPMLR-MHD simulation data used previously by Wang et al. [19]. For the details of the PPMLR-MHD model and the simulation of 8 March 2008 event, please refer to Wang et al. [19].
PCB is considered to be the separatrix line between the open and closed magnetic field lines. To obtain the whole PCB from the global MHD simulation data, we trace magnetic field lines from the foot-points at the inner boundary using the Runge-Kutta method (e.g., [22, 23]). The grid resolution of foot-points is one degree in both magnetic latitude and longitude with the latitude changing from 90° to 0° and the longitude from 0° to 360°. Every tracing completes when the field line returns to the inner boundary, or it reaches the boundary of computational domain, or its length exceeds 1,000 Re. If the field line finally reaches the inner boundary, it is assumed to be a closed field line; otherwise, it is an open one. We map all foot-points of those field lines from the inner boundary to the ionosphere along the dipole field lines. The ionospheric grids connected to the open and closed field lines are marked with 1 and −1, respectively. The zero contour of these grids is our expected PCB.
Results
In this section, we employ DMSP satellite particle observations to determine the PCB location, and make comparison between the MHD results and DMSP crossings. Based on the simulation and observation results, we also go further to analyze the evolution of PCB during the 8 March 2008 event.
The DMSP satellites orbit the Earth in a Sun-synchronous 98° inclination orbit near 840 km altitude. Each satellite carries the SSJ/4 sensor that measures the flux of precipitating ions or electrons between 30 eV to 30 keV once per second. There are four DMSP satellites (F13, F15, F16, F17) which overpass the northern polar region on March 2008.
Since the high energy (>few keV) particles are generally considered to be trapped on closed field lines only, and cannot persist for long on open field lines, the boundary between energetic particles (1~10 s keV) at lower latitudes and softer precipitation at higher latitudes can be identified with the PCB (e.g., [24–26]). Figure 4 shows an example of the boundary location identification procedures applied to a northern hemisphere pass of F13. In this overpass the PCB crossings as the F13 satellite passes into and then out of the polar cap are marked by the vertical red lines.
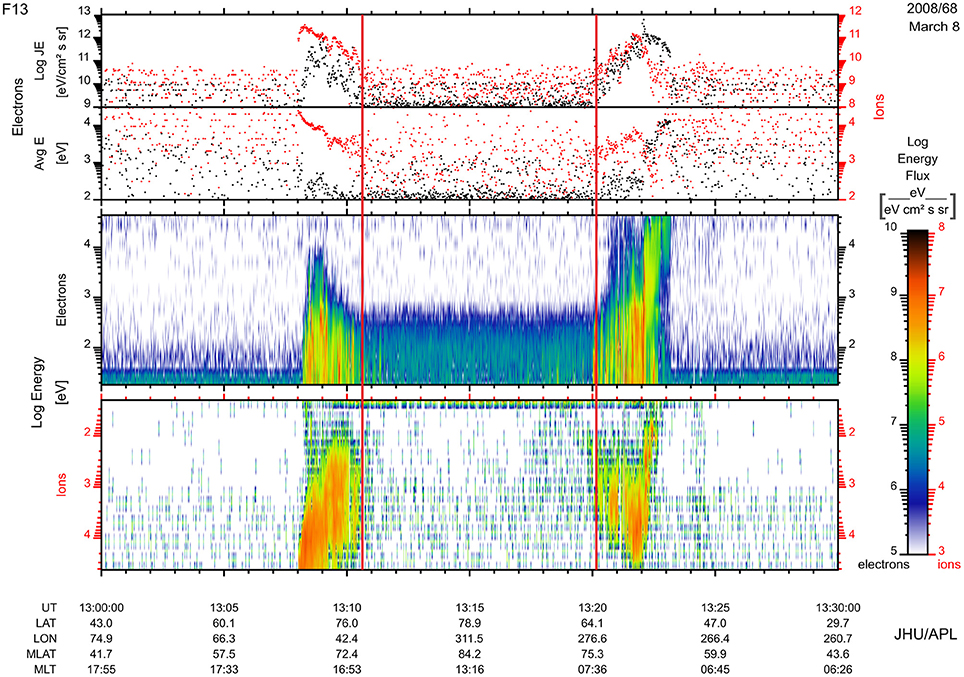
Figure 4. Electron and ion precipitation fluxes measured from DMSP F13 during the northern hemisphere pass on 8 March 2008. The first panel plots total energy flux in eVcm−2s−1sr−1, and the second panel shows average energy in eV; Black refers to electron, red to ion. The spectrogram itself shows differential energy flux in cm−2s−1sr−1. The actual PCB locations are marked by the vertical red lines.
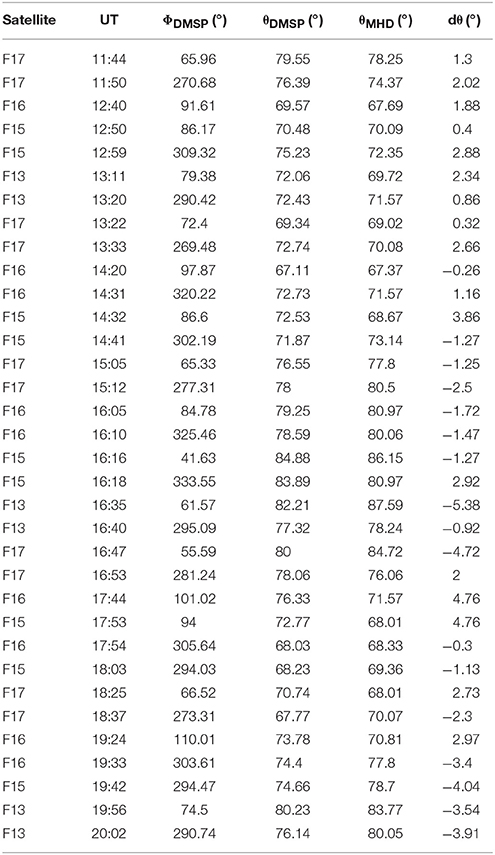
Using the above-mentioned method, we determine 34 PCB crossings at the northern hemisphere during this event. The specific details of crossings are listed in Table 1, which includes No. of satellite, universal time, longitude (ΦDMSP) and latitude (θDMSP) of DMSP crossings in the Solar Magnetospheric (GSM) coordinate system, the corresponding PCB latitudes from PPMLR simulation (θMHD), the deviations between DMSP determined and PPMLR simulated PCB latitudes (dθ = θDMSP-θMHD).
The model-data comparison has been conducted to test whether the simulations follow general trends of the observations. The results in Table 1 indicate that the average deviation of PCB latitudes between the MHD simulations and the DMSP observations is about 2.33°, and the correlation coefficient between them is 0.89. Figure 5 shows the pattern of PCB latitudes changing with the universal time. Here, the dawn-side crossings correspond to 180° < ΦDMSP <360°, the dusk-side crossings correspond to 0° < ΦDMSP <180°, the blue dots refer to the PCB latitudes from DMSP observations, and the red dots denote the results from PPMLR simulations. As shown in Figure 5, we obtain a good agreement of the simulation results with key DMSP observations. Nevertheless, there are still some small disagreements between the simulation results and observations; for instance, the PPMLR-MHD model overestimates the dawn side sector of PCB and underestimate the dusk side sector of PCB during the second substorm case to some extent. The reasons that cause the deviation between the PCB location derived from DMSP measurements and PPMLR-MHD simulations could be as follows. (1) Based on the PPMLR-MHD simulations, Hu et al. [27] found that even under quiet interplanetary conditions, the Earth's magnetosphere is never exactly steady, but keep oscillating. Therefore, the MHD simulation has the systematic error which may cause errors to the PCB determined from MHD simulations. (2) The PPMLR-MHD simulation adopts the assumptions of zero IMF Bx and zero tilt angle. While the IMF Bx and tilt angle are not the main influencing factor of PCB location, these simple assumptions may bring errors to the results of MHD simulations. (3) The ionospheric conductances of PPMLR-MHD model are determined based on two empirical models shown in Moen and Brekke [28] and Ahn et al. [29] respectively. The differences between the empirical model and the real situation should cause errors to the results of MHD simulations to a certain extent as well.
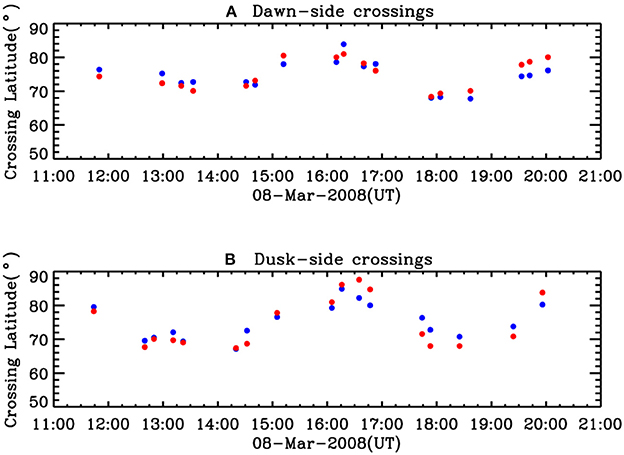
Figure 5. The pattern of comparison of PCB latitudes between DMSP observations and PPMLR simulations.
Furthermore, we analyze the evolution of PCB based on the Figure 5 and the corresponding SML index and solar wind conditions as well. At the start of this event, the IMF is oriented southward except for the time around 1,200 UT when the IMF has a northward turning briefly, suggesting that the low-latitude dayside reconnection should be creating new open magnetic flux [1, 30], and indeed the PCB tends to lower latitude between 1,120 and 1,240 UT. The decreasing SML index means more solar wind energy flow into and store in the magnetosphere. Following the expansion onset of the first substorm (1,240 UT, it is consistent with the results determined by the methods in [31, 32]), the dusk-side PCB latitude begins to increase until around 1,315 UT. Due to the limited number of DMSP crossings, we are not able to obtain the changing tendency of dawn-side PCB during this time. However, this is still enough to indicate that the reconnection increases sharply and destroys more open magnetic flux in the tail after the expansion onset. When IMF Bz turns northward at 1,345 UT, dawn- and dusk-side PCB persistently tend to much higher latitude until 1,635 UT since the low-latitude dayside reconnection ceases and no more open magnetic flux are produced. Meanwhile, the storage energy in the magnetosphere releases with the increasing SML index. After 1,640 UT, the turning southward of IMF Bz opens the low-latitude dayside reconnection again, and causes the PCB latitude decreases and the polar cap expands. The energy loads in the magnetosphere with the decreasing SML index. The IMF Bz once again turns northward at 1,824 UT. After that, the PCB latitude begins to increase, and the storage energy releases with the increasing SML index again. Although the DMSP satellite has a very limited number of crossings, we can still identify the typical changing features of PCB during this substorm event. The simulation results reproduce the observations quite well.
Conclusions
Taking the 8 March 2008 Event as an example, we investigate the PCB and its dynamics during substorm events. The PCB locations are directly determined from the simulation data used previously by Wang et al. [19]. We take advantage of DMSP particle observations to determine the PCB satellite crossings, and then present the comparison of PCB locations between the PPMLR-MHD results and DMSP measurements. During this event, we find good agreements between the MHD modeling results and observations.
Based on the MHD simulations and DMSP observations, we analyze the evolution of PCB during this event as well. The polar cap is found to expand when the IMF becomes southward since the low-latitude dayside reconnection creates new open magnetic flux. Meanwhile, more solar wind energy flow into and store in the magnetosphere with the decreasing SML index. After the substorm expansion onset, the polar cap contracts for a while due to the explosive increase of nightside reconnection. When the IMF turns northward, the polar cap contracts continuously because the low-latitude dayside reconnection ceases and no more open magnetic flux are produced, and the storage energy in the magnetosphere releases with the increasing SML index.
Although the DMSP satellite has a very limited number of crossings, we can still identify the typical changing features of PCB during this substorm event. The MHD simulation reproduces the features from observations quite well. Results shown in this study illustrate the accuracy with which an MHD simulation can be used to model the magnetosphere-ionosphere system and present the evolution of PCB even during complex substorm sequences.
Data Availability Statement
All the simulation data used in this study are available by emailing the authors (CW:cw@spaceweather.ac.cn JW:jywang@spaceweather.ac.cn). The SML index was obtained from the website at http://supermag.jhuapl.edu/indices/. The OMNI data were generated by J. H. King and N. Papitashivilli and obtained from http://cdaweb.gsfc.nasa.gov/. The DMSP particle detectors were designed and calibrated by Dave Hardy, Fred Rich, and colleagues of AFRL, and data were provided via Applied Physics Laboratory at the Johns Hopkins University (JHU/APL) (http://sd-www.jhuapl.edu/Aurora/spectrogram/index.html).
Author Contributions
CW analyzing results and writing the whole paper; JW, HL, JZ, BT simulating the substorm case and analyzing the simulation results; RL analyzing the DMSP data.
Funding
This work was supported by the NNSFC grants 41731070, 41574159, 41404123, 41774155, CAS grants QYZDJ-SSW-JSC028, XDA15052500, and in part by the Specialized Research Fund for State Key Laboratories of China.
Conflict of Interest Statement
The authors declare that the research was conducted in the absence of any commercial or financial relationships that could be construed as a potential conflict of interest.
Acknowledgments
The authors would like to acknowledge Prof. Youqiu Hu for his information on the PPMLR-MHD simulation code, by which the simulation data used in this study were calculated.
References
1. Dungey JW. Interplanetary magnetic field and the auroral zones. Phys Rev Lett (1961) 6:47–8. doi: 10.1103/PhysRevLett.6.47
2. Milan SE, Provan G, Hubert B. Magnetic flux transport in the Dungey cycle: a survey of dayside and nightside reconnection rates. J Geophys Res. (2007) 112:A01209. doi: 10.1029/2006JA011642
3. Reiff PH, Burch JL. IMF By-dependent plasma flow and Birkeland currents in the dayside magnetosphere: 2. A global model for northward and southward IMF. J Geophys Res. (1985) 90:1595–609. doi: 10.1029/JA090iA02p01595
4. Heppner JP, Maynard NC. Empirical high-latitude electric field models. J Geophys Res. (1987) 92:4467–89. doi: 10.1029/JA092iA05p04467
5. Dmitriev AV, Jayachandran PT, Tsai LC. Elliptical model of cutoff boundaries for the solar energetic particles measured by POES satellites in December 2006. J Geophys Res. (2010) 115:A12244. doi: 10.1029/2010JA015380
6. Lee DY, Ohtani S, Lee JH. On the poleward boundary of the nightside auroral oval under northward interplanetary magnetic field conditions. J Geophys Res. (2010) 115:A08204. doi: 10.1029/2009JA014906
7. Lukianova R, Kozlovsky A. IMF By effects in the plasma flow at the polar cap boundary. Ann Geophys. (2011) 29:1305–15. doi: 10.5194/angeo-29-1305-2011
8. Newell PT, Feldstein YI, Galperin YI, Meng CI. Morphology of nightside precipitation. J Geophys Res. (1996) 101:10737–48. doi: 10.1029/95JA03516
9. Lyon JG, Lopez RE, Goodrich CC, Wiltberger M, Papadopoulos K. Simulation of the March 9, 1995, substorm: auroral brightening and the onset of lobe reconnection. Geophys Res Lett. (1998) 25:3039–42. doi: 10.1029/98GL00662
10. Lopez RE, Wiltberger M, Lyon JG, Goodrich CC, Papadopoulos K. MHD simulations of the response of high-latitude potential patterns and polar cap boundaries to sudden southward turnings of the interplanetary magnetic field. Geophys Res Lett. (1999) 26:967–70. doi: 10.1029/1999GL900113
11. Wiltberger M, Pulkkinen TI, Lyon JG, Goodrich CC. MHD simulation of the magnetotail during the December 10, 1996, substorm. J Geophys Res. (2000) 105:27649–663. doi: 10.1029/1999JA000251
12. Milan SE. Dayside and nightside contributions to the cross polar cap potential: placing an upper limit on a viscous-like interaction. Ann Geophys. (2004) 22:3771–7. doi: 10.5194/angeo-22-3771-2004
13. Milan SE, Cowley SWH, Lester M, Wright DM, Slavin JA, Fillingim M, et al. Response of the magnetotail to changes in the open flux content of the magnetosphere. J Geophys Res. (2004) 109:A04220. doi: 10.1029/2003JA010350
14. Rostoker G, Akasofu SI, Baumjohann W, Kamide Y, Mcpherron RL. The roles of direct input of energy from the solar wind and unloading of stored magnetotail energy in driving magnetospheric substorms. Space Sci Rev. (1988) 46:93–111. doi: 10.1007/BF00173876
15. Pulkkinen TI, Baker DN, Toivanen PK, Pellinen RJ, Friedel RHW, Korth A. Magnetospheric field and current distributions during the substorm recovery phase. J Geophys Res. (1994) 99:10955–66. doi: 10.1029/93JA02718
16. Fedder JA, Slinker SP, Lyon JG, Elphinstone RD. Global numerical simulation of the growth phase and the expansion onset for a substorm observed by Viking. J Geophys Res. (1995) 100:19083–93. doi: 10.1029/95JA01524
17. Raeder J, McPherron RL, Frank LA, Kokubun S, Lu G, Mukai T, et al. Global simulation of the Geospace Environment Modeling substorm challenge event. J Geophys Res. (2001) 106:381–95. doi: 10.1029/2000JA000605
18. Wang H, Ma S, Ridley AJ. Comparative study of a substorm event by satellite observation and model simulation. Chinese Sci Bull. (2010) 9:859–866. doi: 10.1007/s11434-009-0282-4
19. Wang C, Zhang JJ, Tang BB, Fu SY. Comparison of equivalent current systems for the substorm event of 8 March 2008 derived from the global PPMLR-MHD model and the KRM algorithm. J Geophys Res. (2011) 116:A07207. doi: 10.1029/2011JA016497
20. Wang C, Wang JY, Lopez RE, Zhang LQ, Tang BB, Sun TR, et al. Effects of the interplanetary magnetic field on the location of the open-closed field line boundary. J Geophys Res Space Phys. (2016) 121:6341–52. doi: 10.1002/2016JA022784
21. Kabin K, Rankin R, Rostoker G, Marchand R, Rae IJ, Ridley AJ, et al. Open-closed field line boundary position: a parametric study using an MHD model. J Geophys Res. (2004) 109:A05222. doi: 10.1029/2003JA010168
22. Atkinson KE. An Introduction to Numerical Analysis, 2nd ed. New York, NY: John Wiley & Sons (1989).
23. Butcher JC. Numerical Methods for Ordinary Differential Equations. New York, NY: John Wiley & Sons (2008).
24. Hardy DA. Precipitating Electron And Ion Detectors (SSJ/4) for the Block 5D/flights 6-10 DMSP Satellites: Calibration and Data Presentation. Rep. AFGL-TR-84-0317. Bedford, MA: Air Force Geophysics Lab (1984).
25. Sotirelis T, Newell PT, Meng CI. Shape of the open closed boundary of the polar cap as determined from observations of precipitating particles by up to four DMSP satellites. J Geophys Res Space Phys. (1998) 103:399–406. doi: 10.1029/97JA02437
26. Milan SE, Lester M, Cowley SWH, Oksavik K, Brittnacher M, Greenwald RA, et al. Variations in the polar cap area during two substorm cycles. Ann Geophys. (2003) 21:1121–40. doi: 10.5194/angeo-21-1121-2003
27. Hu YQ, Guo XC, Li GQ, Wang C, Huang ZH. Oscillation of quasi-steady Earth's magnetosphere. Chin Phys Lett. (2005) 22:2723–6.
28. Moen J, Brekke A. The solar flux influence on quiet time conductances in the auroral ionosphere. Geophys Res Lett. (1993) 20:971–4. doi: 10.1029/92GL02109
29. Ahn BH, Richmond AD, Kamide Y, Kroehl HW, Emery BA, de laBeaujardiére O, et al. An ionospheric conductance model based on ground magnetic disturbance data. J Geophys Res. (1998) 103:14769–80. doi: 10.1029/97JA03088
30. Dungey JW. The structure of the exosphere or adventures in velocity space. In: De Witt C, Hieblot J, LeBeau L, editors. Geophysics: The Earth's Environment. New York, NY: Gordon and Breach (1963). p. 503–50.
31. Li H, Wang C, Peng Z. Solar wind impacts on growth phase duration and substorm intensity: a statistical approach. J Geophys Res Space Phys. (2013) 118:4270–8. doi: 10.1002/jgra.50399
Keywords: polar cap boundary, MHD simulation, substorm, DMSP observations, magnetic reconnection, open magnetic flux
Citation: Wang C, Wang J, Lopez R, Li H, Zhang J and Tang B (2018) Determination of Polar Cap Boundary for the Substorm Event of 8 March 2008. Front. Phys. 6:50. doi: 10.3389/fphy.2018.00050
Received: 25 February 2018; Accepted: 09 May 2018;
Published: 28 May 2018.
Edited by:
Hermann Lühr, Helmholtz-Zentrum Potsdam Deutsches Geoforschungszentrum (GFZ), GermanyReviewed by:
Alexei V. Dmitriev, National Central University, TaiwanArnaud Masson, European Space Astronomy Centre (ESAC), Spain
Copyright © 2018 Wang, Wang, Lopez, Li, Zhang and Tang. This is an open-access article distributed under the terms of the Creative Commons Attribution License (CC BY). The use, distribution or reproduction in other forums is permitted, provided the original author(s) and the copyright owner are credited and that the original publication in this journal is cited, in accordance with accepted academic practice. No use, distribution or reproduction is permitted which does not comply with these terms.
*Correspondence: Chi Wang, Y3dAc3BhY2V3ZWF0aGVyLmFjLmNu
 Chi Wang
 Jiangyan Wang1,2
 Ramon Lopez
 Hui Li