 Leila Farhadi
 Carline Fermino Do Rosario
 Edward P. Debold
 Aparna Baskaran3
 Jennifer L. Ross
- 1Hasbrouck Laboratory, Department of Physics, University of Massachusetts Amherst, Amherst, MA, United States
- 2Department of Kinesiology, University of Massachusetts Amherst, Amherst, MA, United States
- 3Department of Physics, Brandeis University, Waltham, MA, United States
Spontaneous self-organization of active matter has been demonstrated in a number of biological systems including bacteria, cells, and cytoskeletal filaments. Cytoskeletal filaments act as active polar rods when they are propelled along a glass surface via motor proteins. Actin has previously been shown to display polar or nematic ordering, whereas microtubules have been shown to create large vortices. For the first time, we combine both the actin and microtubule gliding into a composite active system. In the absence of actin filaments, microtubule filament organization transitions from isotropic to nematic to polar as a function of filament density. We find that the presence of a crowder, methylcellulose, is essential for this transition. In the absence of microtubules, actin transitions from isotropic to nematic. In combination, microtubules are affected by the presence of actin and the overall density of the filaments, becoming entrained with the nematic alignment of actin. Actin filaments are not as affected by the presence of microtubules. These results serve as first step in exploring the rich emergent behavior that can result from composite active matter system with tunable particle properties, self-propulsion speeds, and interparticle interactions.
Introduction
Active materials are a recently demarcated class of non-equilibrium systems that are characterized by energy input at the microscale that results in emergent steady states at long length scales. Being inherently out of equilibrium due to the microscopic drive, the basic mechanisms that lead to emergent behavior provide a pathway to design materials that have properties prohibited thermodynamically in traditional systems [1] and identify design principles for directed self-assembly [2]. Further, active materials serve as a useful theoretical paradigm to understand biochemomechanical functionality in biological systems ranging from sub-cellular [3–5] to tissues [6–8].
From a fundamental point of view it is useful to categorize active materials based on the symmetry of the active drive and the interactions among particles [9, 10]. The most common realization of activity is self-propulsion, a self-replenishing velocity along one direction of the body axis of the particles that compose the material. This could arise either due to flagellar swimming in the case of bacteria [11, 12] or due to cytoskeletal motility as in the case of epithelial cells [13, 14], due to chemical catalysis in the case of synthetic systems [15, 16] or due to the activity of a motor protein carpet as in the case of motility assays [17–19]. The symmetry of this form of drive is called “polar” in that there is a specific direction in the particle coordinates in which the driving acts. The emergent properties of self-propelled particle systems are determined by the symmetry of the interaction. The most well studied case is that of isotropic (non-aligning) excluded volume interactions. Isotropic active fluids have proved fruitful to describe synthetic self-propelled particle systems [20, 21] and have led to our understanding of such phenomena as athermal phase separation [20], rectification in the presence of barriers [22], and boundary effects [23].
Another realization of interactions among self-propelled particles is nematic alignment, where the body axes of two interacting particles along which their self-propulsion axes are equally likely to be aligned parallel or anti-parallel with respect to each other. This is a well-studied model theoretically, using microscopic simulations [24–28], statistical mechanics [29–31], and continuum theory [32–35]. Spectacular phenomenology predicted from the theoretical investigations include the existence of anomalous Giant Number fluctuations and phase separation into bands, and instability of the bands leading to a chaotic inhomogeneous steady state. The experimental investigations into this rich parameter space have been more limited. A vibrated monolayer of granular rods have been used as an experimental test bed for some of these ideas [36, 37] while this theoretical paradigm has been used to understand some emergent behavior in B. Subtilis [11, 12, 38] and myxobacteria colonies [39–41]. Further, to date, most active matter systems explored experimentally, have been composed of a single species of active particle, while theoretical work on self-propelled particles with varying motility has shown segregation behavior in bulk [42] and under confinement [43].
In this work, we create a new, composite system composed of both microtubules and actin filaments as rods propelled by their respective motor proteins, kinesin-1 and myosin-II. We build upon past work with actin systems [1, 17, 44, 45] and our own prior work with microtubule systems [46–48]. The theory above describes actin ordering from isotropic to nematic, but prior experimental reports have shown that actin can also transition to global polar order, where all the filaments are propelled in the same direction [17, 49]. The same theories apply to microtubule systems, but microtubule ordering has often been difficult to observe, especially in kinesin-driven filament gliding assays. In our previously published works, we used microtubule-gliding assays with kinesin-1 motors to examine the effects of both filament density and crosslinkers on self-organization of microtubules [46–48]. We found that two microtubules do not interact at low concentration [46, 47], often crossing each other as if the other filament was not in the path. When taken to higher filament densities, we found that there was no long-range order, instead small, single microtubule loops form [46]. Other microtubule motors, such as axonemal dynein, have been shown to create arrays of large vortices of gliding microtubules [18]. In this manuscript, we report a method for creating microtubule self-organization for the first time. Microtubules are capable of nematic and polar order at high densities. Interesting, the same experimental parameters cause actin filaments to lose their polar order, although they can still exhibit nematic ordering.
In this work, we take self-organization a step forward by creating a new, composite system composed of both microtubules and actin filaments as self-propelled rods. This system can serve as a model to explore the emergent behavior of composite self-propelled particles with aligning interactions and variable motility and particle properties. The actin and microtubule composite is also biologically interesting because microtubules and actin filaments make up part of the essential cytoskeletal network of cells. Microtubules serve as long-range support structures and the long-distance highway system for intracellular transport in the cell [50]. Actin filaments serve as active force generators for cell motility and cellular contraction, as well as the short-range, local road system for intracellular transport [50]. Each of these cytoskeletal networks self-organize into important architectures within cells, and are presumed to interact, yet little is known about those interactions. Recent work has illustrated that microtubule-associated proteins and actin binding proteins can serve as the intermediary between these two networks to drive co-organization during simultaneous co-polymerization [51, 52]. The cytoskeletal structure is active, using the energy of ATP (actin) or GTP (microtubules) hydrolysis to rearrange itself as needed based on the cell's life cycle state, cell cycle state, or local environment. The cell has no internal intelligence prescribing the cytoskeletal architecture. Instead, the microtubule and actin networks must self-organize using physical and chemical cues. The work presented here is an important step in understanding how actin and microtubules could self-organize and coordinate in the cell using only physical (steric) interactions.
In the experiments reported here, we find that actin alone changes from isotropic to nematic organizations with increasing filament density while microtubules exhibit isotropic, nematic, and polar ordering. When mixed together, we find that the actin can inhibit microtubule polar order, and the filaments can affect each other to cause entrainment. We find that the effect is stronger for actin affecting microtubule organization, but not as effective for microtubules on actin alignment. These results serve as first step in exploring the rich emergent behavior that can result from this composite active matter system with tunable particle properties, self-propulsion speeds, and interparticle interactions.
Materials and Methods
Actin Polymerization
Actin was purified from acetone powder of chicken pectoralis muscle as previously described [53]. Briefly, G-actin was extracted from the actetone powder in a low salt buffer (2 mM Tris base, 0.2 mM CaCl2, 0.005% NaN3, at pH 8.0) on ice in a cold room (4°C). Actin filaments were then polymerized in a solution including 1 mM ATP, 10 mM imidazole, 50 mM KCl, 1 mM MgCl2, and 1 mM DTT, pH 7.5. Labeled actin filaments were polymerized in the same buffer from a combination of rhodamine-labeled globular actin (Cytoskeleton) and unlabeled actin at a ratio of 1:2. To polymerize filaments, actin solution was incubated on ice for 30 min and then at room temperature for another 30 min. Unlabeled phalloidin (Thermo Fisher Science) in methanol was added to stabilize the actin filaments with a final concentration of 16 μM. After the addition of phalloidin, filaments were incubated on ice for another hour.
Microtubule Polymerization
Microtubules were polymerized from 5 mg/ml tubulin dimers (Cytoskeleton) in adding PEM-100 (100 mM PIPES, 1 mM EGTA, 1 mM MgSO4, pH 6.8). Labeled microtubules were polymerized by mixing Dylight-650 tubulin (Cytoskeleton) or Alexa-647 tubulin (PUR Solutions) at a 1:8 ratio tubulin with unlabeled tubulin. After mixing tubulin in PEM-100, dimers were centrifuged at 360,000 × g at 4°C for 10 min to pellet aggregated dimers. The supernatant was removed and used for polymerization. GTP was added to the solution at 1 mM. Tubulin was incubated at 37°C for 20 min. After polymerization, paclitaxel (Taxol) was added to a final concentration of 50 μM to stabilize microtubules. The Taxol binding was equilibrated by incubating at 37°C for another 20 min.
Myosin II Preparation
Whole skeletal muscle myosin (myosin II) was purified from chicken pectoralis muscle as previously described [54]. It was subsequently cut by chymotryptic digestion into heavy meromyosin (HMM) and further purified as described [54]. HMM was stored in −20°C in 50% glycerol and a low salt myosin buffer (25 mM imidazole, 300 mM KCl, 1 mM EGTA, 10 mM DTT, 4 mM MgCl2 at pH 7.4.) for up to 4 weeks when being used in gliding assays. Prior to use in filament gliding assays, the final purification steps for HMM were performed to remove any enzymatically dead myosin motors. Myosin stock is diluted in myosin buffer to final concentration of 180 μg/ml myosin, 100 μg /ml unlabeled F-actin, and 1 mM ATP. The myosin and actin were centrifuged for 20 min at 95,000 rpm and 4°C. Enzymatically dead myosins bind and do not release from actin filaments, and therefore pellet during centrifugation. Use of myosin remaining in the supernatant ensures the best activity of the motors and the removal of dead motors reduces additional drag on these active motors in these motility assays.
Kinesin-1 Preparation
Truncated kinesin-1, 560 amino acids in length, with a 6× His tag and GFP at the amino terminus (AddGene) was transfected into BL21 bacteria cells for protein expression and purification, as previously described [55, 56]. Kinesin was aliquoted and drop frozen in 30% sucrose in PEM-100 for use over 6–9 months. Prior to use in filament gliding assays, kinesin-1 was clarified by centrifugation at 360,000 × g for 10 min at 4°C.
Filament Gliding Assays
Filament gliding assays to accommodate both actin and microtubule gliding were modified from microtubule and actin gliding assays (Figure 1). Coverslips were coated with 0.1% nitrocellulose diluted in amyl acetate using a spin coater at 3,500 rpm for 30 s. Coverslips were used to create experimental chambers using double stick tape to create a flow path between a slide and the coverslip. Chambers were 10 μl in volume. Myosin (530 nM) and kinesin (58 nM) motors were mixed, added to the chamber, and incubated for 5 min to allow them to adhere to the surface. The surfaces were blocked by adding 0.5 mg/ml BSA in actin buffer (25 mM imidazole, 25 mM KCl, 1 mM EGTA, 10 mM DTT, 4 mM MgCl2 at pH 7.4). Cytoskeletal filaments were added to the chamber and allowed to adhere. Actin filaments were diluted in actin buffer with oxygen scavenging system (0.016 μM glucose oxidase, 0.12 mg/ml catalase) and microtubule filaments were diluted in PEM-100 and 20 μM Taxol with the same oxygen scavenging system. Finally, motility solution (50 mM KCl, 2.5 mM ATP, 10 mM DTT, 30 μM Taxol, 0.6% methylcellulose in actin buffer) is added to initiate the gliding activity.
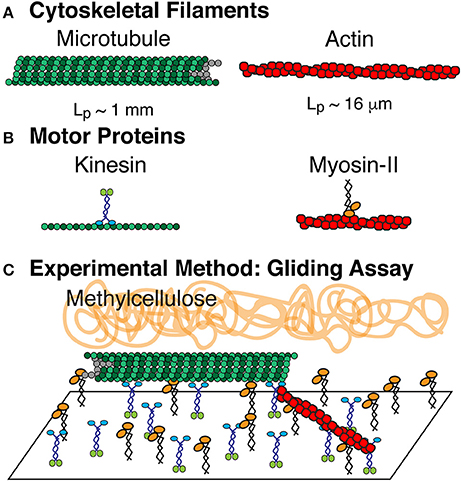
Figure 1. Composite driven active rod experiments. (A) The rods are composed of microtubule and actin filaments, which are polymerized from tubulin dimers and globular actin monomers, respectively. (B) Microtuules are driven by the ATP turn-over of kinesin-1 motor proteins. Actin filaments are driven by the ATP turn-over of myosin-II motor proteins. Both motors are truncated forms. Kinesin-1 is truncated at amino acid 560 and expressed in bacteria. Myosin-II is enzymatically cleaved to make heavy meromyosin (HMM) and purified from chick muscles. (C) Active rod experiments performed in a filament gliding assay. Kinesin-1 and myosin-II are both adhered to the cover glass. Microtubules and actin filaments are added to the chamber where they bind to the motors and are propelled via ATP. Methylcellulose is added to keep actin and microtubule filaments crowded to the surface.
In order to vary the density of the cytoskeletal filaments for each experiment, we adjusted the concentration of the filaments that were added to the chamber. The concentration was described by the concentration of the tubulin or G-actin subunits added. The density of the filaments was estimated from the concentration of subunits using the median length measurement (Figure 2) of each filament, assuming that all the filaments were this median contour length, Lc. The contour length was used to find the number of subunits per filament and the approximate surface area projection of each filament. For microtubules, the number of subunits per filaments was approximated by assuming that the microtubules had 13 protofilaments around and a dimer was 8 nm in length. For an actin filament, there were two protofilaments and each monomer was 5 nm in length. The molar concentration was converted to the number of filaments using the estimation of the number of subunits per filament. The contour length was also used to find the volume of an individual filament, and the volume was converted to the surface area of the filament by raising it to the 2/3rds power. These estimations were used to change the concentration of tubulin or G-actin subunits into the number of filaments in the chamber and the surface density of filaments in the chamber, as reported.
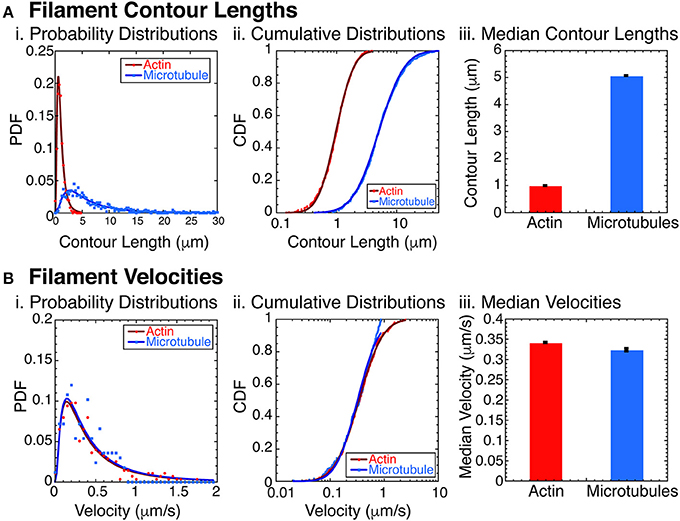
Figure 2. Filament characterization. (A) Filament contour lengths were measured for actin filaments and microtubule filaments. (i) Probability distribution functions (PDFs) of actin filaments (red circles, N = 1070) and microtubules (blue squares, N = 865) were binned with 0.25 μm sized bins and normalized. Data was fit to a lognormal function for actin (dark red line) and microtubules (dark blue line). See Supplemental Information for fit equation and Supplemental Table 1 for all fit parameters with uncertainty and goodness of fits. (ii) Cumulative distribution functions (CDFs) of the same data for actin filaments (red circles, N = 1070), and microtubules (blue squares, N = 865). CDFs were normalized and fit with the error function appropriate for lognormally distributed data for actin filaments (dark red line) and microtubules (dark blue line). See Supplemental Information for fit equation and Supplemental Table 2 for all fit parameters with uncertainty and goodness of fits. (iii) Using the fit parameters from the CDF data, we found the median contour lengths for both actin filaments (red bars) and microtubules (blue bars). Error bars represent the uncertainty of the fits parameter for the median. (B) Filament velocities were measured for actin and microtubule filaments separately. (i) PDFs of actin filament velocities (red circles, N = 276) and microtubules (blue squares, N = 167) were binned with 0.05 μm/s sized bins and normalized. Data was fit to a lognormal function for actin (dark red line) and microtubules (dark blue line). See Supplemental Information for fit equation and Supplemental Table 3 for all fit parameters with uncertainty and goodness of fits. (ii) Cumulative distribution functions (CDFs) of the same data for actin filaments (red circles, N = 276), and microtubules (blue squares, N = 167). CDFs were normalized and fit with the error function appropriate for lognormally distributed data for actin filaments (dark red line) and microtubules (dark blue line). See Supplemental Information for fit equation and Supplemental Table 4 for all fit parameters with uncertainty and goodness of fits. (iii) Using the fit parameters from the CDF data, we found the median filament velocities for both actin filaments (red bars) and microtubules (blue bars). Error bars represent the uncertainty of the fits parameter for the median.
Because actin and microtubules are filaments, and they are polymerized at high density, they have the ability to be entangled networks in the test tube. This filament entanglement was the largest source of variation in our experimental system because the local filament density could change when entangled. When pipetting the filaments to dilute them, the entangled filaments could result in pulling out more or fewer filaments than expected. Further, the final chamber wash, which included methylcellulose had to be pipetted gently to prevent disruption or breakage of the methylcellulose.
In order to mitigate these issues and increase the reproducibility of our experiments, we performed the following experimental steps for each experiment. First, microtubules were sheared 3 times using a pipette to purposely break up entangled networks and to create microtubules that were relatively short (Lc ~5 μm; Figure 2). Actin filaments were polymerized to be short (Lc ~1 μm; Figure 2), but they were still entangled at high concentration. In order to mix the labeled with unlabeled actin filaments, labeled filaments were added to the unlabeled filaments and were mixed by stirring with the pipette tip. The actin filaments were never pipetted excessively nor were they vortexed to mix, as this would cause shearing and reduction of the length of the filaments. All chambers were visually inspected to determine if the filament density was similar from chamber to chamber for the same experimental parameters. If a chamber did not appear to have a similar or expected density or either actin or microtubules, it was not used for analysis.
Another source of uncertainty of the experiments was the labile nature of the isolated kinesin-1 or myosin-II motors. These motors were fairly stable when stored, but would sometimes prematurely expire and no longer function. If either the microtubules or actin filaments did not bind to the surface or did not glide, the chamber was discarded, and a new preparation of kinesin-1 or myosin-II was purified. During this study, 7 different myosin-II preparations from chicken and three different kinesin-1 preparations from bacteria were prepared. The majority of the data reported was from a single preparation of both kinesin-1 and myosin-II.
As described above, the final purification step for myosin-II motors was performed each day prior to using the myosin-II motors to remove myosin-II motors that may have expired in storage. In this step, the myosin was bound to actin filaments and released using a high concentration of ATP. Despite all these procedures, we still had some enzymatically dead myosin-II motors bound to our surface in the experiment. In typical actin gliding assays, we would add in unlabeled actin filaments to block these dead motors in the chamber. In our work, such additional filaments would increase the concentration at the lowest densities of filaments, so we could not include them. Thus, we had some labeled filaments at the lowest actin concentration that would bind to dead myosin-II molecules and be immobile.
Microtubule-Kinesin Only Gliding Assay
To examine the effect of methylcellulose on microtubule gliding in the absence of actin and myosin, we performed microtubule-kinesin gliding assays without myosin. Flow chambers without nitrocellulose were made from a slide, cover glass, and double stick tape to create a 2–3 mm wide path. Both the slide and cover glass were cleaned with 70% ethanol. Kinesin-1 was added and incubated for 5 min to adhere to the glass. The chamber was washed and blocked with BSA using wash buffer (5.4 mg/ml BSA, 20 mM DTT, 60 μM of Taxol in PEM-100). Next, rhodamine microtubules (1:9 labeled dimers) were added to the chamber and incubated for 2 min. Finally, activation mix (78 mM DTT, 78 μM Taxol, 3.1 mM of ATP, 0.016 μM of glucose oxidase, 0.12 mg/ml of catalase, 1 mg/ml glucose in PEM-100) was added to start the assay. The activation mix above was supplemented with an ATP regenerating system [2 mM phosphocreatine and 70 mg/ml creatine phosphokinase (PCK)] to allow longer imaging up to 1 h. Microtubules were sheared with a 25 μl Hamilton syringe 3–5 times to make the microtubules shorter.
Imaging and Image Analysis
For all assays, gliding filaments were visualized using epi-fluorescence imaging on a Nikon Ti-E inverted microscope with either a 60× water immersion objective (NA = 1.38) or a 60× oil-immersion objective (NA = 1.49). Rhodamine actin (excitation: 530 nm, emission: 560 nm) and Dylight 650 (excitation: 650 nm, emission: 700 nm) or rhodamine microtubules (emission: 530 nm, excitation 560 nm) were imaged using sequential imaging for 2–60 min and recorded using Nikon Elements. Images were projected onto the detector of a Scientific-CMOS camera (Zyla, Andor), recorded, and saved as.nd2 files (compressionless tif files) with the metadata. Image data was imported into ImageJ/Fiji using the Bioformats Imager. The pixel size was 108 nm/pixel. The diffraction limit for the fluorescence image was approximately 300 nm, which corresponded to about 3 pixels. All experiments were performed at room temperature (23°C) in a temperature-controlled room with year-round heating and air conditioning.
Determination of the state of the filament gliding system were performed by creating standard deviation z-projections of the timeseries movie data using ImageJ/Fiji. The standard deviation images were inspected manually and classified initially in that manner. In order to reduce human bias, we also used two different ImageJ/FIJI plugins to characterize the global organization of the filaments. The programs were “Directionality” [57] or “OrientationJ” [58]. Both of these systems can use either a nearest neighbor approach or fast Fourier Transforms to detect the local gradient in the intensity of an image. The gradient of the intensity in a local vicinity corresponds to the local orientation. We found that both of these systems worked well for identifying the regions where filaments were aligned and the orientation of the aligned regions. Global alignment could be visually inspected using a color-coding. Histograms of the angles represented within the image were plotted (Supplemental Figure 1). When the image was globally isotropic, the angles were evenly distributed, with no or very little peak at the alignment angle. For aligned images, there was one dominant or characteristic angle in the histogram between −90 and 90 degrees, as would be expected for aligned filaments. Using this analysis, we could verify in a non-biased way, when the standard deviation images revealed alignment for most of the data (Supplemental Figure 1A).
We found that the ImageJ/FIJI plugins or programs had some difficulty with certain data sets. We show two difficult data sets in the supplement (Supplemental Figure 1B). The reasons for the uncertainty were sometimes due to the fact that there were very few filaments, such as in the most dilute regimes. Other times, the images had non-motile, background aggregates that showed up in fluorescence. Although these aggregates should be round, if the movie displayed thermal drift, the points would be analyzed as orientation in the data. We attempted to correct this using drift correction plugin (StackReg), but were not able to drift correct all the data sets. Finally, sometimes the data appeared isotropic to our eyes, but appeared to have some overall orientation. This may have been due to the fact that the goal of the program is to seek out and report orientation based on intensity gradients. Samples with low signal-to-noise, which some of our data had due to photobleaching, may have appeared to have some orientation. For completeness, we show examples of when the Directionality or OrientationJ analysis did not report the overall arrangement of the filaments as clearly (Supplemental Figure 1B).
In order to assess if bundles of microtubules or actin filaments were displaying nematic or polar alignment, we used kymographs (space-time plots). The location of the linear region of interest for the kymograph was determined using the standard deviation z-projections of the movies, which represented the tracks of filaments over time. The linear region of interest was moved to the movie and created using the MultiKymograph plugin in ImageJ/FIJI (http://imagej.net/Multi_Kymograph). The linear region of interest was expanded to three pixels, which is a diffraction-limited region for our microscope. Kymographs displayed the number of filaments and the direction of the filaments that moved along the same track within a diffraction-limited region over the entire movie.
Results
Filament and Gliding Characteristics
We have performed a series of active matter experiments of self-propelled rods using a composite of both actin and microtubule cytoskeletal filaments. The propulsion is created through motor proteins myosin-II (HMM) and kinesin-1 that propel actin and microtubules, respectively. The motor proteins are affixed to the surface through non-specific interactions as previously described [19]. We also use methylcellulose (0.3 and 0.6%, 88,000 MW) as a crowding agent, routinely used in actin gliding assays to help keep filaments on the surface [59, 60] (Figure 1).
The combination of actin and microtubules together is particularly interesting, because these filaments have significantly different bending stiffnesses. Specifically, actin has a persistence length of 16 μm [61], and microtubules have a persistence length of 1 mm [61–63]. To assure that the filaments would act as rigid rods, we created and measured the contour length of the actin filaments and microtubules filaments (Figure 2A). We found that the contour lengths have a log normal distribution, typical for polymerization reactions [64] (Figure 2Ai). The probability distribution function (PDF) data fit to a lognormal function well (see Supplemental Data and Supplemental Table 1 for fit equation, fit parameters with uncertainties, and goodness of fits). Replotting the data as a cumulative distributions function (CDF), we found that the logarithmic error function fit the data well (Figure 2Aii, see Supplemental Data and Supplemental Table 1 for fit equation, fit parameters with uncertainties, and goodness of fits). We find the median contour length for the actin filaments was 0.980 ± 0.001 μm and for microtubules was 5.05 ± 0.008 μm (Figure 2Aiii).
Another important parameter for the phase behavior of self-propelled rods is the velocity of the filaments. Using data taken at low densities of actin and/or microtubule filaments, we directly measured the self-propulsion velocity of the filaments. We find that the velocity distributions are almost identical when plotted as probability distribution histograms (Figure 2Bi). Using the Kolmogorov-Smirnov statistical test, we find that the probability that these two distributions are distinct is only 16% (p = 0.161), so we conclude that the distributions are identical to our ability to measure it. Median velocities, determined from error function fits to the cumulative distribution functions (Figure 2Bii) are very similar for actin (0.341 ± 0.001 μm/s) and microtubules (0.323 ± 0.004 μm/s) (Figure 2Biii).
Methylcellulose Enhances Microtubule–Microtubule Interactions
Given our past results and long-time experience with microtubule gliding [46–48], we were surprised to see that microtubules became well-ordered at high density when we performed experiments as described here (compare Supplemental movies 1 and 2). The buffers and protein constituents are different in the current assays compared to prior work, so we examined what might cause the difference. We discovered that the presence of methylcellulose in the experiment was capable of inducing microtubule-microtubule interactions that result in the formation of large-scale bundles (Figure 3B). Methylcellulose is a crowding agent used in both actin gliding and microtubule dynamic instability assays to force the filaments to stay close to the surface during the assay. We added it here in the attempt to create a composite assay between microtubule and actin gliding. Excitingly, it enhanced the microtubule interactions, such that they were able to form self-organized bundles during gliding. Further, these bundles appear to be polar—all moving in the same direction (see Supplemental Movie 2). Thus, not only is the methylcellulose allowing the microtubules to sterically interact with each other, the microtubules are likely engaged closely and without lubrication, as has been reported when using poly-ethylene glycol [65].
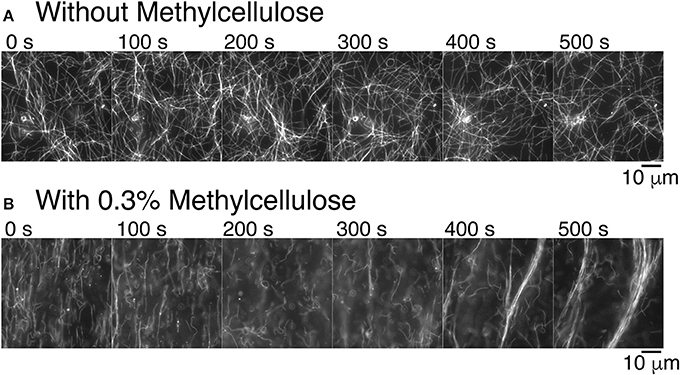
Figure 3. Methylcellulose increases microtubule interactions. (A) Time series of gliding microtubules in a chamber with kinesin-1 motors only without methylcellulose. Microtubules do not exhibit long-range interaction. Microtubules do create small loops. Time between frames is 100 s. (B) Time series of gliding microtubules in a chamber with kinesin motors and 0.3% methylcellulose, as used in our composite assays. Microtubules begin in a nematic phase, which is aligned and transition to a polar phase. Time between frames is 100 s. For all images, the scale bar is 10 μm.
Microtubules Exhibit Isotropic, Nematic, and Polar States
Using the composite experimental system including kinesin, myosin, and methylcellulose, we observed microtubules alone can alter their self-organization as a function of filament density. At low filament density, the organization of microtubules in the chamber is isotropic. We displayed the motion of individual filaments by overlaying images of microtubules as different colors to represent different times (Figure 4A, Supplemental Movie 3). The tracks were isotropically distributed, revealing the polar gliding trajectory of individual filaments (Figure 4Ai). Using these tracks, we created kymographs (space-time diagrams) of the moving filaments to reveal the direction and speed of each filament as it glided (Figure 4B). The intensity of the filament was displayed with distance along the track on the x-axis, and time along the track in the y-direction. The diagonal lines indicated motion of the filaments parallel to the track. For low densities, the kymographs showed one filament gliding in only one direction (Figure 4Bi).
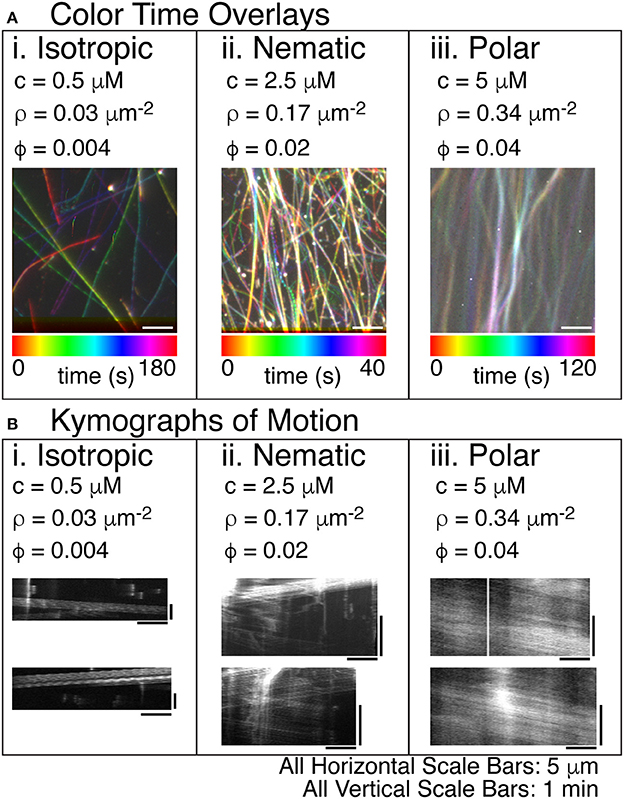
Figure 4. Steady states of microtubule organization as a function of increasing microtubule filament density. (A) Color time overlays where each frame of a timeseries is overlaid as a different color, as indicated by the color scale bar. (i) Lowest concentrations of microtubules display an isotropic phase with filaments pointing in all directions. The concentration (c) is 0.5 μM tubulin dimers. The filament density (ρ) is 0.03 filaments per μm2. The surface area fraction of filaments (ϕ) is 0.004. The color time scale for this image is from 0 to 180 s. (ii) The intermediate concentration of microtubules displays a nematic phase with filaments co-aligning locally and moving in antiparallel directions within the high density regions. The c is 2.5 μM tubulin dimers. The ρ is 0.17 filaments per μm2. The ϕ is 0.02. The color time scale for this image is from 0 to 40 s. (iii) The highest concentration of microtubules displays a polar phase with filaments co-aligning globally and moving in the same directions within the high density regions. The c is 5 μM tubulin dimers. The ρ is 0.34 filaments per μm2. The ϕ is 0.04. The color time scale for this image is from 0 to 120 s. (B) In order to determine the direction of the filaments within the high-density regions of the images, we created kymographs where the image along the linear region of interest is sequentially layered for each time step. The time dimension is portrayed on the y-axis. The space dimension along the filament is portrayed along the x-direction. (i) For the lowest density of filaments, visible tracks in the color time overlays were used to create kymographs. These tracks were deposited by single filaments, as evidenced by the single trail of intensity in the kymographs. (ii) For intermediate densities of filaments, the dense regions of the color-time overlay were used to create kymographs. The filaments moving in the high density regions were moving in both directions, as evidenced by the diagonal lines in both directions. (iii) For high density filaments, the high density regions of the color-time overlays were used to create the kymograph. All the filaments appear to move in the same direction implying that the high density region has polar-aligned filaments. All scale bars in the x-direction are 5 μm for all images. All scale bars in the y-direction were 1 min in time for all kymographs.
At intermediate filament densities, the tracks in the time color overlay image were mixed because many filaments were overlapping in a condensed, active stream of filaments (Figure 4Aii, Supplemental Movie 4). The condensed streams that appeared in the overlay image were used to create a kymograph to reveal the velocity and direction of filaments in the stream. In the kymograph, tracks moved in both directions (left and right). The width of the line used to create the kymograph was ~300 nm, which was approximately the diffraction limit of the microscope. The fact that multiple filaments with opposing directions were observed within the same diffraction-limited region of the stream implies that these filaments were organized into a nematic within the stream.
At higher concentrations, the time color overlay was also a mix of colors, appearing white in some regions, because they were present over almost the entire imaging time (Figure 4Aiii, Supplemental Movie 5). The condensed streams at higher concentration appeared a bit wider and better condensed than those at intermediate concentration. Creating a kymograph from these condensed stream regions, we observed that there are still multiple filaments within a diffraction-limited region. Unlike the intermediate filament density, we observed that all the filaments were proceeding in the same direction, creating a polar array of filaments (Figure 4Biii). Thus, in our system, the microtubules self-organize into nematic or polar streams as a function of the filament density.
Actin Filaments Exhibit Isotropic and Nematic States
Using the same time color overlays and kymographs, we examined the direction and velocity of actin filaments (Figure 5). As for microtubules, low actin filament densities resulted in individual trajectory traces that correspond to the motion of individual actin filaments (Figure 5Ai, Supplemental Movie 6). These trajectories had a low persistence length, similar to the persistence length of actin filaments. Prior work has demonstrated that the persistence length of gliding trajectories of actin and microtubules are equivalent to the persistence length of the filaments [66]. When we created kymographs from the trajectories, we found that some filaments moved slower and had frequent pauses (Figure 5Bi, top), likely due to inactive myosin-II in the chamber, as described in the methods. Other trajectories moved faster and did not pause (Figure 5Bi, bottom).
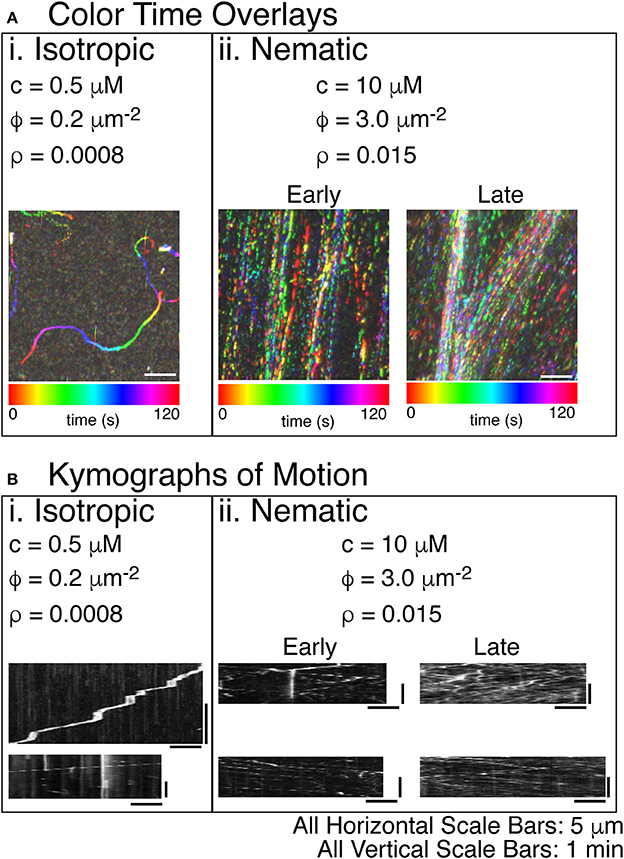
Figure 5. Steady states of actin filament organization as a function of increasing actin filament density. (A) Color time overlays where each frame of a time series is overlaid as a different color, as indicated by the color scale bar. (i) Lowest concentrations of actin filaments display an isotropic phase with filaments pointing in all directions. The concentration (c) is 0.5 μM actin monomers. The filament density (ρ) is 0.2 filaments per μm2. The surface area fraction of filaments (ϕ) is 0.0008. The color time scale for this image is from 0 to 120 s. (ii) The highest concentration of actin filaments displays a nematic phase with filaments co-aligning globally and moving in antiparallel directions throughout the space. The c is 10 μM tubulin dimers. The ρ is 3.0 filaments per μm2. The ϕ is 0.015. Filament alignment occurs rapidly, but the local density of the aligned filaments changes over time. Early images of these samples does not show density fluctuations—only global alignment. Later imaging of the same sample shows the accumulation of high density regions. The color time scale for these time series are from 0 to 120 s. (B) In order to determine the direction of the filaments within the high-density regions of the images, we created kymographs where the image along the linear region of interest is sequentially layered for each time step. The time dimension is portrayed on the y-axis. The space dimension along the filament is portrayed along the x-direction. (i) For the lowest density of filaments, visible tracks in the color time overlays were used to create kymographs. These tracks were deposited by single filaments, as evidenced by the single trail of intensity in the kymographs. Some filaments were observed to pause because of interactions with some dead myosins (top). When unlabeled actin filaments were also included, all filaments were observed to move without pausing (bottom). (ii) For high densities of filaments, the denser regions of the color-time overlay were used to create kymographs. For early time movies, a single diffraction-limited region used for the kymograph still displayed filaments moving in both directions, even though the density was not as high. For the late time movies, the regions of high density show motion in both directions and a significantly higher number of filaments passing parallel to the diffraction-limited region. All scale bars in the x-direction are 5 μm for all images. All scale bars in the y-direction were 1 min in time for all kymographs.
At higher actin filament densities, we again saw condensed streams using the time-color overlay. When the concentration of actin filaments was higher, the persistence of the trajectories increased significantly, and the direction of the filaments became aligned (Figure 5Aii, Supplemental Movie 7). Over time, the filaments in the chamber became more condensed, which could be seen in comparing color time overlays for an early movie with one from a later movie in the same chamber. The density of filaments increased within the streams, and streams coalesced and became more defined (Figure 5Aii, Supplemental movie 7: Early and Late).
Using kymographs, it was clear that the condensed streams contained filaments moving in both directions, implying that they were nematic in organization (Figure 5Bii). Both the early and late movies showed nematic ordering with filaments moving both directions within the same diffraction-limited region. The main difference was the density of filaments. Early movies had a fewer filaments within a diffraction-limited region, but late time kymographs showed more filaments, again implying that the filament density within the streams increased over time (Figure 5Bii, Early and Late).
Actin-Microtubule Composite Active Matter Velocity Distributions
We next combined the actin and microtubules together in the same assay to determine the interplay between the filaments. We performed a series of experiments with varying actin and microtubule concentrations and assessed the state of the system at late times (after allowing the system to evolve into steady-state). A particularly interesting observation was that the velocity of the actin filaments was faster at higher density (Figure 6). It was difficult to track the velocity of individual filaments at the highest densities within streams, but we were able to track some filaments, and used those for this analysis. We quantified velocities for actin at 10 μM without microtubules or at 10 μM with 5 μM microtubules. Interestingly, we found that actin filaments were propelled significantly faster at the highest actin densities when compared to actin filaments at low density, 0.5 μM without microtubules (Figures 2B, 6A). Using the KS test for significance, the probability that these velocity distributions were the same is less than 0.01% (p < 0.0001). This was true for both actin alone and in the presence of microtubules.
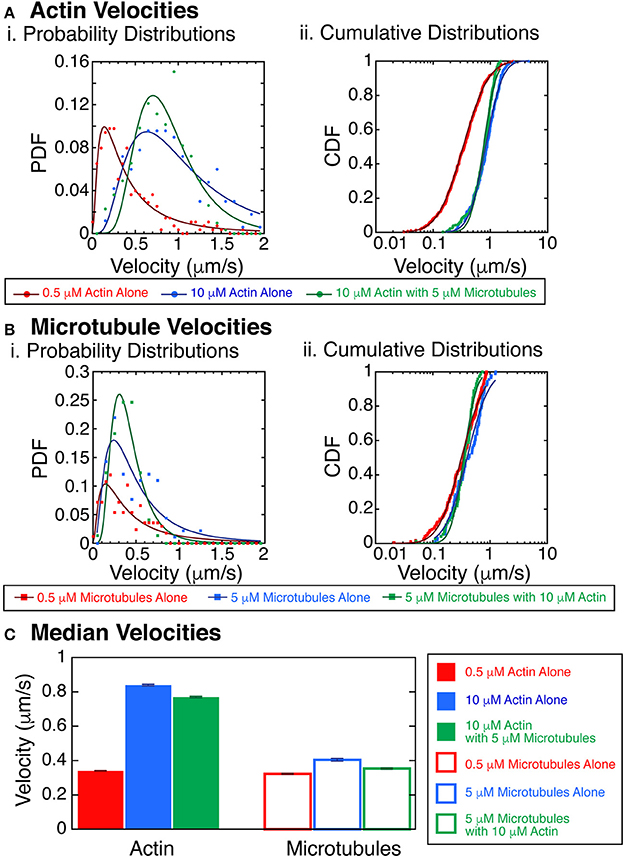
Figure 6. Velocity of actin filaments increases with polymer concentration. (A) Actin velocities with crowding. (i) Probability distribution functions of the velocity of trackable actin filaments gliding in the myosin and kinesin gliding assay at 0.5 μM without microtubules (red filled circles), 10 μM without microtubules (blue filled circles), or 10 μM with 5 μM microtubules (green filled circles). Fits to the data are lognormal fit equation (Equation 1, Supplemental) for 0.5 μM without microtubules (dark red line), 10 μM without microtubules (dark blue line), or 10 μM with 5 μM microtubules (dark green line). (ii) Cumulative probability distribution functions of the velocity of trackable actin filaments gliding in the myosin and kinesin gliding assay at 0.5 μM without microtubules (red filled circles), 10 μM without microtubules (blue filled circles), or 10 μM with 5 μM microtubules (green filled circles). Fits to the data are lognormal fit equation (Equation 2, Supplemental) for 0.5 μM without microtubules (dark red line), 10 μM without microtubules (dark blue line), or 10 μM with 5 μM microtubules (dark green line). (B) Microtubules velocities with crowding. (i) Probability distribution functions of the velocity of trackable microtubule filaments gliding in the myosin and kinesin gliding assay at 0.5 μM without actin (red filled squares), 5 μM without actin (blue filled squares), or 5 μM with 10 μM actin (green filled squares). Fits to the data are lognormal fit equation (Equation 1, Supplemental) for 0.5 μM without actin (dark red line), 5 μM without actin (dark blue line), or 5 μM with 10 μM actin (dark green line). (ii) Cumulative probability distribution functions of the velocity of trackable microtubule filaments gliding in the myosin and kinesin gliding assay at 0.5 μM without actin (red filled squares), 5 μM without actin (blue filled squares), or 5 μM with 10 μM actin (green filled squares). Fits to the data are lognormal fit equation (Equation 2, Supplemental) for 0.5 μM without actin (dark red line), 5 μM without actin (dark blue line), or 5 μM with 10 μM actin (dark green line). (C) Median velocities from the fits to the cumulative distribution functions for actin (filled bars) and microtubules (outlined bars). Actin data from 0.5 μM without microtubules (red filled bar), 10 μM without microtubules (blue filled bar), or 10 μM with 5 μM microtubules (green filled bar). Microtubule data from 0.5 μM without actin (red filled bar), 5 μM without actin (blue filled bar), or 5 μM with 10 μM actin (green filled bar). Error bars represent the uncertainty of the median velocity fit parameter from Equation 2 (Supplemental). See Supplemental Information for fit equation and Supplemental Tables 5–8 for all fit parameters with uncertainty and goodness of fits.
When we quantified the velocities of microtubules at 5 μM without actin or at 5 μM with 10 μM actin, we found minimal changes to the microtubule velocity (Figures 2B, 6B). Comparing 0.5 to 5 μM microtubules, both without actin, the probability that they were the same is 4% (KS test, p = 0.04). Comparing 0.5 μM without actin to 5 μM microtubules with 10 μM actin, the probability that they were the same is 3.5% (KS test, p = 0.035). Although these results could be significant, more data would need to be taken to increase the confidence in these differences. We median velocities for the actin and microtubules show that the velocity is strikingly increased for actin filaments compared to microtubules (Figure 6C). Such an increase in velocity should increase the probability of forming aligned states.
Actin-Microtubule Composite Active Matter Phase Diagram
Using the same parameters described above for actin or microtubules alone, we assessed if each system displayed isotropic, nematic, or polar order in either the microtubule or actin organizations. We created a phase diagram of the emergent behavior we observed (Figure 7A).
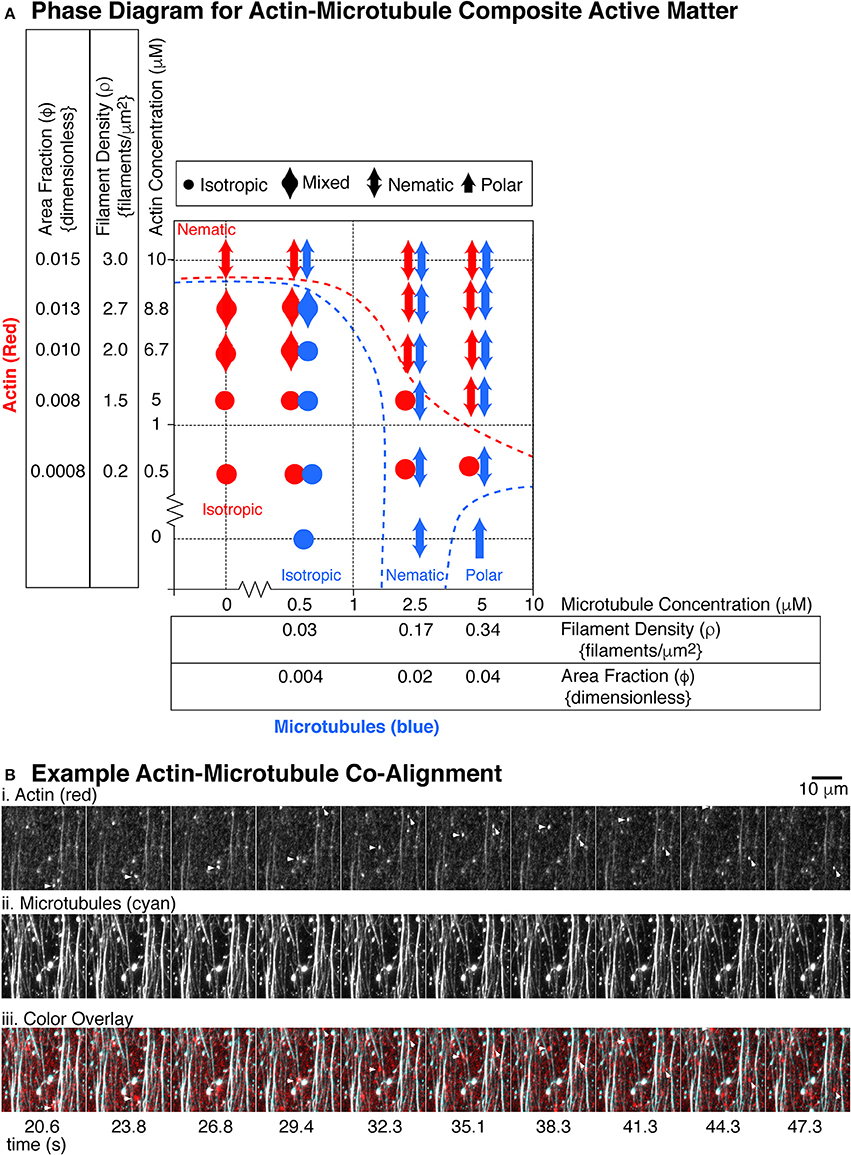
Figure 7. State diagram for actin and microtubule composite gliding assays. (A) The actin filaments (red markers) were used at five different concentrations: 0.5, 5, 6.7, 8.8, and 10 μM corresponding to the following filament densities (filaments per μm2): 0.2, 1.5, 2.0, 2.7, 3.0 and the following dimensionless area fractions: 0.0008, 0.008, 0.010, 0.013, 0.015. The microtubules (blue markers) where used at three different concentrations: 0.5, 2.5, and 5 μM corresponding to the following filament densities (filaments/μm2): 0.03, 0.17, 0.34 and the following dimensionless area fractions: 0.004, 0.02, 0.04. For each concentration pair observed, we used the definitions of isotropic, nematic, and polar described in Figures 4, 5 to describe the organization of actin filaments or microtubules. Isotropic organizations are denoted with a filled circle. Polar organizations are denoted with a single-headed arrow. Nematic organizations are denoted with a double headed arrow. Some organizational states were difficult to determine or showed different organizations in different chambers. These were mixed between isotropic and nematic and are denoted with a double headed wide arrow. For each location on the state diagram, 2–5 different chambers were made and 4–9 different 2–5 min movies were recorded over 1 h, as described. (B) Example alignment of actin and microtubules. (i) Images from a timeseries of actin gliding at 10 μM in the presence of (ii) 5 μM microtubules. (iii) Images are overlaid with actin in red and microtubules in cyan. Short actin filaments that glide along microtubule bundles are highlighted with an arrow head. Microtubule channel can be seen through the actin channel due to high signal and imperfect dichroic glass. Time between frames in seconds is given under the images, approximately 3 s apart. Scale bar is 10 μm.
In the low density regions on the phase diagram, both microtubules and actin were isotropic, which would be expected (Supplemental Movie 8). The density of each was too low to have interaction among the same filaments, and the total polymer mass was also very low. For the highest microtubule and actin filament densities, both filaments became co-aligned and nematic (Figure 7B, Supplemental Movies 9 and 10). At the highest density, we observed individual, fluorescently-labeled actin filaments, which were added at a ratio of one fluorescent filament to 360 unlabeled filaments. The labeled actin, serving as tracers, glided along paths of high microtubule density (Figure 7B). The microtubule bundles were visible within the actin channel due to imperfect dichroic glass and the high density resulting in high signal.
At low densities of actin, we found that the presence of the actin disrupted the microtubules' polar order. Examining the last column of the diagram, when no actin was present, the microtubules exhibited polar order. When even the lowest density of actin was introduced to the system, the microtubules were no longer polar, but rather nematic. This implied that the microtubule-microtubule interactions that cause polar ordering were disrupted when actin filaments were present, implying that the microtubules “sense” the presence of the actin filaments. This could mean that the microtubule-microtubule interactions that lead to polar order are sensitive to even minor disruption, yet the nematic alignment was more robust.
Both actin and microtubules can become entrained with the other filament's nematic order. For example, very high concentrations of actin (10 μM) were nematic. When combined with a low concentration (0.5 μM) of microtubules, the very few, sparse density of microtubules were observed to co-align with the actin filaments. They did not form dense streams of microtubules, but rather were recruited by the nematic streams of actin and co-aligned with them. Another example was when actin was at 5 μM, it was typically isotropic. Yet, at the highest microtubule density (5 μM), the actin became entrained in the microtubule nematic streams (Figure 7B).
Interestingly, the entrainment and co-alignment is not perfectly reciprocal—actin appeared to be less affected by microtubules. There were several examples where one type of filament was aligned, but the other stayed isotropic. For instance, at the lowest actin concentration (0.56 μM), the actin filaments never co-aligned with microtubules, despite excellent microtubule nematic ordering. We saw the same effect for actin at 5 μM with microtubules at 2.5 μM. Microtubules were aligned, but actin was isotropic.
Although the actin organization was less sensitive to the microtubule organization, there was some actin entrainment with microtubules. Examining the 5 μM actin concentration row, the actin alone preferred to be isotropic. Yet, at the highest microtubule density, the actin did co-align with the microtubules to participate in the nematic organization. These results implied that the filaments could sense each other to cause co-alignment, but only when they were at the highest concentrations.
Discussion
Here, we present a proof of principle for a composite active matter system composed of actin-microtubule filament gliding assay. We found that the presence of other motors on the surface that could not engage the filament of interest had no effect on the gliding ability of the filaments, making the system potentially useful for future studies (Figure 2). Further, we found a composite buffer condition that allows both actin and microtubules to glide simultaneously and at about the same velocity. Excitingly, we also found that methylcellulose has the ability to enable microtubules to interact to drive alignment into nematic and polar order (Figure 3). A recent publication previously showed that microtubules became nematic with higher methylcellulose but did not report polar order, as we observe here [67]. During the review of this manuscript, another publication reported that methylcellulose was able to induce large-scale chiral vortices, which would imply polar order of the filaments. These vortices were mostly observed around defects within the chamber, such as air bubbles [68]. These studies appear to be seeing a similar phenomenon as we present for microtubules, although they did not characterize their directionality. We found that the methylcellulose was not simply able to align filaments, but cause polar ordering, similar to that observed with actin in the absence of crowders previously [17]. The effect of methylcellulose on microtubule active matter offers an opportunity for control and tuneability not previously controllable for this system.
One of the results of our experiments is the identification of the concentration of polymer at which the system begins to exhibit orientationally ordered streams. We find that this transition occurs between concentrations of 0.5 and 2.5 μM for microtubules and 5 and 10 μM for actin. These concentrations correspond to filament densities of 0.03–0.17 filaments/μm2 for microtubules and 1.5–3 filaments/μm2 for actin. Using this transition density as a measure of the isotropic-nematic transition point, we find that it is indeed lower than the Onsager estimate for long thin rods of the corresponding lengths (ρC = 3π/2) [69] which would be 4.7 filaments/μm2 or 15.5 μM for actin and 0.18 filaments/μm2 or 2.7 μM for microtubules if we use the median length of the filaments to make the estimates. Our findings are consistent with theoretical results on self-propelled rod models [29] and simulations of filaments on motility assays [70], both of which predict an enhancement of nematic order and hence a lowering of the transition density due to the self-propulsion of the filaments. In order to make a quantitative comparison of experiments and the theory as presented in [29], future work needs to be performed at different filament lengths and different self-propulsion speeds.
Another interesting, yet unexplained result is that the actin filaments were observed to glide faster in the presence of higher densities (Figure 6). The effect, although present, is less pronounced and therefore reported with lower confidence for microtubules. It is not clear why the filaments would be able to glide faster at high densities. One possibility is the saturation of inactive myosins on the surface at high density. At low density, we often observed filaments moored at locations of inactive myosin. It is possible that at high density, all such locations were blocked, and the filaments could move faster. Another possibility is that the actin filaments were straighter and effectively stiffer when they are at higher density. Straight actin might enhance the ATP turn-over through increasing the rate of ADP release, increasing the efficiency of mechanochemical coupling in the actin-myosin system. Future studies could probe the mechanism of this phenomenon by reducing the motor number, but maintaining high density of actin filaments to see if velocity stays high when the filament trajectories are straighter.
Prior simulations use the motor density on the coverslip as a measure of the self-propulsion or activity in the system [70]. In our assays, we used 58 nM kinesin-1 and 530 nM myosin-II non-specifically adhered to the surface. We estimated the motor density in two ways. To find the maximal motor density, we assumed all the motors inserted in the chamber adhered to the available cover glass on the top and bottom. This estimate resulted in 1,600 kinesin/μm2 and 15,000 myosin/μm2. These estimates are still less than a saturating level of ~60,000 motors/μm2, assuming the motors each take up 16 nm2 on the glass surface. At the lower end, we assume that the concentration of motors in the chamber was constant, and estimated the surface density from the given volume density of motors. Using this second approximation scheme, we estimate the motor density to be 11 kinesin/μm2 and 47 myosin/μm2. These estimates are consistent with values reported in prior works [17, 46, 71]. At these motor densities, using the width of the filament as the motor capture radius, the simulations predict that the transition should occur at 5 × 10⁻⁵ microtubules/μm2 and 0.05 actin filaments/μm2 [70], which is much lower than the values we find in our experiments. There are many possible reasons why these predicted transition locations do not match our results, including our estimates of motors on the surface, estimates of the radius of capture for the filaments, and the length distributions of the filaments and their inherent semi-flexibility. Future experiments will aim to quantify the origins of these discrepancies.
A second main result of our experiments is a first look into the emergent phenomenology when self-propelled filaments of different lengths and stiffnesses interact with each other. Microtubules appear more susceptible to entrainment by actin in this system, but actin filaments are not as affected by microtubule polymer. There are a number of locations on the state diagram where the total polymer mass (microtubules and actin combined) should be more than enough to cause actin filament alignment, yet the actin does not align. For instance, actin alone shows nematic ordering when the area fraction is above 0.015. Yet, when the total polymer mass is above 0.015, such as when the microtubules are at 2.5 μM, the actin still does not align. Thus, the total polymer mass is not a good order parameter for actin ordering. On the other hand, the total polymer area fraction is a good order parameter for microtubule ordering into the nematic phase. In fact, whenever the total polymer mass is above 0.02, microtubules appear to be ordered in the system—whether that density to due to actin or microtubules. One plausible reason for the different behavior of actin and microtubules could be their different stiffness, which will significantly change their interparticle interactions. Future experiments will explore this hypothesis by changing the length of the filaments.
Understanding the physical mechanisms that lead to the phenomenology observed in the model composite active matter system requires an exploration of the interplay between self-propulsion speed, length and stiffness of a mixture of two species of self-propelled rods. While the parameter space of different speeds has been explored in the literature, and shown to produce unexpected segregation and density fluctuations, the influence of relative lengths of the active nematogen and their stiffness is as yet unexplored territory. Given the inherently non-equilibrium nature of the system, we have no a priori way of predicting the consequence of these properties on the emergent behavior. We expect that the development of this model experimental system can spur theoretical investigations into these questions in the context of composite active materials.
Given the importance of the microtubule and actin cytoskeletal networks in live cells, it is interesting to speculate on how the work presented here might inform on these complex processes. We found that the actin appeared to be less influenced by the microtubules. Although that could mean that the actin ignores the microtubule cytoskeleton in the cell. The experiments presented here only took advantage of steric interactions, likely enhanced by the crowding agents. Within the cell, there are likely a number of chemical interactions between these filaments. Indeed, a number of recent in vitro experiments have shown that microtubule or actin associated proteins can actually bind to the other cytoskeletal filament as well [51, 52]. These papers have demonstrated that actin and microtubule filaments can interact during polymerization at dilute concentrations [51, 52]. It would be an interesting further step to repeat these experiments in dense systems with many more filaments of each type to observe the large-scale co-polymerization and co-organization. We are currently working on future directions to add microtubule-actin interacting proteins into our gliding assays, described here.
In summary, we have described first experiments in a composite active matter system of self propelled filaments. The phase space available for exploration in this system includes particle properties (length of filaments, stiffness), activity (modifying motor concentrations), interactions (altered crowders, ionic strength buffers, and crosslinkers), and concentration of the different component particles. This system can serve as a test bed for theoretical ideas that have been proposed in the context of aligning self-propelled active fluids and serve to play the same role as Janus colloids have played for non-aligning self propelled particles.
Author Contributions
LF performed experiments with kinesin, myosin, actin, and/or microtubules, analyzed the data, and co-wrote and edited the manuscript. CF performed experiments on kinesin and microtubules in the presence of methylcellulose, analyzed data, and co-wrote and edited the manuscript. ED provided actin filaments, HMM-myosin-II, and invaluable advice and expertise working with actin and myosin gliding assays. JR devised experiments, analyzed data, co-wrote and edited the manuscript. AB analyzed data, co-wrote and edited the manuscript.
Funding
LF and CF were supported on NSF-INSPIRE Award NSF-MCB #1344203 to JR. Additionally, LF was partially supported on DoD ARO MURI 67455-CH-MUR to S. Thayumanuvan and NSF MRSEC DMR-1420382 to Seth Fraden, SuperSeed grant to JR. JR was partially supported on NSF-MCB #1344203 and DoD ARO MURI 67455-CH-MUR. ED was funded by American Heart Association Grant-In-Aid #14GRNT20450002. AB was supported on NSF MRSEC DMR-1420382 to Seth Fraden.
Conflict of Interest Statement
The authors declare that the research was conducted in the absence of any commercial or financial relationships that could be construed as a potential conflict of interest.
Acknowledgments
We would like to thank Andreas Bausch for helpful conversations on this project.
Supplementary Material
The Supplementary Material for this article can be found online at: https://www.frontiersin.org/articles/10.3389/fphy.2018.00075/full#supplementary-material
References
1. Tena-Solsona M, Rieß B, Grötsch RK, Löhrer FC, Wanzke C, Käsdorf B, et al. Non-equilibrium dissipative supramolecular materials with a tunable lifetime. Nat Commun. (2017) 8:15895. doi: 10.1038/ncomms15895
2. Arlt J, Martinez VA, Dawson A, Pilizota T, Poon WCK. Painting with light-powered bacteria. Nat Commun. (2018) 9:768. doi: 10.1038/s41467-018-03161-8
3. Battle C, Broedersz CP, Fakhri N, Geyer VF, Howard J, Schmidt CF, et al. Broken detailed balance at mesoscopic scales in active biological systems. Science (2016) 352:604–7. doi: 10.1126/science.aac8167
4. Mertz AF, Che Y, Banerjee S, Goldstein JM, Rosowski KA, Revilla SF, et al. Cadherin-based intercellular adhesions organize epithelial cell-matrix traction forces. Proc Natl Acad Sci. (2013) 110:842–7. doi: 10.1073/pnas.1217279110
5. Schwarz US, Safran SA. Physics of adherent cells. Rev Mod Phys. (2013) 85:1327–81. doi: 10.1103/RevModPhys.85.1327
6. Bi D, Lopez JH, Schwarz JM, Manning ML. A density-independent rigidity transition in biological tissues. Nat Phys. (2015) 11:1074–9. doi: 10.1038/nphys3471
7. Bi D, Yang X, Marchetti MC, Manning ML. Motility-driven glass and jamming transitions in biological tissues. Phys Rev X. (2016) 6:021011. doi: 10.1103/PhysRevX.6.021011
8. Longyear TJ, Turner MA, Davis JP, Lopez J, Biesiadecki B, Debold EP. Ca++-sensitizing mutations in troponin, P(i), and 2-deoxyATP alter the depressive effect of acidosis on regulated thin-filament velocity. J Appl Physiol (1985). (2014) 116:1165–74. doi: 10.1152/japplphysiol.01161.2013
9. Hagan MF, Baskaran A. Emergent self-organization in active materials. Curr Opin Cell Biol. (2016) 38:74–80. doi: 10.1016/j.ceb.2016.02.020
10. Marchetti MC, Joanny JF, Ramaswamy S, Liverpool TB, Prost J, Rao M, et al. Hydrodynamics of soft active matter. Rev Mod Phys. (2013) 85:1143–89. doi: 10.1103/RevModPhys.85.1143
11. Cisneros LH, Kessler JO, Ganguly S, Goldstein RE. Dynamics of swimming bacteria: transition to directional order at high concentration. Phys Rev E. (2011) 83:061907. doi: 10.1103/PhysRevE.83.061907
12. Zhang HP, Be'er A, Florin E-L, Swinney HL. Collective motion and density fluctuations in bacterial colonies. Proc Natl Acad Sci. (2010) 107:13626–30. doi: 10.1073/pnas.1001651107
13. Angelini TE, Hannezo E, Trepat X, Fredberg JJ, Weitz DA. Cell migration driven by cooperative substrate deformation patterns. Phys Rev Lett. (2010) 104:168104. doi: 10.1103/PhysRevLett.104.168104
14. Tambe DT, Corey Hardin C, Angelini TE, Rajendran K, Park CY, Serra-Picamal X, et al. Collective cell guidance by cooperative intercellular forces. Nat Mater. (2011) 10:469–75. doi: 10.1038/nmat3025
15. Buttinoni I, Bialké J, Kümmel F, Löwen H, Bechinger C, Speck T. Dynamical clustering and phase separation in suspensions of self-propelled colloidal particles. Phys Rev Lett. (2013) 110:238301. doi: 10.1103/PhysRevLett.110.238301
16. Paxton WF, Kistler KC, Olmeda CC, Sen A, St, Angelo SK, Cao Y, et al. Catalytic nanomotors: autonomous movement of striped nanorods. J Am Chem Soc. (2004) 126:13424–31. doi: 10.1021/ja047697z
17. Schaller V, Weber C, Semmrich C, Frey E, Bausch AR. Polar patterns of driven filaments. Nature (2010) 467:73–7. doi: 10.1038/nature09312
18. Sumino Y, Nagai KH, Shitaka Y, Tanaka D, Yoshikawa K, Chaté H, et al. Large-scale vortex lattice emerging from collectively moving microtubules. Nature (2012) 483:448–52. doi: 10.1038/nature10874
19. Yanagida T, Nakase M, Nishiyama K, Oosawa F. Direct observation of motion of single F-actin filaments in the presence of myosin. Nature (1984) 307:58–60. doi: 10.1038/307058a0
20. Cates ME, Tailleur J. Motility-induced phase separation. Ann Rev Condens Matter Phys. (2015) 6:219–44. doi: 10.1146/annurev-conmatphys-031214-014710
21. Marchetti MC, Fily Y, Henkes S, Patch A, Yllanes D. Minimal model of active colloids highlights the role of mechanical interactions in controlling the emergent behavior of active matter. Curr Opin Colloid Interface Sci. (2016) 21:34–43. doi: 10.1016/j.cocis.2016.01.003
22. Di Leonardo R, Angelani L, Dell'Arciprete D, Ruocco G, Iebba V, Schippa S, et al. Bacterial ratchet motors. Proc Natl Acad Sci. (2010) 107:9541–5. doi: 10.1073/pnas.0910426107
23. Fily Y, Baskaran A, Hagan MF. Dynamics of self-propelled particles under strong confinement. Soft Matter (2014) 10:5609–17. doi: 10.1039/C4SM00975D
24. Ginelli F, Peruani F, Bär M, Chaté H. Large-scale collective properties of self-propelled rods. Phys Rev Lett. (2010) 104:184502. doi: 10.1103/PhysRevLett.104.184502
25. Jia Z, Karpeev D, Aranson IS, Bates PW. Simulation studies of self-organization of microtubules and molecular motors. Phys Rev E. (2008) 77:051905. doi: 10.1103/PhysRevE.77.051905
26. Peruani F, Deutsch A, Bär M. Nonequilibrium clustering of self-propelled rods. Phys Rev E. (2006) 74:030904. doi: 10.1103/PhysRevE.74.030904
27. Swaminathan S, Karpeev D, Aranson IS. Bundle dynamics of interacting polar rods. Phys Rev E. (2008) 77:066206. doi: 10.1103/PhysRevE.77.066206
28. Yang Y, Marceau V, Gompper G. Swarm behavior of self-propelled rods and swimming flagella. Phys Rev E. (2010) 82:031904. doi: 10.1103/PhysRevE.82.031904
29. Baskaran A, Marchetti MC. Enhanced diffusion and ordering of self-propelled rods. Phys Rev Lett. (2008) 101:268101. doi: 10.1103/PhysRevLett.101.268101
30. Bertin E, Droz M, Grégoire G. Boltzmann and hydrodynamic description for self-propelled particles. Phys Rev E. (2006) 74:022101. doi: 10.1103/PhysRevE.74.022101
31. Bertin E, Droz M, Grégoire G. Hydrodynamic equations for self-propelled particles: microscopic derivation and stability analysis. J Phys A: Math Theor. (2009) 42:445001. doi: 10.1088/1751-8113/42/44/445001
32. Baskaran A, Marchetti MC. Self-regulation in self-propelled nematic fluids. Eur Phys J E. (2012) 35:95. doi: 10.1140/epje/i2012-12095-8
33. Peshkov A, Aranson IS, Bertin E, Chaté H, Ginelli F. Nonlinear field equations for aligning self-propelled rods. Phys Rev Lett. (2012) 109:268701. doi: 10.1103/PhysRevLett.109.268701
34. Putzig E, Redner GS, Baskaran A, Baskaran A. Instabilities, defects, and defect ordering in an overdamped active nematic. Soft Matter (2016) 12:3854–9. doi: 10.1039/C6SM00268D
35. Ramaswamy S, Simha RA, Toner J. Active nematics on a substrate: giant number fluctuations and long-time tails. Europhys Lett (EPL). (2003) 62:196–202. doi: 10.1209/epl/i2003-00346-7
36. Kudrolli A, Lumay G, Volfson D, Tsimring LS. Swarming and swirling in self-propelled polar granular rods. Phys Rev Lett. (2008) 100:058001. doi: 10.1103/PhysRevLett.100.058001
37. Narayan V, Ramaswamy S, Menon N. Long-lived giant number fluctuations in a swarming granular nematic. Science (2007) 317:105–8. doi: 10.1126/science.1140414
38. Wensink HH, Dunkel J, Heidenreich S, Drescher K, Goldstein RE, Lowen H, et al. Meso-scale turbulence in living fluids. Proc Natl Acad Sci. (2012) 109:14308–13. doi: 10.1073/pnas.1202032109
39. Großmann R, Peruani F, Bär M. Mesoscale pattern formation of self-propelled rods with velocity reversal. Phys Rev E. (2016) 94:050602. doi: 10.1103/PhysRevE.94.050602
40. Peruani F, Schimansky-Geier L, Bär M. Cluster dynamics and cluster size distributions in systems of self-propelled particles. Eur Phys J Spec Top. (2010) 191:173–85. doi: 10.1140/epjst/e2010-01349-1
41. Peruani F, Klauss T, Deutsch A, Voss-Boehme A. Traffic jams, gliders, and bands in the quest for collective motion of self-propelled particles. Phys Rev Lett. (2011) 106:128101. doi: 10.1103/PhysRevLett.106.128101
42. McCandlish SR, Baskaran A, Hagan MF. Spontaneous segregation of self-propelled particles with different motilities. Soft Matter (2012) 8:2527. doi: 10.1039/c2sm06960a
43. Yang X, Manning ML, Marchetti MC. Aggregation and segregation of confined active particles. Soft Matter (2014) 10:6477–84. doi: 10.1039/C4SM00927D
44. Köhler S, Bausch AR. Contraction mechanisms in composite active actin networks. PLoS ONE (2012) 7:e39869. doi: 10.1371/journal.pone.0039869
45. Soares e Silva M, Depken M, Stuhrmann B, Korsten M, MacKintosh FC, Koenderink GH. Active multistage coarsening of actin networks driven by myosin motors. Proc Natl Acad Sci. (2011) 108:9408–13. doi: 10.1073/pnas.1016616108
46. Liu L, Tüzel E, Ross JL. Loop formation of microtubules during gliding at high density. J Phys Condens Matter (2011) 23:374104. doi: 10.1088/0953-8984/23/37/374104
47. Pringle J, Muthukumar A, Tan A, Crankshaw L, Conway L, Ross JL. Microtubule organization by kinesin motors and microtubule crosslinking protein MAP65. J Phys Condens Matter (2013) 25:374103. doi: 10.1088/0953-8984/25/37/374103
48. Stanhope KT, Yadav V, Santangelo C, Ross J. Contractility in an extensile system. Soft Matter (2017) 13:4268–4277. doi: 10.1039/c7sm00449d
49. Butt T, Mufti T, Humayun A, Rosenthal PB, Khan S, Khan S, et al. Myosin motors drive long range alignment of actin filaments. J Biol Chem. (2010) 285:4964–74. doi: 10.1074/jbc.M109.044792
50. Ross JL, Ali MY, Warshaw DM. Cargo transport: molecular motors navigate a complex cytoskeleton. Curr Opin Cell Biol. (2008) 20:41–7. doi: 10.1016/j.ceb.2007.11.006
51. Henty-Ridilla JL, Rankova A, Eskin JA, Kenny K, Goode BL. Accelerated actin filament polymerization from microtubule plus ends. Science (2016) 352:1004–9. doi: 10.1126/science.aaf1709
52. López MP, Huber F, Grigoriev I, Steinmetz MO, Akhmanova A, Koenderink GH, et al. Actin–microtubule coordination at growing microtubule ends. Nat Commun. (2014) 5:1–4. doi: 10.1038/ncomms5778
54. Margossian SS, Lowey S. Preparation of myosin and its subfragments from rabbit skeletal muscle. Meth Enzymol. (1982) 85:55–71.
55. Conway L, Wood D, Tüzel E, Ross JL. Motor transport of self-assembled cargos in crowded environments. Proc Natl Acad Sci USA (2012) 109:20814–9. doi: 10.1073/pnas.1209304109
56. Pierce DW, Vale RD. Single-molecule fluorescence detection of green fluorescence protein and application to single-protein dynamics. Methods Cell Biol. (1998) 58:49–74.
57. Liu Z-Q. Scale space approach to directional analysis of images. Appl Opt. (1991) 30:1369. doi: 10.1364/AO.30.001369
58. Rezakhaniha R, Agianniotis A, Schrauwen JTC, Griffa A, Sage D, Bouten CVC, et al. Experimental investigation of collagen waviness and orientation in the arterial adventitia using confocal laser scanning microscopy. Biomech Model Mechanobiol. (2012) 11:461–73. doi: 10.1007/s10237-011-0325-z
59. Homsher E, Wang F, Sellers J. Factors affecting filament velocity in in vitro motility assays and their relation to unloaded shortening velocity in muscle fibers. Adv Exp Med Biol. (1993) 332:279–89; discussion 289–290.
60. Kron SJ, Toyoshima YY, Uyeda TQ, Spudich JA. Assays for actin sliding movement over myosin-coated surfaces. Meth Enzymol. (1991) 196:399–416.
61. Gittes F, Mickey B, Nettleton J, Howard J. Flexural rigidity of microtubules and actin filaments measured from thermal fluctuations in shape. J Cell Biol. (1993) 120:923–34.
62. Hawkins TL, Mirigian M, Li J, Yasar MS, Sackett DL, Sept D, et al. Perturbations in microtubule mechanics from tubulin preparation. Cell Mol Bioeng. (2012) 5:227–38. doi: 10.1007/s12195-012-0229-8
63. Hawkins TL, Sept D, Mogessie B, Straube A, Ross JL. Mechanical properties of doubly stabilized microtubule filaments. Biophys J. (2013) 104:1517–28. doi: 10.1016/j.bpj.2013.02.026
64. Jeune-Smith Y, Hess H. Engineering the length distribution of microtubules polymerized in vitro. Soft Matter (2010) 6:1778. doi: 10.1039/b919488f
65. Sanchez T, Welch D, Nicastro D, Dogic Z. Cilia-like beating of active microtubule bundles. Science (2011) 333:456–9. doi: 10.1126/science.1203963
66. van den Heuvel MGL, Bolhuis S, Dekker C. Persistence length measurements from stochastic single-microtubule trajectories. Nano Lett. (2007) 7:3138–44. doi: 10.1021/nl071696y
67. Saito A, Farhana TI, Kabir AMR, Inoue D, Konagaya A, Sada K, et al. Understanding the emergence of collective motion of microtubules driven by kinesins: role of concentration of microtubules and depletion force. RSC Adv. (2017) 7:13191–7. doi: 10.1039/C6RA27449H
68. Kim K, Yoshinaga N, Bhattacharyya S, Nakazawa H, Umetsu M, Teizer W. Large-scale chirality in an active layer of microtubules and kinesin motor proteins. Soft Matter (2018) 14:3221–31. doi: 10.1039/C7SM02298K
69. Onsager L. The effects of shape on the interaction of colloidal particles. Ann N Y Acad Sci. (1949) 51:627–59. doi: 10.1111/j.1749-6632.1949.tb27296.x
70. Kraikivski P, Lipowsky R, Kierfeld J. Enhanced ordering of interacting filaments by molecular motors. Phys Rev Lett. (2006) 96:258103. doi: 10.1103/PhysRevLett.96.258103
Keywords: active matter, non-equilibrium physics, phase transition, collective motion, myosin, kinesin
Citation: Farhadi L, Fermino Do Rosario C, Debold EP, Baskaran A and Ross JL (2018) Active Self-Organization of Actin-Microtubule Composite Self-Propelled Rods. Front. Phys. 6:75. doi: 10.3389/fphy.2018.00075
Received: 28 March 2018; Accepted: 29 June 2018;
Published: 30 July 2018.
Edited by:
Federico Giove, Centro Fermi-Museo Storico della Fisica e Centro Studi e Ricerche Enrico Fermi, ItalyReviewed by:
Giampiero Cai, University of Siena, ItalyYves Goldberg, INSERM U1216 Grenoble Institut des Neurosciences (GIN), France
Copyright © 2018 Farhadi, Fermino Do Rosario, Debold, Baskaran and Ross. This is an open-access article distributed under the terms of the Creative Commons Attribution License (CC BY). The use, distribution or reproduction in other forums is permitted, provided the original author(s) and the copyright owner(s) are credited and that the original publication in this journal is cited, in accordance with accepted academic practice. No use, distribution or reproduction is permitted which does not comply with these terms.
*Correspondence: Jennifer L. Ross, cm9zc2pAcGh5c2ljcy51bWFzcy5lZHU=