 Rajdeep Kaur Grewal
 Saptarshi Sinha
 Soumen Roy
- Department of Physics, Bose Institute, Kolkata, India
Strictly adaptive walks on uncorrelated and correlated fitness landscapes have been a subject of intense research. However, some experimental findings tend to advance the notion of non-adaptive evolution in terms of epistasis. To address such evolutionary paths, herein we introduce the concept of topologically inspired walks on connected and correlated landscapes with complex topologies. These walks are dictated solely by the topology of connections and are not explicitly dependent on the underlying fitness values. In the biologically significant regime of sparse randomness, we observe that such topologically inspired walks might carry a population to a local optimum even faster than strictly adaptive walks. This effect becomes more pronounced with increasing correlations in fitness. We observe interesting tradeoffs between topologically inspired walks governed by the minimum and maximum value of a set of given network metrics.
1. Introduction
The notion of fitness landscapes variously referred to as “adaptive topographies”, “adaptive landscapes”, and “surfaces of selective value”, have been extensively used to model the process of evolution [1–5]. Recently, there has been a surge of theoretical and experimental activity in this area [6–24] attesting to its immense importance.
Originally, fitness landscapes were conceived of as a genotype space represented on a hypercube [1]. Thus, each genotype is a sequence configuration with assigned fitness value and has the same number of neighbors. Fitness landscapes intend to relate either an individual's fitness with its genotype or the genetic state of the population with its allele frequency. Evolution on a fitness landscape is visualized as movement of the state of a population or an individual over the genotype space due to mutation, natural selection etc. [23]. Notably, fitness landscapes are also used for modeling evolution of a specific nucleotide sequence (DNA or RNA), gene sequence or protein [6, 8, 24–27]. In fitness landscapes with a single smooth peak, all mutations along any evolutionary path result in an increase in fitness. Strictly adaptive walks in the original hypercubic model is visualized as a movement from one genotype toward a neighboring genotype of higher fitness, differing merely by a single mutation [2, 3, 5]. The walk continues as long as a beneficial mutation is available [11].
However, experimentally observed fitness landscapes possess complexities which are not captured by simple models. They can be rather rugged, with a number of local peaks which are surrounded by valleys. Evolutionary walks on rugged fitness landscapes have been modeled as different types of adaptive walks [2, 3]. In random adaptive walks (RAW), a neighboring genotype with higher fitness is selected randomly. In gradient or greedy adaptive walks (GAW), the neighbor with the highest fitness value is selected. These walks are expected to take the population to a local optimum in the multi-peaked fitness landscape. Of prime interest is the mean walk length of evolutionary walks that will eventually lead to a local optimum in the fitness landscape [3, 4].
2. Various Paths Suggested by Experimental Evolution
Adaptive walks have proved as a great starting point to model evolution. However, apart from adaptive walks, experimental evidence suggests that non-adaptive evolutionary paths could also exist [28–31]. The central idea responsible for the emergence of ruggedness in fitness landscape is the idea of epistatic interactions where the expression of one gene is affected by another gene at a different locus [28]. These interactions are well known in evolution and have been thoroughly studied in experiments. An interesting case of such epistatic interactions is reciprocal sign epistasis where the occurrence of two deleterious mutations result in an increment of fitness [24].
Various experimental studies support such non-adaptive evolutionary paths. It was observed in E. coli [30] and S. typhimurium [31] that mutations responsible for streptomycin resistance cause a decrease in fitness where a compensatory second site mutation helps in increasing the overall fitness due to epistatic interaction. The same phenomenon of decrease in fitness in an evolutionary path is also observed in experiments on lac operon [29]. In in vivo experiments with TEM-1 β-lactamase, it was observed that the evolutionary path toward a resistant mutant of higher fitness went through lower fitness due to decrease of stability [9, 24].
All these studies indicate that a decrease of fitness in an evolutionary path is entirely possible, which however is not allowed by up-hill climbing walks. Our primary motive is to model an alternative evolutionary walk which can pass through not just fitness hills but also fitness valleys in a rugged fitness landscape as represented in Path “a” of Figure 1. Results from extensive numerical simulations show that our proposed walks indeed successfully capture this phenomenon and are non-adaptive in nature.
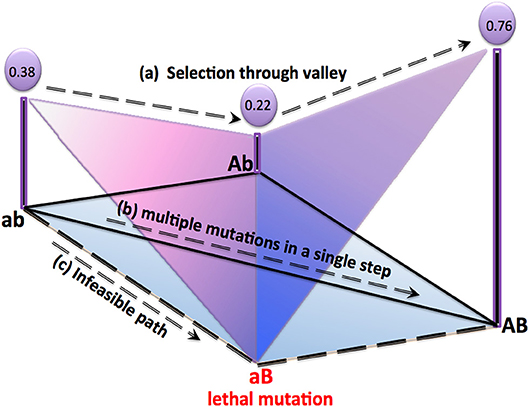
Figure 1. Experimentally observed yet lesser studied paths for a 2-string genotype are shown in above representation of a realistic fitness landscape. All possible mutations for a 2-string genotype can be represented as “ab, ”“AB, ”“Ab, ” and “aB.” Here “aB” is presumed as lethal. Fitness value of each genotype resulting from epistatic interaction is also mentioned. Apart from well-known adaptive walks, three other possible evolutionary paths are: (a) Non-adaptive path passing through a valley “ab” → “Ab” → “AB” as studied in Poelwijk et al. [8] and Wang et al. [9], (b) multiple mutations in a single step as studied in Refs. [24, 32], and, (c) infeasible path leading to the lethal mutation “aB” [33]. Topologically inspired walks on fitness landscapes with heterogeneous connectivities can successfully model (a), (b), and (c).
There also exist studies suggesting heterogeneous connectivity in a fitness landscape. Simultaneous multiple mutations are also observed in certain experiments [32] which suggest evolutionary walks similar to that represented by Path “b” of Figure 1. Such paths arise due to long range connections in the landscape with heterogeneous connectivity, unlike landscapes with hyper-cubic structure.
It is observed that many point mutations are responsible for the lethality of an individual [28, 33–36]. These lethal genotypes are not connected with other viable genotypes through an evolutionary path due to natural selection [4, 5, 37]. This results in isolated genotypes as represented in Path “c” of Figure 1, and also contributes to the heterogeneous connectivity in a fitness landscape.
It should be noted that fitness landscapes may not be uncorrelated as suggested by some studies on RNA [26, 27] and bacterial system [38]. Our motive is to incorporate above mentioned phenomena in our model for the construction of the fitness landscape and evolutionary walks.
To summarize—recent studies and experiments [6, 24, 27, 28, 30–33, 38] show that evolutionary trajectories in realistic and correlated fitness landscapes may pass through fitness valleys due to epistatic interactions or through long-range connections due to multiple mutations in a single step. Also, lethal mutations would lead to infeasible paths. . The aforementioned scenarios are depicted in Figure 1. Path “a,” which is a non-adaptive path, shows that uphill climbing might not always be favored due to complex epistatic interaction between genes. Path “b” shows that multiple mutations can be achieved even in a single step. Path “c” shows that lethal mutations would produce isolated genotypes.
3. Networks and Topologically Inspired Walks on Fitness Landscapes
A major aspect of network science is the intricate role of topology, as quantified by various metrics [39–41, 42], which plays a prime part in the characterization, design and functioning of such systems. However, while networks have been used in a variety of biological problems [43–48], they have seen only limited application [4, 5] in fitness landscapes and adaptive walks on them.
In this work, we propose a new class of walks, namely topologically inspired walks (TIW). TIW are directed by the topology of the randomly connected fitness landscape and are not explicitly dependent on the underlying fitness values. In consonance with experiments [9, 24, 30, 31, 49]—TIW traverse not only fitness peaks but also fitness valleys, unlike strictly adaptive walks like RAW and GAW. Further, in the biologically significant regime of sparse random graphs [50], TIW can carry a population to a local optimum faster than GAW or RAW. We also find that correlations [4, 5, 26, 27, 38] in fitness landscapes have a profound effect over such walks.
To model TIW on fitness landscapes, we studied well known network metrics based upon which TIW can be performed, namely, degree, closeness and betweenness. We explain below, how these measures capture various important topological aspects of nodes in the network.
Degree, k, of node, i, in a network, , which does not possess any self-loop, is the total number of connections it has to other nodes in a given network. Thus, its distribution is likely to offer ques into the connectivity pattern of the network.
Closeness, Ci, of node i, is the reciprocal of the average distance of i to every other node, j, in a network, , of N nodes. Thus,
where, dij is the shortest distance between nodes i and j. The shortest distance between two nodes in a network, i and j is the minimum number of edges which is required to be traversed in order to reach from node i to node j. As such, more than one shortest path may exist between two given nodes of a network. Closeness of a node signifies how easily a given node in a network is accessible from the other nodes in the network. In a star graph for example, a single edge is required to reach the central node. Whereas, any other node apart from the central node, will need at least two edges to reach from the rest of the nodes in the star graph. Obviously, nodes in graphs with predominantly chain like structures will typically possess the opposite behavior with regard to closeness.
Betweenness, Bk, of node, k, in is a measure of the number of shortest paths passing through k in . Thus,
where, σij is the number of shortest paths in between node, i, to node, j, and σij(k) the number of such paths between i and j, passing through k. Thus, betweenness centrality of a node quantifies its influence over the communication or information flow between all pairs of the nodes in a network.
In order to introduce heterogeneous connectivity in fitness landscapes as described in the above section, the topology of connections in the fitness landscape is modeled upon Erdös Rényi (ER) random graphs [4, 5]. It may be noted that a node refers to a mutation in the fitness landscape. Henceforth, we will use the terms node and mutation interchangeably. In ER graphs, every pair of nodes is randomly connected with probability, p, and the expected total number of connections therefore is pN(N−1)/2. Thus, the mean connectivity z of the resulting graph is z = p(N−1) ≃ pN, for large N. The degree distribution of an ER network is approximated by a Poisson distribution in the limit N → ∞ and is given by,
An Erdös Rényi network is generated with fixed number of nodes, N. Pairs of nodes are connected randomly with probability, p. For z>1, a single giant component is most likely to appear in the network. Here, we consider only those nodes that are present in the giant component.
We then ascribe a fitness value fi = 1+si to each node i in the giant component to define the fitness landscape. Here, si is the selective effect of the mutation i. Let us randomly choose a node, i, which can be referred to as the seed node. This seed node is then assigned a value, si, which is a random number drawn from an exponential distribution, , with mean 1/α. In the present context, the mean of this distribution represents the selection strength of beneficial mutations in the population. In accordance with earlier literature, we have set α = 20 [4, 51] under the presumption of high influx of beneficial mutations [51–54]. Now, to assign correlations in the fitness landscape, the selective effect of sj of the neighboring node is drawn from a distribution such that sj is conditional on si of the seed node. Thus, each {sj| j∈ neighborhood, of i} is drawn from a gaussian distribution having mean λsi and variance σ2(1−λ2), according to bivariate Gaussian distribution as shown in Equation (4).
Here, λ is a correlation parameter defined in [0, 1] where λ = 0 corresponds to uncorrelated fitness landscape. We now repeat the same exercise for all neighbors of every member of , which have not yet been assigned a fitness value. This process is conducted until all nodes in the network are assigned with a fitness value [4].
We consider TIW based on node degree, node betweenness, and node closeness [39–42] upon these networks. For a given metric, two types of walks were performed—min-directed TIW and max-directed TIW. A min-directed TIW starts from a randomly chosen non local optimum. The walk is then directed toward the neighboring node possessing minimum value of the network metric under consideration, among all neighbors. Similarly, a max-directed TIW starts from a randomly chosen non local optimum. The walk is then directed toward the neighboring node possessing the maximum value of the network metric under consideration, among all neighbors. The process is repeated until a local optimum is reached. To make the walks self-avoiding, if a neighbor possessing the minimum (or maximum) value of a given metric has already been traversed, the neighbor with the second lowest (or highest) value is selected to continue the walk. Thus, by definition, these walks are dictated by the topology of connections in the fitness landscape and are not dependent upon fitness. As TIW are not explicitly driven by genotype fitness, it might happen that TIW could fail to reach a local optima. This scenario occurs when all the neighboring nodes are already traversed but none leads to a local optimum, owing to the self avoiding nature of these walks. We will discuss this particular case in further detail in the next section.
In this work, mean walk length, Lmean, has been studied over networks with number of genotypes (nodes), N = 29, 210, 211, and, 215. The averages were obtained for network ensembles of size NE = 1000 for a given value of probability, p. A set of 1000 walks are performed on each network, resulting in a total of 106 walks for a given value of p, unless specified otherwise. For N = 215, NE = 500 resulting in total of 5 × 10⁵ walks for a given value of p. For every network, a set of correlated fitness values governed by Equation (4) is assigned.
4. Results and Discussions
Since TIW are not directed by fitness, questions arise as to whether TIW would be able to reach a local optimum at all. Remarkably however, we observe that some TIW can reach a local optimum faster than even strictly adaptive walks—especially in the biologically important regime of sparseness [50]. Figure 2 shows the mean walk length, Lmean, to reach a local optimum for different evolutionary walks, namely RAW, GAW and various TIW, with respect to probability, p in a network with N = 512, 1024, 2048 and 32768 genotypes. This effect gets more pronounced with increase in correlations of fitness value, λ. The basic nature of variation of Lmean with respect to p is similar for all values of genotypes, N, studied by us, thereby minimizing concerns about results arising as artifacts of finite size effects. The strong effect of fitness correlations over evolutionary walks on a randomly connected genotype space is well-known [4]. For completeness, degree distribution for different types of genotypes depending on their fitness profiles are shown in Figure 3 for λ = 0.9.
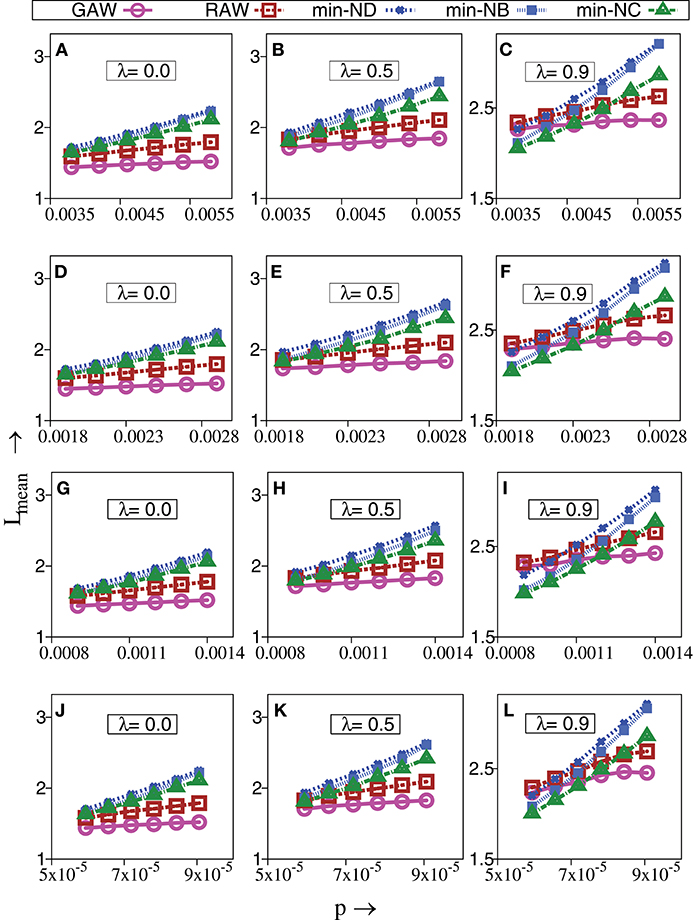
Figure 2. Change in mean walk length of strictly adaptive walks (RAW, GAW) and topologically inspired walks (TIW) governed by minimum value of degree (ND), betweenness (NB) and closeness (NC) of nodes vs. probability of connections, p. The topology of the genotype space is based upon Erdös Rényi graphs. The fitness values are drawn from a bivariate Gaussian distribution having correlation parameter, λ and σ2 = 0.001, α = 20. (A–I) Are for a set of networks, with 103 walks performed on each network of nodes N = 512, 1024, and 2048, respectively, resulting in a total of 106 walks at a given value of p. (J–L) are for a set of NE = 500 networks, with 103 walks performed on each network of N = 32768 nodes, resulting in a total of 5 × 10⁵ walks at a given value of p. Independent of N, TIW can perform better than strictly adaptive walks on sparser random graphs at higher λ. The standard error is smaller than the size of the data points.
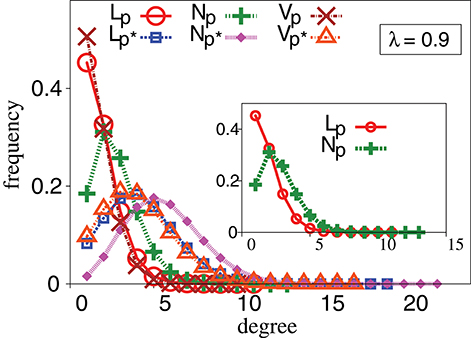
Figure 3. Degree distribution profiles for different types of genotypes in a landscape: local optimum, non local optimum and valleys for p = 0.0021 and p* = 0.0053. Observed results are for N = 1024, NE = 105. The topology of the genotype space is based upon Erdös Rényi graphs. The fitness values are drawn from a bivariate Gaussian distribution with correlation parameter, λ = 0.9. All other conditions are as in Figure 2F.
As aforementioned, TIW traverse paths where neighboring nodes need not have higher fitness, unlike strictly adaptive walks. Therefore, it would be interesting to determine the extent to which TIW would permit a decrease in fitness, while venturing from one genotype to another during evolution. Let 〈ns〉 denote the ensemble averaged fraction of steps in a walk, where there is a decrease in fitness. Obviously, ns = 0 for strictly adaptive walks. As Figure 4 shows, TIW differ significantly from strictly adaptive walks in this respect. Such action can be related to actual evolutionary processes where to reach a local peak of the fitness landscape, the population may choose a less fitter mutation for their eventual survival in the long run [30, 31]. Thus TIW, exhibit the characteristic of passing through genotypes with lower fitness, and can successfully model non-adaptive evolutionary experiments as discussed in the earlier section. As mentioned therein, in vitro evolutionary experiments with E. coli [30], S. typhimurium [31] and in vivo experiments with TEM-1 β-lactamase [9, 24] display this effect. These results on TIW are also in agreement with the evolutionary study on lac operon where evolutionary paths connecting 19 fitness peaks in the experimental fitness landscape, pass through valleys [29].
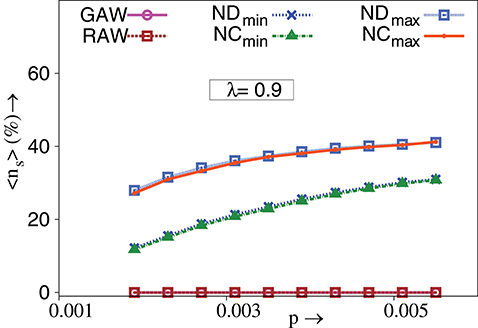
Figure 4. Percentage of ensemble averaged fraction of steps in a walk for which fitness decreases, 〈ns〉, vs. p. TIW are governed by minimum and maximum value of degree (ND) and closeness (NC) of nodes. λ = 0.9, N = 1024, NE = 1000. The standard error is smaller than the size of the data points. All other conditions are as in Figure 2F.
Notably, Figure 5A shows that the mean walk length of max-directed TIW is much larger than min-directed TIW. While strictly adaptive walks are guaranteed to reach a local optimum, TIW may not reach a local optimum but might remain at a non local optimum. The propensity to remain in a non local optimum indicates the inability of the genotype to evolve any further. Such situations could correspond to unavailability of fitter mutants or significant selection pressure cast upon the genetic state of a population due to change in environmental variables. Hence, such walks can be associated with routes toward extinction when a population fails to adapt [55–57]. Let denote the total number of walks on the rth network ensemble until a specified number of “successful” walks, , can be achieved. Obviously, here a “successful” walk refers to one where a local optimum is reached. Herein, we choose = 1000, ∀r. A number of walks, are “exhausted” toward achieving walks, because these walks do not end up at a local optimum. The ensemble averaged fraction of such exhausted walks is, 〈η〉 = 〈WE/WT〉. Obviously, η = 0 for strictly adaptive walks. Interestingly, Figure 5B shows that max-directed TIW are far more successful than min-directed TIW in reaching a local optimum.
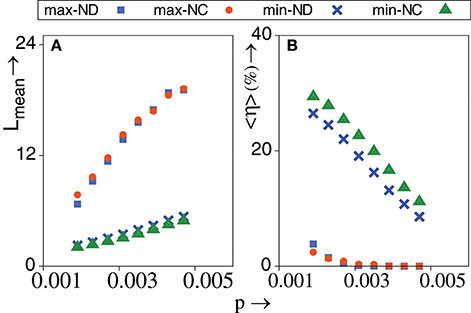
Figure 5. (A) Mean walk length of various topological walks vs. p. (B) Percentage of ensemble averaged fraction of exhausted walks that fail to reach a local optimum vs. p. TIW are governed by minimum and maximum value of degree (ND) and closeness (NC) of nodes. λ = 0.9, N = 1024, NE = 1000. The standard error is smaller than the size of the data points. All other conditions are as in Figure 2F.
We further compare the fraction of TIW which successfully reach the global optimum. Let, be the number of walks that reach the global optimum for the rth network ensemble. Then, the ensemble averaged fraction of such walks is, 〈χ〉 = 〈WG/WT〉, where WT is defined earlier in the text. We find that max-directed TIW outperform min-directed TIW as shown in Figure 6. However, we also note that RAW and GAW has a higher chance to reach the global optimum—which is not surprising. We wish to emphasize that there neither of max-TIW or min TIW is consistently better or preferred. Indeed, we encounter an interesting tradeoff when it comes to choosing the “better” TIW. On one hand, max-directed TIW possess a higher chance of reaching the global optimum and are more “successful” in reaching a local optimum. On the other hand, min-directed TIW have a far smaller mean walk length for reaching a local optimum.
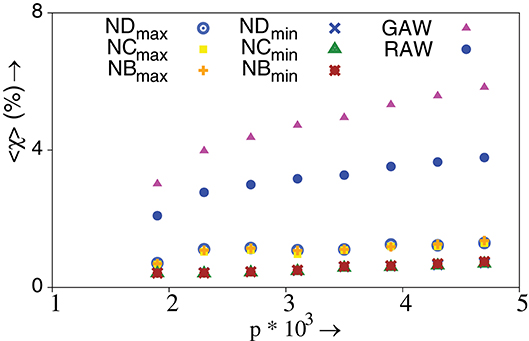
Figure 6. Percentage of ensemble averaged fraction of TIW and strictly adaptive walks that reach the global optimum, χ, vs. p. TIW can be governed by the minimum and maximum value of degree (ND), closeness (NC) and betweenness (NB) of nodes. λ = 0.9, N = 1024, and NE = 40000 with 105 walks performed on each network. The standard error is smaller than the size of the data points. All other conditions are as in Figure 2F.
Our results are in broad agreement with known evolutionary facts. In a fitness landscape, the degree of a genotype indicates the availability of viable mutations. A high degree genotype enjoys the luxury of a broad range of viable mutations. This seems to be associated with phenotypic diversity [58]. For example, the vast majority of lin mutations are viable while few are not [59]. On the other hand, a low degree genotype in a fitness landscape has access to a lesser number of viable mutations. It should be especially noted that availability of lesser options for viable mutations does not mean that such genes are unimportant in any way. In fact, the chances of viable mutations for essential genes are extremely low, as well known. Thus, evolution is likely to choose rather conserved paths having such low degree nodes [60]. However, at the same time, such paths may fail to reach a local optimum due to limitations in genetic variation. Evolution may also prefer genotypes with a higher degree, as in maximum-degree directed TIW, to increase the phenotypic possibilities in adverse conditions. Maximum-degree directed walks can therefore explore larger part of the landscape due to constant availability of a higher number of viable options. Thus they have a higher probability in reaching a local optimum as compared to minimum-degree directed walks, which is reflected in Figure 5B.
5. Conclusion
In summary, modeling evolutionary walks on randomly connected fitness landscapes by using topology rather than fitness sheds new insight into evolutionary patterns. We introduce the notion of topologically inspired walks. These walks are dictated by the topology of connections in the fitness landscape and are not dependent on fitness. TIW are not always hill climbing and can go through hills and valleys as seen in experiments [9, 24, 30, 31, 49, 61]. We have also considered isolated genotypes due to the presence of lethal mutants [4, 5, 37] in our model of correlated [26, 27] fitness landscapes. Interesting tradeoffs are observed between topological walks directed by the minimum and maximum value of any given network metric. The mean length of adaptive walks, Lmean does not exhibit a remarkable qualitative and indeed quantitative dependence upon the topology of the underlying fitness landscape [4]. Lmean is slightly smaller for networks with a scale-free degree distribution (SF) when compared to ER networks on correlated fitness landscapes [4]. This could be due to the reason that in SF networks—the shortest path length, l, between two randomly chosen nodes on a network of N nodes exhibits l∝loglogN [62, 63]. On the other hand, in ER networks l∝logN [64]. Nevertheless, it would be interesting to see how TIW perform on scale free networks or even on random networks with connection probabilities dependent on fitness. Also, it would be interesting to compare how TIW fare vis-a-vis fitness biased random walks or foraging random walks which have been studied well in literature [65–67].
Author Contributions
All authors contributed in the design of research and toward writing of the manuscript. The numerical simulations were conducted by RKG.
Conflict of Interest Statement
The authors declare that the research was conducted in the absence of any commercial or financial relationships that could be construed as a potential conflict of interest.
Acknowledgments
RKG and SS acknowledge financial support from the University Grants Commission of India.
References
1. Wright S. The roles of mutation, inbreeding, crossbreeding, and selection in evolution. In: Proceedings of the 6th International Congress on Genetics, Vol. 1 (1932). p. 356.
2. Kauffman S, Levin S. Towards a general theory of adaptive walks on rugged landscapes. J Theor Biol. (1987) 128:11–45. doi: 10.1016/S0022-5193(87)80029-2
3. Orr HA. A minimum on the mean number of steps taken in adaptive walks. J Theor Biol. (2003) 220:241–7. doi: 10.1006/jtbi.2003.3161
4. de Lima Filho JA, Moreira FGB, Campos PRA, De Oliveira VM. Adaptive walks on correlated fitness landscapes with heterogeneous connectivities. J Stat Mech Theory E (2012) 2:P02014.
5. Campos PR, Moreira FB. Adaptive walk on complex networks. Phys Rev E (2005) 71:061921. doi: 10.1103/PhysRevE.71.061921
6. Weinreich DM, Delaney NF, DePristo MA, Hartl DL. Darwinian evolution can follow only very few mutational paths to fitter proteins. Science (2006) 312:111–4. doi: 10.1126/science.1123539
7. Wilke CO, Campos PR, Fontanari JF. Genealogical process on a correlated fitness landscape. J Exp Zool. (2002) 294:274–84. doi: 10.1002/jez.10146
8. Poelwijk FJ, Kiviet DJ, Weinreich DM, Tans SJ. Empirical fitness landscapes reveal accessible evolutionary paths. Nature (2007) 445:383. doi: 10.1038/nature05451
9. Wang X, Minasov G, Shoichet BK. Evolution of an antibiotic resistance enzyme constrained by stability and activity trade-offs. J Mol Biol. (2002) 320:85–95. doi: 10.1016/S0022-2836(02)00400-X
10. DePristo MA, Weinreich DM, Hartl DL. Missense meanderings in sequence space: a biophysical view of protein evolution. Nat Rev Genet. (2005) 6:678. doi: 10.1038/nrg1672
11. Romero PA, Arnold FH. Exploring protein fitness landscapes by directed evolution. Nat Rev Mol Cell Biol. (2009) 10:866. doi: 10.1038/nrm2805
12. Hayashi Y, Aita T, Toyota H, Husimi Y, Urabe I, Yomo T. Experimental rugged fitness landscape in protein sequence space. PLoS ONE (2006) 1:e96. doi: 10.1371/journal.pone.0000096
13. Hietpas RT, Jensen JD, Bolon DN. Experimental illumination of a fitness landscape. Proc Natl Acad Sci USA (2011) 108:7896. doi: 10.1073/pnas.1016024108
14. Jimenez JI, Xulvi-Brunet R, Campbell GW, Turk-MacLeod R, Chen IA. Comprehensive experimental fitness landscape and evolutionary network for small RNA. Proc Natl Acad Sci USA (2013) 110:14984–9. doi: 10.1073/pnas.1307604110
15. O'maille PE, Malone A, Dellas N, Hess BA Jr, Smentek L, Sheehan I, et al. Quantitative exploration of the catalytic landscape separating divergent plant sesquiterpene synthases. Nat Chem Biol. (2008) 4:617. doi: 10.1038/nchembio.113
16. Tan L, Serene S, Chao HX, Gore J. Hidden randomness between fitness landscapes limits reverse evolution. Phys Rev Lett. (2011) 106:198102. doi: 10.1103/PhysRevLett.106.198102
17. Hall DW, Agan M, Pope SC. Fitness epistasis among 6 biosynthetic loci in the budding yeast Saccharomyces cerevisiae. J Hered. (2010) 101(Suppl. 1):S75–S84. doi: 10.1093/jhered/esq007
18. Brown KM, Costanzo MS, Xu W, Roy S, Lozovsky ER, Hartl DL. Compensatory mutations restore fitness during the evolution of dihydrofolate reductase. Mol Biol Evol. (2010) 27:2682–90. doi: 10.1093/molbev/msq160
19. Costanzo MS, Brown KM, Hartl DL. Fitness trade-offs in the evolution of dihydrofolate reductase and drug resistance in Plasmodium falciparum. PLoS ONE (2011) 6:e19636. doi: 10.1371/journal.pone.0019636
20. da Silva J, Coetzer M, Nedellec R, Pastore C, Mosier DE. Fitness epistasis and constraints on adaptation in a human immunodeficiency virus type 1 protein region. Genetics (2010) 185:293. doi: 10.1534/genetics.109.112458
21. De Visser JAGM, Hoekstra RF, van den Ende H. Test of interaction between genetic markers that affect fitness in Aspergillus niger. Evolution (1997) 51:1499–505. doi: 10.1111/j.1558-5646.1997.tb01473.x
22. Chou HH, Chiu HC, Delaney NF, Segré D, Marx CJ. Diminishing returns epistasis among beneficial mutations decelerates adaptation. Science (2011) 332:1190–2. doi: 10.1126/science.1203799
23. Gavrilets S. High-dimensional fitness landscapes and speciation. In: Pigliucci M, Müller GB, editors. Evolution: The Extended Synthesis. Cambridge, MA: MIT Press (2010). p. 45–79.
24. Salverda ML, Dellus E, Gorter FA, Debets AJ, Van Der Oost J, Hoekstra RF, et al. Initial mutations direct alternative pathways of protein evolution. PLoS Genet. (2011) 7:e1001321. doi: 10.1371/journal.pgen.1001321
25. Bershtein S, Segal M, Bekerman R, Tokuriki N, Tawfik DS. Robustness−epistasis link shapes the fitness landscape of a randomly drifting protein. Nature (2006) 444:929. doi: 10.1038/nature05385
26. Fontana W, Schnabl W, Schuster P. Physical aspects of evolutionary optimization and adaptation. Phy Rev A (1989) 40:3301. doi: 10.1103/PhysRevA.40.3301
27. Fontana W, Konings DA, Stadler PF, Schuster P. Statistics of RNA secondary structures. Biopolymers (1993) 33:1389–404. doi: 10.1002/bip.360330909
28. Sanjuán R, Moya A, Elena SF. The contribution of epistasis to the architecture of fitness in an RNA virus. Proc Natl Acad Sci USA (2004) 101:15376–9. doi: 10.1073/pnas.0404125101
29. Dawid A, Kiviet DJ, Kogenaru M, De Vos M, Tans SJ. Multiple peaks and reciprocal sign epistasis in an empirically determined genotype-phenotype landscape. Chaos (2010) 20:026105. doi: 10.1063/1.3453602
30. Schrag SJ, Perrot V, Levin BR. Adaptation to the fitness costs of antibiotic resistance in Escherichia coli. Proc R Soc Lond Biol. (1997) 264:1287–91. doi: 10.1098/rspb.1997.0178
31. Maisnier-Patin S, Berg OG, Liljas L, Andersson DI. Compensatory adaptation to the deleterious effect of antibiotic resistance in Salmonella typhimurium. J Mol Microbiol. (2002) 46:355–66. doi: 10.1046/j.1365-2958.2002.03173.x
32. Linnen CR, Poh YP, Peterson BK, Barrett RD, Larson JG, Jensen JD, Hoekstra HE. Adaptive evolution of multiple traits through multiple mutations at a single gene. Science (2013) 339:1312–6. doi: 10.1126/science.1233213
33. Kirakosyan Z, Saakian DB, Hu CK. Evolution models with lethal mutations on symmetric or random fitness landscapes. Phys Rev E (2010) 82:011904. doi: 10.1103/PhysRevE.82.011904
34. Sanjuán R, Moya A, Elena SF. The distribution of fitness effects caused by single-nucleotide substitutions in an RNA virus. Proc Natl Acad Sci USA (2004) 101:8396–401. doi: 10.1073/pnas.0400146101
35. Elena SF, Lenski RE. Test of synergistic interactions among deleterious mutations in bacteria. Nature (1997) 390:395. doi: 10.1038/37108
36. Lenski RE, Ofria C, Collier TC, Adami C. Genome complexity, robustness and genetic interactions in digital organisms. Nature (1999) 400:661. doi: 10.1038/23245
37. Kondrashov DA, Kondrashov FA. Topological features of rugged fitness landscapes in sequence space. Trends Genet. (2015) 31:24–33. doi: 10.1016/j.tig.2014.09.009
38. Lenski RE, Travisano M. Dynamics of adaptation and diversification: a 10,000-generation experiment with bacterial populations. Proc Natl Acad Sci USA (1994) 91:6808–14.
39. Roy S. Systems biology beyond degree, hubs and scale-free networks: the case for multiple metrics in complex networks. Syst Synth Biol. (2012) 6:31–4. doi: 10.1073/pnas.91.15.6808
40. Roy S, Filkov V. Strong associations between microbe phenotypes and their network architecture. Phys Rev E (2009) 80:040902. doi: 10.1103/PhysRevE.80.040902
41. Filkov V, Saul ZM, Roy S, D'Souza RM, Devanbu PT. Modeling and verifying a broad array of network properties. Europhys Lett. (2009) 86:28003. doi: 10.1209/0295-5075/86/28003
43. Grewal RK, Mitra D, Roy S. Mapping networks of light-dark transition in LOV photoreceptors. Bioinformatics (2015) 31:3608–16. doi: 10.1093/bioinformatics/btv429
44. Banerjee SJ, Sinha S, Roy S. Slow poisoning and destruction of networks: Edge proximity and its implications for biological and infrastructure networks. Phys Rev E (2015) 91:022807. doi: 10.1103/PhysRevE.91.022807
45. Banerjee SJ, Azharuddin M, Sen D, Savale S, Datta H, Dasgupta AK, Roy S. Using complex networks towards information retrieval and diagnostics in multidimensional imaging. Sci Rep. (2015) 5:17271. doi: 10.1038/srep17271
46. Grewal RK, Roy S. Modeling proteins as residue interaction networks. Protein Pept Lett. (2015) 22:923–33. doi: 10.2174/0929866522666150728115552
47. Samaddar S, Grewal RK, Sinha S, Ghosh S, Roy S, Das Gupta SK. Dynamics of Mycobacteriophage-Mycobacterial host interaction: evidence for secondary mechanisms for host lethality. Appl Environ Microbiol. (2016) 82:124–33. doi: 10.1128/AEM.02700-15
48. Sinha S, Grewal RK, Roy S. Modeling bacteria-phage interactions and implications for phage therapy. Adv Appl Microbiol. (2018) 103:103–41.doi: 10.1016/bs.aambs.2018.01.005
49. zur Wiesch PS, Engelstädter J, Bonhoeffer S. Compensation of fitness costs and reversibility of antibiotic resistance mutations. Antimicrob Agents Chemother. (2010) 54:2085–95. doi: 10.1128/AAC.01460-09
50. Leclerc RD. Survival of the sparsest: robust gene networks are parsimonious. Mol Syst Biol. (2008) 4:213. doi: 10.1038/msb.2008.52
51. Claudino ES, Campos PRA. Landscape structure and the speed of adaptation. Phys Lett A (2014) 378:2664–71. doi: 10.1016/j.physleta.2014.07.019
52. Fogle CA, Nagle JL, Desai MM. Clonal interference, multiple mutations and adaptation in large asexual populations. Genetics (2008) 180:2163–73. doi: 10.1534/genetics.108.090019
53. Rouzine IM, Wakeley J, Coffin JM. The solitary wave of asexual evolution. Proc Natl Acad Sci USA (2003) 100:587–92. doi: 10.1073/pnas.242719299
54. Good BH, Rouzine IM, Balick DJ, Hallatschek O, Desai MM. Distribution of fixed beneficial mutations and the rate of adaptation in asexual populations. Proc Natl Acad Sci USA (2012) 109:4950–5. doi: 10.1073/pnas.1119910109
55. Wylie CS, Shakhnovich EI. Mutation induced extinction in finite populations: lethal mutagenesis and lethal isolation. PLoS Comput. Biol. (2012) 8:e1002609. doi: 10.1371/journal.pcbi.1002609
56. Bradshaw AD. The Croonian Lecture, 1991. Genostasis and the limits to evolution. Philos Trans R Soc Lond B (1991) 333:289–305. doi: 10.1098/rstb.1991.0079
57. Bell G. Evolutionary rescue and the limits of adaptation. Philos Trans R Soc B. (2013) 368:20120080. doi: 10.1098/rstb.2012.0080
58. Muntoni F, Torelli S, Ferlini A. Dystrophin and mutations: one gene, several proteins, multiple phenotypes. Lancet Neurol. (2003) 2:731–40. doi: 10.1016/S1474-4422(03)00585-4
59. Riddle DL, Blumenthal T, Meyer BJ, Priess JR. Introduction In C. elegans II. 2nd ed. Cold Spring Harbor Laboratory Press (1997).
60. Jordan IK, Rogozin IB, Wolf YI, Koonin EV. Essential genes are more evolutionarily conserved than are nonessential genes in bacteria. Genome Res. (2002) 12:962–8. doi: 10.1101/gr.87702
61. Weinreich DM, Watson RA, Chao L. Perspective: sign epistasis and genetic costraint on evolutionary trajectories. Evolution (2005) 59:1165–74. doi: 10.1111/j.0014-3820.2005.tb01768.x
62. Cohen R, Havlin S, ben-Avraham D. Structural properties of scale free networks. In: Handjournal of Graphs and Networks, Chap. 4. Wiley-VCH (2002).
63. Cohen R, Havlin S. Scale-free networks are ultrasmall. Phys Rev Lett. (2003) 90:058701. doi: 10.1103/PhysRevLett.90.058701
64. Newman M. The structure and function of complex networks. SIAM Rev. (2003) 45 :167–256. doi: 10.1137/S003614450342480
66. Metzler R, Oshanin G, Redner S. (eds.). First-Passage Phenomena and Their Applications. (2014). doi: 10.1142/9104
Keywords: fitness landscapes, network science, random networks, non-adaptive evolution, epistasis
Citation: Grewal RK, Sinha S and Roy S (2018) Topologically Inspired Walks on Randomly Connected Landscapes With Correlated Fitness. Front. Phys. 6:138. doi: 10.3389/fphy.2018.00138
Received: 16 August 2018; Accepted: 21 November 2018;
Published: 04 December 2018.
Edited by:
José S. Andrade Jr., Universidade Federal do Ceará, BrazilReviewed by:
Haroldo Valentin Ribeiro, Universidade Estadual de Maringá, BrazilFrancesco Caravelli, Los Alamos National Laboratory (DOE), United States
Copyright © 2018 Grewal, Sinha and Roy. This is an open-access article distributed under the terms of the Creative Commons Attribution License (CC BY). The use, distribution or reproduction in other forums is permitted, provided the original author(s) and the copyright owner(s) are credited and that the original publication in this journal is cited, in accordance with accepted academic practice. No use, distribution or reproduction is permitted which does not comply with these terms.
*Correspondence: Soumen Roy, c291bWVuQGpjYm9zZS5hYy5pbg==