 Jeanne Linarès-Loyez1,2
 Joana S. Ferreira3,4Olivier Rossier3,4Brahim Lounis1,2Gregory Giannone3,4Laurent Groc3,4
 Laurent Cognet1,2*
 Pierre Bon1,2*
- 1Laboratoire Photonique Numérique et Nanosciences, UMR 5298, Université de Bordeaux, Talence, France
- 2Institut d'Optique & CNRS, LP2N UMR 5298, Talence, France
- 3Interdisciplinary Institute for Neurosciences, UMR 5297, Université de Bordeaux, Bordeaux, France
- 4CNRS, IINS UMR 5297, Bordeaux, France
Through the formation of fluorescent self-interference (SELFI), quantitative intensity and phase imaging enables the 3D localization of single fluorescent molecules inside a fixed tissue with an accuracy well-beyond the diffraction limit. Here we demonstrate that this concept can be extended to 3D super-resolution microscopy and 3D single particle tracking in various living samples ranging from adherent cells to organotypic brain slices, using diverse fluorescent emitters (fluorescent proteins, organic dyes or quantum dots). This basically covers the most popular single molecule imaging techniques used for live sample studies. We also show that SELFI can be used in combination with different illumination schemes including highly inclined illumination and total internal reflection.
Introduction
Single molecule super-localization has revolutionized the field of quantitative biology, providing both images and molecular specificity with resolutions well-beyond the diffraction limit [1–3]. This has unlocked the opportunity not only to obtain detailed images with nanometric resolution [4–6], but also to unveil nanoscale molecule dynamics. In particular, single particle tracking inside living samples give access to dynamic biophysical parameters such as molecular clustering, interactions, or local viscosity [7–11]. Because the living matter is organized in three dimensions, reliable biological conclusions will however be obtained only if super-localization of fluorescent emitters can be performed in 3D, within various living samples. In the past decade several techniques have been developed for achieving 3D super-localization in optically thin samples, typically an isolated plated cell [12–23]. To access thicker samples like 3D multicellular structures (organoids), we recently proposed a new 3D super-localization approach employing quantitative phase and intensity measurements. This technique, named SELFI, is based on fluorescent self-interferences [24] and can be considered as the transposition of lateral shearing interferometry [25, 26], a well-established technique for quantitative phase microscopy, to the field of 3D fluorescence microscopy. SELFI has the triple advantage over other 3D super-localization techniques [14, 15, 20, 22, 23, 27]: (i) minimal photon-loss, (ii) negligible point spread function (PSF) enlargement, and (iii) weak sensitivity to optical aberrations, including the ones introduced by the sample itself. Using SELFI, 3D-super-resolution imaging was achieved deep inside thick tissues [24]. However, it was only demonstrated within fixed organoids and combined with direct Stochastic Optical Reconstruction Microscopy (dSTORM) [24] using AlexaFluor 647 which possesses optimal blinking properties for this application [28]. Here, we demonstrate that SELFI can be used in combination with single quantum dots (Qdot) tracking or with the prevalent super-localization microscopy approaches developed to study live samples, using different fluorescent molecules. These include Photoactivated light microscopy (PALM) [1] and (universal) Point Accumulation for Imaging in Nanoscale Topography [(u)PAINT] [3, 29]. First, we present the combination of SELFI with uPAINT to reconstruct the 3D distribution of epidermal growth factor receptors (EGFr) in living cancer cells. Then we demonstrate that 3D SELFI-PALM allows the relative axial nano-positioning of important proteins of the integrin cell adhesion machinery to be retrieved. Finally, we show that 3D single Qdot tracking can be performed at video rate with SELFI, several tenths of micrometers deep in organotypic brain slices.
Materials and Methods
Microscope Setup
The imaging system is constructed around an inverted Nikon TiE (Nikon) microscope equipped with a Nikon objective 60 × NA = 1.45 (Nikon). For PALM experiments, 405 nm light filtered from a fiber C-HGFI light source (Intensilight, Nikon) is used for photo-conversion of mEOS3.2 fluorescent proteins (excitation filter 385/11, Semrock). For excitation of mEOS2, a 568 nm laser (250 mw, Sapphire, Coherent) is used with an appropriate filter set (dichroic FF580-FDi01, emission filter FF01-440/521/607/694/809-25, Semrock) in a total internal reflection scheme (~1.6 kW/cm2). For uPAINT experiments, a 638 nm laser (100 mw, Obis, Coherent) is used to excite Atto647N fluorophores with highly oblique illumination (~1 kW/cm2, dichroic FF655-Di01, emission filter FF01-698/70-25, Semrock). For Qdots tracking experiments, a 532 nm laser (5 W, Verdi, Coherent) is used to excite Qdots (QD655, Thermofisher Scientific) in epi-fluorescence (~1.5 kW/cm2, dichroic FF580-FDi01, Semrock, emission filter D655/40 m, Chroma). The SELFI module (described in more details in the results section) is used to record single fluorescent emitter images and includes a homemade diffraction grating based self-interferometer. The interference patterns are magnified 2× by an imaging relay (100 and 200 mm achromatic doublets in 4f configuration) then recorded with a camera (sCMOS, ORCA Flash4 V2+, Hamamatsu). Figure 1 shows a scheme of the setup and summarizes the different illumination possibilities. A homemade Labview program (National Instrument) is used to drive the acquisition setup, analyze the interferograms to retrieve the 3D position of each emitter, and render the reconstructed 3D super-resolved images.
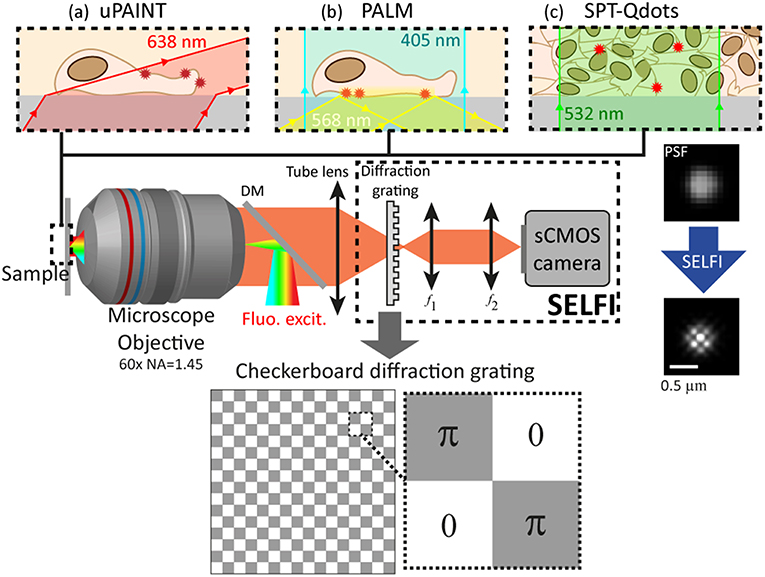
Figure 1. Super-resolution imaging setup based on self-interferences (SELFI) for 3D localization in living samples. Three different configurations are shown: (a) uPAINT with highly oblique illumination at 638 nm; (b) PALM with epi-photoconversion at ~405 nm and TIRF fluorescence excitation at 568 nm; (c) SPT of Qdots in tissues excited in epi-configuration at 532 nm. A scheme of the phase-only diffraction grating used in the SELFI setup is presented at the bottom. An interferometric PSF obtained with SELFI is also shown on the right. DM, dichroic mirror; f 1, 100 mm achromatic doublet; f 2, 200 mm achromatic doublet.
Biological Sample Preparation and Imaging
Paxilllin and Talin-C in Focal Adhesion (FA) by PALM
Mouse Embryonic Fibroblasts (MEFs) were cultured in DMEM (Gibco) with 10% FBS (Gibco), GlutaMAX supplement, 100 U.ml−1 penicillin-streptomycin, 1 mM sodium pyruvate, 15 mM HEPES. Transient transfections of plasmids were performed 1–3 days before experiments using the Nucleofactor™ transfection kit for MEF-1 and Nucleofactor™ IIb device (Amaxa™, Lonza). The cells were detached with 0.05% trypsin, 0.02% EDTA solution (Gibco). The trypsin was inactivated using soybean trypsin inhibitor (1 mg/ml in DMEM, Sigma), and the cells were washed and suspended in serum-free Ringer medium (150 mM NaCl, 5 mM KCl, 2 mM CaCl2, 2 mM MgCl2, 10 mM HEPES, pH = 7.4) supplemented with 11 mM glucose. Cells were then seeded on human fibronectin-coated surface (fibronectin: 10 μg/ml, Roche). PALM imaging was performed with 60 ms integration time (to ensure high single molecule localization precision) during 15 min.
EGFr Imaging on A431 Cells by uPAINT
A431 cells are grown in red-phenol-free Dulbecco's Modified Eagle Medium (DMEM) supplemented with 10% Fetal Bovine Serum (FBS), 1% L-Glutamin and 1% penicillin/streptomycin (Life Technologies) in a cell humidified culture incubator (37°C, CO2 5%). After 1–3 days, cells were plated at low confluency on coverslips coated with poly-L-lysin with 100-nm gold nanobead embedded inside (Sigma-Aldrich) for 3D microscope stabilization [30]. A second coating was then made with Fibronectin (Sigma-Aldrich) to optimize cell adhesion. Epidermal growth factor receptor (EGFr) membrane localizations on live cells were imaged by uPAINT. For this purpose, 10 μl of a solution of anti-EGFr (panitumumab) labeled with Atto647N (Atto-Tec) were added while simultaneously recording with the SELFI interferometer with an exposure time of 50 ms (to ensure high single molecule localization precision) during 5–10 min. The fluorescence is excited under highly oblique illumination. 3D stabilization of the microscope is performed at 40 Hz as previously described [30].
Rat Organotypic Cultures With Qdots
Organotypic slice cultures were prepared as previously described [31]. Hippocampal slices (350 μm) were obtained from postnatal day 5 to postnatal day 7 Sprague-Dawley rats using a McIlwain tissue chopper and were placed in a pre-heated (37°C) dissection medium containing (in mM): 175 sucrose, 25 D-glucose, 50 NaCl, 0.5 CaCl2, 2.5 KCl, 0.66 KH2PO4, 2 MgCl2, 0.28 MgSO4-7H2O, 0.85 Na2HPO4-12H2O, 2.7 NaHCO3, 0.4 HEPES, 2 × 10⁻⁵% phenol red, pH 7.3 (all products from Sigma-Aldrich). After 25 min of incubation, slices were transferred on white FHLC membranes (0.45 μm) set on Millicell Cell Culture Inserts (Millipore, 0.4 mm; Ø 30 mm), and cultured for up to 14 days on multiwell-plates at 35°C/5% CO2 in a culture medium composed of 50% Basal Medium Eagle, 25% Hank's balanced salt solution 1X (with MgCl2/with CaCl2), 25% heat-inactivated horse serum, 0.45% D-glucose, 1 mM L-glutamine (all products from Gibco). The medium was changed every 2–3 days. Organotypic were incubated with unfunctionalized QDs 1 h before experiment. Imaging was performed in temperature-controlled (35°C) chamber (Tokai Hit, Tokai) with 20 ms integration time (for best trade-off between molecule localization precision and diffusion movement recording) during 15 min between 10 and 40 μm deep in the living slice. 3D stabilization was performed [30] by locking on fixed structures in the tissue.
Results
Self-Interferences for 3D Localization of Single Fluorescent Emitters
To measure the 3D position of a single emitter with nanometric precision, we use a self-referenced interferometer placed in the detection path of the microscope. It is composed of (i) a custom-made phase-only diffraction grating consisting of a π-shift checkerboard pattern positioned a few microns before the microscope imaging plane, (ii) an imaging relay, and (iii) a camera [24] (see Figure 1). The interferometer allows the simultaneous measurement of the phase and intensity of a (fluorescent) beam with negligible photon loss. Briefly, the diffraction orders of the grating interfere after a small lateral shearing and the interference pattern of each single molecule image (i.e., each point spread function, PSF) is analyzed individually to extract the localization of the emitter with respect to the imaging plane of the microscope.
The interferogram formation Iz in the plane z can be approximated considering only the first order of diffraction along the directions x and y (>66% of the total diffracted energy).
with PSFz the intensity point spread function in the plane z, ai ≤ 1 the energy of the interferogram for each principal frequencies, with p the diffraction grating pitch, zd the distance between the grating and the sensor, and the wavefront local curvature in plane z. The light curvature will thus be encoded into interferogram frequency modulations. This curvature directly carries the distance between the light source (here a single fluorescent emitter) and the imaging plane where the interferometer registers the interference fringes. Analysis of the interferogram in the frequency domain thus allows quantitative measurement of the axial localization of the emitter with respect to the imaging plane of the microscope. On the other hand, its lateral localization can be retrieved by applying a low pass filter on Iz to remove the modulation component -keeping only the envelope PSFz- and then fitting to a Gaussian, as the PSF can be considered as free of aberration.
In a standard experiment, a camera raw image contains one or multiple PSFs sub-structured by interferences (see Figure 1). By operating in the single molecule regime where each elemental PSF can be isolated from the others, one can independently retrieve the 3D localization of each molecule.
uPAINT Imaging for EGFr Studies on Cancer Cell Line (A431)
EGF receptors (EGFRs) belong to the ErbB family of receptor tyrosine kinases. They are activated at the cell-surface following binding with epidermal growth factors (EGFs) to their extracellular domain, inducing signaling pathways that are important e.g., in different carcinoma types. Indeed, upon EGF binding, EGFR dimerization, and tyrosine autophosphorylation occur, which activates intracellular signaling cascades that can lead to phenotypic changes such as increased proliferation and migration. EGFR distributions, activation and signaling pathways have been extensively studied using fluorescent microscopy at both ensemble [32, 33], single-molecule levels [34–36], and also using super-resolution imaging [7]. These studies revealed for instance the transient distribution of EGFR dimers at the cellular membrane immediately after EGF binding and before their endocytosis. Interestingly, using uPAINT microscopy, we were also able to image on live cells the super-resolved localization of panitumumab, a human monoclonal antibody highly specific to EGFRs and widely used in cancer treatments. This antibody impedes EGF binding and the subsequent signaling cascades. Intrinsically, uPAINT is particularly well-suited to study ligand/antibody binding localizations at high resolution on a live cell. Indeed, uPAINT relies on stochastically imaging in real-time ligand binding with target receptors at the single molecule level using highly oblique illumination [37]. We thus chose to demonstrate the possibility to combine SELFI with live-cell uPAINT microscopy to generate 3D super-resolved images of panitumumab. For this, we applied fluorescent panitumumab on A431 cells, an epidermoid carcinoma cell line which abnormally overexpresses EGFR. We coupled panitumumab to Atto-647N, a red fluorescent dye with excellent photophysical properties well-established in single molecule research. In practice, immediately after the beginning of recording and while cells were illuminated with a 638 nm laser beam, fluorescent panitumumab was introduced at low concentration (0.4 nM) in the imaging solution. A series of fluorescence images are recorded with SELFI with an integration time of 50 ms. The super-resolved image presented in Figure 2a displays the 3D localizations of the EGFR population targeted by panitumumab at the membrane of live cells. For comparison, a diffraction limited image was generated in Figure 2b by pooling diffraction limited detections of fluorescent panitumumab. In the super-resolved image, the gain in lateral resolution is clearly visible, while SELFI reveals the axial localization of panitumumab linked to EGFR with super-resolved precision (~30–50 nm localization precision, average of 500 detected photons /localization). Interestingly, local inhomogeneities in axial localizations can be seen and be related to local cell membrane topography. For instance, local elevation of EGFR altitude spanning only 400 nm in height can be observed due to small ruffling of the membrane at the edge of the cell (Figure 2b white arrow) while in the remaining of the lamellipodia the molecules span <150 nm axially. This observation indicates that panitumumab is able to efficiently target EGFR in different areas of the cell, including in highly mobile and dynamic membrane compartments.
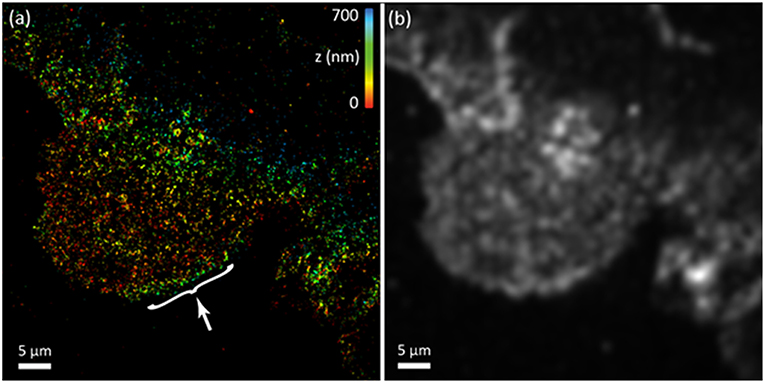
Figure 2. uPAINT-based super-resolution imaging of EGF receptors in living A431 adherent cells. (a) Single molecule based 3D super-resolved reconstructed image. The nano-topography of the cell is clearly visible. The white arrow indicates membrane ruffling linked to an increase in height at the edge of the cell. (b) Computer generated epi-fluorescence image (diffraction limited).
SELFI-PALM Focusing in the Adhesion Focal Points
Cells adhere and generate forces on the extracellular matrix through integrin-dependent adhesion sites, in particular mature Focal adhesion (FAs). While quite stable at the macroscale, those macromolecular assemblies are highly dynamic and well-organized at the molecular level [11, 38]. Importantly, 4π interferometric PALM (iPALM) performed on fixed cells demonstrated that FAs are composed of multiple functional nano-layers located at different distances from the plasma membrane and recruiting specific components: a membrane-proximal integrin signaling layer, a force transduction layer and an upper actin regulatory layer [38]. Here, we wanted to determine whether SELFI is also able to quantify the height of different proteins constituting FAs with a much more convenient one-objective imaging scheme and importantly, within live cells. We chose a TIRF-PALM configuration in order to image two proteins of FAs located, respectively in the integrin and actin layers: Paxillin and Talin carboxy-terminal (Talin-C) fused with mEos2. Figure 3 presents the results obtained by SELFI-PALM imaging: Figures 3a,c display, respectively 3D super-resolved images of Paxillin-mEoS2 and Talin-C while Figures 3b,d both correspond to diffraction limited images of GFP-paxillin as a FA reporter. One can see that while the lateral distributions of proteins span over few microns in adhesion sites, their respective axial distributions are very narrow (±25 nm). Interestingly, since SELFI axial localizations are measured relative to the microscope imaging plane, it was essential to retrieve an absolute axial reference (set as z = 0 at the microscope coverslip) to compare the respective height distributions of Talin-C and Paxillin. For this purpose, we use fluorescent molecules adsorbed on the coverslip and detected outside of the cells. By subtracting the coverslip position to the raw protein localizations we could generate the absolute values of the localizations with respect to the coverslip position. Note that for durable determination of coverslip position, fluorescent particles can be embedded within the coating layer (fibronectin). This analysis clearly shows that in live cells, Paxillin, and Talin-C are almost exclusively detected in FAs with Paxillin being closer to the surface than Talin-C. Indeed, by analyzing 15,000 localizations in FAs for both Talin-C and Paxillin, we unambiguously obtained distinct localization heights separated by 23 ± 0.3 nm (SEM): zPaxillin = 18 ± 22 nm (STD) and zTalin = 41 ± 25 nm (STD). Taking into account the experimental uncertainties, the measured distance within this layered structuration measured on live cells is consistent with the literature obtained on fixed cells [ and [38]]. The absolute positions are however offset by ~25 nm compared to the literature, which suggests that adsorbed molecules used for z = 0 determination might not provide the exact position of the coverslip surface. Nevertheless, this analysis provides a proof-of-principle that SELFI-PALM can deliver 3D super-resolved images of mEOS distributions with state-of-the-art resolution, but with much simpler instrumentation and within live cells.
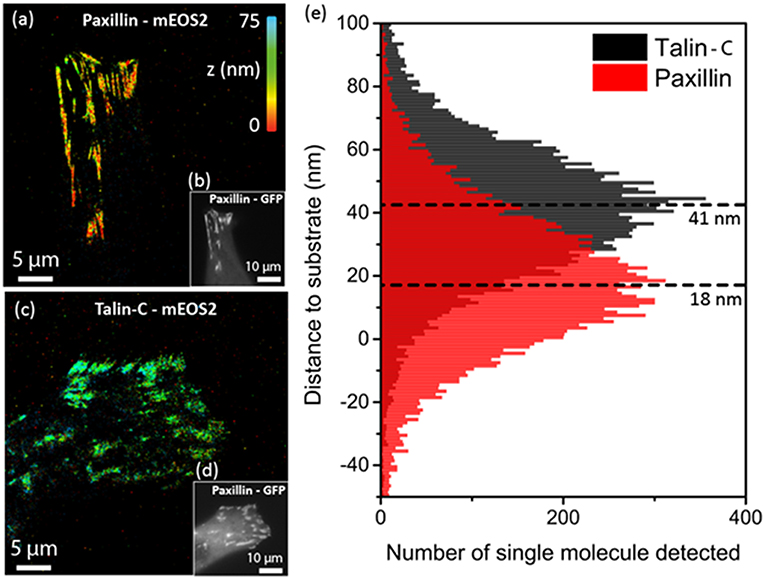
Figure 3. PALM-based super-resolution imaging of Paxillin and Talin-C in live mouse embryonic fibroblasts. (a) Super-resolved image of Paxillin fused to mEOS2. (b) Epi-fluorescence image of GFP-Paxillin showing the adhesion focal points. (c) Same as (a) for Talin-C fused to mEOS2 on C-terminal part of the protein. (d) Same as (b). (e) Histograms of the axial localizations of Talin-C and Paxillin within the adhesion focal points showing an axial separation of ~23 nm.
Single Particle Tracking in Living Tissue
Being able to study the dynamics of proteins in living samples is key to understand the complex molecular processes implicated in biological systems. In this quest, single particle tracking (SPT) has been largely performed on dissociated cells plated on coverslips [7, 37, 39–41], while SPT in intact living tissues is only emerging [10, 42, 43]. Having access to the 3D dynamics of proteins deep inside living tissues would however ensure more realistic conclusions since the 3D structure of native biological samples provides specific environments. In this context, 3D-SPT currently requires the use of highly transparent and weakly optically aberrant samples or strategies with complex fluorescence excitation/detection schemes as compared to standard wide-field imaging (including multiphoton excitation or selective plane illumination) [44]. It remains thus challenging to achieve 3D single particle tracking deep in living tissues using a conventional wide-field fluorescence microscope. To this aim, we applied SELFI to track single Qdots in 3D deep in a live tissue. As a demonstration, we measured the 3D movement of Qdots diffusing in the extracellular space of living organotypic brain slices. Indeed, it has been shown that the diffusion properties of Qdots, dextrans, or other nanoparticles introduced in the brain extracellular space are related to its nanoscale architecture [8, 9]. The analysis of their trajectories should thus allow critical biophysical information about this important brain compartment [45] such as tortuosity, viscosity and dynamics of endogenous extracellular molecules to be retrieved. Figure 4 displays typical results obtained at depths of 10 μm (Figures 4a–d) and 25 μm (Figures 4e–h) inside the brain slice. Because Qdots are surface passivated without targeting-functionalization, they diffuse around the cells exploring their environment at high speed with limited specific interaction with the sample. The trajectories analyzed in Figures 4b–d,f–h are indicated in Figures 4a,e with the red dashed boxes. 3D diffusion coefficients are around 0.5 μm2/s for most of the time along the trajectories. This value is consistent with earlier 2D studies [8]. Interestingly, the 3D shapes of these trajectories indicate diffusion around what appears as spherical volumetric structures within the tissue, which would have been indiscernible in 2D.
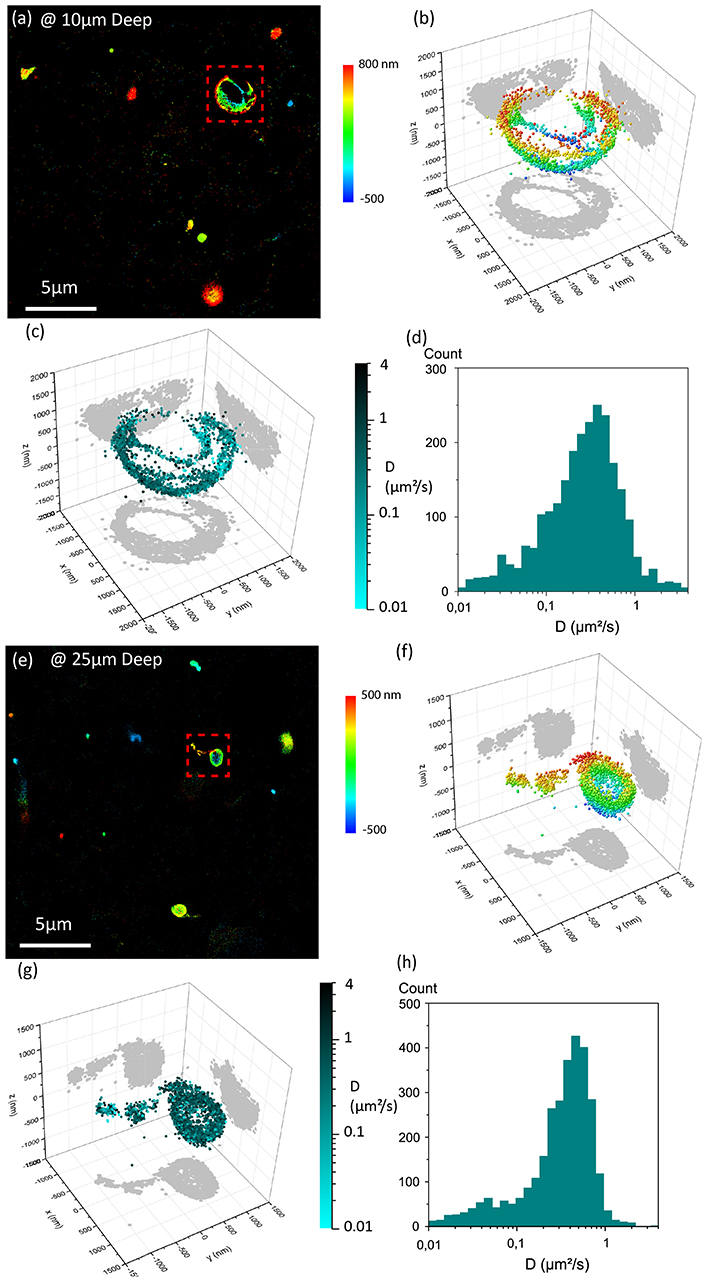
Figure 4. Single fluorescent QDot tracking in live organotypic brain slices. (a–d) Depth of imaging is 10μm. (e–h) and 25 μm. (a,e) Super-resolved 3D trajectories of single QDots. (b,f) Selected trajectories (with 2D projection) within the red doted square region in (a,e) the color coding corresponds to the axial positions. (c,g) Same as (b,f) the color coding corresponds to the instantaneous diffusion coefficients along the trajectory in logarithmic scale. (d,h) Corresponding histograms of instantaneous diffusion coefficients along the considered trajectories (c,g).
Discussion and Conclusion
This work demonstrates that SELFI can be easily combined with the most common super-localization methods developed for live sample imaging [(u)PAINT, PALM, SPT]. It extends these methods to 3D quantification in complex live samples. Since SELFI obtains the 3D information without causing significant photon loss, it is possible to apply this concept to single emitters having limited brilliance such as fluorescent proteins as used in PALM, or nanoparticles deep inside thick living tissues. SELFI also allows 3D single particle tracking at high imaging frames (here, 50 frames per second) to follow fast diffusion dynamics within a tissue. With SELFI, 3D localization is obtained solely by structuring the PSF with interference patterns in the image plane, which provide the freedom to use any fluorescence excitation scheme. Here we demonstrated highly oblique illumination in uPAINT experiments, total internal reflection in PALM imaging and standard epi-illumination for deep tissue SPT. Note that this independence from illumination schemes is key for tissue imaging applications because intrinsic light scattering by the sample might disturb specific illumination configurations that are needed to obtain the 3D information with other methods. In this work, we have also chosen to image quasi-metrological living biological samples by studying axial molecular structuration within cellular adhesion sites. The nanoscale layering of proteins measured with SELFI is in agreement with the data obtained in fixed cells in the literature. Finally, we have demonstrated fast 3D SPT in thick samples. This paves the way to the unambiguous study of molecular nano-organization and dynamics in complex samples where 2D imaging-only can lead to biased results. To conclude, we have demonstrated that SELFI is an efficient method for live super-resolution studies allowing 3D localization even at high depth (up to few tens of microns) on a regular epi-fluorescence based microscope. As long as a single molecule image can be formed in the imaging plane of the microscope, SELFI can retrieve its 3D localization well-beyond the diffraction limits, by sensing simultaneously the intensity and the phase of the light.
Author Contributions
JL-L, JF, OR, and PB performed the experiments. JL-L, JF, OR, and PB analyzed the data. PB and LC designed the study with help of OR, BL, GG, and LG. JL-L, GG, LC and PB wrote the manuscript. All authors discussed the data and commented on the manuscript.
Funding
This work was supported by CNRS, the Agence Nationale de la Recherche (ANR- 15-CE16-0004-03, ANR-16-CE29-0011-03, ANR-16-CE92-0034-01), IdEx Bordeaux (ANR-10-IDEX-03-02), the France-BioImaging national infrastructure (ANR-10-INBS-04-01), and Conseil Regional Nouvelle-Aquitaine (2015-1R60301-00005204). Fondation pour la Recherche Médicale (FRM: DEI20151234402).
Conflict of Interest Statement
The authors declare that the research was conducted in the absence of any commercial or financial relationships that could be construed as a potential conflict of interest.
References
1. Betzig E, Patterson GH, Sougrat R, Lindwasser OW, Olenych S, Bonifacino JS, et al. Imaging intracellular fluorescent proteins at nanometer resolution. Science. (2006) 313:1642–5. doi: 10.1126/science.1127344
2. Rust MJ, Bates M, Zhuang X. Sub-diffraction-limit imaging by stochastic optical reconstruction microscopy (STORM). Nat Methods. (2006) 3:793–6. doi: 10.1038/nmeth929
3. Sharonov A, Hochstrasser R. M. Wide-field subdiffraction imaging by accumulated binding of diffusing probes. Proc Natl Acad Sci USA. (2006) 103:18911–6. doi: 10.1073/pnas.0609643104
4. Huang B, Babcock H, Zhuang X. Breaking the diffraction barrier: super-resolution imaging of cells. Cell. (2010) 143:1047–58. doi: 10.1016/j.cell.2010.12.002
5. Legant WR, Shao L, Grimm JB, Brown TA, Milkie DE, Avants BB, et al. High-density three-dimensional localization microscopy across large volumes. Nat Methods. (2016) 13:359–65. doi: 10.1038/nmeth.3797
6. Heilemann M, van de Linde S, Schüttpelz M, Kasper R, Seefeldt B, Mukherjee A, et al. Subdiffraction-resolution fluorescence imaging with conventional fluorescent probes. Angew Chemie Int Ed. (2008) 47:6172–6. doi: 10.1002/anie.200802376
7. Winckler P, Lartigue L, Giannone G, De Giorgi F, Ichas F, Sibarita JB, et al. Identification and super-resolution imaging of ligand-activated receptor dimers in live cells. Sci Rep. (2013) 3:2387. doi: 10.1038/srep02387
8. Thorne RG, Nicholson C. In vivo diffusion analysis with quantum dots and dextrans predicts the width of brain extracellular space. Proc Natl Acad Sci USA. (2006) 103:5567–72. doi: 10.1073/pnas.0509425103
9. Godin AG, Varela JA, Gao Z, Danné N, Dupuis JP, Lounis B, et al. Single-nanotube tracking reveals the nanoscale organization of the extracellular space in the live brain. Nat Nanotechnol. (2017) 12:238–43. doi: 10.1038/nnano.2016.248
10. Varela JA, Dupuis JP, Etchepare L, Espana A, Cognet L, Groc L. Targeting neurotransmitter receptors with nanoparticles in vivo allows single-molecule tracking in acute brain slices. Nat Commun. (2016) 7:10947. doi: 10.1038/ncomms10947
11. Rossier O, Octeau V, Sibarita JB, Leduc C, Tessier B, Nair D, et al. Integrins β1 and β3 exhibit distinct dynamic nanoscale organizations inside focal adhesions. Nat Cell Biol. (2012) 14:1057–67. doi: 10.1038/ncb2588
12. Franke C, Sauer M, van de Linde S. Photometry unlocks 3D information from 2D localization microscopy data. Nat Methods. (2017) 14:41–4. doi: 10.1038/nmeth.4073
13. Bourg N, Mayet C, Dupuis G, Barroca T, Bon P, Lécart S, et al. Direct optical nanoscopy with axially localized detection. Nat Photon. (2015) 9:587–93. doi: 10.1038/nphoton.2015.132
14. Roider C, Jesacher A, Bernet S, Ritsch-Marte M. Axial super-localisation using rotating point spread functions shaped by polarisation-dependent phase modulation. Opt Express. (2014) 22:4029–37. doi: 10.1364/OE.22.004029
15. Shechtman Y, Weiss LE, Backer AS, Lee MY, Moerner WE. Multicolour localization microscopy by point-spread-function engineering. Nat Photon. (2016) 10:590–4. doi: 10.1038/nphoton.2016.137
16. Rosen J, Brooker G. Non-scanning motionless fluorescence three-dimensional holographic microscopy. Nat Photon. (2008) 2:190–5. doi: 10.1038/nphoton.2007.300
17. Ram S, Prabhat P, Chao J, Ward ES, Ober RJ. High accuracy 3D quantum dot tracking with multifocal plane microscopy for the study of fast intracellular dynamics in live cells. Biophys J. (2008) 95:6025–43. doi: 10.1529/biophysj.108.140392
18. Abrahamsson S, Chen J, Hajj B, Stallinga S, Katsov AY, Wisniewski J, et al. Fast multicolor 3D imaging using aberration-corrected multifocus microscopy. Nat Methods. (2013) 10:60–3. doi: 10.1038/nmeth.2277
19. Shtengel G, Galbraith JA, Galbraith CG, Lippincott-Schwartz J, Gillette JM, Manley S, et al. Interferometric fluorescent super-resolution microscopy resolves 3D cellular ultrastructure. Proc Natl Acad Sci USA. (2009) 106:3125–30. doi: 10.1073/pnas.0813131106
20. Kao HP, Verkman AS. Tracking of single fluorescent particles in three dimensions: use of cylindrical optics to encode particle position. Biophys J. (1994) 67:1291–300. doi: 10.1016/S0006-3495(94)80601-0
21. Huang B, Wang W, Bates M, Zhuang X. Three-dimensional super-resolution imaging by stochastic optical reconstruction microscopy. Science. (2008) 319:810–3. doi: 10.1126/science.1153529
22. Pavani SRP, Piestun R. Three dimensional tracking of fluorescent microparticles using a photon-limited double-helix response system. Opt Express. (2008) 16:22048–57. doi: 10.1364/OE.16.022048
23. Jia S, Vaughan JC, Zhuang X. Isotropic three-dimensional super-resolution imaging with a self-bending point spread function. Nat Photon. (2014) 8:302–6. doi: 10.1038/nphoton.2014.13
24. Bon P, Linarès-Loyez J, Feyeux M, Alessandri K, Lounis B, Nassoy P, et al. Self-interference 3D super-resolution microscopy for deep tissue investigations. Nat Methods. (2018) 15:449–54. doi: 10.1038/s41592-018-0005-3
25. Primot J, Guérineau N. Extended hartmann test based on the pseudoguiding property of a hartmann mask completed by a phase chessboard. Appl Opt. (2000) 39:5715–20. doi: 10.1364/AO.39.005715
26. Bon P, Maucort G, Wattellier B, Monneret S. Quadriwave lateral shearing interferometry for quantitative phase microscopy of living cells. Opt Express. (2009) 17:13080–94. doi: 10.1364/OE.17.013080
27. Backer AS, Backlund MP, von Diezmann AR, Sahl SJ, Moerner WE. A bisected pupil for studying single-molecule orientational dynamics and its application to three-dimensional super-resolution microscopy. Appl Phys Lett. (2014) 104:193701. doi: 10.1063/1.4876440
28. van de Linde S, Löschberger A, Klein T, Heidbreder M, Wolter S, Heilemann M, et al. Direct stochastic optical reconstruction microscopy with standard fluorescent probes. Nat Protoc. (2011) 6:991–1009. doi: 10.1038/nprot.2011.336
29. Giannone G, Hosy E, Levet F, Constals A, Schulze K, Sobolevsky AI, et al. Dynamic superresolution imaging of endogenous proteins on living cells at ultra-high density. Biophys J. (2010) 99:1303–10. doi: 10.1016/j.bpj.2010.06.005
30. Bon P, Bourg N, Lécart S, Monneret S, Fort E, Wenger J, et al. Three-dimensional nanometre localization of nanoparticles to enhance super-resolution microscopy. Nat Commun. (2015) 6:7764. doi: 10.1038/ncomms8764
31. Stoppini L, Buchs PA, Muller D. A simple method for organotypic cultures of nervous tissue. J Neurosci Methods. (1991) 37:173–82. doi: 10.1016/0165-0270(91)90128-M
32. Verveer PJ, Wouters FS, Reynolds AR, Bastiaens PIH. Quantitative imaging of lateral ErbB1 receptor signal propagation in the plasma membrane. Science. (2000) 290:1567–70. doi: 10.1126/science.290.5496.1567
33. Nagy P, Claus J, Jovin TM, Arndt-Jovin DJ. Distribution of resting and ligand-bound ErbB1 and ErbB2 receptor tyrosine kinases in living cells using number and brightness analysis. Proc Natl Acad Sci USA. (2010) 107:16524–9. doi: 10.1073/pnas.1002642107
34. Sako Y, Minoghchi S, Yanagida T. Single-molecule imaging of EGFR signalling on the surface of living cells. Nat Cell Biol. (2000) 2:168–72. doi: 10.1038/35004044
35. Webb SED, Roberts SK, Needham SR, Tynan CJ, Rolfe DJ, Winn MD, et al. Single-molecule imaging and fluorescence lifetime imaging microscopy show different structures for high-and low-affinity epidermal growth factor receptors in A431 cells. Biophys J. (2008) 94:803–19. doi: 10.1529/biophysj.107.112623
36. Chung I, Akita R, Vandlen R, Toomre D, Schlessinger J, Mellman I. Spatial control of EGF receptor activation by reversible dimerization on living cells. Nature. (2010) 464:783–7. doi: 10.1038/nature08827
37. Giannone G, Hosy E, Sibarita JB, Choquet D, Cognet L. High-content super-resolution imaging of live cell by uPAINT. Methods Mol Biol. (2013) 950:95–110. doi: 10.1007/978-1-62703-137-0_7
38. Kanchanawong P, Shtengel G, Pasapera AM, Ramko EB, Davidson MW, Hess HF, et al. Nanoscale architecture of integrin-based cell adhesions. Nature. (2010) 468:580–4. doi: 10.1038/nature09621
39. Arnspang EC, Brewer JR, Lagerholm BC. Multi-color single particle tracking with quantum dots. PLoS ONE. (2012) 7:e48521. doi: 10.1371/journal.pone.0048521
40. Jaqaman K, Loerke D, Mettlen M, Kuwata H, Grinstein S, Schmid SL, et al. Robust single-particle tracking in live-cell time-lapse sequences. Nat Methods. (2008) 5:695–702. doi: 10.1038/nmeth.1237
41. van der Schaar HM, Rust MJ, Chen C, van der Ende-Metselaar H, Wilschut J, Zhuang X, et al. Dissecting the cell entry pathway of dengue virus by single-particle tracking in living cells. PLoS Pathog. (2008) 4:e1000244. doi: 10.1371/journal.ppat.1000244
42. Biermann B, Sokoll S, Klueva J, Missler M, Wiegert JS, Sibarita JB, et al. Imaging of molecular surface dynamics in brain slices using single-particle tracking. Nat Commun. (2014) 5:3024. doi: 10.1038/ncomms4024
43. Ritter JG, Veith R, Veenendaal A, Siebrasse JP, Kubitscheck U. Light sheet microscopy for single molecule tracking in living tissue. PLoS ONE. (2010) 5:e11639. doi: 10.1371/journal.pone.0011639
44. Perillo EP, Liu YL, Huynh K, Liu C, Chou CK, Hung MC, et al. Deep and high-resolution three-dimensional tracking of single particles using nonlinear and multiplexed illumination. Nat Commun. (2015) 6:7874. doi: 10.1038/ncomms8874
Keywords: super-resolution (SR) imaging, single molecule localization microscopy (SMLM), phase imaging, interferometry, fluorescence, single particle tracking (SPT), single particle 3D reconstruction
Citation: Linarès-Loyez J, Ferreira JS, Rossier O, Lounis B, Giannone G, Groc L, Cognet L and Bon P (2019) Self-Interference (SELFI) Microscopy for Live Super-Resolution Imaging and Single Particle Tracking in 3D. Front. Phys. 7:68. doi: 10.3389/fphy.2019.00068
Received: 28 January 2019; Accepted: 18 April 2019;
Published: 08 May 2019.
Edited by:
Pietro Ferraro, Italian National Research Council (CNR), ItalyReviewed by:
David Mayerich, University of Houston, United StatesXiaojun Yu, Nanyang Technological University, Singapore
Pasquale Memmolo, Institute of Applied Sciences and Intelligent Systems (ISASI), Italy
Copyright © 2019 Linarès-Loyez, Ferreira, Rossier, Lounis, Giannone, Groc, Cognet and Bon. This is an open-access article distributed under the terms of the Creative Commons Attribution License (CC BY). The use, distribution or reproduction in other forums is permitted, provided the original author(s) and the copyright owner(s) are credited and that the original publication in this journal is cited, in accordance with accepted academic practice. No use, distribution or reproduction is permitted which does not comply with these terms.
*Correspondence: Laurent Cognet, bGF1cmVudC5jb2duZXRAdS1ib3JkZWF1eC5mcg==
Pierre Bon, cGllcnJlLmJvbkB1LWJvcmRlYXV4LmZy