- 1Department of Theoretical Mechanics, Institute of Mathematics and Mechanics, Kazan Federal University, Kazan, Russia
- 2Department of Human and Animal Physiology, Institute of Fundamental Medicine and Biology, Kazan Federal University, Kazan, Russia
In abstract methods of automation of histology, bone structure is considered. Possible inputs are snapshots from a microscope or computed tomography slices. An algorithm is proposed that differentiates objects according to their color (or grayscale) and recover morphology topology. An algorithm to separate morphological objects by their dimensions and color parameters was built. Measured parameters were bone surface, bone area, porosity, cortical thickness, canal number, canal area, and etc. Additionally, we measured the anisotropy properties of the bone tissue: distribution of porosity direction and degree of porosity elongation. A bone example was scanned by computed tomography. All data were measured by the proposed method and the results presented. An example algorithm of work on computed tomography data is shown in this work.
Introduction
Analysis of bone tissue quality is important in various branches of medicine. Knowledge about bone tissue state can help to understand the processes which happen in it, as traditionally, analysis of the biological data is manual and the quality of the analysis depends on a specialist's experience [1–7]. In general, automatization of such analysis is complicated because of random input data [8–12]. The following approaches to image processing can be distinguished: the elimination of necessary elements by various filters, image segmentation, and analysis of elements. The proposed approach is in some way a hybrid of these approaches. But in many cases, there are typical problems to solve: count the number of a biological object, analyze the orientation of some biological object in snapshot and etc. In the paper, we introduce a method to analyze bone tissue and generalized problems are presented. The main idea of applying the proposed algorithm is to reduce manual labor in image processing. The analysis of the results obtained when comparing various investigated groups (different age, sex, etc.) remains on the shoulders of the researcher. Computed tomography data were used to illustrate the method proposed below [13–15].
Materials and Methods
Macro Scale Data
At first, let's consider analysis of the macro scale of bone tissue. We interpret macro scale data of the bone sample in the case when a whole bone slice is presented. In such data, usually cells (e.g., osteocyte) can't be seen properly, but information about blood vessels is complete. For such data it is important to calculate some traditional morphology information [16–19], such as bone surface (B.PM), bone area (B.Ar), porosity (Po), cortical thickness (Ct.Wi), canal number (N.Ca), canal area (Ca.Ar), and etc. Additionally, the degree of anisotropy can be measured. For these tasks it is important to split all data into, at least, three major groups: external environment, bone tissue, and inclusions.
Origin data is denoted as S.
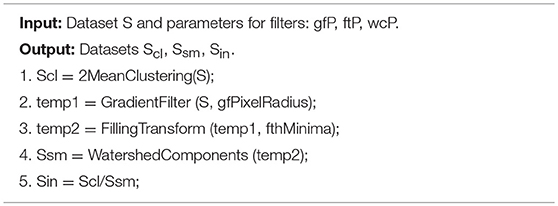
At the first step, all data should be clustered into 2 clusters. Clusterization had been done by means of the Euclidean distance in color space K-means clustering algorithm for cluster classification was used. Clustered data let's denote as Scl.
To separate inclusions from the external environment, data should be smoothed. This was achieved by means of the gradient filter as well as filling the transform and watershed components. The gradient filter provides data corresponding to the magnitude of the input's gradient and is computed using discrete derivatives of a Gaussian of pixel radius gfPixelRadius. For the gradient filter options, we should use about 1–5% of lower dimension. Filling transform fills all extended minima with depth fthMinima or less by lifting their values to the lowest value found among the surrounding pixels. Where an extended minimum is a connected to a set of pixels surrounded by pixels by a radius that all have a greater value than the pixels in the set. For filling transform maximum depth should be in range 0.002–0.02. Watershed components find basins at each regional minimum in the image.
Smoothed data is denoted as Ssm.
To get inclusions received data should be binary subtracted from clustered data, where inclusions data is denoted as Sin. Denote binary subtraction as an inversion of converse implication:
Proposed method depends only on values of input.
And this fact allows us to keep using the same option for sets of images, which improves the quality of automation [20–22]. On Figure 1 all mentioned sets are shown: set S (upper left), Scl (upper right), Ssm (bottom left), and Sin (bottom right). In this case, histological parameters can be calculated easily:
Canal number can be calculated as number of related subsets in Sin. Thus, average canal area can be calculated:
To calculate Ct.Wi, a polar coordinate system is introduced in the center of mass of Scl. Then, using radial vectors of the distance between interfaces (bone and void) can be calculated. Distribution of these values is a function of polar angle.
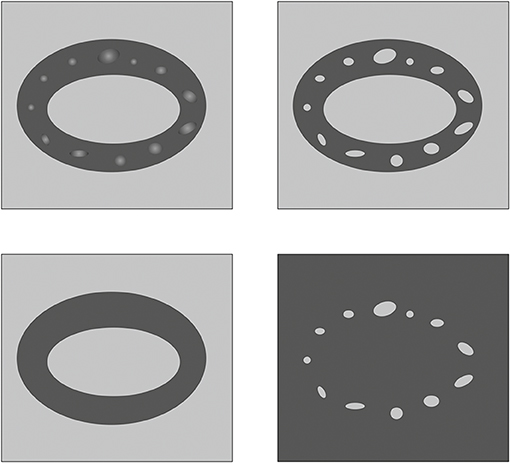
Figure 1. Schematic representation of original data S (upper left), clustered data Scl (upper right), smoothed data Ssm (bottom left), and data of inclusions Sin (bottom right).
The algorithm of preparing the data can be described as:
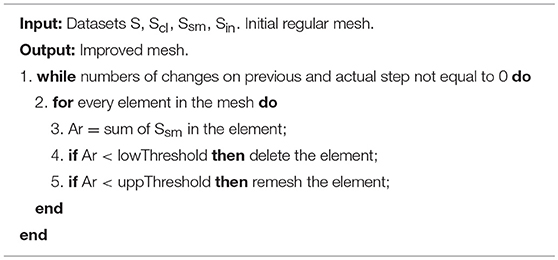
To calculate the degree of anisotropy, a fabric tensor was used [23–26]. For this purpose, all data should meshed by 2-D Cartesian grid and fabric tensor should be calculated for every element. Inclusions data was used to improve the quality of the mesh. An adaptive algorithm was used to tailor the mesh. The algorithm based on the calculation of relative abundances of inclusions in an element. For every element B.Ar should be calculated, to check if there are some bone tissue compare B.Ar with preset infimum εB.AR. Then if the size of the element allows it can be remeshed. Then the presence of inclusions should be checked. To do this comparison of Po with preset infimum εPo needed. If true, then MIL can be calculated. According to the abundances, the element can be thrown away and then remeshed or taken into the calculation (see Figure 2). The algorithm of meshing can be described as:

Figure 2. Schematic representation of remeshing algorithm. Initial mesh (left). The first step of improving the mesh (middle), void elements highlighted with red. The second step of improving the mesh (right), elements suitable for calculation highlighted with green.
Will consider fabric tensor as a quadratic approximation of mean intercept length (MIL) [23–26].
where L – MIL data, x – space vector, M – fabric tensor.
Degree of anisotropy can be calculated as an aspect ratio of the eigenvalues of fabric tensor.
where λ1 – the 1st eigenvalue, λ2 – the 2nd eigenvalue.
To expand analyze of inclusions distribution the eigenvectors field were investigated. For this purpose, additional data set Srs should be formed. The polar coordinate system with a pole in the center of mass of clustered data is introduced below.
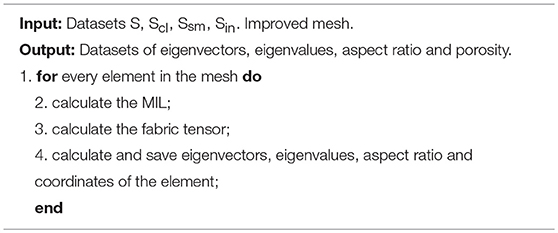
where φ, r – polar coordinate of i-th element's center, an investigated parameter can be a degree of anisotropy η in the i-th element, h – 1st or 2nd eigenvector (analogically in the i-th element). The algorithm calculation the fabric tensor distribution can be described as:
The description of the algorithm presented in detail in Semenova et al. [23] with an example for estimation the quality of collagen recovery using microscopy data. For the data, the correlation matrix was calculated and singular value decomposition was used. Not affecting the parameter coordinates can be determined by defining infinitesimal singular values. On the basis of this analysis, average parameter can be calculated. Described methods were used on μCT orthogonal slices of diaphysis femur. Origin data consists of about a 100 slices.
Results and Discussion
The methods described were used for analyzing bone tissue samples. For this purpose, μCT data of bone tissue slices (n = 100) were used [27]. Micro / nanofocal X-ray inspection system for CT and 2D inspections of Phoenix V|tome|X S240 was used for scanning. The system is equipped with two X-ray tubes: microfocus with a maximum accelerating voltage of 240 kV power of 320 W and nanofocus with a maximum accelerating voltage of 180 kV power of 15 W. For primary data processing and creating a volume (voxel) model of the sample based on x-ray images, the datos|x reconstruction software was used. The sample fixed in the holder was placed on the rotating table of the X-ray computed tomography chamber at the optimum distance from the X-ray source. The survey was carried out at an accelerating voltage of 90–100 kV, and current 140–150 mA. Described data can be useful in histology analysis [28–35]. The dimension of slices was 449 ×610 pixels, pixel's dimension −7.985 μm. The options used for the calculations depended on properties of inputs and it is an advantage of the method. It means that for all arrays of slices, the options selected will be constant. Nowadays options should be picked up manually. For the presented data, a gradient filter with 8 pixels value was used (gfPixelRadius), filling transform −0.03 (fthMinima). For meshing algorithm low Threshold was equal to 5% and upper Threshold was equal to 70%. On Figure 3 original data S (the first row), clustered data Scl (the second row), smoothed data Ssm (the third row) and data of inclusions Sin (the fourth row) for the arbitrary slices are shown.
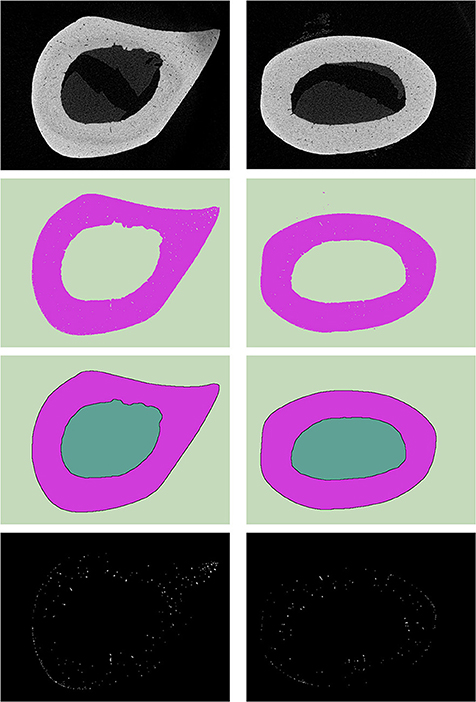
Figure 3. Example of sets for two different slices (left and right sides): the first (on top)—origin data, the second—clustered data Scl, the third—smoothed data Ssm, and the fourth—data of inclusions Sin.
Marked above histological parameters were calculated and analyzed. On Figure 4 all results are shown. Po was linear in a longitudinal direction, correlation coefficient was −0.30 (r2 = 0.921). B.Ar was linear in longitudinal direction, correlation coefficient was −0.26 (r2 = 0.978). B.Pm. was quadratic in longitudinal direction (r2 = 0.931). Ca.Ar was linear in longitudinal direction, correlation coefficient was −0.21 (r2 = 0.962).
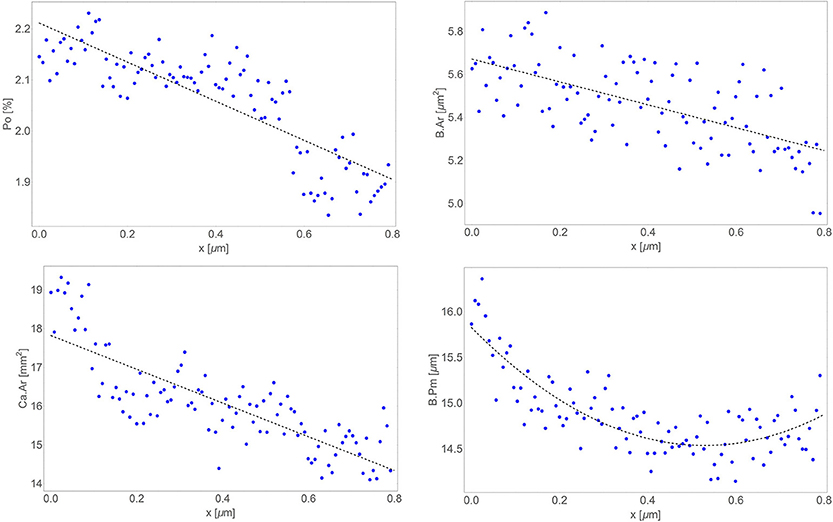
Figure 4. Distribution in longitudinal direction of results (blue dots) and their trends (dashed line): porosity (upper left), bone area (upper right), canal area (bottom left), and bone surface (bottom right).
Results for fabric tensor were close to results from previous work [26], and the difference can be explained by dimensions of data (2D via 3D). The second eigenvector of the fabric tensor was almost radial directed (deviation about ± 10°), the first eigenvector of the fabric tensor was in the orthogonal direction. Eigenvectors do not depend on radial coordinates. Aspect ratio of eigenvalues was 0.58 ± 0.07 (13%).
Conclusion
Method of automatic analyses of a microscope or μCT data is presented. The proposed method allows splitting bone tissue and inclusions. Such an approach allows simplifying the calculation of histological parameters. Additionally, a method to analyze the spatial distribution of inclusion is offered. To do this the sample should be meshed, and for every element mean intercept length distribution should be restored. The described technique was used to analyze μCT slices of bone. And the received results illustrate the effectiveness of the method. The described algorithm can be easily transferred in some software for biological analyze, e.g., ImageJ.
Data Availability
The datasets generated for this study are available on request to the corresponding author.
Ethics Statement
This study was carried out in accordance with the recommendations of local ethics committee Kazan Federal University. The protocol was approved by the local ethics committee Kazan Federal University.
Author Contributions
VY, OS, OG, and MZ design method, realized it on programming language and wrote the manuscript. AF, MB, and TB conducted experimental data for numerical calculation and contributed to manuscript writing.
Funding
This work was supported by the Russian Science Foundation (RSF Grant No. 18-75-10027).
Conflict of Interest Statement
The authors declare that the research was conducted in the absence of any commercial or financial relationships that could be construed as a potential conflict of interest.
Acknowledgments
Special thanks to Interdisciplinary center for analytical microscopy of Kazan Federal University.
References
1. Jones AC, Arns CH, Sheppard AP, Hutmacher DW, Milthorpe BK, Knackstedt MA. Assessment of bone ingrowth into porous biomaterials using MICRO-CT. Biomaterials. (2007) 28:2491–504. doi: 10.1016/j.biomaterials.2007.01.046
2. Stock SR, Naik NK, Wilkinson AP, Kurtis KE. X-ray microtomography (microCT) of the progression of sulfate attack of cement paste. Cement Concrete Res. (2002) 32:1673–5. doi: 10.1016/S0008-8846(02)00814-1
3. Van Lenthe GH, Hagenmüller H, Bohner M, Hollister SJ, Meinel L, Müller R. Nondestructive micro-computed tomography for biological imaging and quantification of scaffold-bone interaction in vivo. Biomaterials. (2007) 28:2479–90. doi: 10.1016/j.biomaterials.2007.01.017
4. Moriya T, Roth HR, Nakamura S, Oda H, Nagara K, Oda M, et al. Unsupervised segmentation of 3D medical images based on clustering and deep representation learning. Progr Biomed Opt Imaging. (2018) 10578:1057820. doi: 10.1117/12.2293414
5. Bobyn JD, Pilliar RM, Cameron HU, Weatherly GC. The optimum pore size for the fixation of porous surfaced metal implants by the ingrowth of bone. Clin Orthopaed Relat Res. (1980) 150:263–70. doi: 10.1097/00003086-198007000-00045
6. Cook SD, Thongpreda N, Anderson RC. Optimum pore size for bone cement fixation. Clin Orthop Relat Res. (1987) 223:296–302. doi: 10.1097/00003086-198710000-00037
7. O'Brien FJ, Harley BA, Yannas IV, Gibson LJ. The effect of pore size on cell adhesion in collagen-GAG scaffolds. Biomaterials. (2005) 26:433–41. doi: 10.1016/j.biomaterials.2004.02.052
8. Sweedy A, Bohner M, Baroud G. Multimodal analysis of in vivo resorbable CaP bone substitutes by combining histology, SEM, and microcomputed tomography data. J Biomed Mater Res. (2018) 106:1567–77. doi: 10.1002/jbm.b.33962
9. Polak SJ, Candido S, Levengood SKL, Wagoner Johnson AJ. Automated segmentation of micro-CT images of bone formation in calcium phosphate scaffolds. Comput Med Imaging Graph. (2012) 36:54–65. doi: 10.1016/j.compmedimag.2011.07.004
10. Brown MS, McNitt-Gray MF, Mankovich NJ, Goldin JG, Hiller J, Wilson LS, et al. Method for segmenting chest CT image data using an anatomical model:preliminary results. IEEE Trans Med Imaging. (2002) 16:828–39. doi: 10.1109/42.650879
11. Pal NR, Pal SK. A review on image segmentation techniques. Pattern Recogn. (1993) 26:1277–94. doi: 10.1016/0031-3203(93)90135-J
12. Foruzan AH, Zoroofi RA, Hori M, Sato Y. A knowledge-based technique for liver segmentation in CT data. Comput Med Imaging Graph. (2009) 33:567–87. doi: 10.1016/j.compmedimag.2009.03.008
13. Shen H, Nutt S, Hull D. Direct observation and measurement of fiber architecture in short fiber-polymer composite foam through micro-CT imaging. Compos Sci Technol. (2004) 64:2113–20. doi: 10.1016/j.compscitech.2004.03.003
14. Ding M, Odgaard A, Hvid I. Accuracy of cancellous bone volume fraction measured by micro-CT scanning. J Biomech. (1999) 32:323–6. doi: 10.1016/S0021-9290(98)00176-6
15. du Plessis A, Broeckhoven C, Guelpa A, le Roux SG. Laboratory x-ray micro-computed tomography: a user guideline for biological samples. GigaScience. (2017) 6:gix027. doi: 10.1093/gigascience/gix027
16. Klintström B, Klintström E, Smedby Ö, Moreno R. Feature space clustering for trabecular bone segmentation. Scandin Conf Image Anal. (2017) 10270:65–75. doi: 10.1007/978-3-319-59129-2_6
17. Straumit I, Lomov SV, Wevers M. Quantification of the internal structure and automatic generation of voxel models of textile composites from X-ray computed tomography data. Compos Part A Appl Sci Manuf . (2015) 69:150–8. doi: 10.1016/j.compositesa.2014.11.016
18. Dunmore CJ, Wollny G, Skinner MM. MIA-Clustering: A novel method for segmentation of paleontological material. PeerJ. (2018) 2018:e4374. doi: 10.7717/peerj.4374
19. Meneses AADM, Palheta DB, Pinheiro CJG, Barroso RCR. Graph cuts and neural networks for segmentation and porosity quantification in Synchrotron Radiation X-ray μCT of an igneous rock sample. Appl Rad Isotopes. (2018) 133:121–32. doi: 10.1016/j.apradiso.2017.12.019
20. van't Hof RJ, Rose L, Bassonga E, Daroszewska A. Open source software for semi-automated histomorphometry of bone resorption and formation parameters. Bone. (2017) 99:69–79. doi: 10.1016/j.bone.2017.03.051
21. Peters M, Scharmga A, van Tubergen A, Arts J, Loeffen D, Weijers R, et al. The reliability of a semi-automated algorithm for detection of cortical interruptions in finger joints on high resolution CT compared to MicroCT. Calcif Tissue Int. (2017) 101:132–40. doi: 10.1007/s00223-017-0264-5
22. Rajagopalan S, Lu L, Yaszemski MJ, Robb RA. Optimal segmentation of microcomputed tomographic images of porous tissue-engineering scaffolds. J Biomed Mater Res. (2005) 75A:877–87. doi: 10.1002/jbm.a.30498
23. Semenova E, Gerasimov O, Koroleva E, Ahmetov N, Baltina T, Sachenkov O. Automatic processing and analysis of the quality healing of derma injury. Adv Intell Syst Comput. (2019) 831:107–13. doi: 10.1007/978-3-319-97286-2_10
24. Shigapova FA, Baltina TV, Konoplev YG, Sachenkov OA. Methods for automatic processing and analysis of orthotropic biological structures by microscopy and computed. Int J Phar Technol. (2016) 8:14953–64.
25. Harrigan TP, Mann RW. Characterization of microstructural anisotropy in orthotropic materials using a second rank tensor. J Mater Sci. (1984) 19:761–7. doi: 10.1007/BF00540446
26. Baltina T, Sachenkov O, Gerasimov O, Baltin M, Fedyanin A, Lavrov I. The influence of hindlimb unloading on the bone tissue's structure. BioNanoScience. (2018) 8:864–7. doi: 10.1007/s12668-018-0551-2
27. Tse JJ, Dunmore-Buyze J, Drangova M, Holdsworth DW. Dual-energy computed tomography using a gantry-based preclinical cone-beam microcomputed tomography scanner. J Med Imaging. (2018) 5:033503. doi: 10.1117/1.JMI.5.3.033503
28. Siqueira JF Jr, Pérez AR, Marceliano-Alves MF, Provenzano JC, Silva SG, Pires FR, et al. What happens to unprepared root canal walls:a correlative analysis using micro-computed tomography and histology/scanning electron microscopy. Int Endodont J. (2018) 51:501–8. doi: 10.1111/iej.12753
29. Bissinger O, Probst FA, Wolff K-D, Jeschke Ac, Weitz J, Deppe H, et al. Comparative 3D micro-CT and 2D histomorphometry analysis of dental implant osseointegration in the maxilla of minipigs. J Clin Periodontol. (2017) 44:418–27. doi: 10.1111/jcpe.12693
30. Mai C, Verleden SE, McDonough JE, Willems S, De Wever W, Coolen J, et al. Thin-section CT features of idiopathic pulmonary fibrosis correlated with micro-CT and histologic analysis. Radiology. (2017) 283:252–63. doi: 10.1148/radiol.2016152362
31. Zuolo ML, Zaia AA, Belladonna FG, Silva EJNL, Souza EM, Versiani MA, et al. Micro-CT assessment of the shaping ability of four root canal instrumentation systems in oval-shaped canals. Int Endodont J. (2018) 51:564–71. doi: 10.1111/iej.12810
32. Park J-Y, Chung J-H, Lee J-S, Kim H-J, Choi S-H, Jung U-W. Comparisons of the diagnostic accuracies of optical coherence tomography, micro-computed tomography, and histology in periodontal disease: An ex vivo study. J Period Implant Sci. (2017) 47:30–40. doi: 10.5051/jpis.2017.47.1.30
33. Hutchinson JC, Shelmerdine SC, Simcock IC, Sebire NJ, Arthurs OJ. Early clinical applications for imaging at microscopic detail:Microfocus computed tomography (micro-CT). Br J Radiol. (2017) 90:20170113. doi: 10.1259/bjr.20170113
34. Elfarnawany M, Alam SR, Rohani SA, Zhu N, Agrawal SK, Ladak HM. Micro-CT versus synchrotron radiation phase contrast imaging of human cochlea. J Microsc. (2017) 265:349–57. doi: 10.1111/jmi.12507
Keywords: quantitative phase imaging, label-free, microscopy, interferometric microscopy, holographic microscopy, microtomography
Citation: Yaikova VV, Gerasimov OV, Fedyanin AO, Zaytsev MA, Baltin ME, Baltina TV and Sachenkov OA (2019) Automation of Bone Tissue Histology. Front. Phys. 7:91. doi: 10.3389/fphy.2019.00091
Received: 05 March 2019; Accepted: 03 June 2019;
Published: 25 June 2019.
Edited by:
Pietro Ferraro, Italian National Research Council (CNR), ItalyReviewed by:
Chikara Sato, National Institute of Advanced Industrial Science and Technology (AIST), JapanNaveen Kondru, Iowa State University, United States
Copyright © 2019 Yaikova, Gerasimov, Fedyanin, Zaytsev, Baltin, Baltina and Sachenkov. This is an open-access article distributed under the terms of the Creative Commons Attribution License (CC BY). The use, distribution or reproduction in other forums is permitted, provided the original author(s) and the copyright owner(s) are credited and that the original publication in this journal is cited, in accordance with accepted academic practice. No use, distribution or reproduction is permitted which does not comply with these terms.
*Correspondence: Oskar A. Sachenkov, NHdvcmtzQGJrLnJ1
 Viktoriya V. Yaikova1
 Tatyana V. Baltina
 Oskar A. Sachenkov