Abstract
We consider the Equal-Load-Sharing Fiber Bundle Model as a model for composite materials under stress and derive elastic energy and damage energy as a function of strain. With gradual increase of stress (or strain) the bundle approaches a catastrophic failure point where the elastic energy is always larger than the damage energy. We observe that elastic energy has a maximum that appears after the catastrophic failure point is passed, i.e., in the unstable phase of the system. However, the slope of elastic energy vs. strain curve has a maximum which always appears before the catastrophic failure point and therefore this can be used as a reliable signal of upcoming catastrophic failure. We study this behavior analytically for power-law type and Weibull type distributions of fiber thresholds and compare the results with numerical simulations on a single bundle with large number of fibers.
1. Introduction
Accurate prediction of upcoming catastrophic failure events has important and far-reaching consequences. It is a central problem in material science in connection with the durability of composite materials under external stress [1–5]. The same problem exists at a large scale (field-scale) associated with mine and cave collapses, landslides, snow avalanches and the onset of earthquakes due to plate movements [6, 7]. In medical science, understanding fracturing of human bones exposed to a sudden stress is an important research area [8]. These phenomena belong to the class of phenomena called stress-induced fracturing, where initially micro-fractures are produced here and there in the system and at some point, due to gradual stress increase, a major fracture develops through coalescence of micro-fractures and the whole system collapses (catastrophic event). Such stress-induced failures occur also in very different domains—for example, in breakdown of social relationships and mental health [9, 10].
The central question is—when does the catastrophic failure occur? Is there any prior signature that can tell us whether catastrophic failure is imminent? The inherent heterogeneities of the systems and the stress redistribution mechanisms (inhomogeneous in most cases) make things complicated and a concrete theory of the prediction schemes, even in model systems, is still lacking.
In this article, we address this problem (prediction of catastrophic events) in the Fiber Bundle Model (FBM) which has been used as a standard model [11–14] for fracturing in composite materials under external stress. We will show theoretically that in the Equal-Load-Sharing (ELS) model: (1) At the catastrophic failure point, the elastic energy is always larger than the damage energy. (2) The elastic energy variation shows a distinct peak before the catastrophic failure point and this is a universal feature, i.e., it does not depend on the threshold distribution of the elements in the system. (3) The energy release during final catastrophic event is much bigger than the elastic energy stored in the system at the failure point. Our numerical results show perfect agreement with the theoretical estimates.
We organize our article as follows: After the brief introduction (section 1), we define the elastic energy and the damage energy in the Fiber Bundle Model in section 2. In sections 3 and 4 we calculate the elastic and damage energies of the model in terms of strain or extension. In several subsections of sections 3 and 4 we explore the theoretical calculations for power-law type and Weibull type distribution of fiber thresholds. Simulation results are presented and numerical results are compared with the theoretical estimates in these sections. We present a general analysis of elastic energy variations and existence of an elastic-energy maximum in section 5. In section 6 we identify the warning sign of catatrophic failure by locating the inflection point. Here, in addition to uniform and Weibull distributions, we choose a mixed threshold distribution and present the numerical results, based on Monte Carlo simulation, to confirm the universality of the behavior in the ELS models. Finally, we keep some discussions in section 7.
2. The Fiber Bundle Model
The fiber bundle model consists of N parallel fibers placed between two solid clamps (Figure 1). Each fiber responds linearly with a force f to a stretch or extension Δ,
where κ is the spring constant. κ is the same for all fibers. Each fiber has a threshold x assigned to it. If the stretch Δ exceeds this threshold, the fiber fails irreversibly. When the clamps are stiff, load will be redistributed equally on the surviving fibers and this is called the equal-load-sharing (ELS) scheme. Throughout this article we work with ELS models only.
Figure 1
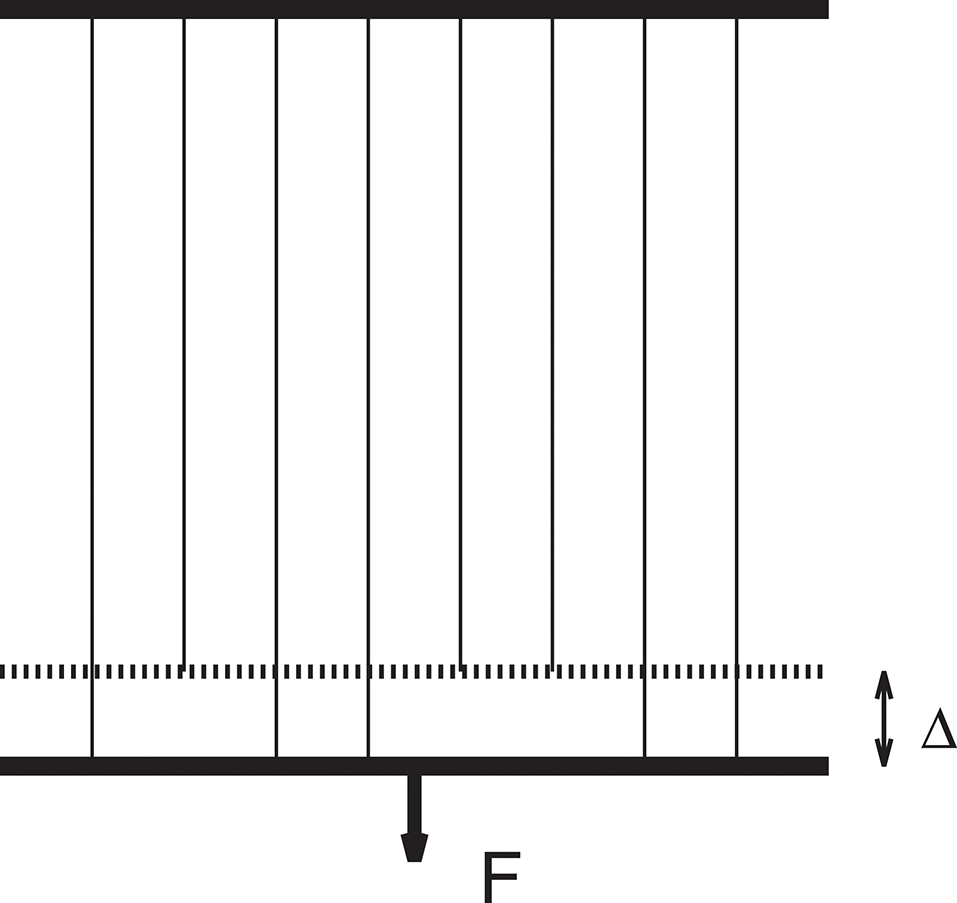
The fiber bundle model.
The fiber thresholds are drawn from a probability density p(x). The corresponding cumulative probability is:
When the fiber bundle is loaded, the fibers fail according to their thresholds, the weaker before the stronger. Suppose that n fibers have failed. At a stretch Δ, the fiber bundle carries a force:
where we have defined the damage:
When N is large enough, d may be treated as a continuous parameter.
We will now assume that the stretch Δ is our control parameter. We can construct the energy budget according to continuous damage mechanics [1, 15]. Clearly, when we stretch the bundle with external force, work is done on the system. At a stretch Δ and damage d, the elastic energy stored by the surviving fibers is:
The damage energy of the failed fibers is given by:
The total energy at stretch Δ and damage d is, then:
3. Elastic Energy and Damage Energy at the Failure Point
We are going to analyze the energy relations when the bundle is in equilibrium. We know that there is a certain value, Δ = Δc, beyond which catastrophic failure occurs and the system collapses completely. We are particularly interested in what happens at the failure point. Is there a universal relation between elastic energy and damage energy at the failure point?
When N is large, we can reframe (Equations 5, 6) and express the energies in terms of external stretch (or extension) Δ as:
and
The force on the bundle at a stretch Δ can be written as:
The force must have a maximum at the failure point Δc, therefore setting dF(Δ)/dΔ = 0 we get:
3.1. Uniform Threshold Distribution
We start with the simplest threshold distribution: the uniform distribution, which is well-known in fiber bundle research [14]. For a uniform fiber threshold distribution within the range (0, 1), p(x) = 1 and P(x) = x. Therefore we get, from Equation (11),
Now putting Δc = 1/2 in Equations (8, 9), we get:
and
Therefore, the ratio between damage energy and elastic energy at the failure point (Δc) is:
3.2. Power-Law Type Threshold Distribution
Now we move to a general power law type fiber threshold distributions within the range (0, 1),
The cumulative distribution takes the form:
We insert the expressions for p(x) and P(x) into Equation (11) and find the critical extention:
We can calculate the elastic energy and damage energy at the failure point Δc:
and
Plugging in the value of Δc (Equation 18) into the above equations for elastic energy and damage energy we end up with the following relation:
Clearly, the ratio depends on the power factor α (Figure 2). When α = 0, the threshold distribution reduces to a uniform distribution and we immediately go back to Equation (15).
Figure 2
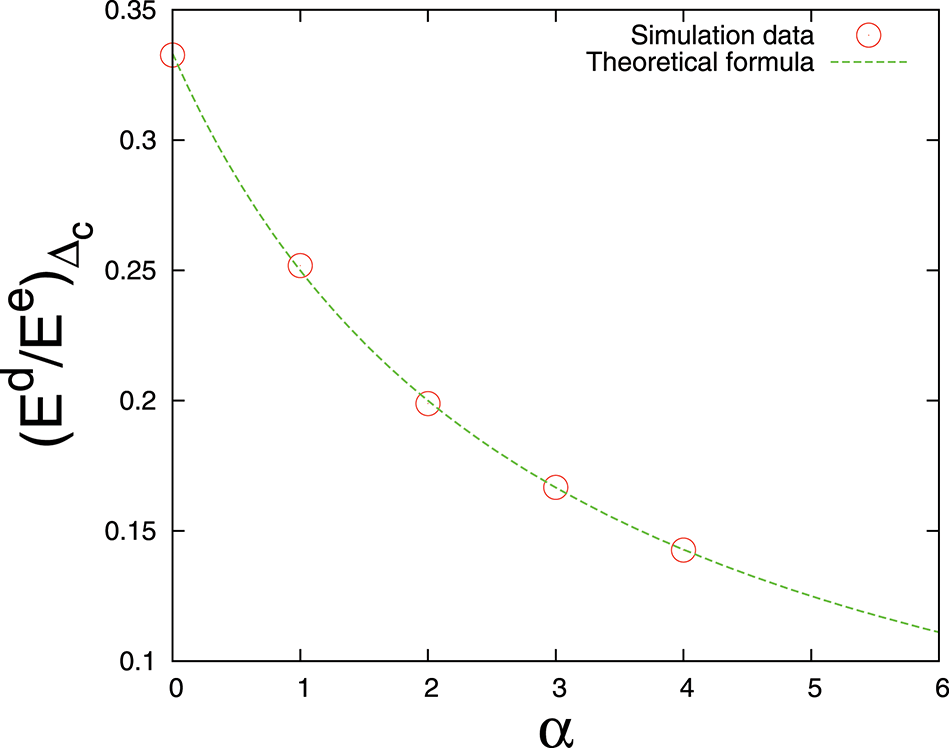
Ratio between damage energy and elastic energy at the failure point Δc vs. power law exponent α. Single bundle with N = 107 fibers. Dashed line is the theoretical estimate (Equation 21).
3.3. Energy Balance
It is easy to show that the work done on the system up to the failure point Δc is equal to the sum of the energies Ee and Ed. The total work done on the system can be calculated as:
Inserting the expression for F(Δ) into the integral we get, for a general power law type distribution,
which is the total of elastic energy and damage energy, W = Ee + Ed (see Equations 19, 20). In fact, the energy conservation here is analogous to the one in thermodynamics.
3.4. Energy Release During the Final Catastrophic Avalanche
It is known that when the extension exceeds the critical value Δc, the whole bundle collapses via a single avalanche called the final or catastrophic avalanche [14]. Can we calculate how much energy will be released in this final avalanche? It must be equal to the total damage energy of the fibers between threshold values Δc and the upper cutoff level of the fiber thresholds for the distribution in question.
We calculate the damage energy of the final avalanche for power-law type distributions as
It is important to find out whether the damage energy for the catastrophic avalanche has a universal relation with the elastic or damage energies at the failure point. As already mentioned, the bundle has stable (equilibrium) states up to Δ ≤ Δc. Therefore, if we correlate the final avalanche energy with Ee or Ed values at Δc, we can predict the catastrophic power of the final avalanche.
Comparing the expressions for , and we can write the following relation:
As , we can easily get the other relation:
We can get the last relation (Equation 26) by comparing expressions (Equations 24 and 19) directly. These theoretical estimates are compared with numerical simulation results in Figures 3, 4.
Figure 3
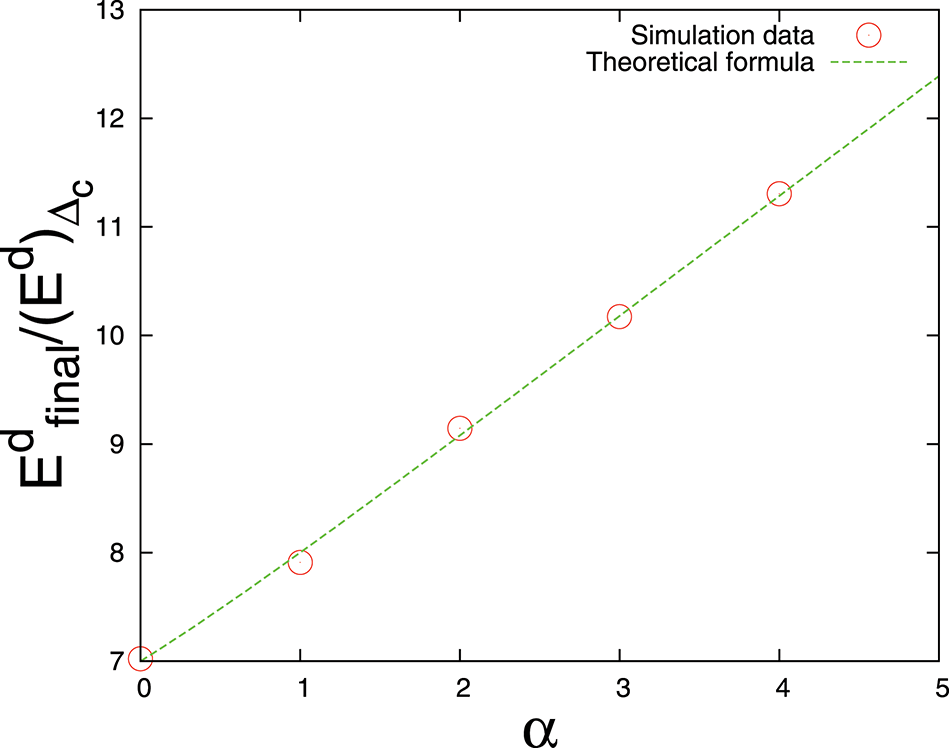
Ratio between damage energy of final catastrophic avalanche and damage energy at the failure point Δc vs. power law exponent α. Single bundle with N = 107 fibers. Solid line is the theoretical estimate (Equation 25).
Figure 4
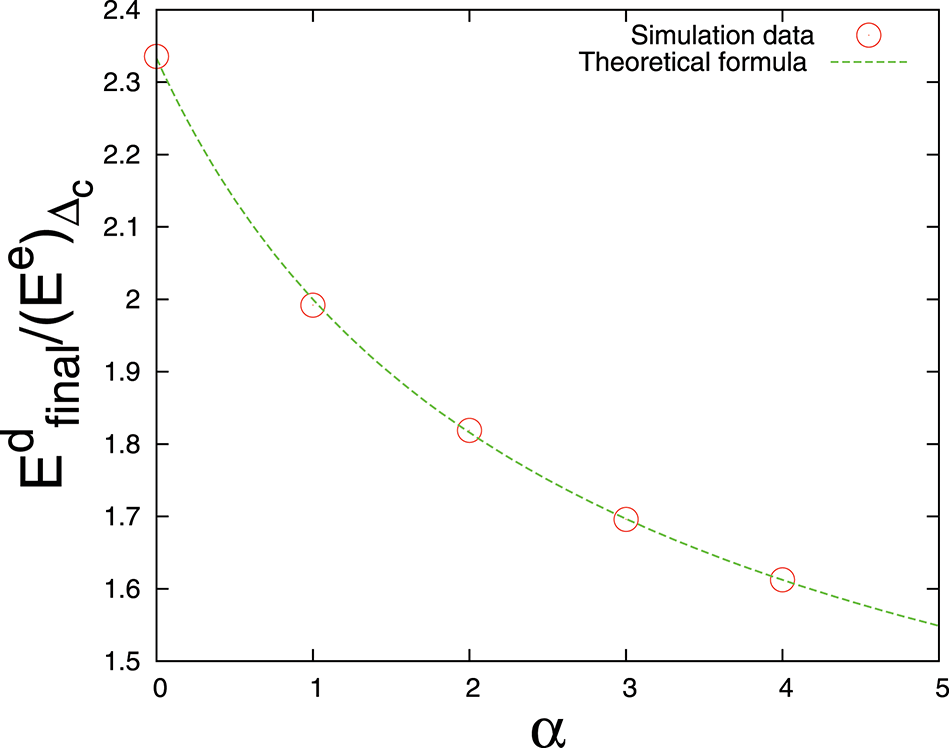
Ratio between damage energy of final catastrophic avalanche and elastic energy at the failure point Δc vs. power law exponent α. Single bundle with N = 107 fibers. The dashed line is the theoretical estimate (Equation 26).
Now, if we put α = 0, we get these energy relations for uniform fiber threshold distribution:
And
That means the energy release during final catastrophic avalanche is much bigger than the the elastic energy stored in the system just before failure (final stable state when Δ = Δc).
It is commonly believed that during catastrophic events like earthquakes, landslides, dam collapses etc., the accumulated elastic energy releases through avalanches [6, 7]. We observe a different scenario in this simple fiber bundle model where the system is doing work during the catastrophic failure phase as the external force is still acting on the bundle. As a result, the energy release (during catastrophic failure event) becomes much bigger than the elastic energy stored at the final stable phase.
4. Energy-Analysis for Weibull Distribution of Thresholds
We now consider the Weibull distribution, which has been used widely in material science [14]. The cumulative Weibull distribution has a form:
where k is the Weibull index. Therefore the probability density takes the form:
As the force has a maximum at the failure point Δc, inserting P(x) and p(x) values in expression (Equation 11) we get:
From the above equation we can easily calculate the critical extension value as:
The elastic energy at the critical extension Δc is:
and the damage energy is:
Putting,
we get:
This integral is exactly calculable for k = 1 and k = 2.
4.1. Weibull Distribution With k = 1
For Weibull index k = 1, Δc = 1 and the damage energy expression at the failure point takes the form:
Using integration by parts we arrive at the result:
We get the elastic energy at the failure point directly by putting k = 1 in Equation (33),
Therefore, the ratio between damage and elastic energies at the failure point for Weibull distribution with k = 1 is:
In Figure 5, we have shown numerical results of the variation of elastic and damage energies with strain for Weibull distribution (with k = 1). The theoretical estimates of the ratio between damage and elastic energies at the failure point are compared with numerical results in Figure 6.
Figure 5
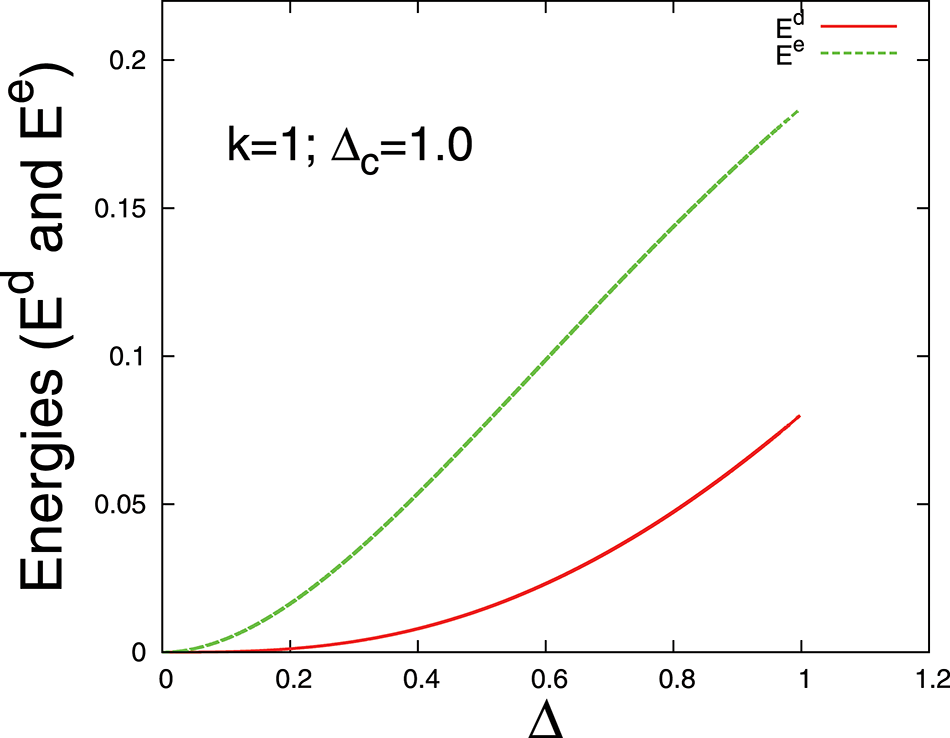
Damage energy and elastic energy vs. extension Δ (up to the failure point Δc) for Weibull distribution of thresholds with Weibull index k = 1. The simulation data (solid lines) are for a single bundle with N = 107 fibers.
Figure 6
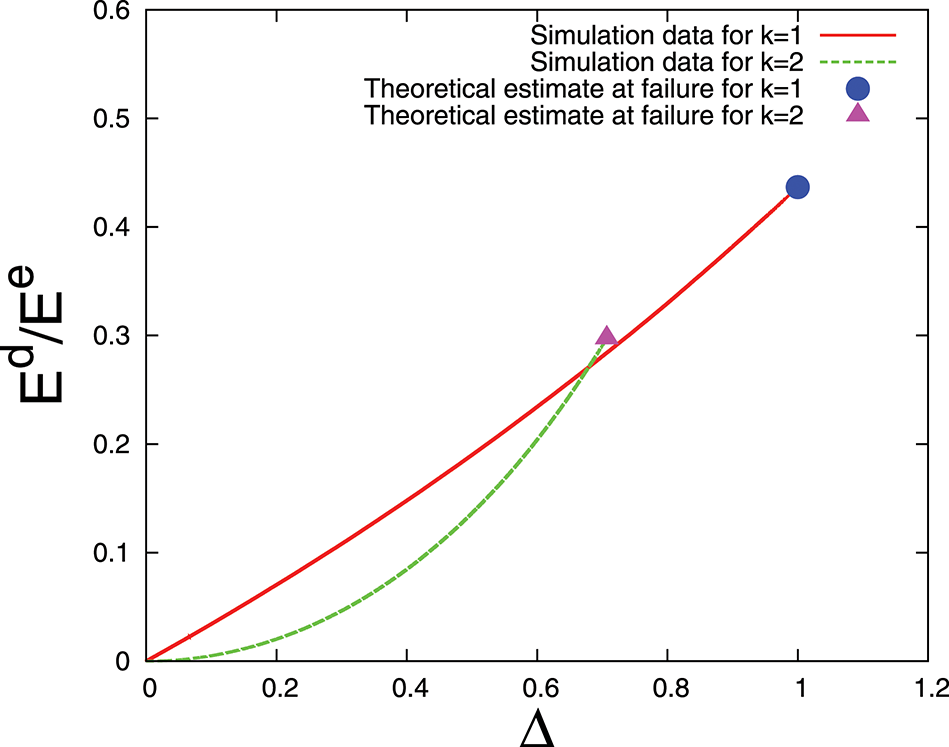
Ratio between damage energy and elastic energy vs. extension Δ (up to the failure point Δc) for a fiber bundle with Weibull distribution of thresholds. In simulation, we used a single bundle with N = 107 fibers. Circle and triangle are the theoretical estimates (Equations 40, 44) for the ratios at the failure point Δc.
4.2. Weibull Distribution With k = 2
For Weibull index k = 2, and the damage energy expression at the failure point is:
Again, using integration by parts we arrive at the result:
We get the elastic energy at the failure point directly by putting k = 2 in Equation (33):
Therefore, the ratio between damage and elastic energies at the failure point for Weibull distribution with k = 2 is:
The theoretical estimates of the ratio between damage and elastic energies at the failure point is compared with numerical results in Figure 6. In Appendix A, we give a general argument that elastic energy will be always bigger than damage energy at the critical (failure) point.
5. Elastic Energy Maximum
There are two distinct phases of the system: A stable phase for 0 < Δ ≤ Δc and an unstable phase for Δ > Δc. If we plot the elastic energy and damage energy vs. Δ, we see that damage energy always increases with Δ but elastic energy has a maximum at a particular value of Δ, let us call it Δm. Can we calculate the exact value of Δm for a given threshold distribution? Is it somehow connected to Δc? In this section we are going to answer these questions.
We recall the elastic energy expression (Equation 8). If we differentiate the elastic energy with respect to the extension Δ, we get:
Which is 0 at Δm, with:
If we consider a general power law type distribution p(x) = (1 + α)xα, within (0, 1), we can write:
For Weibull distribution P(x) = 1−exp(−xk), we can write:
Therefore we can conclude that Δm is bigger than Δc, i.e., elastic energy shows a maximum in the unstable phase (Figures 7, 8). A more general treatment for the relation between Δm and Δc is given in the Appendix B.
Figure 7
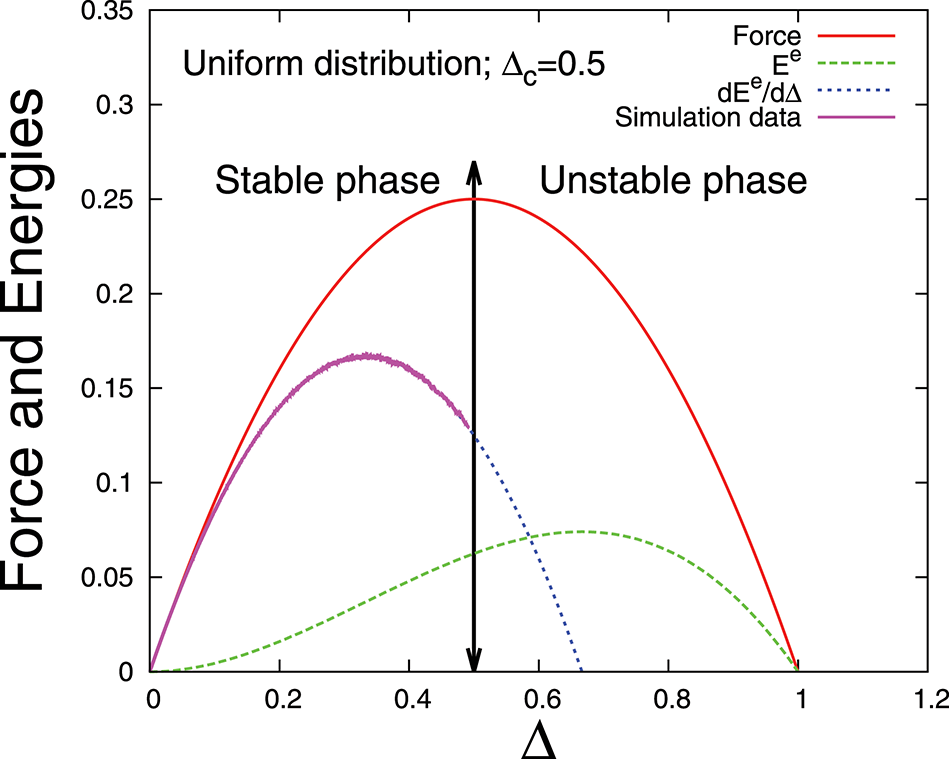
Force and elastic energies vs. extension Δ for fiber bundles with uniform distribution of thresholds: Comparison with simulation data for a single bundle with N = 107 fibers.
Figure 8
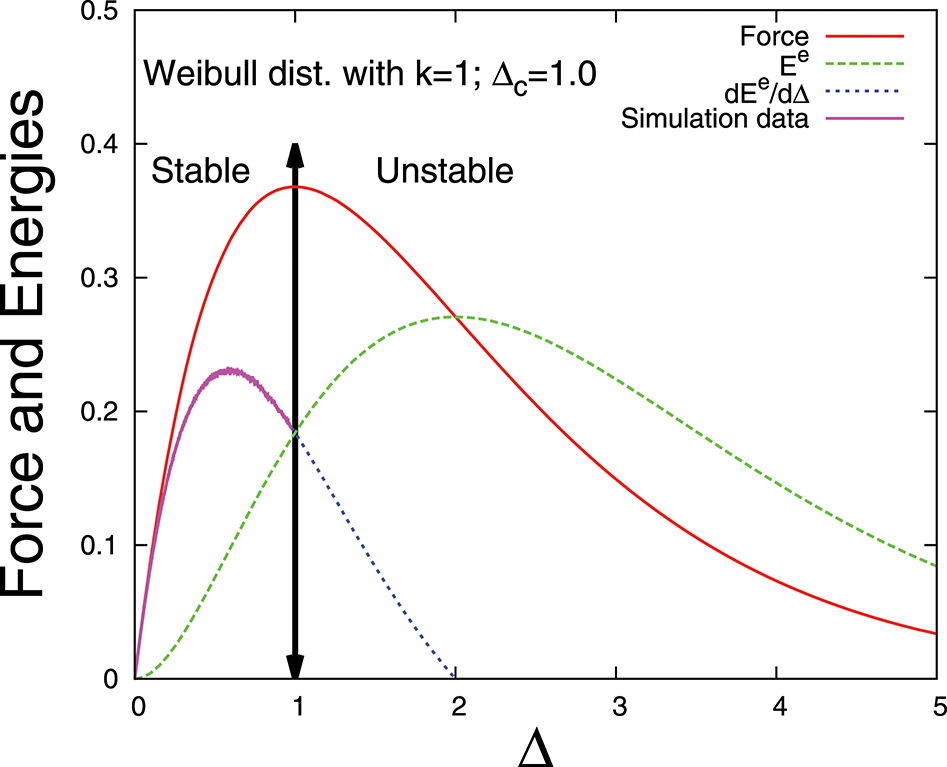
Force and elastic energies vs. extension Δ for fiber bundles with Weibull distribution of thresholds: Comparison with simulation data for a single bundle with N = 107 fibers.
6. Elastic Energy Inflection Point: The Warning Sign of Catastrophic Failure
Are there any prior indications of the catastrophic failure (complete failure) of a bundle under stress? In the fiber bundle model, although the elastic energy has a maximum, it appears after the critical extension value, i.e., in the unstable phase of the system. Therefore it can not help us to predict the catastrophic failure point of the system.
However, if we plot dEe/dΔ, the change of elastic energy with the change of extension value Δ, we see that dEe/dΔ has a maximum and, most importantly, this maximum appears before the critical extension value Δc (Figures 7, 8). In this section we calculate the particular value of Δ at which dEe/dΔ has a maximum. Let us call this Δ value Δmax. We will also see whether there is a relation between Δmax and Δc.
6.1. Theoretical Analysis
We recall the expression for the derivative of elastic energy with respect to strain of extension (Equation 45). Taking derivative of the equation, we get:
Setting d2Ee(Δ)/dΔ2 = 0 at Δ = Δmax we get for a general power law type distribution:
This expression confirms that Δmax < Δc for α ≥ 0. For a Weibull distribution with index k, we can write:
The solution (of d2Ee(Δ)/dΔ2 = 0) with (−) sign is the acceptable solution for the maximum. Hence,
since,
From Equations (50) and (52) we see that the relation between Δmax and Δc depends on the threshold distributions and we can express Δc in terms of Δmax with a prefactor as:
for power-law type distributions and
for Weibull distributions. Now can we find a reasonable approximation for the prefactor that is useful for more than one threshold distributions? An intuitive first choice is the result for the uniform distribution with α = 0 gives Δc = 1.5Δmax. This is a good approximation for α close to 0, as expected, but not for very large α values. This prediction is also exact for a Weibull distribution with k ≃ 2. If k is noticeably smaller, then the prediction 1.5Δmax is smaller than the true failure point Δc. In this case the estimate errs on the side of caution, and the bundle can withstand more than the estimate predicts. A better choice would be to set a prediction-window (1.2 to 1.5) for the prefactor G(α), H(k). Then it can cover a wide range of α and k values (see Figure 9). Overall, such a prediction-window for the failure point works well when the threshold distribution does not vary too much with Δ. If we have prior information about the threshold distribution in the system (i.e., range of k or α values), it is possible to narrow down the prediction window and this is consistent with the common philosophy—extra information helps to develop a better prediction scheme.
Figure 9
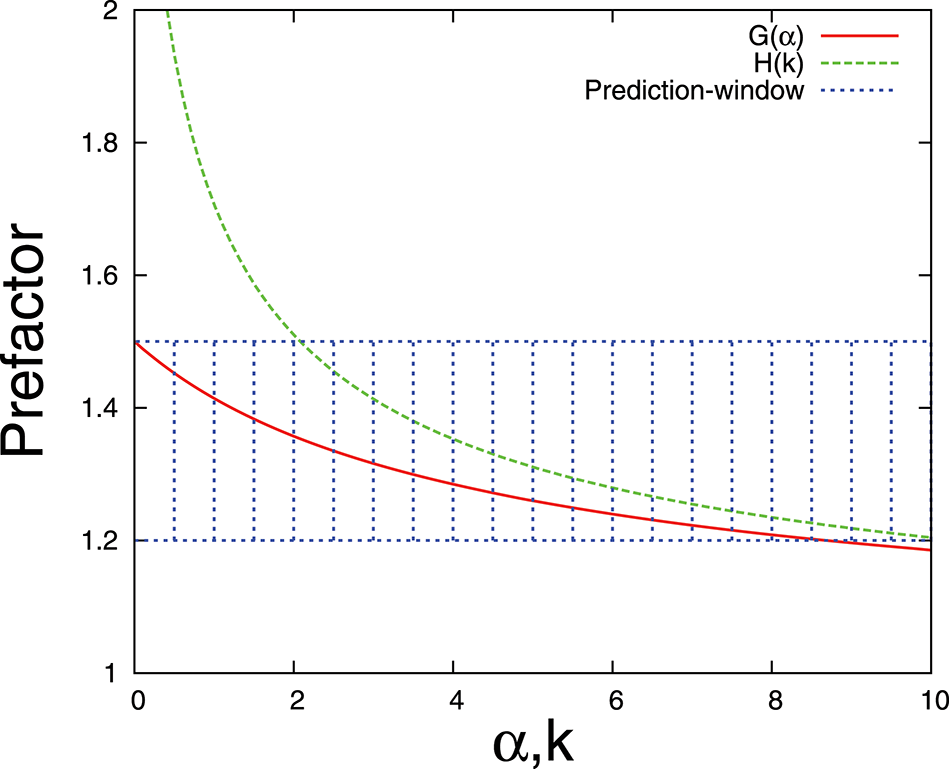
The prefactor (Equations 54, 55) vs. α, k values of the fiber threshold distributions and the suggested prediction-window.
A more general argument is given in Appendix C for the relation between Δmax and Δc.
6.2. Comparison With Simulation Data
In Figures 7, 8 we compare the simulation results with the theoretical estimates. The simulations are done for a single bundle with large number (N = 107) of fibers and the agreement is convincing. We have used Monte Carlo technique to generate uncorrelated fiber thresholds that follow a particular statistical distributions (uniform and Weibull distributions). It is obvious that in simulations we can measure energy values in the stable phase only.
6.3. Simulation Results for a Mixed Threshold Distribution
Now we choose a mixed fiber threshold distribution. Can we see similar signature (maximum of dEe/dΔ appears before Δc) as we have seen in previous section? The chosen distribution is a mixture of uniform distribution and Weibull distribution (k = 1) which is shown in Figure 10. We assign strength thresholds to N/2 fibers from a uniform distribution and to N/2 fibers from a Weibull distribution. The simulation result (Figure 11) reveals that dEe/dΔ has a maximum which appears before the failure point Δc and Δmax is somewhere in between the respective Δmax values for uniform and Weibull threshold distributions—as expected intuitively. If we express the Δc value in terms of Δmax, the prefactor is well inside the prediction-window, shown in Figure 9.
Figure 10
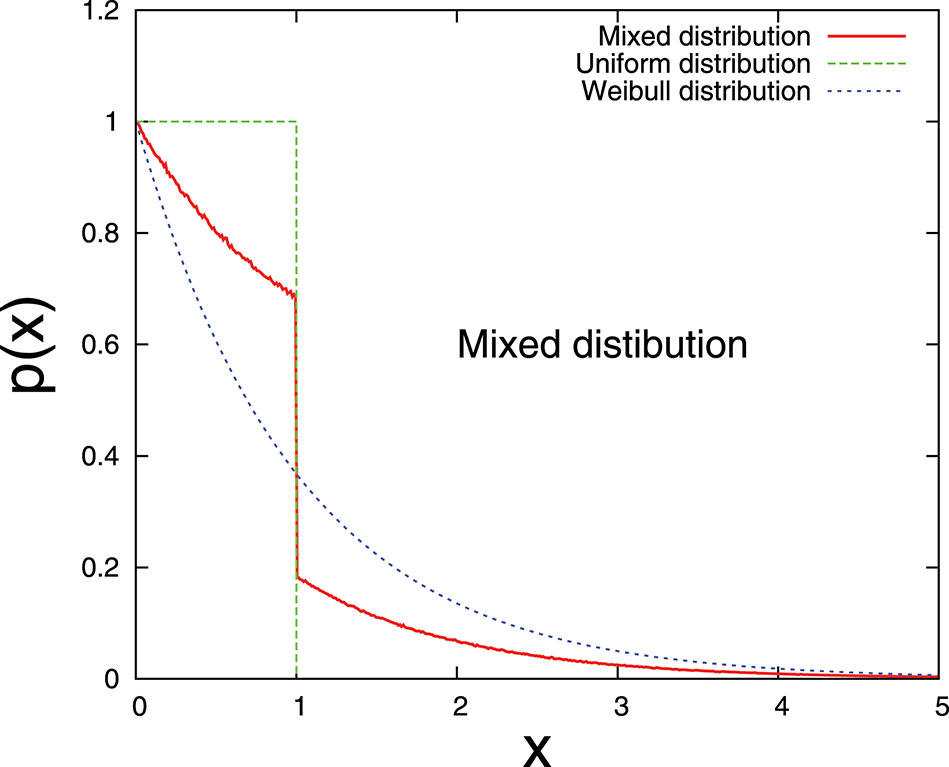
A mixture of uniform and Weibull (k = 1) distributions.
Figure 11
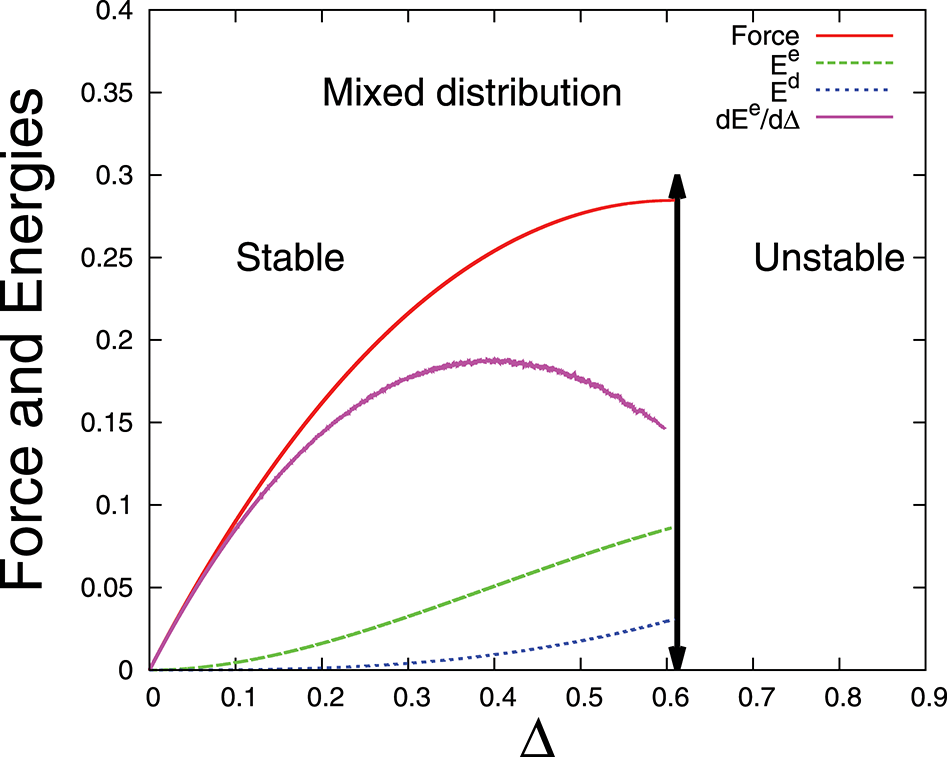
Force and elastic energies vs. extension Δ for a fiber bundle (107 fibers) with a mixed distribution of thresholds.
7. Discussions
The Fiber Bundle Model has been used as a standard model for studying stress-induced fracturing in composite materials. In the Equal-Load-Sharing version of the model, all intact fibers share the load equally. In this work we have chosen the ELS models and we have studied the energy budget of the model for the entire failure process, starting from intact bundle up to the catastrophic failure point where the bundle collapses completely. Following the standard definition of elastic and damage energies from continuous damage mechanics framework, we have calculated the energy relations at the failure points for different types of fiber threshold distributions (power law type and Weibull type). At the critical or catastrophic failure point, the elastic energy is always larger than the total damage energy. Another important observation is that the elastic energy variation has a distinct peak before the catastrophic failure point. Also, the energy-release during final catastrophic event is much bigger than the elastic energy stored in the system at the failure point (see section 3 and section 4). Our simulation results on a single bundle with large numbers (107) of fibers, show perfect agreement with the theoretical estimates. We have chosen a single bundle, keeping in mind that for prediction purposes it is important and necessary that the warning sign can be seen in a single sample.
These observations can form the basis of a prediction scheme by finding the correlation between the position (strain or stretch level) of elastic energy variation peak and the actual failure point. The main concern is to find a direct relation between the elastic energy inflection point (Δmax) and the failure point (Δc). We found that Δc and Δmax are related through a prefactor that depends on the exponent of the threshold distribution. Then we tried to find a window of the prefactor (Equations 54 and 55) that can cover a wide range of threshold distributions (Figure 9) so that we can express the failure point in terms of energy inflection point, i.e., Δc = prefactor · Δmax and the approximate prefactor window is 1.2 to 1.5 (Figure 9). Moreover, it is also possible to predict the size (energy release) of the final catastrophic event by measuring the stored elastic energy of the system at the failure point.
Our observations in this work have already opened up some scientific questions and challenges: what happens for Local-Load-Sharing (LLS) models [16]? Does the elastic energy variation show similar peaks before the catastrophic failure point? Can we measure and analyze the elastic energy during a rock-fracturing test in terms of the applied strain?
During rock-fracturing experiments [17–20], one can measure axial stress (force), axial and radial strain directly through strain gauges. Amount of damage can be recorded via acoustic emissions (AE) in terms of number of events (micro cracks) and the energy of the events. Clearly, total acoustic energy is the amount of damage energy in the system. It is possible to calculate the amount of work done on the system from applied force and effective strain value. Therefore, the difference between total work done and the damage energy (accumulated acoustic energy) will be the elastic energy of the system. Once we plot the elastic energy vs. strain curve, it is straight forward to estimate the elastic energy growth rate by measuring the slope of the curve at different strain points.
Our next article will resolve some of these issues –we are now working on energy budget of LLS models.
Statements
Data availability statement
The datasets generated in this study are available on request to the corresponding author.
Author contributions
SP: theory, simulation, data analysis, and plotting. JK: theory (Appendix part). AH: theory. Equal contributions in discussions and writing the article.
Acknowledgments
This work was partly supported by the Research Council of Norway through its Centers of Excellence funding scheme, project number 262644.
Conflict of interest
The authors declare that the research was conducted in the absence of any commercial or financial relationships that could be construed as a potential conflict of interest.
References
1.
Krajcinovic D . Damage mechanics. Amsterdam: Elsevier (1996).
2.
Henkel M Hinrichsen H Lubeck S Pleimling M . Non-equilibrium Phase Transitionsvol. 1. Berlin: Springer (2008).
3.
Bonamy D Bouchaud E . Failure of heterogeneous materials: a dynamic phase transition?Phys Rep. (2011) 498:1–44. 10.1016/j.physrep.2010.07.006
4.
Abaimov SG . Statistical Physics of Non-thermal Phase Transitions. Heidelberg: Springer Verlag (2015).
5.
Berthier E . Quasi-brittle failure of heterogeneous materials: damage statistics and localization (Thesis). Université Pierre et Marie Curie, Paris, France (2015).
6.
Chakrabarti BK Benguigui LG . Statistical Physics of Fracture and Breakdown in Disordered Solids. Oxford: Oxford University Press (1997).
7.
Biswas S Ray P Chakrabarti BK . Statistical Physics of Fracture, Breakdown, and Earthquake. Berlin: Wiley-VCH (2015).
8.
Villa P Mahieu E . Breakage patterns of human long bones. J Hum Evol. (1991) 21:27–48.
9.
Etzion D . Moderating effect of social support on the stress-burnout relationship. J App Psych. (1984) 69:615–22.
10.
Ramirez AJ Graham J Richards MA Cull A Gregory WM . Mental health of hospital consultants: the effect of stress and satisfaction at work. Lancet (1996) 347:724–28.
11.
Peirce FT . Tensile tests for cottom yarns. “The weakest link" theorems on the strength of long and composite specimens. J Text Ind. (1926) 17:355.
12.
Daniels HE . The statistical theory of the strength of bundles of threads. Proc Roy Soc Ser A. (1945) 183:243.
13.
Pradhan S Hansen A Chakrabarti BK . Failure processes in elastic fiber bundles. Rev Mod Phys. (2010) 82:499. 10.1103/RevModPhys.82.499
14.
Hansen A Hemmer PC Pradhan S . The fiber bundle model: Modeling Failure in Materials. Berlin: Wiley-VCH (2015).
15.
Pradhan S Hansen A Ray P . A renormalization group procedure for fiber bundle models. Front Phys. (2018) 6:65. 10.3389/fphy.2018.00065
16.
Harlow DG Phoenix SL . Approximations for the strength distribution and size effects in an idealized lattice model of material breakdown. J Mech Phys Sol. (1991) 39:173–200.
17.
Pradhan S Stroisz A Fjar E Stenebraten J Lund H Sonstebo E . Stress-induced fracturing of reservoir rocks: acoustic monitoring and mCT image analysis. Rock Mech Rock Eng. (2015) 48:2529–40. 10.1007/s00603-015-0853-4
18.
Baud P Meredith PG . Damage accumulation during triaxial creep of darley dale sandstone from pore volumetry and acoustic emission. Int J Rock Mech Min Sci. (1997) 34:3–4.
19.
Holcomb DJ Stone CM Costin LS . Combining Acoustic Emission Locations and Microcrack Damage Model to Study Development of Damage in Brittle Materials. Rotterdam: Rock Mechanics Contributions and Challaenges, Hustrulid and Johnson (1990).
20.
Amitrano D . Rupture by damage accumulation in rocks. Int J Fract. (2006) 139:369–81. 10.1007/s10704-006-0053-z
Appendix
As stated in section 2, the elastic energy in the system at extension Δ is:
where P(Δ) is the cumulative probability distribution of the fiber thresholds. The force per fiber σ = F/N required to continue the breaking process at a given extension Δ is:
The critical extension Δc where the bundle collapses is hence given by:
A. Elastic vs. Damage Energy at the Critical Point
Numerical data seems to suggest that Ee > Ed at the critical point for most threshold distributions. Let us try to prove this analytically by investigating the difference between elastic and damage energy:
The derivative of this energy difference is:
We can now express the energy difference in terms of the forces acting on the fiber bundle. We integrate this expression to find:
by partial integration. In particular, this gives the result:
at the critical point. Since σc = max σ(Δ), we see that Ediff(Δc) > 0 for all threshold distributions. The only exception possible is a threshold distribution with a constant force σ(Δ) = σc. But this results in a lower cut-off Δ0 = Δc > 0 (for the threshold distribution to be normalizable), and then .
B. Elastic Energy Maximum Point
First, rewrite (Equation 3) as:
This definition of g(Δ) will be useful in the following derivations. The maximum of the elastic energy is found at an extension Δm, which is given by:
i.e.,
Comparing this expression to Equation (8) allows us to find a relation between Δc and Δm. We investigate the function g(Δ):
It is clear from Equation (12) that for a threshold distribution with only a single maximum in the load curve, g(Δm) = 1/2 must occur in the unstable phase, i.e., Δm > Δc.
C. Elastic Energy Inflection Point
The elastic energy maximum occurs after the critical point and is hence unsuitable as a predictor for failure. But what about the maximum of the derivative of the elastic energy, the inflection point Δmax? As stated in the section 6:
Setting this second derivative to zero and rearranging terms gives the equation:
To investigate the relation between Δmax and Δc, we combine this with the relations dσ/dΔ = 1 − P(Δ) − Δp(Δ) and d2σ/dΔ2 = − 2p(Δ)−Δp′(Δ) evaluated at Δmax to get:
Let's once again assume that we are working with a threshold distribution that has only a single maximum in its load curve. Then dσ/dΔ > 0 corresponds to the stable phase and dσ/dΔ <0 corresponds to the unstable phase. We see that any threshold distribution with d2σ/dΔ2 < − 2/Δ · dσ/dΔ everywhere in the unstable phase must have Δmax in the stable phase, i.e., Δmax < Δc.
This is a general (but weak) condition that is sufficient, but not necessary, for Δmax < Δc.
Summary
Keywords
material failure, fiber bundle model, elastic energy, damage energy, catastrophic failure, reliable signal
Citation
Pradhan S, Kjellstadli JT and Hansen A (2019) Variation of Elastic Energy Shows Reliable Signal of Upcoming Catastrophic Failure. Front. Phys. 7:106. doi: 10.3389/fphy.2019.00106
Received
09 March 2019
Accepted
08 July 2019
Published
24 July 2019
Volume
7 - 2019
Edited by
Ferenc Kun, University of Debrecen, Hungary
Reviewed by
Mikko Alava, Aalto University, Finland; Bikas K. Chakrabarti, Saha Institute of Nuclear Physics (SINP), India; Takahiro Hatano, The University of Tokyo, Japan
Updates
Copyright
© 2019 Pradhan, Kjellstadli and Hansen.
This is an open-access article distributed under the terms of the Creative Commons Attribution License (CC BY). The use, distribution or reproduction in other forums is permitted, provided the original author(s) and the copyright owner(s) are credited and that the original publication in this journal is cited, in accordance with accepted academic practice. No use, distribution or reproduction is permitted which does not comply with these terms.
*Correspondence: Srutarshi Pradhan srutarshi.pradhan@ntnu.no
This article was submitted to Interdisciplinary Physics, a section of the journal Frontiers in Physics
Disclaimer
All claims expressed in this article are solely those of the authors and do not necessarily represent those of their affiliated organizations, or those of the publisher, the editors and the reviewers. Any product that may be evaluated in this article or claim that may be made by its manufacturer is not guaranteed or endorsed by the publisher.