 Owen Wyn Roberts
 Yasuhito Narita
 Rumi Nakamura1
 Zoltán Vörös
- 1Space Research Institute, Austrian Academy of Sciences, Graz, Austria
- 2NASA Goddard Space Flight Center, Greenbelt, MD, United States
Turbulence in the Earth's magnetosheath at ion kinetic scales is investigated with the Magnetospheric MultiScale (MMS) spacecraft. The multi-point measurements allow the three dimensional power spectra in wave-vector space to be determined. Previously the three dimensional structure of fluctuations in the magnetic field and density (using spacecraft potential as a proxy) were possible with Cluster. However, using the excellent time resolution data set provided from both the Fluxgate Magnetometer (FGM) and the Fast Plasma Investigation (FPI) on MMS the spectra can be determined for a number of different parameters such as ion velocity, and ion temperatures parallel and perpendicular to the mean magnetic field directions. The spectra for different fluctuations show similar features to one another such as a strong power anisotropy with respect to the mean magnetic field direction, such that the energy decays faster in the direction parallel to the mean magnetic field than the perpendicular direction. A weak non-gyrotropy is also seen in the direction of the bulk velocity similar to what has been seen in magnetic field fluctuations with Cluster at ion kinetic scales in the solar wind. Velocity fluctuations are shown to be the most anisotropic. The density and temperature fluctuations exhibit similar anisotropies but are much weaker in comparison.
1. Introduction
Turbulence is a phenomenon characterized by disordered fluctuations in several of the fluid's parameters over a large range of time and length scales. For a neutral fluid this might include density, velocity, and temperature, however in a space plasma there are also fluctuations in electromagnetic fields due to a very high conductivity [1, 2]. Typically most of the research on the topic of in situ plasma turbulence have been performed using magnetic field data as the data are often operationally simpler to obtain with high time resolution. To obtain a more complete understanding of the turbulent fluctuations, measurements are required for parameters other than the electromagnetic fields. While density can be obtained from spacecraft potential (e.g., [3–5]), other plasma measurements such as velocity and temperature require a direct plasma measurement. Typically plasma instruments are mounted looking in one direction on a spinning spacecraft and use the spin to obtain data azimuthally. Thus, the time resolution is limited to the spacecraft spin, which is typically not fast enough to resolve ion kinetic scales.
In a plasma the presence of a magnetic field gives rise to a variety of different anisotropies [6–8], such as in the power P⊥ ≫ P∥ [9–12], wave-vectors k⊥ ≫ k∥ [5, 13–15], spectral indices α⊥ > α∥ [9, 16–18] here parallel and perpendicular refer to the direction with respect to the mean magnetic field direction. In the solar wind, expansion effects also exist which can result in a second preferred direction [19, 20], this can result in a non-gyrotropic power distributions with different powers in different perpendicular directions which have been observed experimentally [13, 17, 20–23].
The majority of plasma turbulence studies have employed single spacecraft measurements, where spatial information is obtained by assuming Taylor's hypothesis [24], where the turbulent fluctuation is a assumed to vary slowly with respect to the measurement time. By analyzing intervals with different orientations of the magnetic field with respect to the bulk flow direction, the three dimensional structure is inferred. Using this approach single spacecraft observations have revealed correlations between solar wind measurements in the directions perpendicular to the magnetic field are longer than in the parallel direction [25] giving a “Maltese Cross” pattern showing the dominance of perpendicular wave-vectors. Furthermore, when the data are classified as fast (typically above 500 km/s) the opposite is true [26] with parallel wave-vectors dominating. This same pattern has been observed in variables other than magnetic field by Smith et al. [27], where velocity, temperature, and density show similar correlations as the magnetic field. Recently Wang et al. [28], used the self correlation technique and revealed with intervals to reveal similar anisotropies to Dasso et al. [26] for intervals of length 1–2 days, but become more isotropic as the intervals become smaller i.e., when looking at smaller scales in the inertial range.
The power of magnetic fluctuations in the solar wind at large inertial scales [where a magnetohydrodynamic (MHD) description is valid] have been found to be generally smaller along the magnetic field direction with respect to the perpendicular direction and the spectrum in this direction is steeper with a spectral index of −2 [9, 29] compared with an index of −5/3 in the perpendicular direction. Structure function analysis has also been performed on magnetic field data revealing anisotropic power that also evolves toward smaller scales [22], and that fluctuations in the magnitude of the magnetic field (a proxy for the compressible fluctuations) are more anisotropic than the trace fluctuations in the fast solar wind.
At smaller scales often plasma data are usually not available as the instruments lack the necessary time resolution. This limitation allows the study of plasma fluctuations only in the low frequency inertial range where a fluid description is still valid. At higher spacecraft frame frequencies (denoted by subscript sc) above around fsc ≳ 1 Hz the fluctuations become comparable to proton gyration frequencies. Above these frequencies the protons cannot follow the magnetic field any longer and become demagnetized, while electrons remain magnetized and can still follow the magnetic field due to their smaller gyroradius. This region is often marked by a break in the power spectral density and a steepening of the spectrum [5, 30–35]. The location of the break has been measured to be fairly independent of plasma β [33, 34] and varies with heliocentirc distance [32]. Both of these observations can be explained by the break corresponding to the scale of the ion cyclotron resonance. Additionally the location of the break has been observed by single spacecraft observations to be independent of the angle between the magnetic field and the bulk velocity [35]. This was interpreted by Duan et al. [35] due to the ion diffusion region (where ions decopule from electrons) being approximately isotropic in wave-vector space. The scales smaller than the spectral break is often termed the dissipation/dispersion range, or the ion kinetic range, and a fluid description is no longer valid.
In some conditions Taylor's hypothesis may break down, should turbulent fluctuations become very dispersive, when bulk speeds are low, or different modes appear at once in the plasma [36–38]. The magnetosheath is an especially interesting plasma as it typically has a higher magnetic field strength, a lower bulk velocity, and has a much larger compressibility than the solar wind. The lower speed and larger fluctuation amplitudes make the breakdown of Taylor's hypothesis in this region more likely when juxtaposed with the super Alfvénic solar wind. To overcome the limitations imposed by Taylor's hypothesis two other approaches to understand the structure of turbulence are possible which are through either multi-point measurements, or from direct numerical simulation.
Different numerical simulation schemes have been used to investigate the structure of turbulence, however recently an expanding box MHD approach can also include expansion effects present in the solar wind allowing the large scale three dimensional structure to be simulated [19, 39]. The other approach is to use multi-point measurements, which are possible with Cluster and MMS. These techniques rely on differences or correlations between spacecraft pairs e.g., multi spacecraft structure functions/cross correlations [40–42] where gyrotropy is assumed. These techniques have also revealed anisotropic power and spectral indices parallel and perpendicular to the mean field direction. Another approach is to use multi-point signal resonator technique [13] which assumes a plane wave geometry of the fluctuations and make use of the phase delay between measurement points [5, 13, 43] but does not make an assumption of gyrotropy. However, these studies performed with Cluster have mostly been performed using magnetic field data, or spacecraft potential [5, 18]. This study will expand on the previous work done by Cluster in the inertial and kinetic ranges, and use the Magnetospheric MultiScale mission [44] and its exceptionally high time resolution plasma data from the Fast Plasma Investigation [45] (FPI) instrument to characterize the structure of turbulent fluctuations in the transition from fluid to kinetic scales in the Earth's magnetosheath.
2. Data/Methodology
We use data from the MMS spacecraft [44] during an interval of burst mode which occurred on the 7th of September 2015 13:59:50.000-14:04:57.200UT early in the mission where the spacecraft have separations of the order of 140 km before the spacecraft achieved their close separations for their primary goal of studying magnetic reconnection. This is ideal for investigating the scales near proton gyration/inertial scales. The spacecraft were in the dusk side flank of the magnetosheath downstream of the quasi-perpendicular shock. A summary of the interval is shown in Figure 1 which shows the magnetic field, ion velocity, ion density and ion and electron temperatures and mean parameters of the interval are given in Table 1.
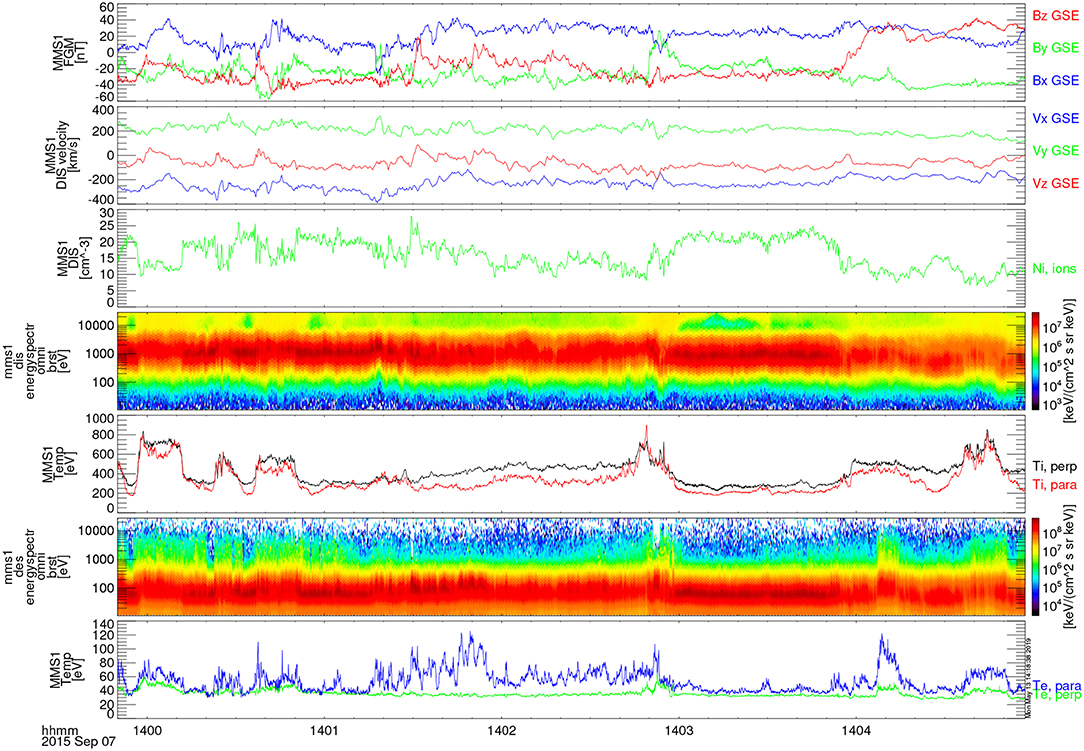
Figure 1. Measured magnetic and plasma parameters from MMS, showing the magnetic field from the fluxgate magnetometer, the ion velocity from FPI DIS, the ion density the ion energy spectrogram, the ion parallel and perpendicular temperatures, the electron spectrogram and the electron parallel and perpendicular temperatures.
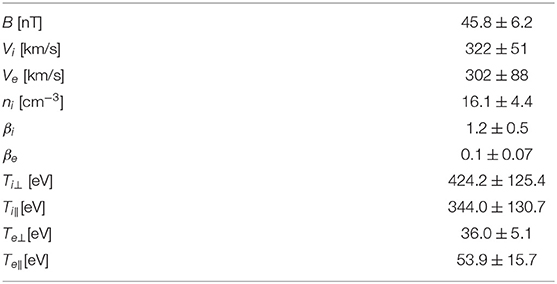
Table 1. Showing the mean and standard deviation of several plasma parameters during the interval.
The multi-point signal resonator technique [13] (MSR) will be used to analyze the different measurements given in Figure 1. Whereas, previously this technique (or it's predecessor k-filtering/wave telescope) has been applied to electromagnetic [46], magnetic fields [14], and to density derived from spacecraft potential [5]. In this study we will investigate magnetic, velocity, temperature, and density fluctuations. For direct comparisons to the plasma data the magnetic field data will be resampled to the ion measurement time tags. The MSR technique relies on weak time stationarity, and spatial homogeneity of the signal. The signal seems fairly homogeneous in terms of the mean value throughout the interval, however after 14:03:30 the fluctuations seem a little less Alfveńic. This however makes up only a minority of the overall signal and is unlikely to have a large effect on the results based on testing with slightly different intervals than shown here. It should also be noted that a fine balance needs to be struck between the need sufficient data points for ensemble averaging and the weak stationarity of the signal. Especially when intervals such as this one where the MMS separations are large enough to study the ion kinetic range are extremely rare. As an additional test we applied the same analysis to the full resolution magnetic field (where more data points are available than the ion data) of the shorter interval up to 14:03:30 and the method yielded similar results for the magnetic field. Thus, we can be confident that the analysis is justified for this interval.
The MSR technique also supposes that the signal can be described mathematically as a superposition of plane waves with random phases in the spirit of Fourier analysis, and a small component of incoherent noise. Essentially the technique uses the time series sampled at each spacecraft and the signal can be filtered for a frequency ωsc using a Fourier transform, and for wave-vector k using the multiple measurement points. Thus, only power related to a plane wave with frequency ωsc and wave-vector k is transmitted through the filter, thus by investigating a number of wave-vectors a distribution of power in wave-vector space can be estimated at a given frequency P(ωsc, k). It is important to note that this does not require that the different plane waves that the signal can be decomposed into correspond to any particular linear wave solutions of the Vlasov equation.
In the case of using magnetic or velocity data, three components at each spacecraft can be used as an input giving a total of 12 time series, however for magnetic field data the filter can be further refined by enforcing the solution to conform to the divergence free condition for magnetic field which is termed a constraining matrix [47]. The application of the method to density is detailed in Roberts et al. [5], where there are only four time series input and similarly to the velocity case no constraining condition can be imposed. The unique capabilities of MMS allow it to be used on velocity, temperature fluctuations as well as a direct measurement of the density. In this study we will use the DC magnetic field from the fluxgate magnetometers (FGM) [48] which have a sampling rate of 128 Hz in burst mode and the ion plasma measurements from the Fast Plasma Investigation's Dual Ion Spectrometers [45] (FPI-DIS) which has a rate of 6.6Hz. As previously mentioned the magnetic field data is resampled to the ion time tags.
The method is subject to some limitations; the smallest scale that can be investigated is limited by the mean inter-spacecraft distance kmax = π/〈d〉 which is the primary driver for the choice of interval. The value kmax defines a cube in wave-vector space that extends from −kmax to +kmax, such that the length of one of the sides of the cube is 2π/〈d〉. The kmax length scale is related to a timescale for an advected structure giving an upper frequency bound of fmax = Vi/2〈d〉. Where we take the bulk speed to be the ion bulk speed. Conversely the large scale limit is set to kmax/25 when the error of determining a wave-vector becomes larger than 10% for a simulated plane wave [5, 49]. The technique also assumes weak stationarity and that the fluctuations can be described as a superposition of plane waves and incoherent noise. The method has been tested for a signal made of intermittent bursts of activity [50], where it is shown that coherence in the signal does not affect the ability to resolve incoherent features. Furthermore, spatially repeating coherent structures (with a Poisson distributed size and spacing) can be recovered, and resemble wave-packets that have a random phase. Additionally a test was performed using both the MSR method and multi-spacecraft timing, which are based on different assumptions yielded similar results for an interval where several different intermittent coherent structures were identified [51].
In this work we will analyze the results from the MSR method in two different ways; Firstly P(k) will be obtained by integrating P(ωsc, k) with respect to the plasma frame frequency to investigate the anisotropies in the power distribution. This integration is performed between the limits fmin = 0.06, fmax = 1 Hz which come from the spacecraft mean separation ~140 km and the bulk flow speed. This will give a measurement in the power in wave-vector space, where we will for each measurement quantify the possible anisotropies and agyrotropies present. Secondly, we will also reduce the three dimensional spectra to spectra along one direction to investigate how the spectral index in the dissipation/dispersion range varies with the angle from the magnetic field.
3. Results
3.1. One Dimensional Spectra
We begin this section by investigating the typical one dimensional analysis usually performed by investigating the Fourier spectra of the various different plasma parameters. Different Fourier spectra are shown in Figure 2, for magnetic field, ion velocity density and parallel and perpendicular ion thermal speeds. The frequencies corresponding to the proton gyroradius and inertial lengths fρi = Vi/2π ρi = 0.80 Hz, fdi = Vi/2π di = 0.87 Hz are indicated in orange assuming a mean bulk flow indicated in Table 1. The velocity and magnetic spectra are fitted with two power laws, the density and perpendicular thermal speed spectra are fitted with three power laws while the parallel thermal speed is fitted with one power law. The error on the spectral indices is obtained from the residuals of linear least squares fitting for log power against log wave-number. The break frequency is found by fitting the two power laws from opposite sides of the spectral break and then finding the intersection of the two lines. This procedure is done twice for the density/perpendicular thermal speed spectra as there are two break locations. Figures 2A,B show the spectra of the magnetic field (in Alfvén units) resampled to the ion velocity time tags and the ion velocity respectively. At large scales a spectral index close to –5/3 is obtained for the magnetic field with the velocity spectra being noticeably shallower, closer to –3/2 as is often observed in the solar wind and in the magnetosheath [52–54]. The inertial range is not always seen in the magnetosheath especially in the outer magnetosheath as the interaction of the solar wind with the Earth's bow shock destroys the correlations in the inertial range and results in a 1/f spectrum which transitions straight to the ion kinetic range without having time for an inertial range to develop.
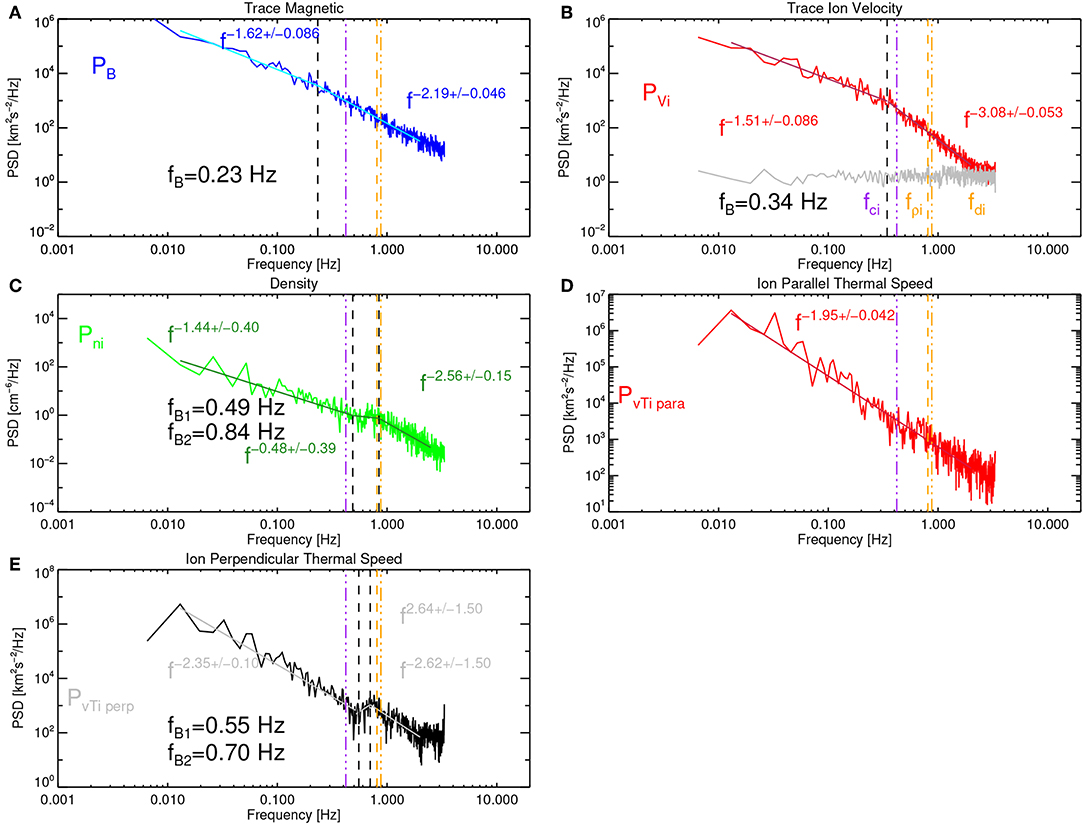
Figure 2. Power spectral densities of measured quantities. (A) shows the trace magnetic field (B) shows the trace ion velocity (red) and the estimated noise floor in gray (C) shows the density (D,E) show the parallel and perpendicular temperatures.
In this case the observations are taken in the inner magnetosheath such that a well-developed inertial range is seen and is followed by a break and then a steepening with the ion velocity being steeper than the magnetic field [55, 56]. The magnetic field fluctuations dominate the velocity fluctuations in this case which may be due to the development of 2D structures such as the Alfvén vortex at inertial scales [51, 57–60] or current sheet or flux rope like structures [61–63].
At a spacecraft frame frequency near ~0.2−0.4 Hz there is a spectral break which is far from both the Taylor shifted inertial and Larmor scales. In the solar wind for extreme values of β the break location (e.g., [64]) has been shown to agree better with the larger of the two scales, although for typical values of β in the solar wind there is not much effect [34]. Alternatively the break in the solar wind shows good agreement for a variety of heliocentric distances with the scale expected for cyclotron resonance [65] fc = Vi/2π(ρi + di) = fρifdi/(fρifdi) = 0.42 Hz which we denote in Figure 2 as a purple vertical line. For the case presented it seems that the measured break point is more closely related to that expected for cyclotron resonance. Interestingly, for the density spectrum the first break agrees well with the fc and the second break agrees well with the other break scales. A small bump is seen in this range for the perpendicular thermal speed, while no clear break can be found in the parallel thermal speed and only a single power law is fitted. The bump in the perpendicular thermal speed spectra could be due to cyclotron resonance (e.g., [33, 66, 67]) which could act at this range of scales and the wave particle interaction would be expected to heat protons in the perpendicular direction. However, no signature is seen in the trace magnetic spectra but a flattening is seen in the density spectra, which could suggest that a small scale compressible process is active. The time series in Figure 1 show that there is an anti-correlation between density and temperature suggesting that the compressible fluctuations exhibit pressure balance. One possibility is that slow waves could be responsible (e.g., [68, 69]). Compressible slow waves are heavily damped in a plasma such as the magnetosheath due to the very high ion to electron temperature ratio. However, they are damped proportionally to k∥ thus could exist as pressure balanced structures k∥ = 0 or highly oblique kinetic slow waves k⊥ ≫ k∥. There is some evidence from numerical simulations of the magnetosheath behind the quasi parallel shock that suggests that slow waves can exist in these conditions [69].
At kinetic scales the dominance of the magnetic spectra could be due to kinetic Alfvén wave like fluctuations [56, 70], rather than kinetic slow waves. This suggests that should slow waves be responsible for the bump in the perpendicular temperature and the density they are not dominant at smaller scales. The gray trace show the estimation of the FPI velocity noise floor [55], showing that noise becomes significant near fsc = 1.5 Hz in the ion data.
Figure 2C shows spectra of the ion density, contrary to the magnetic field and velocity spectra a single clear break is not identified. Rather there exists a transition region which begins near the expectation for cyclotron resonance where the spectra flatten before it steepens near the inertial/Larmor scales. The transition in the density scale has been often observed in the solar wind and has been modeled as being due to the presence of compressible slow waves at large scales and kinetic Alfvén waves at small scales [71, 72]. The location where these two phenomena exist is dependant on the plasma beta with a smaller beta giving a larger transition region. However, it is not clear whether this is applicable for the magnetosheath, as other phenomena such as mirror modes are much more common in the magnetosheath and contribute significantly to the compressible power at inertial scales.
The nature of the thermal speed spectra of plasma turbulence is the subject of recent debate [73]. With high time resolution measurements of the solar wind only available from the Faraday Cup on Spektr-R. These spectra showed similarities to the spectra of the velocity fluctuations [74, 75] although it is argued by Gogoberidze et al. [73] that effects due to anisotropic temperatures and the measurement from the Faraday cup are misleading. In their work they argue that the proton thermal velocity should have a shape more similar to the compressible fluctuations, or the trace magnetic fluctuations. The thermal speed spectra are shown in Figures 2D,E. The perpendicular thermal speed spectra somewhat resembles the compressible fluctuations and in the same region as a flattening is seen in the density spectrum a small bump is seen at the same range.
While we have presented the Fourier power spectra of several different parameters here the key limitation is that these are along a single path of the spacecraft through the plasma (Taylor's hypothesis). But power distributions and spectral indices are anisotropic and it is possible that spectra of different parameters could resemble the spectra taken along a certain direction. We will now use the multi-spacecraft capabilities of MMS to explore the different spectra in three dimensions.
3.2. Three Dimensional Spectra
In this section we move on to multi-spacecraft analysis of the fluctuations using the MSR technique. Turbulence spectra show the power is concentrated at low frequencies (and wave-numbers). However to get a full distribution of the power in wave-vector space it is insufficient to only consider the low frequency Fourier modes as their power corresponds to power at small wavenumbers. Therefore, an integration is needed in frequency to contribute the powers at higher wave-numbers. Thus, after obtaining a four dimensional power P(ωsc, k) at each spacecraft frequency we integrate between spacecraft frame frequencies of 0.06-1Hz to obtain the power distribution in wave-vector space P(k). One of the advantages of this technique is that Taylor's hypothesis is not invoked, so there are no concerns about the validity of Taylor's hypothesis when integrating higher frequencies. Figure 3 shows the three dimensional power distributions obtained through the application of the MSR technique to various different measured parameters. These distributions have been integrated over the third direction to give a two dimensional representation of the vector quantities, the magnetic field (a), the velocity (b). Meanwhile Figure 4 shows the scalar quantities density (a) and parallel and perpendicular ion temperatures (b,c). The co-ordinate system is the mean field aligned system with the e∥ = B0/|B0|, e⊥1 = e∥ × Vi/|Vi|, and e⊥2 = e∥ × e⊥1 such that the bulk flow is primarily in the −e⊥,2 direction.
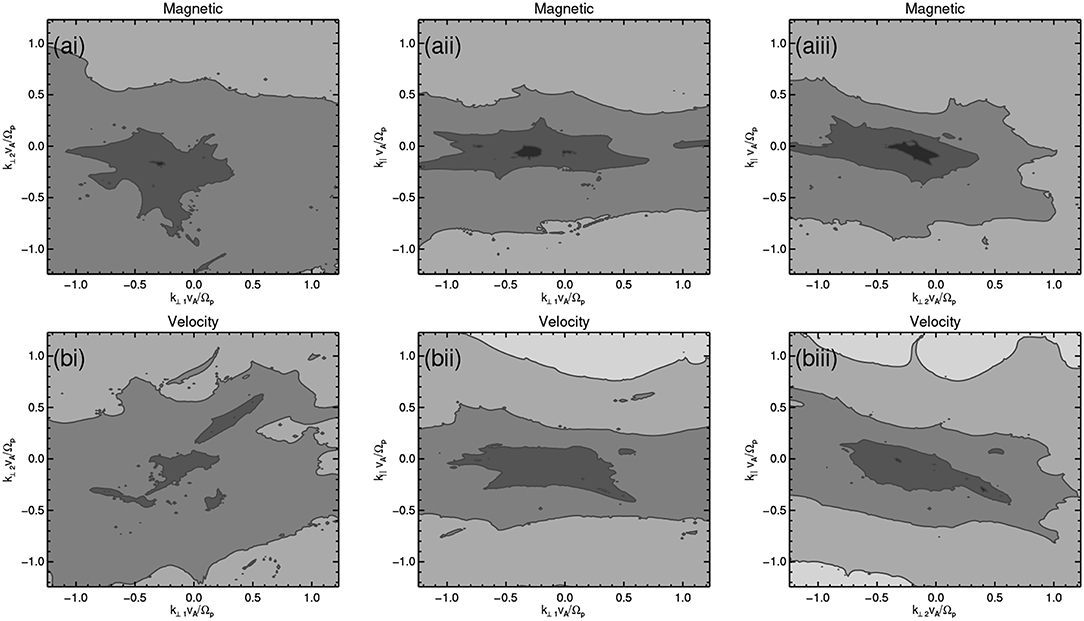
Figure 3. Two dimensional representations of the three dimensional power distribution P(k) integrated over the remaining direction, for the magnetic field fluctuations (A), the velocity fluctuations (B).
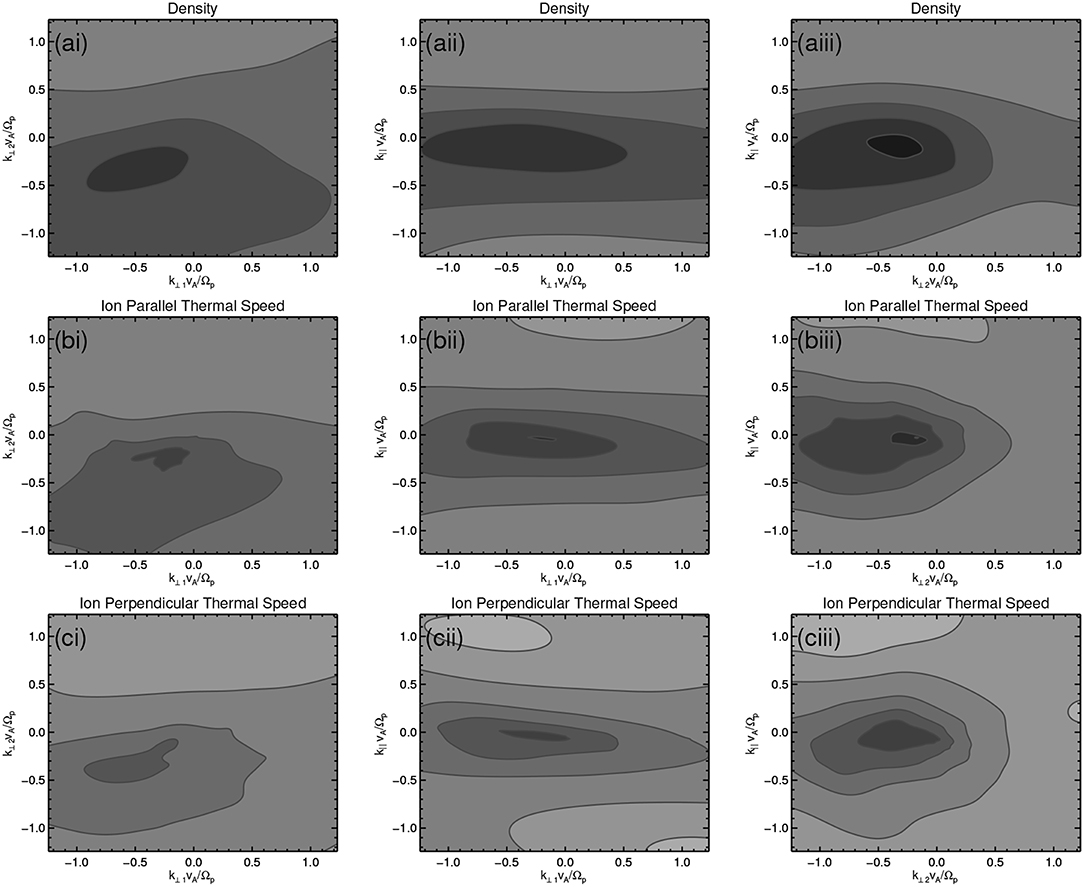
Figure 4. Two dimensional representations of the three dimensional power distribution P(k) for scalar quantities density (a), ion parallel thermal speed (b), and ion perpendicular thermal speed (c).
All spectra show similar shapes to one another but there are slight differences. To quantify the relative levels of anisotropy and agyrotropy in the power distributions of different powers we use eigenvalues of the stress tensor where the i,j elements of the tensor are defined in Equation (1).
Where the angled brackets denote the centre of the power distribution. This metric has often been used to quantify the geometrical properties of numerically simulated velocity distribution functions (e.g., [76]). The eigenvectors of this stress tensor give three orthogonal components [e1, e2, e3] which are aligned with the major axis and two perpendicular axes where the corresponding eigenvalues satisfy λ1 > λ2 > λ3. The eigenvalues can be used to define an anisotropy index λ1/λ3 and a non-gyrotropy index λ1/λ2.
For a sphere all eigenvalues would be equal and for a gyrotopic cigar like shape which is elongated along one axis the two smaller eigenvalues would be equal. The results in Table 2 demonstrate that not only that magnetic fluctuations are anisotropic but all parameters investigated are anisotropic and show similar distributions. We note that the power distributions of the vector fields are more irregular than those of scalar quantities, this may be due to the number of components put into the MSR method i.e., 12 vs. 4.
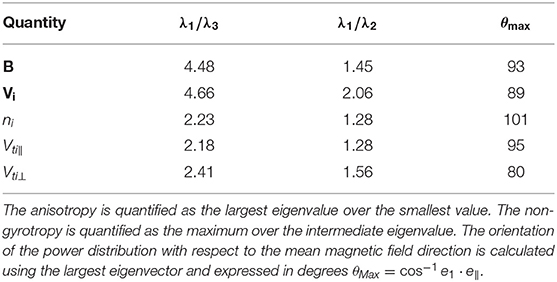
Table 2. Results of the anisotropy and non-gyrotropy analysis for the different three dimensional spectra surveyed.
The most anisotropic component is the velocity. This perhaps reflects the differences in the one dimensional spectra as proton kinetic effects become important and the velocity spectrum steepens significantly compared to the magnetic spectra [56]. Meanwhile the spectra of other parameters are much less steep than the ion velocity. The scalar components are less anisotropic than the both magnetic and velocity fields which is different to cases in the solar wind where the compressible component can be more anisotropic [22, 56]. In the fast solar wind at inertial scales this has been interpreted to be due to slow waves which are damped proportionally to k∥, thus only the fluctuations with the most perpendicular wave-vectors can survive, while the incompressible component contains Alfvén waves which do not have such a sensitivity to the propagation angle. However, in the magnetosheath the compressible component is unlikely to be due to kinetic slow waves as they are more severely damped due to the plasma conditions i.e., high ion to electron temperature ratio (e.g., [77]). The dominance of the magnetic field spectra over the velocity spectra suggests that for this interval slow waves are not dominant at kinetic scales, but could explain the bump in the perpendicular temperature and the flattening in the density spectra. This could be due to damping before they can cascade to the kinetic range. However, simulations do suggest that slow waves can exist in this environment at kinetic scales (e.g., [69]). One possibility is that pressure balanced structures could exist at kinetic scales as they are undamped. This interpretation has a weakness, as the compressible three dimensional spectra are less anisotropic than the magnetic and velocity components whereas pressure balanced structures are expected to be highly anisotropic. We suggest that something else must contribute to the compressibility, perhaps structures such as mirror modes which are quasi aligned with the magnetic field giving a smaller anisotropy than the magnetic components.
The similarity in the shapes of the distributions echoes previous work at large scales by Smith et al. [27], where similar shapes in the correlation lengths were found when using magnetic, velocity, density, and temperature. There are also suggestions here of non-gyrotropy which seems to be larger when the anisotropy is larger. The reason for this is not fully understood, some hypotheses include sampling effects due to the velocity direction [78], a remnant of a large scale effect due to the bow shock, or a preferred cascade direction. A comparison with a simulation with a known distribution of power in wave-vector space should be performed to confirm or refute the sampling effect described by Turner et al. [78]. To be able to fully understand the causes of this anisotropy more intervals should be analyzed in the magnetosheath an the solar wind and comparisons made with numerical simulations which incorporate other effects which can cause second preferred directions to appear. There is also a weak asymmetry with respect to the e∥ direction showing more power k∥ < 0.
3.3. Anisotropy of Spectral Index
To further investigate the anisotropy we reduce the full distributions to a one dimensional spectrum. We focus only on the spectral index of the dissipation scale as inertial scales have too few points in wave-vector space for an accurate determination of the spectral index due to the interspacecraft distances being too small. The distributions are converted to cylindrical coordinates and the perpendicular direction is defined as the integration over the azimuthal direction, the distribution is then folded to give a spectrum in (k∥, k⊥). Finally this is reduced to a one dimensional spectrum by taking a 1D cut through the distribution.
One dimensional spectra in directions parallel and perpendicular to the mean magnetic fields in Figures 5, 6, and in the flow direction in Figure 7. Further details of the normalization of both the MSR spectra and the conversion and normalization of the spectra in Figure 2 are given in the Appendix. It is important to note that an incorrect normalization was displayed in Roberts et al. [17] where the spectrum was divided by k rather than Δk and the total power was missing. Figure 5 shows the one dimensional cut along the parallel direction, for the five different quantities in this study. The scales corresponding to the Larmor radius and inertial length are shown in orange and the scale corresponding to the cyclotron frequency is shown in purple similarly to Figure 2. Figure 5 shows an interesting feature that there is an enhancement in the parallel power and in the perpendicular thermal speed. This could be an indication of ion cyclotron waves, which cannot be seen in the time series as the streamwise wave-vector is far from parallel. This signature is also at the low wave-number end which may be less accurate [49]. Confirmation could be made by investigating another interval with larger separations so that the scales can be studied with more accuracy. Future work should seek to perform comparisons with time intervals where the magnetic field is along the velocity direction where the signature would be able to be seen in the sapcecraft frame Fourier spectra. There are several results in the fast solar wind that show signatures of ion cyclotron waves for intervals with radial fields. However, it is not clear whether cyclotron waves are present but can only be seen for times when the magnetic field is pointing radially [10, 79].
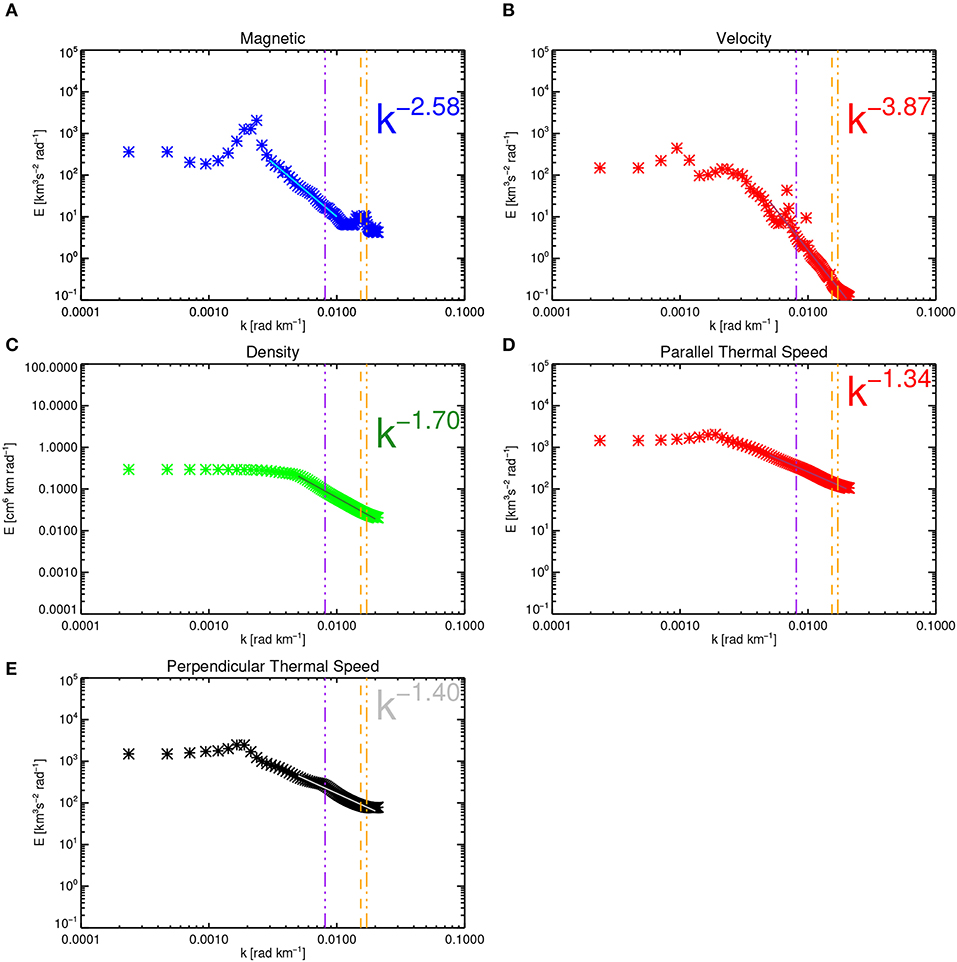
Figure 5. Reduced one dimensional spectral densities, for (A) magnetic field (B) velocity, (C) density, (D) ion parallel thermal speed, and (E) ion perpendicular thermal speed. The orange vertical lines denote the ion inertial and Larmor radius while the purple vertical lines denote the length corresponding to the cyclotron frequency. The solid lines denote power law fits to the data and the obtained spectral index is indicated on the plot.
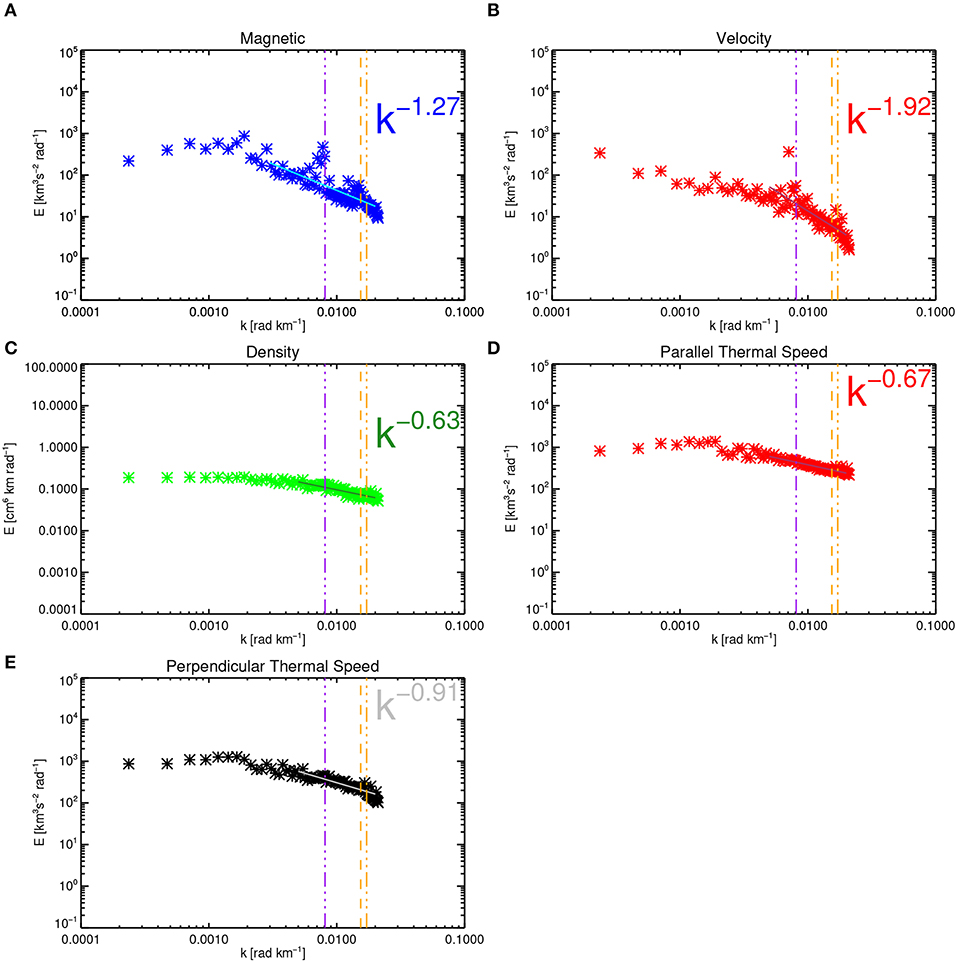
Figure 6. The same as Figure 5 but for the perpendicular direction.
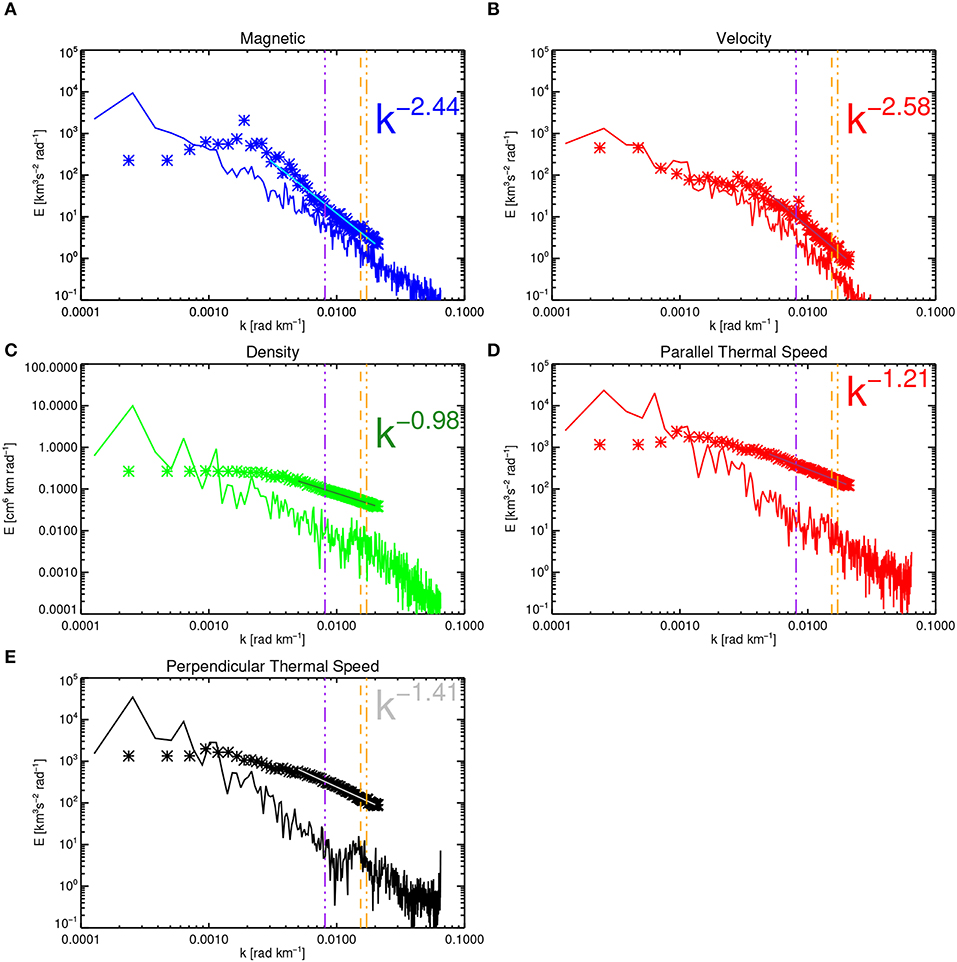
Figure 7. The same as Figures 5, 6 but for the flow direction. The points denote the values obtained from the multi spacecraft method while the solid lines denote the spacecraft frame spectra with the wave-numbers calculated from assuming Taylor's hypothesis. The spectral fits to the points also shown by the power law fits and the spectral index is indicated on the panels.
Figure 6 shows the same plots but for the perpendicular direction, while Figure 7 shows the reduced one dimensional spectrum for an angle of 50° which is approximately along the bulk velocity direction. This is plotted with the spacecraft frame spectral density (corresponding to the PSD in Figure 2) with the wave-number determined by assuming Taylor's hypothesis k = 2πf/Vi. Both vector spectra show reasonable agreement with the best agreement with the velocity. The results here are different to Figure 2E in [17] as in that paper the comparison with the flow direction spectra was made by averaging in the Cartesian coordinates for comparing the two perpendicular components rather than a one dimensional cut. Therefore, it is likely that the power there did not match as well due to the stronger agyrotropy which was averaged over. Additionally here a 1D cut is used through the spectra. At smaller scales the spectra differ possibly due to the Taylor's hypothesis losing validity for compressible components or due to spatial aliased power contributing at smaller scales. Spatial aliasing might be more prevalent for the scalar quantities when compared to the spectra of the time series as there are fewer inputs into the method. Aliasing is also suppressed by the constraining condition of the magnetic field. This explains why the power from the MSR method is much higher for the scalar quantities at small scales. To have a definitive conclusion about the application of the method to scalar components and to understand the agyrotropy comparisons of the method with numerically simulated data will be performed in the future.
The results from Figures 5–7 are summarized succinctly in Figure 8, where the spectral indices are plotted as a function of angle from the magnetic field. The spectra are fitted at several angles from the mean magnetic field direction (diamonds) and are compared to the value for the one dimensional spectra (circles) in Figure 2. The two vector spectra agree well with the spectral indices measured in frequency space apart from the density and perpendicular thermal speed most likely due to the nature of the spectra having a transition region/bump, or due to the lack of a constraining condition/fewer time series inputs as mentioned previously. The comparison between the spectral indices in frequency space and wave-number is difficult to make in some cases. This is because the spectral break location varies between each parameter as observed in Figure 2. However, the wave-vector range available is controlled by the spacecraft separations which remains the same. Therefore, in some cases there may be more Fourier modes present in the inertial range (or kinetic range) for different parameters due to the different location of the break. This is seen in the density spectrum and the perpendicular thermal speed spectra where we indicate the spectral indices of both the inertial and kinetic ranges in Figure 8. This is essentially a limitation having multiple spacecraft at only a single length scale. Future multi-spacecraft plasma turbulence missions should be designed to sample multiple length scales simultaneously.
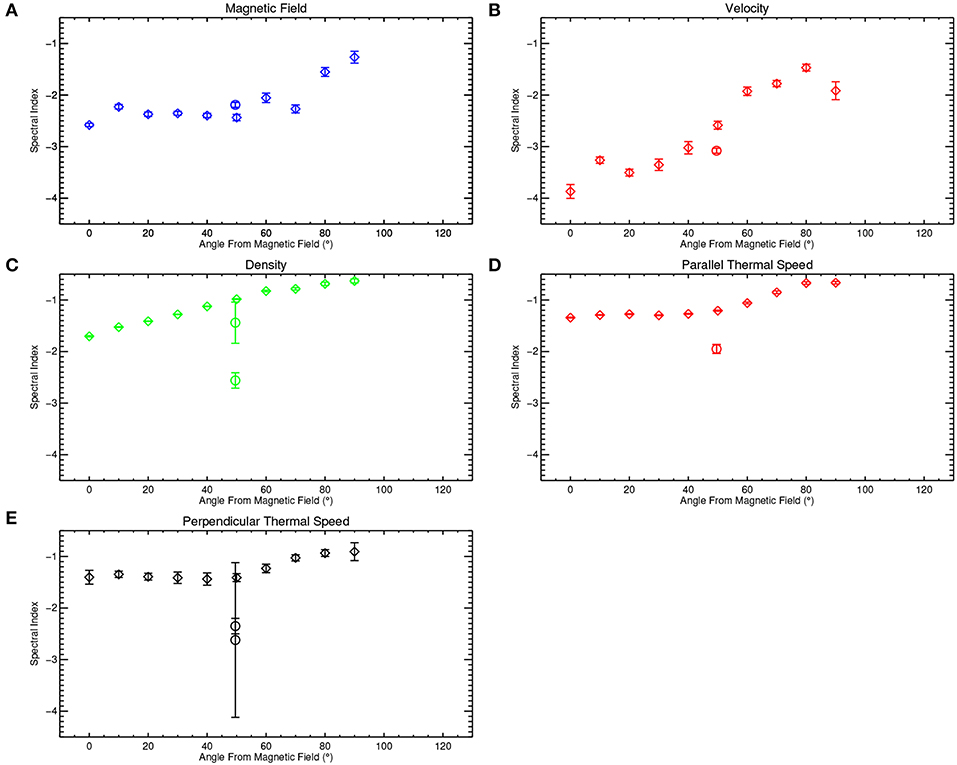
Figure 8. Anisotropy of spectral indices, showing magnetic field (A), ion velocity (B), density (C), ion parallel thermal speed (D), ion perpendicular thermal speed. The diamonds show the points obtained from the integrations of the results in Figures 3, 4 and the circles show the points corresponding to the one dimensional frequency spectra in Figure 2. The two circular points in (C,E) denote the inertial range index and the kinetic range spectral index values. The error bars denote the error from the residuals of linear least squares fitting for log power against log wave-number.
All spectra show a steepening of the spectra toward directions close to the mean magnetic field direction. Here we define the mean magnetic field to be the mean over the entire interval. A tendency toward a steepening in the parallel direction has been observed at larger scales [9] by varying investigating different orientations of the magnetic field and also with multi-spacecraft analysis at dissipation scales [42]. One of the predictions of a critically balanced cascade [80] is a spectral index relation for the magnetic field such that a Kolmogorov –5/3 spectrum in the perpendicular direction corresponds to a spectral index of –2 in the parallel direction in the inertial range. Extensions of this theory which assume a cascade of critically balanced kinetic Alfvén waves predict a parallel scaling of –5 and a perpendicular scaling of –7/3 [72, 81, 82]. Although the perpendicular scaling of the magnetic field is close to the –7/3 the parallel spectral index is far from –5, suggesting that this description is incomplete. The presence of intermittency [83] or Landau damping [84] could modify the predictions of spectral indices to –8/3 in the perpendicular direction. Following the scaling relation this would correspond to a scaling of –7/2 in the parallel direction [83] which are more consistent with the observations reported here. Alternatively, the nature of the anisotropy in the spectral indices could be explained by a non-elliptic geometry of the power distribution without the need for critical balance [85].
An interesting feature shown here is that the density spectrum and the temperature spectra show similar evolution of the spectral index from ~ −2.0 to ~ −1.5. The similarity of the density and the thermal speeds is consistent with the interpretations of Gogoberidze et al. [73], although this comparison is not completely clear when investigating only the one dimensional PSD as a function of frequency shown in Figure 2. The extreme steepness in the velocity spectrum could be due to the ions becoming demagnetized and no longer participating in the cascade or it could be interpreted in terms of the Alfvén ratio which decreases rapidly and can be interpreted as a signature of a kinetic Alfvén wave [56, 70, 86].
3.4. Summary
In this study we have extended the MSR analysis technique to turbulent fields and scalars other than the magnetic field in the magnetosheath. The fields surveyed show both, power anisotropy, and anisotropy of spectral index. The anisotropy is the strongest in the velocity fluctuations which exhibits a steep power law at ion scales. The electron velocity (not shown) shows a much flatter spectra in the ion dissipation range of f−0.8 compared with the ion velocity spectra (f−3.08) indicating the ions are no longer magnetized whereas the electrons remain magnetized indicating differences in the ion and electron velocities and that the Hall effect is present. However, the electron dynamics is outside of the scope of this work but will be investigated in the future, with a smaller choice of inter-spacecraft distance. The compressible component of the turbulence appears to be less anisotropic for the magnetosheath. This is in contrast to some observations in the solar wind [22]. This suggests that the compressibility is different to that in the solar wind and likely to be due to compressible structures that are quasi aligned with the magnetic field direction.
The anisotropy of spectral index is investigated, finding that the spectra are steeper in the direction parallel to the mean magnetic field direction for all parameters measured. The vector fields show the largest variations, while the scalars show smaller variations. When compared to the 1D frequency spectra the spectral indices are similar except in the case of density which is most likely due to the small difference in the inertial range scaling and the transition range which comes between the inertial and dissipation ranges.
The thermal speed spectra and the density spectra show similar evolution of the spectral indices from parallel orientations to perpendicular ones suggesting that the prediction of Gogoberidze et al. [73] is correct. Finally the similarity of the density spectra with the thermal speed spectra may hint that particle heating and the energy cascade rate has a strong link to the compressibility of the plasma (e.g., [87, 88]). There is also evidence that compressible slow waves and their interactions with Alfvén waves are simultaneously observed with heating signatures in proton velocity distribution functions [68]. These studies all highlight the importance of compressibility in understanding turbulent heating in a plasma.
There is also a hint of non-gyrotropy, although its origins and significance remain unclear. For this interval the anisotropy and non-gyrotropy appear to increase with one another, however more observations will be required to draw any conclusions from this case study. In the future the effect of the plasma beta, and the type of plasma should be investigated (i.e., fast/slow solar wind inner/outer magnetosheath etc.) which can all affect the level of anisotropy (e.g., [18, 89]). These measurements are only possible due to the unique capabilities of MMS combining both multiple sampling points and high time resolution plasma measurements.
Here we investigate the ion dynamics, and will extend this work to electron dynamics when the stationarity of the fluctuations in the electron velocity is justified for the analysis. The structure of the fluctuations at ion scales are similar to one another irrespective of the parameters. Finally we have demonstrated that fully three dimensional observations of plasma parameters in the Earth's magnetosheath are possible with MMS, however one of the key limitations here is the ability to only study a single scale at once. Ideally all the relevant scales of the turbulence should be sampled simultaneously, this requirement should be a driver for the design of future spacecraft missions.
Data Availability Statement
The datasets analyzed for this study can be found in the MMS science data archive https://lasp.colorado.edu/mms/sdc/public/.
Author Contributions
OR anlyzed the data and drafted the manuscript. YN, ZV, and RN contributed to the interpretation of the analysis and general improvements in the manuscript. DG contributed to the interpretation of the FPI data and general improvements in the manuscript.
Funding
RN was supported by Austrian FWF projects I2016-N20. ZV was supported by the Austrian FWF projects P28764-N27.
Conflict of Interest
The authors declare that the research was conducted in the absence of any commercial or financial relationships that could be construed as a potential conflict of interest.
References
1. Bruno R, Carbone V. The solar wind as a turbulence laboratory. Living Rev Solar Phys. (2013) 10:2. doi: 10.12942/lrsp-2013-2
2. Kiyani KH, Osman KT, Chapman SC. Dissipation and heating in solar wind turbulence: from the macro to the micro and back again. Philos Trans R Soc Math Phys Eng Sci. (2015) 373:2014015. doi: 10.1098/rsta.2014.0155
3. Kellogg P, Horbury T. Rapid density fluctuations in the solar wind. Ann Geophys. (2005) 23:3765–73. doi: 10.5194/angeo-23-3765-2005
4. Yao S, He JS, Marsch E, Tu CY, Pedersen A, Rème H, et al. Multi-scale anti-correlation between electron density and magnetic field strength in the solar wind. Astrophys J. (2011) 728:146. doi: 10.1088/0004-637X/728/2/146
5. Roberts OW, Narita Y, Li X, Escoubet CP, Laakso H. Multipoint analysis of compressive fluctuations in the fast and slow solar wind. J Geophys Res Space Phys. (2017) 122:6940–63. doi: 10.1002/2016JA023552
6. Horbury TS, Wicks RT, Chen CHK. Anisotropy in space plasma turbulence: solar wind observations. Space Sci Rev. (2012) 172:325–42. doi: 10.1007/s11214-011-9821-9
7. Oughton S, Matthaeus W, Wan M, Osman KT. Anisotropy in solar wind plasma turbulence. Philos Trans R Soc A Math Phys Eng Sci. (2015) 373:20140152. doi: 10.1098/rsta.2014.0152
8. Narita Y. Space—time structure and wavevector anisotropy in space plasma turbulence. Living Rev Solar Phys. (2018) 15:2. doi: 10.1007/s41116-017-0010-0
9. Horbury T, Foreman M, Oughton S. Anisotropic scaling of magnetohydrodynamic turbulence. Phys. Rev. Lett. (2008) 101:1–4. doi: 10.1103/PhysRevLett.101.175005
10. Podesta JJ, Gary S. Magnetic helicity spectrum of solar wind fluctuations as a function of the angle with respect to the local mean magnetic field. Astrophys J. (2011) 734:15. doi: 10.1088/0004-637X/734/1/15
11. He J, Tu C, Marsch E, Bourouaine S, Pei Z. Radial evolution of the wavevector anisotropy of solar wind turbulence between 0.3 and 1 AU. Astrophys J. (2013) 773:72. doi: 10.1088/0004-637x/773/1/72
12. Yan L, He J, Zhang L, Tu C, Marsch E, Chen CHK, et al. Spectral anisotropy of elsässer variables in two-dimensional wave-vector space as observed in the fast solar wind turbulence. Astrophys J. (2016) 816:L24. doi: 10.3847/2041-8205/816/2/l24
13. Narita Y, Glassmeier KH, Motschmann U. High-resolution wave number spectrum using multi-point measurements in space—the Multi-point Signal Resonator (MSR) technique. Ann Geophys. (2011) 29:351–60. doi: 10.5194/angeo-29-351-2011
14. Roberts OW, Li X, Li B. Kinetic plasma turbulence in the fast solar wind measured by cluster. Astrophys J. (2013) 769:58. doi: 10.1088/0004-637X/769/1/58
15. Roberts OW, Li X, Jeska L. A statistical study of the solar wind turbulence at ion kinetic scales using the K -filtering technique and cluster data. Astrophys J. (2015) 802:1–13. doi: 10.1088/0004-637X/802/1/2
16. Wicks RT, Horbury TS, Chen CHK, Schekochihin A. Anisotropy of imbalanced Alfvenic turbulence in fast solar wind. Phys Rev Lett. (2011) 106:1–4. doi: 10.1103/PhysRevLett.106.045001
17. Roberts OW, Narita Y, Escoubet CP. Direct measurement of anisotropic and asymmetric wave vector spectrum in ion-scale solar wind turbulence. Astrophys J. (2017) 851:L11. doi: 10.3847/2041-8213/aa9bf3
18. Roberts OW, Narita Y, Escoubet CP. Three-dimensional density and compressible magnetic structure in solar wind turbulence. Ann Geophys. (2018) 36:527–39. doi: 10.5194/angeo-36-527-2018
19. Dong Y, Verdini A, Grappin R. Evolution of turbulence in the expanding solar wind, a numerical study. Astrophys J. (2014) 793:118. doi: 10.1088/0004-637X/793/2/118
20. Vech D, Chen CHK. Testing the effects of expansion on solar wind turbulence. Astrophys J. (2016) 832:L16. doi: 10.3847/2041-8205/832/1/L16
21. Saur J, Bieber JW. Geometry of low-frequency solar wind magnetic turbulence: evidence for radially aligned Alfvénic fluctuations. J Geophys Res. (1999) 104:9975.
22. Chen C, Mallet A, Schekochihin A, Horbury T, Wicks RT, Bale S. Three-dimensional structure of solar wind turbulence. Astrophys J. (2012) 758:1–5. doi: 10.1088/0004-637X/758/2/120
23. Narita Y, Comişel H, Motschmann U. Spatial structure of ion-scale plasma turbulence. Front Phys. (2014) 2:13. doi: 10.3389/fphy.2014.00013
25. Matthaeus W, Goldstein M, Roberts DA. Evidence for the presence of quasi-two-dimensional nearly incompressible fluctuations in the solar wind. J Geophys Res. (1990) 95:20673.
26. Dasso S, Milano L, Matthaeus W, Smith C. Anisotropy in fast and slow solar wind fluctuations. Astrophys J. (2005) 635:181–4. doi: 10.1086/499559
27. Smith CW, Vasquez BJ, Stemkowski MR. Analysis of multi-dimensional correlation functions in the solar wind. AIP Confer Proc. (2013) 271:271–4. doi: 10.1063/1.4811040
28. Wang X, Tu C, He J. 2D isotropic feature of solar wind turbulence as shown by self-correlation level contours at hour timescales. Astrophys J. (2019) 871:93. doi: 10.3847/1538-4357/aaf64f
29. Forman MA, Wicks RT, Horbury T. Detailed fit of “Critical Balance” theory to solar wind turbulence measurements. Astrophys J. (2011) 733:76. doi: 10.1088/0004-637X/733/2/76
30. Smith CW, Hamilton K, Vasquez BJ, Leamon RJ. Dependence of the dissipation range spectrum of interplanetary magnetic fluctuations on the rate of energy cascade. Astrophys J. (2006) 645:L85–8. doi: 10.1086/506151
31. Alexandrova O, Lacombe C, Mangeney A, Grappin R, Maksimovic M. Solar wind turbulent spectrum at plasma kinetic scales. Astrophys J. (2012) 760:121. doi: 10.1088/0004-637X/760/2/121
32. Bruno R, Trenchi L, Telloni D. Spectral slope variation at proton scales from fast to slow solar wind. Astrophys J. (2014) 793:L15. doi: 10.1088/2041-8205/793/1/L15
33. Woodham LD, Wicks RT, Verscharen D, Owen CJ. The role of proton cyclotron resonance as a dissipation mechanism in solar wind turbulence: a statistical study at ion-kinetic scales. Astrophys J. (2018) 856:49. doi: 10.3847/1538-4357/aab03d
34. Wang X, Tu CY, He JS, Wang LH. Ion-scale spectral break in the normal plasma beta range in the solar wind turbulence. J Geophys Res Space Phys. (2018) 123:68–75. doi: 10.1002/2017JA024813
35. Duan D, He J, Pei Z, Huang S, Wu H, Verscharen D, et al. Angular independence of break position for magnetic power spectral density in solar wind turbulence. Astrophys J. (2018) 865:89. doi: 10.3847/1538-4357/aad9aa
36. Howes GG, Klein KG, TenBarge JM. Validity of the taylor hypothesis for linear kinetic waves in the weakly collisional solar wind. Astrophys J. (2014) 789:106. doi: 10.1088/0004-637X/789/2/106
37. Klein KG, Howes GG, TenBarge JM. The violation of the taylor hypothesis in measurements of solar wind turbulence. Astrophys J. (2014) 790:L20. doi: 10.1088/2041-8205/790/2/L20
38. Narita Y. Error estimate of Taylor's frozen-in flow hypothesis in the spectral domain. Ann Geophys. (2017) 35:325–31. doi: 10.5194/angeo-35-325-2017
39. Verdini Grappin R, Verdini A, Grappin R. Imprints of expansion on the local anisotropy of solar wind turbulence. Astrophys J. (2015) 808:L34. doi: 10.1088/2041-8205/808/2/L34
40. Osman K, Horbury T. Quantitative estimates of the slab and 2-D power in solar wind turbulence using multispacecraft data. J Geophys Res. (2009) 114:1–8. doi: 10.1029/2008JA014036
41. Osman K, Horbury T. Multi-spacecraft measurement of anisotropic power levels and scaling in solar wind turbulence. Ann Geophys Atmos. (2009) 2008:3019–25. doi: 10.5194/angeo-27-3019-2009
42. Chen CHK, Horbury TS, Schekochihin AA, Wicks RT, Alexandrova O, Mitchell J. Anisotropy of solar wind turbulence between ion and electron scales. Phys Rev Lett. (2010) 104:1–4. doi: 10.1103/PhysRevLett.104.255002
43. Narita Y, Gary S, Saito S, Glassmeier KH, Motschmann U. Dispersion relation analysis of solar wind turbulence. Geophys Res Lett. (2011) 38:2–5. doi: 10.1029/2010GL046588
44. Burch JL, Moore TE, Torbert RB, Giles BL. Magnetospheric multiscale overview and science objectives. Space Sci Rev. (2016) 199:5–21. doi: 10.1007/s11214-015-0164-9
45. Pollock C, Moore T, Jacques A, Burch J, Gliese U, Saito Y, et al. Fast plasma investigation for magnetospheric multiscale. Space Sci Rev. (2016) 199:331–406. doi: 10.1007/s11214-016-0245-4
46. Tjulin A, Pincon J, Sahraoui F, André M, Cornilleau-Wehrlin N. The k-filtering technique applied to wave electric and magnetic field measurements from the Cluster satellites. J Geophys Res. (2005) 110:1–17. doi: 10.1029/2005JA011125
47. Motschmann U, Woodward TI, Glassmeier KH, Southwood DJ, Pincon J. Wave length and direction filtering by magnetic measurements at satellite arrays : generalized minimum variance analysis. J Geophys Res. (1996) 101:4961–5.
48. Russell CT, Anderson BJ, Baumjohann W, Bromund KR, Dearborn D, Fischer D, et al. The magnetospheric multiscale magnetometers. Space Sci Rev. (2016) 1990:189–256. doi: 10.1007/s11214-014-0057-3
49. Sahraoui F, Belmont G, Goldstein M, Rezeau L. Limitations of multispacecraft data techniques in measuring wave number spectra of space plasma turbulence. J Geophys Res. (2010) 115:1–10. doi: 10.1029/2009JA014724
50. Roberts O, Li X, Jeska L. Validation of the k-filtering technique for a signal composed of random phase plane waves and non-random coherent structures. Geosci Inform Data Syst. (2014) 3:247–54. doi: 10.5194/gi-3-247-2014
51. Perrone D, Alexandrova O, Roberts OW, Lion S, Lacombe C, Walsh A, et al. Coherent structures at ion scales in fast solar wind: cluster observations. Astrophys J. (2017) 849:49. doi: 10.3847/1538-4357/aa9022
52. Podesta JJ, Roberts DA, Goldstein ML. Power spectrum of small-scale turbulent velocity fluctuations in the solar wind. J Geophys Res. (2006) 111:A10109. doi: 10.1029/2006JA011834
53. Matteini L, Alexandrova O, Chen CHK, Lacombe C. Electric and magnetic spectra from MHD to electron scales in the magnetosheath. Mon Notices R Astron Soc. (2017) 466:945–51. doi: 10.1093/mnras/stw3163
54. Bandyopadhyay R, Chasapis A, Chhiber R, Parashar TN, Maruca BA, Matthaeus WH, et al. Solar wind turbulence studies using MMS fast plasma investigation data. Astrophys J. (2018) 866:81. doi: 10.3847/1538-4357/aade93
55. Gershman DJ, Viñas AF, Dorelli JC, Goldstein ML, Shuster J, Avanov LA, et al. Energy partitioning constraints at kinetic scales in low- β turbulence. Phys Plasmas. (2018) 25:022303. doi: 10.1063/1.5009158
56. Roberts OW, Toledo-Redondo S, Perrone D, Zhao J, Narita Y, Gershman D, et al. Ion-scale kinetic Alfvén turbulence: MMS measurements of the Alfvén ratio in the magnetosheath. Geophys Res Lett. (2018) 45:7974–84. doi: 10.1029/2018GL078498
57. Alexandrova O, Mangeney A, Maksimovic M, Cornilleau-Wehrlin N, Bosqued JM, André M. Alfvén vortex filaments observed in magnetosheath downstream of a quasi-perpendicular bow shock. J Geophys Res. (2006) 111:A12208. doi: 10.1029/2006JA011934
58. Alexandrova O. Solar wind vs. magnetosheath turbulence and Alfvén vortices. Nonlinear Process Geophys. (2008) 15:95–108. doi: 10.5194/npg-15-95-2008
59. Perrone D, Alexandrova O, Mangeney A, Maksimovic M, Lacombe C, Rakoto V, et al. Compressive coherent structures at ion scales in the slow solar wind. Astrophys J. (2016) 826:196. doi: 10.3847/0004-637X/826/2/196
60. Roberts OW, Li X, Alexandrova O, Li B. Observation of an MHD Alfvén vortex in the slow solar wind. J Geophys Res Space Phys. (2016) 121:3870–81. doi: 10.1002/2015JA022248
61. Karimabadi H, Roytershteyn V, Vu HX, Omelchenko YA, Scudder J, Daughton W, et al. The link between shocks, turbulence, and magnetic reconnection in collisionless plasmas. Phys Plasmas. (2014) 21:062308. doi: 10.1063/1.4882875
62. Vörös Z, Yordanova E, Echim MM, Consolini G, Narita Y. Turbulence-generated proton-scale structures in the terrestrial magnetosheath. Astrophys J Lett. (2016) 819:L15. doi: 10.3847/2041-8205/819/1/L15
63. Chasapis A, Yang Y, Matthaeus WH, Parashar TN, Haggerty CC, Burch JL, et al. Energy conversion and collisionless plasma dissipation channels in the turbulent magnetosheath observed by the magnetospheric multiscale mission. Astrophys J. (2018) 862:32. doi: 10.3847/1538-4357/aac775
64. Chen CHK, Leung L, Boldyrev S, Maruca BA, Bale S. Ion-scale spectral break of solar wind turbulence at high and low beta. Geophys Res Lett. (2014) 41:8081–8. doi: 10.1002/2014GL062009
65. Bruno R, Trenchi L. Radial dependence of the frequency break between fluid and kinetic scales in the solar wind fluctuations. Astrophys J Lett. (2014) 787:1–5. doi: 10.1088/2041-8205/787/2/L24
66. Wicks RT, Alexander RL, Stevens M, Wilson LB III, Moya PS, Viñas A, et al. A proton-cyclotron wave storm generated by unstable proton distribution functions in the solar wind. Astrophys J. (2016) 819:6. doi: 10.3847/0004-637X/819/1/6
67. Lion S, Alexandrova O, Zaslavsky A. Coherent events and spectral shape at ion kinetic scales in the fast solar wind turbulence. Astrophys J. (2016) 824:1–13. doi: 10.3847/0004-637X/824/1/47
68. He J, Tu C, Marsch E, Chen CHK, Wang L, Pei Z, et al. Proton heating in solar wind compressible turbulence with collisions between counter-propagating waves. Astrophys J. (2015) 813:L30. doi: 10.1088/2041-8205/813/2/l30
69. Hao Y, Lu Q, Gao X, Wang H, Wu D, Wang S. Two-dimensional hybrid simulations of filamentary structures and kinetic slow Waves Downstream of a Quasi-parallel Shock. Astrophys J. (2018) 861:57. doi: 10.3847/1538-4357/aacb2c
70. Zhao JS, Voitenko Y, Yu MY, Lu JY, Wu DJ. Properties of short-wavelength oblique Alfven and slow waves. Astrophys J. (2014) 793:107. doi: 10.1088/0004-637X/793/2/107
71. Chandran BDG, Quataert E, Howes GG, Xia Q, Pongkitiwanichakul P. Constraining low-frequency Alfvenic turbulence in the solar wind using density-fluctuation measurements. Astrophys J. (2009) 707:1668–75. doi: 10.1088/0004-637X/707/2/1668
72. Schekochihin A, Cowley SC, Dorland W, Hammett GW, Howes G, Quataert E, et al. Astrophysical gyrokinetics: kinetic and fluid turbulent cascades in magnetized weakly collisional plasmas. Astrophys J Suppl Ser. (2009) 182:310–77. doi: 10.1088/0067-0049/182/1/310
73. Gogoberidze G, Voitenko YM, Machabeli G. Temperature spectra in the solar wind turbulence. Mon Notices R Astron Soc. (2018) 480:1864–9. doi: 10.1093/mnras/sty1914
74. Safrankova J, Nemecek Z, Prech L, Zastenker G. Ion kinetic scale in the solar wind observed. Phys Rev Lett. (2013) 110:025004. doi: 10.1103/PhysRevLett.110.025004
75. Šafránková J, Nemecek Z, Nemec F, Prech L, Chen CHK, Zastenker GN. Power spectral density of fluctuations of bulk and thermal speeds in the solar wind. Astrophys J. (2016) 825:121. doi: 10.3847/0004-637X/825/2/121
76. Servidio S, Valentini F, Perrone D, Greco A, Califano F, Matthaeus WH, et al. A kinetic model of plasma turbulence. J Plasma Phys. (2014) 81:325810107. doi: 10.1017/S0022377814000841
77. Peter Gary S. Theory of Space Plasma Microinstabilities. Cambridge, UK: Cambridge University Press (1993). p. 193.
78. Turner AJ, Gogoberidze G, Chapman S, Hnat B, Müller WC. Nonaxisymmetric anisotropy of solar wind turbulence. Phys Rev Lett. (2011) 107:095002. doi: 10.1103/PhysRevLett.107.095002
79. He J, Tu C, Marsch E, Yao S, HuiTian. Possible evidence of alfven-cyclotron waves in the angle distribution of magnetic helicity of solar wind turbulence. Astrophys J. (2011) 731:85. doi: 10.1088/0004-637X/731/2/85
80. Goldreich P, Sridhar S. Toward a theory of interstellar turbulence. 2: Strong alfvenic turbulence. Astrophys J. (1995) 438:763–75.
81. Cho J, Lazarian A. The anisotropy of electron magnetohydrodynamic turbulence. Astrophys J. (2004) 615:41–4. doi: 10.1086/425215
82. Chen CHK, Wicks RT, Horbury TS, Schekochihin A. Interpreting power anisotropy measurements in plasma turbulence. Astrophys J. (2010) 711:L79–83. doi: 10.1088/2041-8205/711/2/L79
83. Boldyrev S, Perez JC. Spectrum of kinetic-Alfvén turbulence. Astrophys J. (2012) 758:L44. doi: 10.1088/2041-8205/758/2/L44
84. Howes GG, Cowley SC, Dorland W, Hammett GW, Quataert E, Schekochihin AA. A model of turbulence in magnetized plasmas: implications for the dissipation range in the solar wind. J Geophys Res Space Phys. (2008) 113:1–24. doi: 10.1029/2007JA012665
85. Narita Y. Non-elliptic wavevector anisotropy for magnetohydrodynamic turbulence. Ann Geophys. (2015) 33:1413–9. doi: 10.5194/angeo-33-1413-2015
86. Gary SP. Low-frequency waves on a high-beta collisionless plasma: polarization, compressibility and helicity. J Plasma Phys. (1986) 35:431–47.
87. Hadid LZ, Sahraoui F, Galtier S, Huang SY. Compressible magnetohydrodynamic turbulence in the Earth's magnetosheath: estimation of the energy cascade rate using in situ spacecraft data. Phys Rev Lett. (2018) 120:055102. doi: 10.1103/PhysRevLett.120.055102
88. Bandyopadhyay R, Chasapis A, Chhiber R, Parashar TN, Matthaeus WH, Shay MA, et al. Incompressive energy transfer in the Earth's magnetosheath: magnetospheric multiscale observations. Astrophys J. (2018) 866:106. doi: 10.3847/1538-4357/aade04
89. Comişel H, Narita Y, Motschmann U. Wavevector anisotropy of plasma turbulence at ion kinetic scales: solar wind observations and hybrid simulations. Nonlinear Process Geophys. (2014) 21:1075–83. doi: 10.5194/npg-21-1075-2014
Appendix
Normalization
The result from the MSR technique is a power spectrum as a function of spacecraft frame frequency ωsc and wavevector k. For this example velocity units will be used:
To estimate the spectrum PMSR(k) an integration needs to be performed over ωsc,
The power spectrum can be expressed in cylindrical coordinates:
To convert to a one dimensional spectrum the spectrum is averaged azimuthally:
This is then folded along the line k∥ = 0 (summed together and divided by 2) so there are only positive such that there are only positive components of k∥.
A dimension conversion to spectral density in the wavevector domain;
where the prime denotes the change of units. A one dimensional cut of the spectrum is taken such that:
Finally normalization to the fluctuation variance which assumes ergodicity of the signals reads:
where σ2 is the variance measured in the time domain:
The spectrum in Equation (A7) normalized to the variance over the total power:
Similarly to normalize the spectrum in the spacecraft frame time domain,
we convert the units by Taylor's hypothesis.
Where ks is the streamwise wave-number. The dimensions are then converted into the spectral density in the wave-number domain,
This is normalized in the same way as for the MSR spectrum for the purpose of comparison:
Keywords: magnetosheath, turbulence, plasma, dissipation, kinetic plasma
Citation: Roberts OW, Narita Y, Nakamura R, Vörös Z and Gershman D (2019) Anisotropy of the Spectral Index in Ion Scale Compressible Turbulence: MMS Observations in the Magnetosheath. Front. Phys. 7:184. doi: 10.3389/fphy.2019.00184
Received: 31 May 2019; Accepted: 29 October 2019;
Published: 20 November 2019.
Edited by:
Antonella Greco, University of Calabria, ItalyReviewed by:
Roberto Bruno, Institute for Space Astrophysics and Planetology (INAF), ItalyHui Li, National Space Science Center (CAS), China
Jiansen He, Peking University, China
Copyright © 2019 Roberts, Narita, Nakamura, Vörös and Gershman. This is an open-access article distributed under the terms of the Creative Commons Attribution License (CC BY). The use, distribution or reproduction in other forums is permitted, provided the original author(s) and the copyright owner(s) are credited and that the original publication in this journal is cited, in accordance with accepted academic practice. No use, distribution or reproduction is permitted which does not comply with these terms.
*Correspondence: Owen Wyn Roberts, b3dlbi5yb2JlcnRzQG9lYXcuYWMuYXQ=