 Efstathios Konstantinidis
 Jisheng Zhao2
 Justin Leontini
 David Lo Jacono
 John Sheridan
- 1Department of Mechanical Engineering, University of Western Macedonia, Kozani, Greece
- 2Department of Mechanical and Aerospace Engineering, Monash University, Melbourne, VIC, Australia
- 3Department of Mechanical Engineering and Product Design Engineering, Swinburne University of Technology, Hawthorn, VIC, Australia
- 4Institut de Mécanique des Fluides de Toulouse (IMFT) CNRS, UPS, Université de Toulouse, Toulouse, France
In the context of flow-induced vibration, the component of the hydrodynamic coefficient in-phase with the velocity of an oscillating body, Cv, can be termed “positive excitation” or “negative damping” if Cv > 0. While this empirical approach is of long standing in the literature it does not account for distinct physical mechanisms that can be associated with fluid excitation and fluid damping. In this work, we decompose the total hydrodynamic force into a drag component aligned with the time-dependent vector of the relative velocity of a cylinder oscillating transversely with respect to a free stream and a lift component normal to the drag component. The drag and lift components are calculated from laboratory measurements of the components of the hydrodynamic force in the streamwise and cross-stream directions combined with simultaneous measurements of the displacement of an elastically mounted rigid circular cylinder undergoing vortex-induced vibration. It is shown that the drag component only does negative work on the oscillating cylinder, i.e., it is a purely damping force as expected from theoretical considerations. In contrast to this the lift component mostly does positive work on an oscillating cylinder, i.e., it is the sole component providing fluid excitation. In addition, the new excitation (lift) coefficient, CL displays the same scaling as the linear theory predicts for the traditional excitation coefficient, Cv, even though CL is two orders of magnitude higher than Cv. More importantly, while Cv depends on the mechanical properties of the hydro-elastic system, according to linear theory, we provide here evidence that CL depends solely on fluid-dynamical parameters. Finally, an effective drag is calculated that represents the dissipation of energy within the fluid, and it is found that the effective drag is not equal to the mean value of the drag component. The effective drag provides complementary information that characterizes the state of the wake flow. Its variation suggests that the wake can dissipate the kinetic energy most vigorously at the end of the initial branch.
1. Introduction
Vortex-induced vibration (VIV) is a fundamental problem in fluid-structure interaction. A compliant structure such as an elastic or elastically-mounted cylinder can be excited by the unsteady fluid force originating from vortex shedding in its wake. The phenomenon is most intense when the vortex shedding and the structural vibration synchronize at some common frequency, which is within a narrow range of the main natural eigenfrequency of the structure. There exists comprehensive literature on the subject of VIV, including the reviews of Bearman [1], Sarpkaya [2], and Williamson and Govardhan [3].
Most of the basic research on the problem has dealt with rigid circular cylinders that are elastically mounted so as to have one degree of freedom to oscillate, most often this is transversely to an incident free stream, which is one of the simplest configurations to study VIV. The vibration response of such hydro-elastic systems can be characterized by the amplitude, A*, and frequency, f*, where the star denotes normalization of the amplitude by the cylinder diameter and of the frequency by the natural frequency of the structure (with or without consideration of the surrounding fluid). It has been established in the published literature that the response depends on the following dimensionless parameters: the ratio of the structural mass to the mass of fluid displaced by the structure, the mass ratio, m*; the ratio of the structural damping to the critical damping, the damping ratio, ζ; the reduced velocity, U*, in addition to the Reynolds number, Re. Khalak and Williamson [4] first classified the VIV response as a function of reduced velocity for hydro-elastic systems with a very low mass ratio and with a very low damping ratio into four distinct regions, the initial excitation region, the upper branch of very high amplitude, the lower branch of moderate amplitude, and the desynchronization region. Strong resonance and synchronization between the oscillation and the fluid forcing occurs in the upper and lower branches. For hydro-elastic systems with a high value of combined mass–damping, the upper branch does not exist as a distinct branch (see [5]). When the cylinder is contained between parallel walls, the blockage ratio becomes a governing parameter [6, 7].
The equation of motion for a freely-oscillating cylinder with one degree of freedom in a direction transverse to an incident free stream can be written as [8]
where m, fN, and ζ are the mass, the undamped natural frequency, and the damping ratio of the structure, respectively; Fy is the hydrodynamic force acting in the transverse direction; y is the displacement of the cylinder and each overdot represents a derivative with respect to time. It is often assumed that the vortex-induced oscillation is pure tone and therefore can be described as a sinusoidal function of time t, i.e., y(t) = Asin2πft, where A and f are the amplitude and the frequency of oscillation, respectively. In this case, the hydrodynamic force can be analyzed into components in-phase with velocity and acceleration, i.e.,
where ρ is the density of the fluid, U∞ is the velocity of the free stream, D is the outer diameter of the cylinder, and L its length. In the following, it will be assumed that the hydrodynamic force and the oscillation are homogeneous along the span, making it permissible to just consider a unit length of the cylinder. In Equation (2), Cv and Ca are hydrodynamic coefficients that are usually taken as Fourier averages over many cycles of oscillation of the transverse component of the unsteady force on the cylinder [2].
The above decomposition is a harmonic approximation of the unsteady force. Sarpkaya [2] discussed extensively the limitations of this linearized approach if the oscillations have amplitude and/or frequency modulations. However, displacement measurements show that the free vibration is close to pure tone in much of the synchronization region and the harmonic assumption is justified in this region, at least (also see [9]). Using this assumption, the following result can be obtained
where A* = A/D, , m* = 4m/ρπD2, and . Since all terms inside the parenthesis in the equation on the left hand side are positive, it is required that Cv > 0 for self-excited and self-sustained oscillations of finite-amplitude to materialize. As a consequence, Cv is considered as a positive excitation or a negative damping coefficient. Often Cv is also encountered as −Cd, which is referred to as a drag coefficient [2, 10]. It may be argued that the above decomposition based on the force components in-phase with velocity and acceleration is purely empirical. More importantly, it may be questionable whether the linearized force can (or cannot) properly attribute fluid excitation, fluid damping, and fluid inertia to physical mechanisms illuminating how the hydrodynamic forces are generated.
To gain physical insight into the origin of the hydrodynamic forces, we take a view of the VIV problem from the following perspective. Consider a cylinder that is dragged through still fluid so as to exactly replicate the vortex-induced vibration of an elastically-supported cylinder transversely to a free stream [11]. Kinematic similarity requires that the relative velocity between the moving cylinder and the fluid varies in exactly the same manner in both configurations. As the cylinder is dragged in a prescribed path through still fluid, it does work on the fluid at the rate F · U where F and U, respectively, are the instantaneous vectors of the force acting on the cylinder and of the velocity of the cylinder as it moves through the still fluid. Only the component of the force aligned with instantaneous velocity can do work on the fluid. The energy transferred to the otherwise still fluid is eventually dissipated via the action of viscosity. Since the force aligned with the instantaneous velocity of the cylinder can only be associated with energy transfer from the structure to the fluid, it must be a purely damping force, i.e., it is expended in the resistance of the fluid to the motion of the cylinder. In the case of an elastically-mounted rigid cylinder undergoing vortex-excited vibration transversely to a uniform free stream, the relative velocity is U = U∞i − ẏj, where i and j, respectively, are the unit vectors in the streamwise and transverse directions. In this case, the net rate at which “energy is transferred to the fluid” (in fact that amount represents the rate of energy dissipation in the fluid in this case) is given by FxU∞ − Fyẏ [12]. Thus, we see that the rate of work done on the fluid, i.e., fluid damping, depends on both the streamwise and transverse components of the hydrodynamic force. Another consequence of the above approach is that true fluid excitation can only result from the component of the force normal to the direction of the instantaneous relative velocity.
In the present study, we analyze the total hydrodynamic force acting on a freely vibrating cylinder into a component acting along the instantaneous direction of the relative velocity between the free stream and the oscillating cylinder and another normal to this direction. For that purpose, we use experimental measurements of the fluid forces and body displacement of an elastically-supported circular cylinder undergoing vortex-induced vibration. In the next sections, we describe the experimental facility, the measurement techniques and the data processing methods, followed by the presentation of the results and discussion of the key findings from the present analysis.
2. Materials and Methods
2.1. Experimental Facility and Measurement Techniques
The experiments were conducted in the free-surface recirculating water channel of the FLAIR group at Monash University. The test section of the water channel has dimensions of 0.6 m (width) × 0.8 m (height) × 4 m (length). The background turbulence level in the test section is below 1%. A cylinder was elastically mounted from above the free surface on a low-friction air bearing system as shown in Figure 1. The cylinder was made from carbon fiber tubing and was rigid; its outer diameter was D = 25 mm and its immersed length was L = 620 mm, giving an aspect ratio of L/D = 24.8, which is sufficiently large to avoid effects from the cylinder end. The ratio of the oscillating mass to the displaced fluid mass was m* = 3.0. A raised platform at the bottom of the water channel with a gap of approximately 1 mm to the bottom end of the cylinder was employed to promote parallel vortex shedding. The natural frequency of the system was determined by individual free-decay tests in both quiescent air (fNair = 0.835 Hz) and water (fNwater = 0.717 Hz). The structural damping ratio measured in still air was 3.5 × 10⁻³. Measurements were made over the range of free-stream velocities from 43.1 to 260.4 mm/s corresponding to Reynolds numbers in the range from 1,250 to 7,550 and reduced velocities in the range 2.4 ≤ U* ≤ 14.5, where is the reduced velocity based on the natural frequency of the structure in still water.
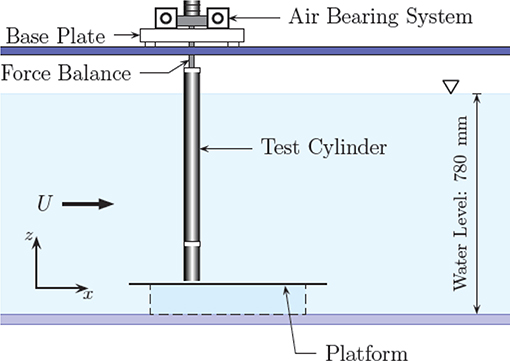
Figure 1. Schematic of the experimental facility.
The displacement of the freely-vibrating cylinder was measured using a non-contact magnetostricitive linear variable differential transformer (LVDT) while the streamwise and transverse components of the hydrodynamic force acting on the cylinder were simultaneously measured using a high-accuracy two-component force balance. For the transverse component, the inertial force due to the cylinder's acceleration was taken into account to recover the instantaneous fluid force. More details and validation of the experimental rig and techniques are given in Nemes [13] and Zhao et al. [14–16]. The time series of the displacement, y(t), streamwise, Fx(t), and transverse, Fy(t), force components were collected over 300 s at a sampling rate of 100 Hz yielding 3 × 10⁴ samples per channel.
2.2. Data Processing
The instantaneous components of the total hydrodynamic force in the direction of the free stream and normal to the free stream, Fx and Fy, respectively, were directly measured with the force balance. The damping or drag force, FD, is defined as the component of the total hydrodynamic force aligned with the time-dependent vector of the relative velocity of the cylinder as it oscillates transversely with respect to the free stream. The excitation or lift force, FL, is defined as the complementary component of the total hydrodynamic force normal to the drag component. This approach is customarily employed for flows around aerodynamic bodies but not so frequently for flows over bluff bodies. The instantaneous drag and lift components were obtained from the directly-measured components by a transformation from the laboratory (fixed) frame of reference to one attached to a cylinder as it would move with the same relative velocity through still fluid, using the following formulas
where defines the instantaneous angle of the relative velocity vector. The instantaneous velocity of the cylinder was computed by numerical differentiation of the displacement, ẏ(t) = dy/dt. The signal from the displacement sensor was first low-pass filtered to avoid propagation of errors due to measurement noise in the computed velocities. In order to calculate the rate of work of the drag and lift components on the oscillating cylinder, their projections on the y-axis were also computed from the following relationships
In the presentation of the results, the displacement is normalized by the cylinder diameter, forces are normalized by , and rates of energy transfer by . The reduced velocity is based on the natural frequency of the structure in water.
3. Results
The VIV response as a function of the reduced velocity is shown in Figure 2. The mean amplitude, which is taken as times the standard deviation of the displacement signal, is juxtaposed on the envelope bracketing the minimum and maximum amplitude recorded at each reduced velocity. Based on the variation of the response amplitude, we have identified the ranges of the typical response branches as listed in Table 1. We have included a separate transition region from the upper branch to the lower branch in which we observed intermittent switching between the corresponding dynamic modes. The envelope of amplitudes is relatively wider and narrower in the upper and lower branches, respectively. The breadth of the envelope characterizes the amplitude modulations in the displacement signal, which is indicative of the variant dynamics in the upper and lower branches. The variation of the response frequency as a function of the reduced velocity (see Figure 2) displays more complex variation than the response amplitude, thereby indicating more subtle differences of the dynamics in various sub-ranges of the main response regions, which will not be examined further for brevity. The mean amplitude and the mean frequency obtained from the present study as a function of the reduced velocity both agree well with previous works at comparable mass and damping ratios (see e.g., [17]).
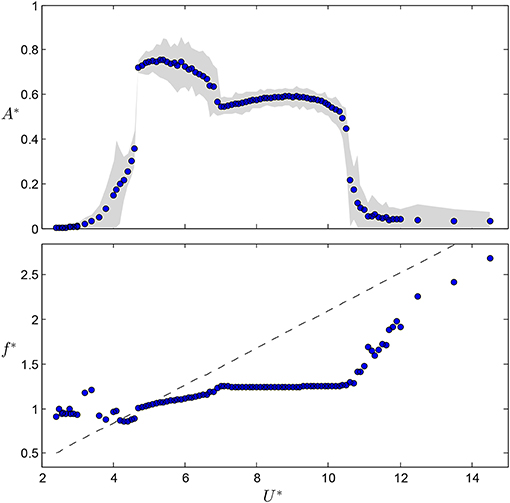
Figure 2. Variation of the response amplitude, A*, and frequency, f*, with the reduced velocity, U*.
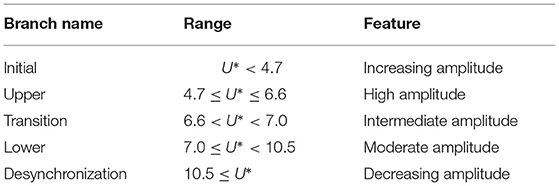
Table 1. VIV branches obtained from the variation of the response amplitude with reduced velocity.
Here, the response frequency was taken as the inverse of the mean period of the peak-to-peak oscillations in the displacement signal. With this method, it is possible to discern cycle-to-cycle variations in the frequency and thereby identify possible mode competitions. For instance, the transition from the upper to the lower branch of response involves a simultaneous change from relatively low-amplitude and high-frequency oscillations to relatively high-amplitude and low-frequency oscillations. Figure 3 shows the cycle-to-cycle variation of the oscillation amplitude and frequency at U* = 6.8, which corresponds to the transition region.
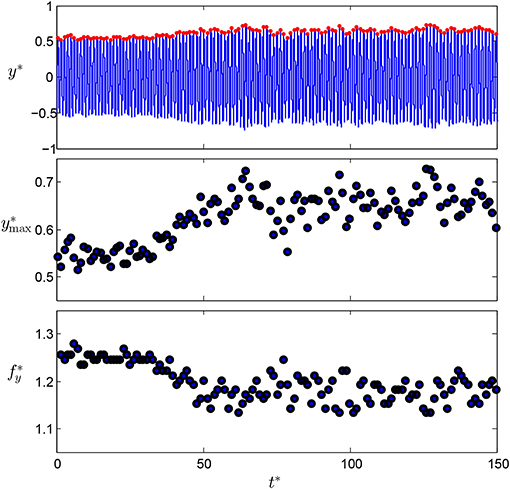
Figure 3. Cycle-to-cycle variations in the amplitude and frequency of oscillations in the displacement signal at U* = 6.8.
In the following, results at four reduced velocities of U* = 4.3, 5.5, 6.8, and 8 will be employed to showcase the characteristics in the initial, upper, transition, and lower branches of response, respectively. Figures 4, 5, respectively, show time series of the drag and lift components of the instantaneous hydrodynamic force at the selected reduced velocities. The drag displays fluctuations about a non-zero mean level whereas the lift displays fluctuations about the zero level. The amplitude of fluctuations of both components appears to be correlated with the amplitude of cylinder oscillation, a point which will be addressed further below (see section 4.1). At U* = 6.8, the transition from the lower-branch mode of low drag to the upper-branch mode of comparably high drag can be noticed. Another interesting feature is that fluctuations of both drag and lift components are more regular than the corresponding fluctuations of the streamwise and transverse components (not shown here for economy of space), i.e., magnitude modulations are less pronounced.
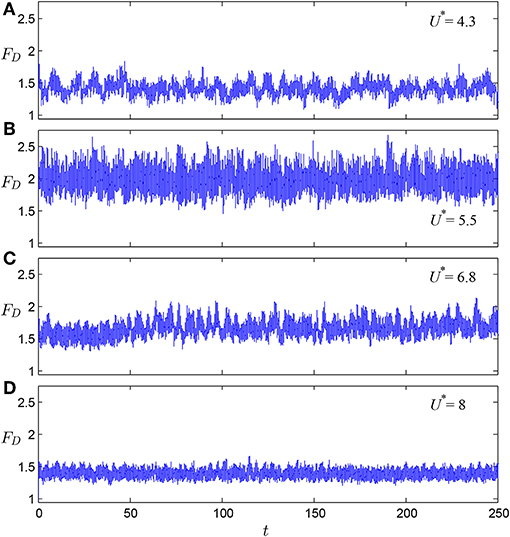
Figure 4. Time series of the drag component at different reduced velocities: (A) U* = 4.3 (initial branch), (B) U* = 5.5 (upper branch), (C) U* = 6.8 (transition), and (D) U* = 8 (lower branch).
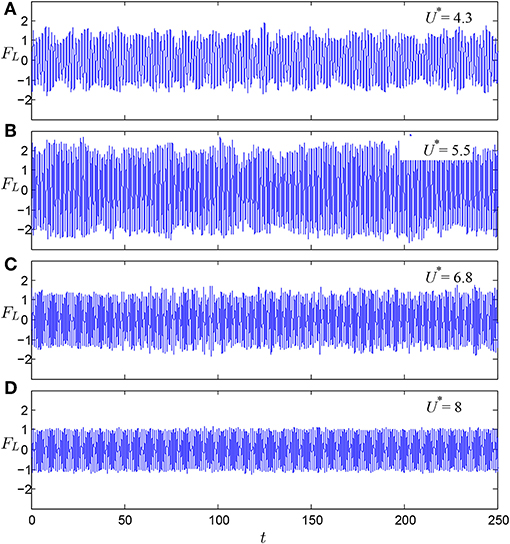
Figure 5. Time series of the lift component at different reduced velocities: (A) U* = 4.3 (initial branch), (B) U* = 5.5 (upper branch), (C) U* = 6.8 (transition), and (D) U* = 8 (lower branch).
Figure 6 presents spectral distributions of the drag and lift components, which were obtained using the Fast Fourier Transform (window-averaged). The instantaneous drag fluctuates at twice the frequency of cylinder oscillation whereas the instantaneous lift fluctuates at the frequency of cylinder oscillation. The fluctuations of both components are nearly pure tone but some small-frequency modulations of the drag are evident at U* = 4.3 and 6.8. At U* = 6.8, a band of increased power on the right-hand-side of the main spectral peak reflects the bistable dynamics governing the transition between the lower-branch and upper-branch modes.
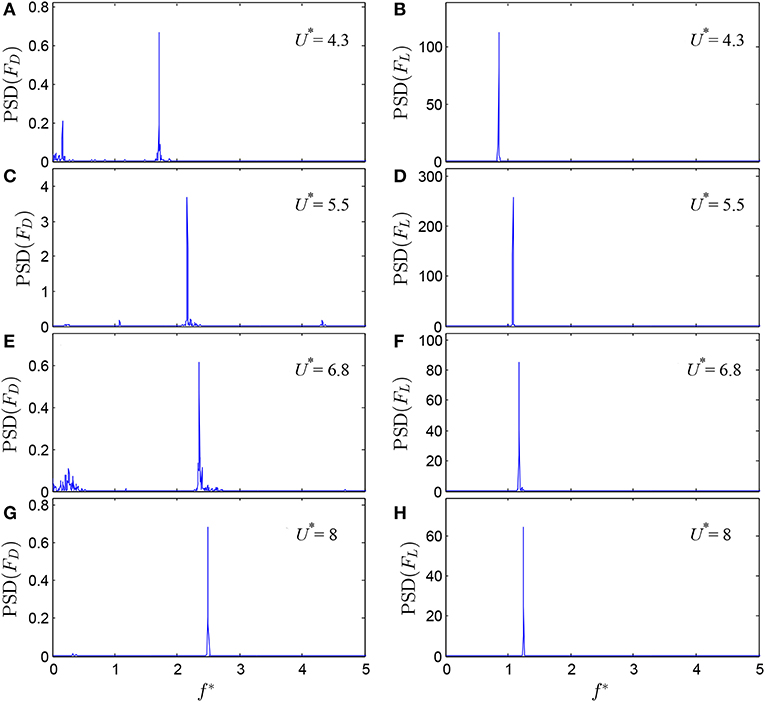
Figure 6. Spectra of the drag (left column) and lift (right column) at different reduced velocities: (A,B) U* = 4.3 (initial branch), (C,D) U* = 5.5 (upper branch), (E,F) U* = 6.8 (transition), and (G,H) U* = 8 (lower branch).
The energy transfer from the fluid to the cylinder is one of the most important output variables in the present study. The instantaneous rate of energy transfer from the fluid to the structure can be calculated as Ėstruct(t) = Fy(t)ẏ(t). Figure 7 shows Ėstruct(t) time series for different reduced velocities. It can be seen that Ė(t) oscillates between negative and positive values about approximately the zero level for all reduced velocities. Apparently, the average energy transfer (over a number of oscillation cycles) must be positive in VIV to overcome the energy lost via the action of structural damping. However, the amount of energy required to sustain the oscillations is very low if the structural damping is very low. The time histories of the energy-transfer rate that are plotted in Figure 7, display differences between the response branches. In the initial (U* = 4.3) and upper (U* = 5.5) branches, Ėstruct(t) displays considerable modulations whereas the modulations are relatively weak in the lower branch (U* = 8). At U* = 6.8, we can notice the transition from the lower-branch mode (relatively weak modulations for t < 40 s) to the upper-branch mode (relatively strong modulations for t > 50 s). Such modulations stem from corresponding modulations in both ẏ(t) and Fy(t), which illustrate the non-linear coupling between the driving force and the motion of the cylinder. This partly stems from the fact that the energy transfer to the structure is only a small fraction of the energy dissipated in the fluid, which will be quantified further below.
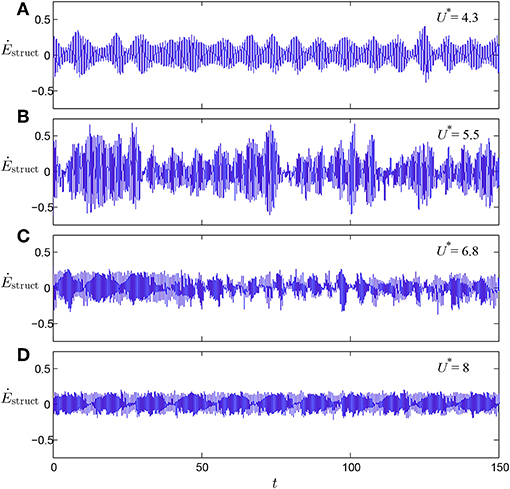
Figure 7. Time series of the rate of energy transfer from the fluid to the structure at different reduced velocities: (A) U* = 4.3, (B) U* = 5.5, (C) U* = 6.8, (D) = 8.
The rate of energy transfer to the structure can be decomposed into the rate of work done by the drag and lift components of the force, which may be written as
where ĖD = ẏj · FD = ẏFDy and ĖL = ẏj · FL = ẏFLy. Figure 8 shows time series of ĖD(t) (colored blue) and ĖL(t) (red) at selected reduced velocities. First, it can be seen that both ĖD(t) and ĖL(t) display oscillations which are closely related, e.g., amplitude peaks appear as mirrored. The instantaneous rate of energy transfer due to the drag component is negative at all times and approaches zero at a point during each oscillation cycle. Minimum absolute values of ĖD are of the order of 10−5. The fact that ĖD(t) remains negative at all times demonstrates that the drag component is a purely damping force in agreement with the theoretical considerations laid down in the introduction. This contrasts with ĖL(t), which is positive most of the time but typically attains slightly negative values over a small portion during each oscillation cycle. The most negative values of ĖL(t) are comparable to the minimum values of ĖD(t) in the initial branch (U* = 4.3). In the other cases (U* = 5.5, 6.8, and 8), the most negative values are quite small compared to the maximum positive values of ĖL(t). The average of ĖL(t) is positive at all reduced velocities. Therefore, we can conclude from the above that the drag component only does negative work on the oscillating cylinder whereas the lift component mostly does positive work.
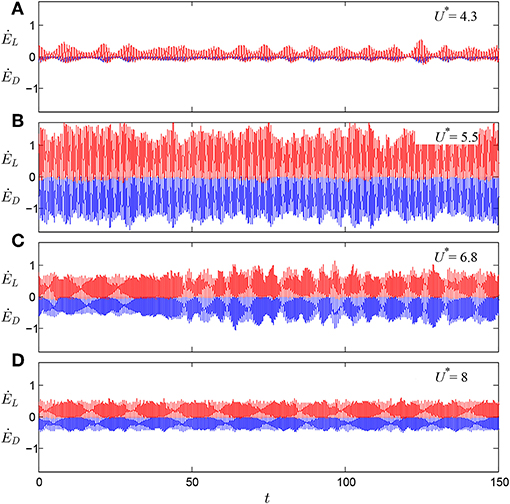
Figure 8. Time series of ĖD(t) (colored blue) and ĖL(t) (red) at different reduced velocities, (A) U* = 4.3, (B) U* = 5.5, (C) U* = 6.8, (D) U* = 8.
The average rate of energy transfer, or rate of work, over a sufficiently large period of time T can be calculated as
Figure 9 shows the variation of the average rate of negative work done by the drag component, 〈−ĖD〉 and the average rate of positive work done by the lift component, 〈ĖL〉. Over the entire reduced velocity range, 〈−ĖD〉 and 〈ĖL〉 are nearly equal. The average rate is high in the upper branch, moderate in the lower branch, and low in initial branch while it is negligible for low and high reduced velocities where desynchronized oscillations occur. The difference 〈ĖL〉−〈−ĖD〉 yields the average rate of energy transfer to the structure, 〈Ėstruct〉, which is very low compared to 〈−ĖD〉 and 〈−ĖL〉.
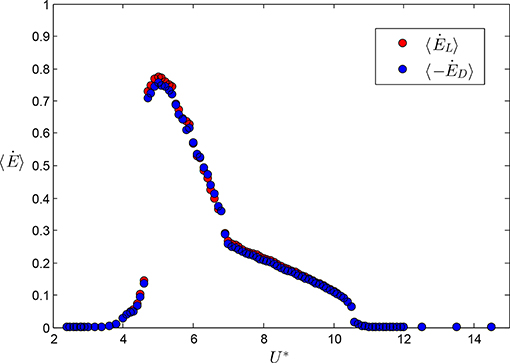
Figure 9. Variation of the average rate of work done by the drag and lift components of the hydrodynamic force, 〈−ĖD〉 and 〈ĖL〉 respectively, with the reduced velocity, U*.
4. Discussion
4.1. Excitation Coefficient
We have noted in the results that the magnitude of the unsteady lift component seems to be correlated with the amplitude of cylinder oscillation. We will denote CL to be the mean magnitude of the unsteady lift. Returning to Equation (3), we may note that, for a hydro-elastic system of given mass ratio, m*, and damping ratio, ζ, the excitation coefficient in-phase with the velocity of the cylinder, Cv, is proportional to A*f*/U*2. Figure 10 shows the variation of CL (instead of Cv) as function of A*f*/U*2. It can be clearly seen that CL is also proportional to A*f*/U*2 as Cv is expected to be from the linear theory. We can thus write
As seen in Figure 10, the proportionality factor (slope of the line) is higher for data that correspond to the initial branch than for data in all other remaining branches. A separate straight line is fitted to the data in the initial branch. The data in the upper and lower branches collapse very well on another straight line. Both lines provide excellent fits to separate data zones. The difference in the proportionality factor might be attributable to the different dynamics in the initial branch (beating oscillations) and in the upper and lower branches (synchronized oscillations) [18]. That is, the linear theory might be less accurate in the initial branch. To recapitulate, the lift not only is the sole component that can provide fluid excitation as shown above, but also displays the same scaling with A*f*/U*2 as the linear theory (Equation 3) predicts for the traditional excitation coefficient in-phase with the cylinder velocity, Cv.
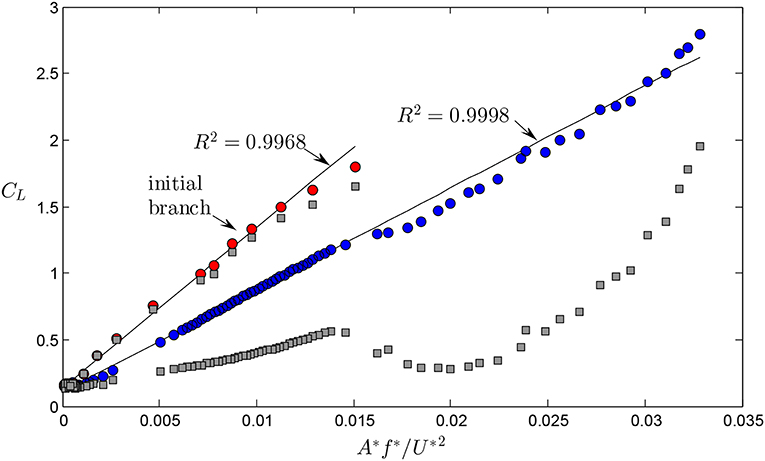
Figure 10. Variation of the mean magnitude of the unsteady lift, CL, with the combined parameter A*f*/U*2 (circles). Red-filled circles correspond to data from the initial branch while blue-filled symbols correspond to all other branches. Square symbols show the variation of the magnitude of the transverse force, Cy (see text).
The above result is not trivial because Cv is the hydrodynamic coefficient in-phase with the velocity of the oscillating cylinder whereas CL is the hydrodynamic coefficient of the lift component acting normal to the instantaneous vector of the relative velocity between the oscillating cylinder and the free stream. That is, Cv includes the net contribution due to fluid excitation and fluid damping whereas CL represents pure fluid excitation. Arithmetically, CL is two orders of magnitude higher than Cv, whose value is very sensitive to the phase of the driving force with respect to the motion (phasor). Equation (3) shows that Cv is a linear function of m* and ζ, i.e., Cv depends on the mechanical properties of the hydro-elastic system. However, CL does not represent a phasor but rather a directional component of the actual hydrodynamic force on the oscillating cylinder and, therefore, may be expected to depend only on fluid-dynamical parameters, i.e., on the normalized amplitude and frequency as well as on the Reynolds number. It may be even insensitive to whether the motion is free (self-excited) or forced.
The above arguments can be supported by comparing CL from configurations with different mass and damping ratios. However, in previous works a lift coefficient that represents the magnitude of the unsteady transverse force is usually reported. For clarity, the traditional lift coefficient will be denoted Cy. Note that . The lift coefficient defined here, CL, where the lift changes direction with the cylinder oscillation, has not been reported previously. Figure 10 includes our Cy data against the combined parameter A*f*/U*2. Overall, the variation of Cy is far more complex than that of CL and does not show a correlation with the scaling factor, therefore is more difficult to decipher. However, it can be readily seen that Cy exhibits distinct trends in each response branch. In the upper and lower branches, CL generally is much higher than Cy by up to a factor of 5 in the middle of the upper branch whereas CL≈Cy in the initial branch.
An early experimental study by Diana and Falco [19] is a particularly useful source of data to compare with for reasons that will become clearer below. Diana and Falco [19] measured with a dynamometer the forces on a flexibly-mounted rigid cylinder undergoing vortex-induced vibration in a stream of air. The mass and damping ratios were not quantified but it is expected that in air and they reported that damping was as low as possible in order to reach oscillation amplitudes above 0.7 diameters. From their measurements, they formulated an empirical expression that may be written in the present notation as
where S is the Strouhal number. In fact, Diana and Falco [19] employed the velocity ratio r = 1/(U*S) to compile their data. Equation (11) suggests a slightly different scaling of the lift coefficient than Equation (10) does. It should be remembered that [19] actually measured the magnitude of the transverse force, Cy. Nevertheless, the utility of Equation (11) is that it provides a scaling factor against which we can compare the present data. Figure 11 shows a plot of CL using the scaling from Equation (11). A best linear fit to data including all response branches from the present study yields a proportionality factor of 3.5 that may be compared to the value of 4.5 in the empirical formula in Equation (11). However, their empirical formula (Equation 11) fits the present data quite well at low values of the scaling parameter, A*/(U*S)2, it particularly fits the data in the initial branch well. A linear best fit to the present data in the initial branch only yields a slope of 4.6, which essentially coincides with the empirical formula by Diana and Falco [19]. This coincidence may be explained by the fact for a mass ratio of the order of 100, the VIV response does not display the upper branch [4]. It is also evident from their plot of the lift coefficient, Cy, with the normalized amplitude (their Figure 13) that the factor of 4.5 refers to data at amplitudes less than 0.4, i.e., amplitudes that correspond to the initial branch in the present experiments. The best linear fit to all our data passes through the data in the upper branch but it works less satisfactorily in the initial and lower branches. Furthermore, it should be noted that the data in the lower branch also follow a linear trend very well with a slope slightly lower than 4.5. The Reynolds number for their experiments varied in the range 2 × 10³ − 6.5 × 10⁴, i.e., the lowest Re number in their tests is approximately twice as high as that in our study and their highest Re is also higher by an order of magnitude. Therefore, the Reynolds number may be contributing but its effect appears to be small. Overall, the collapse of the data in the plot of CL against A*/(U*S)2 is clearly better than that against A*f*/U2, the physics behind this may warrant some further investigation. The agreement between the empirical formula by Diana and Falco [19] obtained from measurements in air (i.e., m* of the order of 100) with the trend of the data from present measurements obtained in water (m* = 3), barring differences that have been accounted for, provides evidence that the present excitation coefficient, CL, is independent of the mechanical properties of the system.
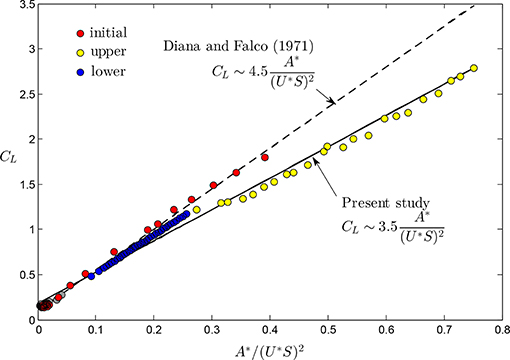
Figure 11. Variation of the mean magnitude of the unsteady lift, CL, with the combined parameter A*/(U*S)2. The solid line is a best linear fit to all our data that are indicated by the symbols, from VIV measurements in water. The dashed line is an empirical expression developed by Diana and Falco [19] from VIV measurements in air.
4.2. Effective Drag Coefficient
The energy transferred from the fluid to the structure is eventually dissipated in the structural damping. The structure itself also causes energy dissipation in the fluid whose instantaneous rate is given by Ėfluid(t) = FD(t)U(t). We may assume that if there were no structure placed in the free stream, there would be no dissipation in the fluid. Figure 12 shows the corresponding times series of Ėfluid where it can be seen that Ėfluid is fluctuating but is always positive, in contrast to Ėstruct (cf. Figure 7). Konstantinidis [11] defined an effective drag coefficient that represents the average rate of energy dissipation in the fluid as
Figure 13 shows the variation of the effective drag coefficient, CDeff, along with the mean drag coefficient, CDmean, which is the mean of the drag component aligned with the instantaneous relative velocity, and the apparent drag coefficient, CDapp, which is the mean of the streamwise force, i.e., the usual mean drag coefficient. The apparent drag coefficient, CDapp, attains a peak value of 2.5 at U* = 5.2, a value that can be compared to that reported by Khalak and Williamson [4]; they found a peak value of approximately 3.4 at a similar reduced velocity for a system with a mass ratio of 10.1. CDmean varies in a similar fashion as does CDapp with the reduced velocity but generally CDmean takes lower values than CDapp does. The effective drag coefficient, CDeff, is even lower than CDmean, which in turn is lower than CDapp, particularly in the upper and lower branches. For the low and high ends of the reduced velocity range where the response amplitude is negligible, all three coefficients are equal. CDeff attains a peak level at the end of the initial region followed by a noticeable drop upon transition to the upper branch. Similar drops have been previously observed in compilations of VIV data from other studies (see [11]). This consistent finding implies that the wake flow can dissipate energy more vigorously at the end of the initial branch rather than at the start of the upper branch, which might be attributed to the fact that the cylinder oscillation and the vortex shedding are quasi-periodic in the initial branch [18]. The effective drag coefficient, CDapp, attains another local maximum in the middle of the upper branch where the amplitude of cylinder oscillation is also maximum. Overall, the effective drag coefficient in comparison to the apparent and the mean drag coefficients, does not change considerably with the reduced velocity. This might indicate that there are no vast changes of the wake flow in different response branches in terms of the capacity to dissipate the kinetic energy of the fluid.
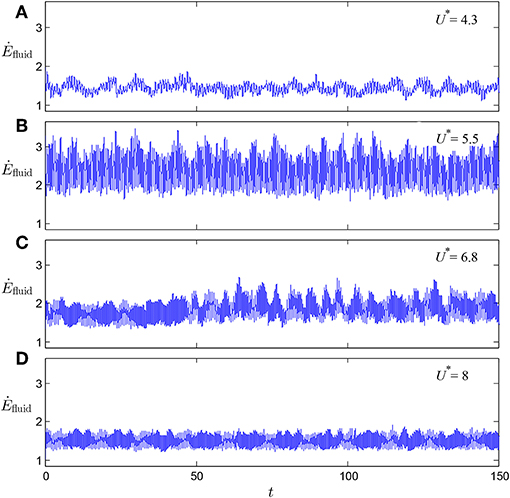
Figure 12. Time series of the rate at which energy is dissipated in the fluid at different reduced velocities: (A) U* = 4.3, (B) U* = 5.5, (C) U* = 6.8, (D) U* = 8.
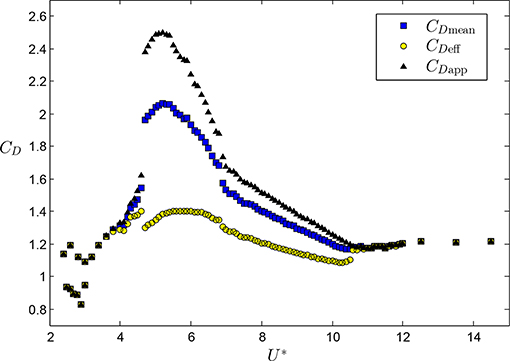
Figure 13. Variation of the mean, effective, and apparent drag coefficients with reduced velocity.
Data Availability Statement
The datasets generated for this study are available on request to the corresponding author.
Author Contributions
All authors listed have made a substantial, direct and intellectual contribution to the work, and approved it for publication.
Conflict of Interest
The authors declare that the research was conducted in the absence of any commercial or financial relationships that could be construed as a potential conflict of interest.
Acknowledgments
JL, JS, and DL acknowledge the financial support of the Australian Research Council via Discovery Project DP150103177 and DP150102879. JZ and JS acknowledge the support of the Australian Research Council via Discovery DP170100275.
References
1. Bearman PW. Vortex shedding from oscillating bluff bodies. Ann Rev Fluid Mech. (1984) 16:195–222. doi: 10.1146/annurev.fl.16.010184.001211
2. Sarpkaya T. A critical review of the intrinsic nature nature of vortex-induced vibrations. J Fluids Struct. (2004) 19:389–447. doi: 10.1016/S0889-9746(04)00035-0
3. Williamson CHK, Govardhan R. Vortex-induced vibrations. Ann Rev Fluid Mech. (2004) 36:413–55. doi: 10.1146/annurev.fluid.36.050802.122128
4. Khalak A, Williamson CHK. Fluid forces and dynamics of a hydroelastic structure with very low mass and damping. J Fluids Struct. (1997) 11:973–82. doi: 10.1006/jfls.1997.0110
5. Feng CC. The measurement of vortex induced effects in flow past stationary and oscillating circular and D-section cylinders. (Master's thesis). Vancouver, BC: The University of British Columbia (1968).
6. Jiang R, Lin J, Chen Z. Vibrations of cylindrical objects obstructing a poiseuille-type flow. Phys Rev E. (2013) 88:023009. doi: 10.1103/PhysRevE.88.023009
7. Jiang R, Lin J, Tu C. Poiseuille flow-induced vibrations of a cylinder in subcritical conditions. J Fluids Struct. (2018) 82:272–86. doi: 10.1016/j.jfluidstructs.2018.07.004
8. Naudascher E, Rockwell D. Flow-Induced Vibrations: An Engineering Guide, 1st Edn. Rotterdam: A.A. Balkema Publishers (1994).
9. Morse TL, Williamson CHK. Prediction of vortex-induced vibration response by employing controlled motion. J Fluid Mech. (2009) 634:5–39. doi: 10.1017/S0022112009990516
10. Blevins RD. Models for vortex-induced vibration of cylinders based on measured forces. J Fluids Eng Trans ASME. (2009) 131:1–9. doi: 10.1115/1.3222906
11. Konstantinidis E. Apparent and effective drag for circular cylinders oscillating transverse to a free stream. J Fluids Struct. (2013) 39:418–26. doi: 10.1016/j.jfluidstructs.2013.03.001
12. Kaiktsis L, Triantafyllou GS, Özbas M. Excitation, inertia, and drag forces on a cylinder vibrating transversely to a steady flow. J Fluids Struct. (2007) 23:1–21. doi: 10.1016/j.jfluidstructs.2006.08.006
13. Nemes A, Zhao J, Lo Jacono D, Sheridan J. The interaction between flow-induced vibration mechanisms of a square cylinder with varying angles of attack. J Fluid Mech. (2012) 710:102–30. doi: 10.1017/jfm.2012.353
14. Zhao J, Leontini JS, Lo Jacono D, Sheridan J. Chaotic vortex induced vibrations. Phys Fluids. (2014) 26:121702. doi: 10.1063/1.4904975
15. Zhao J, Leontini J, Lo Jacono D, Sheridan J. Fluid-structure interaction of a square cylinder at different angles of attack. J Fluid Mech. (2014) 747:688–721. doi: 10.1017/jfm.2014.167
16. Zhao J, Nemes A, Lo Jacono D, Sheridan J. Branch/mode competition in the flow-induced vibration of a square cylinder. Philos Trans R Soc Lond A. (2018) 376:20170243. doi: 10.1098/rsta.2017.0243
17. Bearman P, Branković M. Experimental studies of passive control of vortex-induced vibration. Eur J Mech. (2004) 23:9–15. doi: 10.1016/j.euromechflu.2003.06.002
18. Khalak A, Williamson CHK. Motions, forces and mode transitions in vortex-induced vibrations at low mass-damping. J Fluids Struct. (1999) 13:813–51. doi: 10.1006/jfls.1999.0236
Keywords: flow-structure interaction, hydrodynamics, hydro-elasticity, vortex shedding, relative velocity
Citation: Konstantinidis E, Zhao J, Leontini J, Lo Jacono D and Sheridan J (2019) Excitation and Damping Fluid Forces on a Cylinder Undergoing Vortex-Induced Vibration. Front. Phys. 7:185. doi: 10.3389/fphy.2019.00185
Received: 05 March 2019; Accepted: 29 October 2019;
Published: 20 November 2019.
Edited by:
Lev Shchur, Landau Institute for Theoretical Physics, RussiaReviewed by:
Muktish Acharyya, Presidency University, IndiaJian Zhong Lin, Zhejiang University, China
Copyright © 2019 Konstantinidis, Zhao, Leontini, Lo Jacono and Sheridan. This is an open-access article distributed under the terms of the Creative Commons Attribution License (CC BY). The use, distribution or reproduction in other forums is permitted, provided the original author(s) and the copyright owner(s) are credited and that the original publication in this journal is cited, in accordance with accepted academic practice. No use, distribution or reproduction is permitted which does not comply with these terms.
*Correspondence: David Lo Jacono, ZGF2aWQubG9qYWNvbm9AaW1mdC5mcg==