 Chao Zhang
 Heiko Rieger
- Theoretical Physics, Saarland University, Saarbrücken, Germany
We use quantum Monte Carlo simulations with the worm algorithm to study the phase diagram of a two-dimensional Bose-Hubbard model with cavity-mediated long-range interactions and uncorrelated disorder in the hard-core limit. Our study shows the system is in a supersolid phase at weak disorder and a disordered solid phase at stronger disorder. Due to long-range interactions, a large co-exist region of density-wave and Mott insulator phases exists in both clean and disordered systems. By comparing the phase diagrams for both clean and disordered systems, we find that disorder suppresses superfluidity and narrows the co-exist region caused by first order phase transition. We compare these results with the phase diagram of the extended Bose-Hubbard model with nearest-neighbor interactions. Here, the supersolid phase does not exist even at weak disorder. We identify two kinds of glassy phases: a Bose glass phase and a disordered solid phase. The glassy phases intervene between the density-wave and superfluid phases as the Griffiths phase of the Bose-Hubbard model. The disordered solid phase intervenes between the density-wave and Bose glass phases since both have a finite structure factor.
1. Introduction
The study of adding disorder to interacting many-body bosonic systems attracts significant attention both experimentally and theoretically [1–14]. Experimentally, ultracold atoms in optical lattices are a promising tool to study quantum phases and quantum phase transitions in strongly correlated quantum many-body systems. It provides a unique possibility for engineering matter with an unprecedented level of control over the parameters entering the Hamiltonian. On one hand, short-range interactions can be realized using Feshbach resonances, while long-range interactions have been studied using ultracold gases of particles with large magnetic or electronic dipole moments [15–17], polar molecules [18, 19], atoms in Rydberg states [20–22], or cavity-mediated interactions [23, 24]. On the other hand, disordered potential can be introduced artificially into the ultracold atomic gases in optical lattices. Speckle patterns are most commonly used to produce the random potential [2, 25, 26]. Bichromatic lattices [27], the introduction of localized atomic impurities [4], and holographic techniques that produce point-like disorder [28] are also used to engineer disorder experimentally.
The effect of disorder on the phases and phase transitions of quantum many-body systems triggered many theoretical studies [29–31]. The disordered Bose-Hubbard model (DBHM) allows one to study the interplay between disorder and interactions of ultracold bosons in optical lattices. In the phase diagram of the DBHM, the gapless Bose glass (BG) phase, characterized by a finite compressibility and absence of an off-diagonal long-range order, always intervenes as a Griffiths phase between the superfluid (SF) and Mott insulator (MI) phases [32, 33]. The original DBHM focuses on short-range on-site interactions [34]. Recently, long-range interactions have started to attract the focus of theoretical research. In the absence of disorder and with long-range interactions, the BHM exhibits a richer phase diagram with additional density wave (DW) and supersolid (SS) phases [35–38]. The ground state phase diagram of the extended BHM with cavity-mediated long-range interactions has been investigated extensively with the help of mean-field theory [37, 39–42], Gutzwiller ansatz [38, 43], quantum Monte Carlo [36, 38, 41], and Variational Monte-Carlo [44] methods in 1D, 2D, and 3D. The addition of disorder to the BHM with long-range interactions leads to additional phases. In our recent study, we found that in the DBMH, long-range interactions enhance the supersolid phase [45]. However, a study of the DBHM with cavity-mediated long-range interactions in the hard-core limit is still lacking. In the hard-core limit and without disorder, equilibrium phases of lattice bosons with cavity-mediated long-range interactions were investigated in Iglói et al. [46] and Bla et al. [47] in 1D; the result showed that the checkerboard supersolid did not exist. In 2D with nearest-neighbor interactions [48], however, the result showed that the checkerboard supersolid was unstable. However, in the presence of disorder and with a hard-core limit, whether the supersolid phase exists or not is still unknown.
In this paper, we use quantum Monte Carlo simulations with the worm algorithm [49] to study the phase diagram of the two-dimensional disordered Bose-Hubbard model with a cavity-mediated long-range interaction. To compare the effects of cavity-mediated long-range interactions with nearest-neighbor interactions, we also study the extended BHM with nearest-neighbor interactions in the hard-core limit. The paper is organized as follows: in section 2, we introduce the Hamiltonian of the system of hard-core bosons with cavity-mediated long-range and nearest-neighbor interactions in the presence of disorder. In section 3.1, we present the phase diagrams of hard-core bosons in the two-dimensional lattice with cavity-mediated long-range interactions for both clean and disordered systems. We also study the phase diagram of hard-core bosons in the two-dimensional lattice with nearest-neighbor interactions for both clean and disordered systems in section 3.2. Section 4 compares phase diagrams of the BHM with cavity-mediated long-range interactions with nearest-neighbor interactions and discusses briefly the experimental realization of above models.
2. Hamiltonian
We consider bosons trapped in an optical lattice with both short-range on-site and cavity-mediated long-range interactions in the presence of disorder in the hard-core limit. The bosons are trapped in a two-dimensional (2D) square lattice with linear size L and periodic boundary conditions. The hard-core limit corresponds to large on-site interactions where the occupation of two bosons on the same lattice site is suppressed. The system is described by the Hamiltonian [35–37]:
Here the first term is the kinetic energy characterized by the hopping amplitude t. 〈…〉 denotes nearest neighboring sites, (ai) are the bosonic creation (annihilation) operators satisfying the usual bosonic commutation relations, and is the particle number operator. The second term is the cavity-mediated long-range interaction with interaction strength Ul, the summations i ∈ e and j ∈ o denote summing over even and odd lattice sites, respectively [37]. The third term is the chemical potential term with chemical potential μ shifted by the on-site random potential εi, where εi is uniformly distributed within the range [−Δ, Δ]. Δ is the disorder strength. The hard-core condition implies that sites with more than one atom are energetically suppressed due to a large on-site interaction energy penalty. In this limit, the usual on-site interaction term of the Bose-Hubbard model does not play any role. The maximum atom per site is one. The unit of energy and length are set to be the hopping amplitude t. For each μ/Ul, t/Ul, and Δ/t, we average over 200–400 realizations of disorder.
We also consider the extended Bose-Hubbard model with nearest-neighbor interactions in the presence of disorder in the hard-core limit. The Hamiltonian is written as:
Here, the first term is the kinetic energy with hopping amplitude t. The second term is the repulsive interaction with interaction strength Unn between bosons on the nearest neighboring sites. The third term is the random potential term coupled with the chemical potential term. For each μ/Unn, t/Unn, and Δ/t, we average over 1,000–3,000 realizations of disorder.
3. Ground State Phase Diagrams
In this section, we present the ground state phase diagram of the extended BHM with cavity-mediated long-range interactions Ul (model 1) in section 3.1 and nearest-neighbor interactions Unn (model 2) in section 3.2 in the hard-core limit for both clean and disordered systems, respectively. To obtain the phase diagram for cavity-mediated long-range interactions (Figure 1) and nearest-neighbor interactions (Figure 4), we measure the superfluid stiffness, compressibility, and structure factor to separate those quantum phases. Different phases can be distinguished by the different combinations of those order parameters. Table 1 shows quantum phases and corresponding parameters associated to the phase we find in phase diagrams Figures 1, 4.
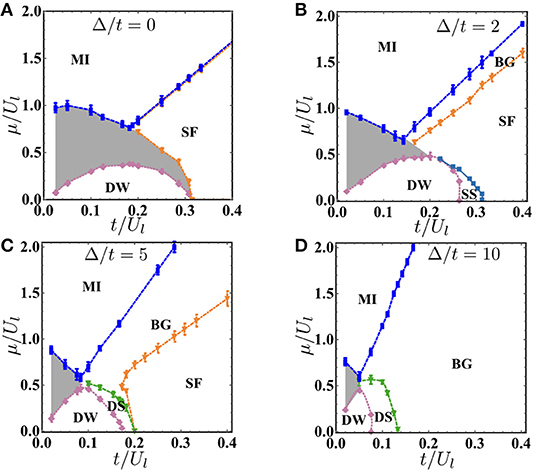
Figure 1. Ground state phase diagrams of model 1 as a function of t/Ul and μ/Ul for clean system (A), and disordered system with disorder strength Δ/t = 2 (B), 5 (C), and 10 (D), respectively. The gray shadowed region is the co-exist region due to first-order phase transition.
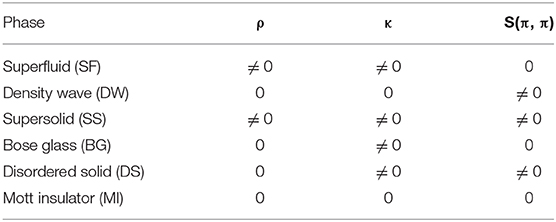
Table 1. Quantum phases and the corresponding parameters: superfluid stiffness ρ, structure factor S(π, π), and compressibility κ.
The superfluid (SF) phase is characterized by a finite superfluid stiffness, which is easily accessible in the QMC simulations by calculating the winding number ρ = 〈W2〉/dLd−2β [50]. Here, W is the winding number, d = 2 is the dimension of the system, L is the linear size of the system, and β is the inverse temperature. The density wave (DW) phase has a finite structure factor that is defined as . Here, k is the reciprocal lattice vector and k = (π, π). The supersolid (SS) phase possesses both the diagonal long-range order and off-diagonal long-range order, and it is characterized by finite ρ and S(π, π). Both the disordered solid (DS) phase and the Bose glass (BG) phase are characterized by a finite compressibility, the difference between them is that DS phase has a finite structure factor. The compressibility measures the density fluctuations and it is defined as: κ = β(〈n2〉 − 〈n〉2). The Mott insulator (MI) phase has zero superfluid stiffness, zero compressibility, and zero structure factor.
3.1. Cavity-Mediated Long-Range Interaction
Figure 1 shows the ground state phase diagram of hard-core bosons trapped in a two-dimensional optical lattice with cavity-mediated long-range interactions for both clean (Figure 1A) and disordered systems (Figures 1B–D), respectively. The x-axis is t/Ul and the y-axis is μ/Ul where t is the hopping amplitude, Ul is the strength of cavity-mediated long-range interactions, and μ is the chemical potential. Here we set the hopping amplitude t = 1. The phase boundary is determined by considering cuts through the x axis (t/Ul) and calculating the above three order parameters as a function of μ/Ul. A finite-size scaling method is also used to get accurate transition points on the phase boundary.
Figure 1A shows the ground state phase diagram of the clean system. There are three phases in the phase diagram: the SF phase, the MI phase, and the DW phase. The DW to MI or SF phase transition is the first-order phase transition. Due to the hysteresis behavior of first-order phase transition, we cannot determine the phase in the gray shadowed region, and we label it as the co-exist region. Figure 1A shows that the co-exist region surrounds the DW phase for the clean system at a small value of t/Ul. The co-exist region and DW persists until t/Ul = 0.32 ± 0.02. When t/Ul > 0.32, the system stays in the SF phase at a lower filling and MI at an integer filling n = 1. Here, the MI to SF phase transition is the second-order phase transition.
Figure 1B shows the ground state phase diagram at disorder strength Δ/t = 2. As disorder is added to the system, the co-exist region shrinks. Disorder tends to localize bosons and narrowing the co-exist region. Besides the SF, MI, and DW phases, there are two new phases emerging: a BG phase and a supersolid (SS) phase. The BG phase intervenes as a Griffiths phase between the MI and SF phases, and it is explained by the theory of inclusions [32, 33]. The SS phase has both diagonal long-range order and off-diagonal long-range order and is characterized by a finite superfluid stiffness ρ and a finite structure S(π, π). Figure 2A shows the structure factor S(π, π) and superfluid stiffness ρ as a function of μ/Ul for different system sizes L = 8, 10, 12, and 14 (red dots, blue rectangles, green up triangles, and purple diamonds) at disorder strength Δ/t = 2 and t/Ul = 0.2857. Between 0 < μ/Ul < 0.25, the system is in the SS phase with both a finite superfluid stiffness and a finite structure factor. Figure 2B shows the finite-size scaling of structure factor S(π, π), where we plot S(π, π)L2β/ν as a function of μ/Ul for system sizes L = 8, 10, 12, and 14 (the critical exponents 2β/ν = 1.0366(8) correspond to the (2+1)-dimensional Ising universality class [51]). The crossing of different curves marks the transition point at μ/Ul = 0.2 ± 0.05. The insert shows the data collapse result using ν = 0.67 and corresponding to the critical point extracted from the main plot. Here, the SS goes to the SF phase via a second-order phase transition that belongs to the (2+1)-dimensional Ising-type transition.
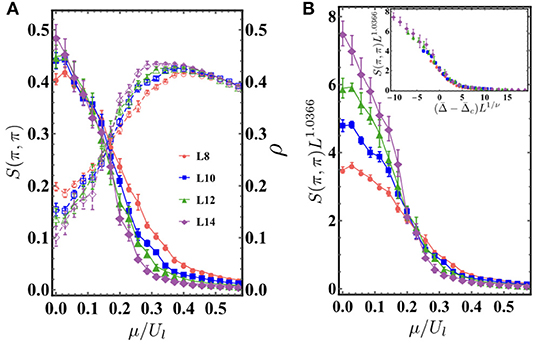
Figure 2. Model 1 (cavity-mediated long-range interactions): all of the following results are at fixed disorder strength Δ/t = 2 and t/Ul = 0.2857. (A) The structure factor S(π, π) and superfluid stiffness ρ as a function of μ/Ul for different system sizes L = 8, 10, 12, and 14 (red dots, blue rectangles, green up triangles, and purple diamonds). (B) The finite size scaling result of structure factor S(π, π) for above system sizes. The crossing of different curves marks a transition point at μ/Ul = 0.2 ± 0.05. Insert shows the data collapse result using ν = 0.67 and corresponding to the critical point extracted from main plot.
Figure 3 shows the finite-size scaling of superfluid stiffness ρ and structure factor S(π, π) as a function of μ/Ul for different system sizes at Δ/t = 2 and t/Ul = 0.25. Dashed lines are the finite-size scaling result of superfluid stiffness. We plot ρLd+z−2 as a function of μ/Ul at t/Ul = 0.25 for a variety of system sizes. Here, z = 1 is the dynamic critical exponent and it is chosen from the previous research [11]. The inverse temperature β = L. The crossing of different curves marks the transition point at μ/Ul = 0.325 ± 0.01. This shows that, at t/Ul = 0.25, the DW to SS phase transition is the second-order phase transition and happens at μ/Ul = 0.325 ± 0.01. Solid lines are the finite-size scaling result of structure factor. The crossing shows that the SS to SF phase transition happens at μ/Ul = 0.368 ± 0.02. At t/Ul = 0.25, the system is in the SS phase at 0.325 < μ/Ul < 0.368.
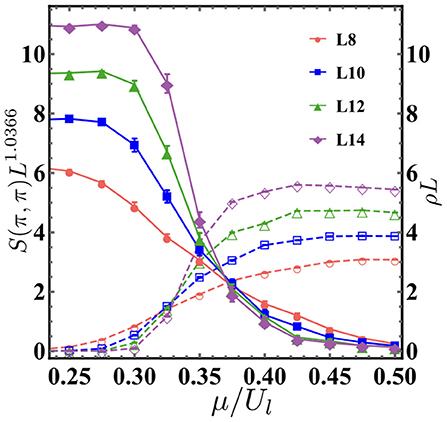
Figure 3. Model 1 (cavity-mediated long-range interactions): the scaling of superfluid stiffness ρL and structure factor S(π, π)L1.0366 as a function of μ/Ul for different system sizes L = 8, 10, 12, and 14 (red dots, blue rectangles, green up triangles, and purple diamonds) at Δ/t = 2 and t/Ul = 0.25. Solid lines represent the structure factor and dashed lines represent superfluid stiffness. The crossing of different solid curves marks the transition point at μ/Ul = 0.325 ± 0.01 for the density wave to supersolid phase transition, while the crossing of different dashed curves marks the transition point at μ/Ul = 0.368 ± 0.02 for the supersolid to superfluid phase transition.
Figure 1C shows the ground state phase diagram at disorder strength Δ/t = 5. As disorder increases, both the co-exist region and SF phases shrink. This is due to the fact that disorder tends to localize bosons and destroy superfluidity. Interestingly, we do not find the SS phase but the DS phase. The DS is characterized by a finite compressibility and a finite structure factor but no superfluid stiffness.
Figure 1D shows the ground state phase diagram at disorder strength Δ/t = 10. At such a strong disorder, there is no SF phase anymore. By comparing phase diagrams in Figure 4, we can see that disorder tends to shrink the co-exist region and destroy superfluidity. The BG phase intervenes as a Griffiths phase between the MI and SF phases. The SS or DS intervenes between the DW and SF phases depending on the strength of disorder.
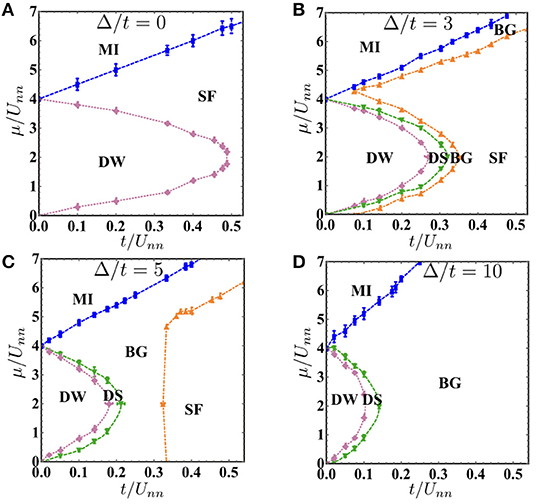
Figure 4. Ground state phase diagrams of model 2 as a function of t/Unn and μ/Unn for clean system (A), and disordered system with disorder strength Δ/t = 3 (B), 5 (C), and 10 (D), respectively.
3.2. Nearest-Neighbor Interaction
In this subsection, we study the ground state phase diagram of hard-core bosons trapped in an optical lattice with nearest-neighbor interactions. The difference between cavity-mediated long-range interactions and nearest-neighbor interactions is that cavity-mediated long-range interactions are global interactions and the interactions between two bosons do not decay with the distance between them, while nearest-neighbor interactions are the interactions between two bosons on nearest neighboring sites. Figure 4 shows ground state phase diagrams for both clean (Figure 4A) and disordered systems (Figures 4B–D), respectively. The x-axis is t/Unn and the y-axis is μ/Unn, where t is the hopping amplitude, Unn is the strength of nearest-neighbor interactions, and μ is the chemical potential. The hopping amplitude is set to t = 1. The phase boundary is determined by using system size L = 16, and the finite size scaling method is also used to get accurate transition points on the phase boundary.
Figure 4A shows the ground state phase diagram of the extended BHM with nearest-neighbor interactions for the clean system. There are three phases in the phase diagram: the SF phase, the MI phase, and the DW phase. Here, the MI to SF phase transition is the second-order phase transition at an integer filling while the DW to SF phase transition is the first-order phase transition at a half filling [48].
Figure 4B shows the ground state phase diagram at disorder strength Δ/t = 3. As disorder is added to the system, the glassy phase (BG and DS) emerges. This can be explained by the theory of inclusions [32, 33], which states that a compressible glassy phase surrounds the incompressible phase. There are two kinds of glassy phase, the BG phase and DS phase. The BG phase is characterized by a finite compressibility κ but zero structure factor S(π, π), while the DS phase is characterized by both a finite compressibility and a finite structure factor. The incompressible phase here is the DW phase. As t/Unn increases, the system goes from the DW to DS phase transition and then the DS to BG phase transition. The DS phase intervenes between the DW and BG phase since both have a finite structure factor. Finite-size scaling method is used to determine all critical points on the phase boundary. As shown in Figure 5, at fixed t/Unn = 0.2, as μ/Unn increases, the DW phase goes to the DS phase first. The main plot of Figure 5A shows the finite-size scaling of S(π, π) at fixed disorder strength Δ/t = 3 and t/Unn = 0.2 for system sizes L = 12, 16, 20, and 24 (red circles, blue rectangles, green up triangles, and orange diamonds, respectively). The crossing of different curves marks the transition point at μ/Unn = 3.275 ± 0.02. Insert shows the data collapse result using ν = 0.67 and corresponding to the critical point extracted from main plot, which shows the DS to BG phase transition belongs to the (2+1)-dimensional Ising-type transition. Figure 5B shows the scaling of superfluid stiffness ρLd+z−2 with z = 1, as a function of μ/Unn for t/Unn = 0.2 and L = 12, 16, 20, and 24. Here, z is the dynamic critical exponent and the inverse temperature β = L is used. The crossing of different curves marks the transition point at μ/Unn = 3.652 ± 0.02, which shows that, at t/Unn = 0.2, the BG to SF phase transition is the second-order phase transition and happens at μ/Unn = 3.652 ± 0.02.
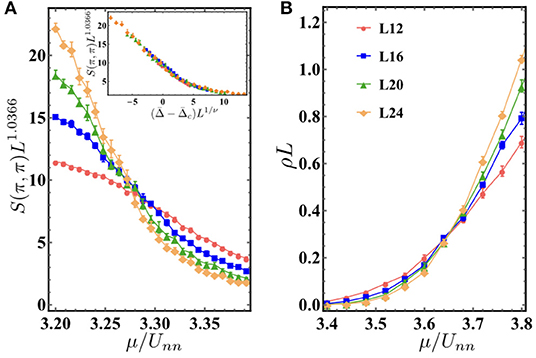
Figure 5. Model 2 (nearest-neighbor repulsive interactions): all following results are at fixed disorder strength Δ/t = 3 and t/Unn = 0.2. (A) Main plot: finite size scaling of S(π, π) for system sizes L = 12, 16, 20, and 24 (red circles, blue rectangles, green up triangles, and orange diamonds, respectively). The crossing of different curves marks the transition point at μ/Unn = 3.275 ± 0.02 for the DS to BG phase transition. Insert shows the data collapse result using ν = 0.67 and corresponding to the critical point extracted from main plot. (B) shows the scaling of superfluid stiffness ρL as a function of μ/Unn for t/Unn = 0.2 for L = 12, 16, 20, and 24. The crossing of different curves marks the transition point at μ/Unn = 3.652 ± 0.02 for the BG to SF phase transition.
Figure 4C shows the ground state phase diagram at disorder strength Δ/t = 5. As disorder increases, the SF phase shrinks. This is because disorder tends to localize bosons and destroy superfluidity. The MI and DW phases also shrink, and we have a large region of BG phase. Figure 6 shows the results at disorder strength Δ/t = 5 and μ/Unn = 2. At a fixed filling factor n = 0.5, as t/Unn increases, the DW phase is unstable and the system goes to the DS phase. Figure 6A shows the compressibility κ as a function of t/Unn for different system sizes L = 16, 20, 24, and 30 (blue rectangles, green up triangles, orange diamonds, and purple down triangles, respectively). Finite size scaling result of compressibility is not obtained due to the exponentially small values of κ around t/Unn = 0.018. However, transition points can be determined by plotting the unscaled compressibility for different system sizes and checking whether they stay zero or not. The compressibility κ stays zero until t/Unn = 0.18 and then becomes finite, which shows that the DW to DS phase transition happens around t/Unn = 0.18 ± 0.01. As t/Unn increases further, the DS becomes unstable, and the system enters the BG phase. Figure 6B shows the finite-size scaling of S(π, π) for above system sizes. The crossing of different curves marks the transition point at t/Unn = 0.212 ± 0.01. Insert shows the data collapse result using ν = 0.67 and corresponding to the critical point extracted from main plot. This shows the DS goes to the BG phase via a second-order phase transition, which belongs to the (2+1)-dimensional Ising type transition. Finally, the BG goes to the SF as t/Unn increases further. Figure 6C shows the finite-size scaling of superfluid stiffness ρL as a function of t/Unn for above system sizes. The crossing of different curves marks the transition point at t/Unn = 0.3241 ± 0.005.
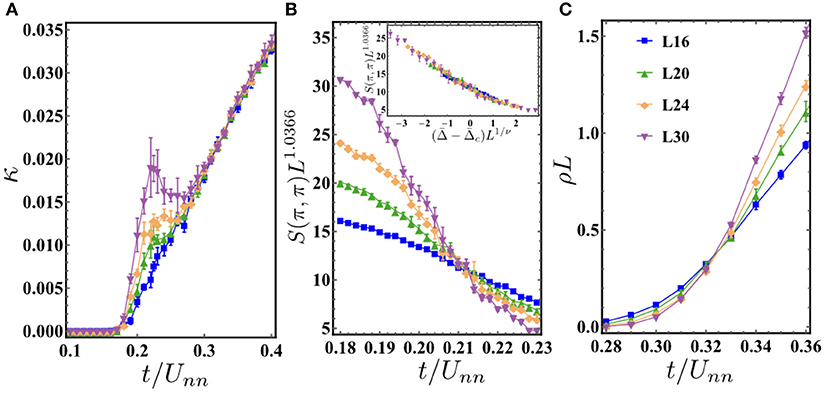
Figure 6. Model 2 (nearest-neighbor repulsive interactions): all following results are at fixed disorder strength Δ/t = 5 and μ/Unn = 2. (A) Compressibility κ as a function of t/Unn for different system sizes L = 16, 20, 24, and 30 (blue rectangles, green up triangles, orange diamonds, and purple down triangles, respectively). The DW to DS phase transition happens around t/Unn = 0.18 ± 0.01. (B) Finite size scaling result of S(π, π) for above system sizes. The crossing of different curves marks the transition point at t/Unn = 0.212 ± 0.01 for the DS to BG phase transition. Insert shows the data collapse result using ν = 0.67 and corresponding to the critical point extracted from main plot. (C) Finite size scaling of superfluid stiffness ρL as a function of t/Unn for above system sizes. The crossing of different curves marks the transition at t/Unn = 0.3241 ± 0.005 for the BG to SF phase transition.
Figure 4D shows the ground state phase diagram at disorder strength Δ/t = 10. At such a strong disorder, there is no SF phase anymore. By comparing phase diagrams in Figure 4, we can see that disorder tends to localize bosons and destroy superfluidity. Compared to the disordered BHM without nearest-neighbor interactions [8], we find that the DW phase cannot go to the BG phase directly as the DS phase intervenes between them.
4. Conclusion
In this paper, we use quantum Monte Carlo simulations with the worm algorithm to study the phase diagram of a two-dimensional Bose-Hubbard model with cavity-mediated long-range interactions for both clean and disordered systems in the hard-core limit. By comparing ground state phase diagrams in Figures 1, 4, we can see that in the absence of disorder, both ground state phase diagrams have SF, MI, and DW phases, while with cavity-mediated long-range interactions, the ground state phase diagram has a large co-exist region. As a disorder is added to the two systems above, a compressible yet gapless Bose Glass phase appearances. The BG phase is intervened between MI and SF phases, which is explained by the theory of inclusions [32, 33]. The non-compressible DW phase cannot go through the SF phase without going through a SS or DS phase with both finite structure factor and finite compressibility. At a lower disorder, we found the SS phase for cavity-mediated long-range interactions and DS phase for nearest-neighbor interactions. Cavity-mediated long-range interactions tend to stabilize the SS phase. A higher disorder destroys ordered phases, and the system stays in the BG phase.
In previous soft-core case [45], we observed a clear separation at zUs/Unn on phase diagrams of the BHM with nearest-neighbor interactions. Here, z is the coordinate number, Us is the onsite interaction, and Unn is the nearest-neighbor interaction. In the hard-core limit, sites with more than one atom are energetically suppressed due to a large onsite interaction, so the usual onsite interaction term of the Bose-Hubbard model does not play any role. In this case, a phase diagram with nearest-neighbor interactions does not have a separation.
The system described in Equations (1) and (2) can be realized experimentally. The BHM with cavity-mediated long-range interactions can be realized by putting an atomic quantum gas trapped in an optical lattice inside a high-finesse optical cavity. Landig et al. [24] realized this model in the soft-core regime. The strength of the short-range on-site interactions is controlled by means of the optical lattice depth. The long-range interaction potential is mediated by a vacuum mode of the cavity and is independently controlled by tuning the cavity resonance. However, rapid experimental advances will allow for the realization of hard-core case in the future. The extended Bose-Hubbard model with nearest-neighbor interactions has been realized in the experiment using dipolar interactions recently [52]. An ultracold gas of strongly magnetic erbium atoms are trapped in a three-dimensional optical lattice, and, in this case, nearest-neighbor interactions are a genuine consequence of the long-range nature of dipolar interactions. While the current experiments operate in the soft-core regime [52], the existence of Feshbach resonances allow one to tune the inter-species interactions to approach the hard-core limit [53, 54].
Data Availability Statement
The datasets generated for this study are available on request to the corresponding author.
Author Contributions
CZ did the analysis and calculation. HR supervised the project. Both authors prepared the manuscript.
Conflict of Interest
The authors declare that the research was conducted in the absence of any commercial or financial relationships that could be construed as a potential conflict of interest.
Acknowledgments
This work was performed with financial support from Saarland University. We would like to thank B. Capogrosso-Sansone for enlightening discussions. The computing for this project was performed at the OU Supercomputing Center for Education & Research (OSCER) at the University of Oklahoma (OU) and the cluster at Saarland University. This manuscript has been released as a Pre-Print at arXiv: 1910.03981.
References
1. Deissler B, Zaccanti M, Roati G, D'Errico C, Fattori M, Modugno M, et al. Delocalization of a disordered bosonic system by repulsive interactions. Nat Phys. (2010) 6:354–8. doi: 10.1038/nphys1635
2. White M, Pasienski M, McKay D, Zhou SQ, Ceperley D, DeMarco B. Strongly interacting bosons in a disordered optical lattice. Phys Rev Lett. (2009) 102:055301. doi: 10.1103/PhysRevLett.102.055301
3. Pasienski M, McKay D, White M, DeMarco B. A disordered insulator in an optical lattice. Nat Phys. (2010) 6:677–80. doi: 10.1038/nphys1726
4. Gadway B, Pertot D, Reeves J, Vogt M, Schneble D. Glassy behavior in a binary atomic mixture. Phys Rev Lett. (2011) 107:145306. doi: 10.1103/PhysRevLett.107.145306
5. D'Errico C, Lucioni E, Tanzi L, Gori L, Roux G, McCulloch IP, et al. Observation of a disordered bosonic insulator from weak to strong interactions. Phys Rev Lett. (2014) 113:095301. doi: 10.1103/PhysRevLett.113.095301
6. Rapsch S, Schollwock U, Zwerger W. Density matrix renormalization group for disordered bosons in one dimension. Europhys Lett. (1999) 46:559–64. doi: 10.1209/epl/i1999-00302-7
7. Krauth W, Trivedi N, Ceperley D. Superfluid-insulator transition in disordered boson systems. Phys Rev Lett. (1991) 67:2307–10. doi: 10.1103/PhysRevLett.67.2307
8. Soyler SG, Kiselev M, Prokof'ev NV, Svistunov BV. Phase diagram of the commensurate two-dimensional disordered Bose-Hubbard model. Phys Rev Lett. (2011) 107:185301. doi: 10.1103/PhysRevLett.107.185301
9. Lin F, Sorensen ES, Ceperley DM. Superfluid-insulator transition in the disordered two-dimensional Bose-Hubbard model. Phys Rev B. (2011) 84:094507. doi: 10.1103/PhysRevB.84.094507
10. Zhang C, Safavi-Naini A, Capogrosso-Sansone B. Equilibrium phases of two-dimensional bosons in quasiperiodic lattices. Phys Rev A. (2015) 91:031604. doi: 10.1103/PhysRevA.91.031604
11. Zhang C, Safavi-Naini A, Capogrosso-Sansone B. Equilibrium phases of dipolar lattice bosons in the presence of random diagonal disorder. Phys Rev A. (2018) 97:013615. doi: 10.1103/PhysRevA.97.013615
12. de Abreu BR, Ray U, Vitiello SA, Ceperley DM. Properties of the superfluid in the disordered Bose-Hubbard model. Phys Rev A. (2018) 98:023628. doi: 10.1103/PhysRevA.98.023628
13. Niederle AE, Rieger H. Superfluid clusters, percolation and phase transitions in the disordered, two-dimensional Bose–Hubbard model. N J Phys. (2013) 15:075029. doi: 10.1088/1367-2630/15/7/075029
14. Zhang C, Capogrosso-Sansone B. Quantum Monte Carlo study of the long-range site-diluted XXZ model as realized by polar molecules. Phys Rev A. (2018) 98:013621. doi: 10.1103/PhysRevA.98.013621
15. Booth D, Rittenhouse ST, Yang J, Sadeghpour HR, Shaffer JP. Production of trilobite Rydberg molecule dimers with kilo-Debye permanent electric dipole moments. Science. (2015) 348:99–102. doi: 10.1126/science.1260722
16. De Paz A, Sharma A, Chotia A, Maréchal E, Huckans JH, Pedri P, et al. Nonequilibrium quantum magnetism in a dipolar lattice gas. Phys Rev Lett. (2013) 111:185305. doi: 10.1103/PhysRevLett.111.185305
17. Lu M, Burdick NQ, Youn SH, Lev BL. Strongly dipolar bose-einstein condensate of dysprosium. Phys Rev Lett. (2011) 107:190401. doi: 10.1103/PhysRevLett.107.190401
18. Yan B, Moses SA, Gadway B, Covey JP, Hazzard KRA, Rey AM, et al. Observation of dipolar spin-exchange interactions with lattice-confined polar molecules. Nature. (2013) 501:521–5. doi: 10.1038/nature12483
19. Hazzard KRA, Gadway B, Foss-Feig M, Yan B, Moses SA, Covey JP, et al. Many-body dynamics of dipolar molecules in an optical lattice. Phys Rev Lett. (2014) 113:195302. doi: 10.1103/PhysRevLett.113.195302
20. Saffman M, Walker TG, Mølmer K. Quantum information with Rydberg atoms. Rev Mod Phys. (2010) 82:2313–63. doi: 10.1103/RevModPhys.82.2313
21. Löw R, Weimer H, Nipper J, Balewski JB, Butscher B, Büchler HP, et al. An experimental and theoretical guide to strongly interacting Rydberg gases. J Phys B Atom Mol Opt Phys. (2012) 45:113001. doi: 10.1088/0953-4075/45/11/113001
22. Gunter G, Schempp H, Robert-de Saint-Vincent M, Gavryusev V, Helmrich S, Hofmann CS, et al. Observing the dynamics of dipole-mediated energy transport by interaction-enhanced imaging. Science. (2013) 342:954–6. doi: 10.1126/science.1244843
23. Baumann K, Guerlin C, Brennecke F, Esslinger T. Dicke quantum phase transition with a superfluid gas in an optical cavity. Nature. (2010) 464:1301–6. doi: 10.1038/nature09009
24. Landig R, Hruby L, Dogra N, Landini M, Mottl R, Donner T, et al. Quantum phases from competing short- and long-range interactions in an optical lattice. Nature. (2016) 532:476–9. doi: 10.1038/nature17409
25. Lye JE, Fallani L, Modugno M, Wiersma DS, Fort C, Inguscio M. Bose-einstein condensate in a random potential. Phys Rev Lett. (2005) 95:070401. doi: 10.1103/PhysRevLett.95.070401
26. Jendrzejewski F, Bernard A, Muller K, Cheinet P, Josse V, Piraud M, et al. Three-dimensional localization of ultracold atoms in an optical disordered potential. Nat Phys. (2012) 8:398–403. doi: 10.1038/nphys2256
27. Fallani L, Lye JE, Guarrera V, Fort C, Inguscio M. Ultracold atoms in a disordered crystal of light: towards a Bose glass. Phys Rev Lett. (2007) 98:130404. doi: 10.1103/PhysRevLett.98.130404
28. Morong W, DeMarco B. Simulation of Anderson localization in two-dimensional ultracold gases for pointlike disorder. Phys Rev A. (2015) 92:023625. doi: 10.1103/PhysRevA.92.023625
29. Pollet L. A review of Monte Carlo simulations for the Bose–Hubbard model with diagonal disorder. Comptes Rendus Phys. (2013) 14:712–24. doi: 10.1016/j.crhy.2013.08.005
30. Vojta T. Disorder in quantum many-body systems. Annu Rev Condens Matt Phys. (2018) 10:233–52. doi: 10.1146/annurev-conmatphys-031218-013433
31. Vojta T. Phases and phase transitions in disordered quantum systems. AIP Conf Proc. (2013) 1550:188–247. doi: 10.1063/1.4818403
32. Pollet L, Prokof'ev NV, Svistunov BV, Troyer M. Absence of a direct superfluid to mott insulator transition in disordered bose systems. Phys Rev Lett. (2009) 103:140402. doi: 10.1103/PhysRevLett.103.140402
33. Gurarie V, Pollet L, Prokof'ev NV, Svistunov BV, Troyer M. Phase diagram of the disordered Bose-Hubbard model. Phys Rev B. (2009) 80:214519. doi: 10.1103/PhysRevB.80.214519
34. Fisher MPA, Weichman PB, Grinstein G, Fisher DS. Boson localization and the superfluid-insulator transition. Phys Rev B. (1989) 40:546–70. doi: 10.1103/PhysRevB.40.546
35. Habibian H, Winter A, Paganelli S, Rieger H, Morigi G. Quantum phases of incommensurate optical lattices due to cavity backaction. Phys Rev A. (2013) 88:043618. doi: 10.1103/PhysRevA.88.043618
36. Habibian H, Winter A, Paganelli S, Rieger H, Morigi G. Bose-glass phases of ultracold atoms due to cavity backaction. Phys Rev Lett. (2013) 110:075304. doi: 10.1103/PhysRevLett.110.075304
37. Niederle AE, Morigi G, Rieger H. Ultracold bosons with cavity-mediated long-range interactions: a local mean-field analysis of the phase diagram. Phys Rev A. (2016) 94:033607. doi: 10.1103/PhysRevA.94.033607
38. Flottat T, de Forges de Parny L, Hébert F, Rousseau VG, Batrouni GG. Phase diagram of bosons in a two-dimensional optical lattice with infinite-range cavity-mediated interactions. Phys Rev B. (2017) 95:144501. doi: 10.1103/PhysRevB.95.144501
39. Keller T, Jäger SB, Morigi G. Phases of cold atoms interacting via photon-mediated long-range forces. J Stat Mech Theor Exp. (2017) 2017:064002. doi: 10.1088/1742-5468/aa71d7
40. Li Y, He L, Hofstetter W. Lattice-supersolid phase of strongly correlated bosons in an optical cavity. Phys Rev A. (2013) 87:051604. doi: 10.1103/PhysRevA.87.051604
41. Dogra N, Brennecke F, Huber SD, Donner T. Phase transitions in a Bose-Hubbard model with cavity-mediated global-range interactions. Phys Rev A. (2016) 94:023632. doi: 10.1103/PhysRevA.94.023632
42. Chen Y, Yu Z, Zhai H. Quantum phase transitions of the Bose-Hubbard model inside a cavity. Phys Rev A. (2016) 93:041601. doi: 10.1103/PhysRevA.93.041601
43. Sundar B, Mueller EJ. Lattice bosons with infinite-range checkerboard interactions. Phys Rev A. (2016) 94:033631. doi: 10.1103/PhysRevA.94.033631
44. Bogner B, De Daniloff C, Rieger H. Variational Monte-Carlo study of the extended Bose-Hubbard model with short- and infinite-range interactions. Eur Phys J B. (2019) 92:111. doi: 10.1140/epjb/e2019-100017-8
45. Zhang C, Rieger H. Phase diagrams of the disordered Bose-Hubbard model with cavity-mediated long-range and nearest-neighbor interactions. arXiv preprints arXiv (2019).
46. Iglói F, Blaß B, Roósz G, Rieger H. Quantum XX model with competing short- and long-range interactions: phases and phase transitions in and out of equilibrium. Phys Rev B. (2018) 98:184415. doi: 10.1103/PhysRevB.98.184415
47. Blaß B, Rieger H, Roósz G, Iglói F. Quantum relaxation and metastability of lattice bosons with cavity-induced long-range interactions. Phys Rev Lett. (2018) 121:095301. doi: 10.1103/PhysRevLett.121.095301
48. Batrouni GG, Scalettar RT. Phase separation in supersolids. Phys Rev Lett. (2000) 84:1599–602. doi: 10.1103/PhysRevLett.84.1599
49. Prokof'ev NV, Svistunov BV, Tupitsyn IS. Exact, complete, and universal continuous-time worldline Monte Carlo approach to the statistics of discrete quantum systems. J Exp Theor Phys. (1998) 87:310–21. doi: 10.1134/1.558661
50. Pollock EL, Ceperley DM. Path-integral computation of superfluid densities. Phys Rev B. (1987) 36:8343–52. doi: 10.1103/PhysRevB.36.8343
51. Hasenbusch M, Pinn K, Vinti S. Critical exponents of the three-dimensional Ising universality class from finite-size scaling with standard and improved actions. Phys Rev B. (1999) 59:11471–83. doi: 10.1103/PhysRevB.59.11471
52. Baier S, Mark MJ, Petter D, Aikawa K, Chomaz L, Cai Z, et al. Extended Bose-Hubbard models with ultracold magnetic atoms. Science. (2016) 352:201–5. doi: 10.1126/science.aac9812
53. Maier T, Ferrier-Barbut I, Kadau H, Schmitt M, Wenzel M, Wink C, et al. Broad universal Feshbach resonances in the chaotic spectrum of dysprosium atoms. Phys Rev A. (2015) 92:060702. doi: 10.1103/PhysRevA.92.060702
Keywords: quantum phase transition (QPT), Bose-Hubbard model, long-range interactions (LRI), quantum Monte Carlo (QMC), optical lattices, cavity mediated interactions, superfluidity, supersolid
Citation: Zhang C and Rieger H (2020) The Effect of Disorder on the Phase Diagrams of Hard-Core Lattice Bosons With Cavity-Mediated Long-Range and Nearest-Neighbor Interactions. Front. Phys. 7:236. doi: 10.3389/fphy.2019.00236
Received: 08 October 2019; Accepted: 16 December 2019;
Published: 24 January 2020.
Edited by:
Erhai Zhao, George Mason University, United StatesReviewed by:
Zi Cai, Shanghai Jiao Tong University, ChinaSayan Choudhury, University of Pittsburgh, United States
Copyright © 2020 Zhang and Rieger. This is an open-access article distributed under the terms of the Creative Commons Attribution License (CC BY). The use, distribution or reproduction in other forums is permitted, provided the original author(s) and the copyright owner(s) are credited and that the original publication in this journal is cited, in accordance with accepted academic practice. No use, distribution or reproduction is permitted which does not comply with these terms.
*Correspondence: Chao Zhang, Y2hhb0BsdXNpLnVuaS1zYi5kZQ==; Heiko Rieger, aC5yaWVnZXJAbXgudW5pLXNhYXJsYW5kLmRl