- 1Department of Computer Science and Engineering and Information Technology, Shiraz University, Shiraz, Iran
- 2Department of Communications and Electronics Engineering Technology, Shiraz University, Shiraz, Iran
- 3Institute for Communication Systems, Home of 5G Innovation Centre, University of Surrey, Guildford, United Kingdom
A terahertz sensor structure is proposed that can sense any variations in analyte permittivity. The sensor essentially works according to the shifts in the resonance frequencies of its propagated spoof surface plasmonic modes. The proposed structure shows great support for surface plasmon oscillations, which is proved by the calculated dispersion diagram. To achieve this in terahertz frequencies, a metamaterial structure is presented in the form of a structure with two-dimensional periodic elements. Afterward, it is shown that the performance of the sensor can be affected by different parameters such as metal stripe thickness, length of metal stripe, and width of metal stripe as the most influential parameters. Each of the parameters mentioned can directly influence on the electric field confinement in the metal structure as well as the strength of propagation modes. Therefore, two propagation modes are compared, and the stronger mode is chosen for sensing purposes. The primary results proved that the quality factors of the resonances are substantially dependent on certain physical parameters. To illustrate this, a numerical parametric sweep on the thickness of the metal stripe is performed, and the output shows that only for some specific dimensions the electromagnetic local field binds strongly with the metal part. In a similar way, a sweeping analysis is run to reveal the outcome of the variation in analyte permittivity. In this section, the sensor demonstrates an average sensitivity value, ~1,550 GHz/Permittivity unit, for a permittivity range between 1 and 2.2, which includes the permittivity of many biological tissues in the terahertz spectrum. Following this, an analysis is presented, in the form of two contour plots, for two electrical parameters, maximum electric field and maximum surface current, based on 24 different paired values of metal thickness and metal width as the two most critical physical parameters. Using the plotted contour diagrams, which are estimated using the bi-harmonic fitting function, the best physical dimension for the maximum capability of the proposed sensor is achieved. As mentioned previously, the proposed sensor can be applied for biological sensing due to the simplicity of its fabrication and its performance.
Introduction
Terahertz science has shown great potential in different applications such as security, medical imaging, and communications [1–6]. One of the main reasons for such interest in this field is the exclusive interaction of terahertz waves with some specific molecules [7–9]. Additionally, due to the low photon energy of terahertz radiation, it is a good candidate for non-destructive test (NDT) applications. Based on these interesting features of terahertz wave, many types of research have been done in the field of terahertz spectroscopy [10–15]. Due to the special and safe interaction of THz wave with biomolecules, THz spectroscopy for biomedical applications has become a rapidly evolving research area [16, 17]. Therefore, many researchers have presented various spectroscopy techniques in the THz regime. Terahertz spectroscopy methods are based on both time domain and frequency domain data acquisition [18]. Resonance Terahertz sensors work according to the high-quality resonance frequencies of a structure that occur in response to an incident THz wave. The Q-factor is one of the parameters that can be used for the evaluation of a resonance sensor. Terahertz resonance sensors can distinguish any changes in the refractive index of an analyte that is put on the surface of the sensor. However, the minimum detectable amount of variation in the refractive index of an analyte depends on the sensitivity parameters of the structure. Accordingly, having sharp resonances in terahertz frequencies can be regarded as a merit for a sensor structure. However, in THz frequencies, the loss of such structures is significant. To address this issue, different metal structures have been proposed to enhance the field confinement in the THz spectrum [19–21]. By increasing the confinement of the electromagnetic field in the structure, sharper resonances occur. One of the best solutions for this problem is using surface plasmon polaritons (SPPs) for better local electric field confinement. Although, in a normal state, sensing with SPPs is not possible in the THz spectrum because of the higher plasmonic frequencies of metals, which reach at least to the visible frequencies. However, some studies have proved that some specific forms of metal structures can bind the electromagnetic field in their surface to act like surface plasmon waves in higher frequencies. This confined surface wave that mimics the SPPs is called a Spoof Surface Plasmon (SSP) and can be generated in THz frequency range [22–25]. This type of THz sensor, which supports SSPs, employs corrugated metal structures in a two-dimensional metamaterial lattice. The metal structures can support surface waves in the THz spectrum using metamaterial techniques. The metamaterial structure can be manipulated to the extent that it gives the desired characteristics in a specific frequency. Thanks to the advantageous features of metamaterial techniques, THz sensors can be stimulated for very sharp resonances that can cause high Q-factor structures. Sensing with a THz resonance sensor can be achieved by the observation of any change in resonance frequency, phase, amplitude, etc. Among these parameters, interpreting the shifted resonances is a powerful tool for sensing purposes when a change occurs in the refractive index (Permittivity) of an analyte. Specifically, any variation in the Permittivity of the superimposed sample causes a redshift in the resonance frequency of the structure. In this paper, a metamaterial THz sensor is proposed and analyzed for its sensitivity parameters, and its ability to perform THz spectroscopy is then investigated. The results show that the structure can support the spoof surface wave in the THz frequency range. Additionally, the sensitivity of the structure is improved in comparison to previous works with lower manufacturing complexity. It is worth noting that the proposed structure is designed in a simple form that lessens the manufacturing difficulties substantially.
Materials and Methods
As can be seen in Figure 1, the metamaterial structure consists of 2-D periodic metallic elements with periodicity Tx and Ty in the two directions of x and y. To measure the resonance frequencies of the structure, a transmission diagram should be calculated. Hence, a plane wave is illuminated from above the structure, the analyte is laid over the sensor, and afterward, the transmitted wave should be compared with the illuminated plane wave. Moreover, a substrate of polyimide is placed beneath the metal part. In terahertz frequencies, the polyimide has a very low absorption coefficient and, as a result, it can be assumed to be transparent for THz radiation. Besides, it has good mechanical properties as a substrate material for such structures. A dispersion diagram analysis has been run on CST Studio Suite 2018 to investigate the relationship between frequency (f) and wave number (K) [26]. To plot the dispersion curve, the boundary condition in the x and y directions is considered as periodic, and the electric boundary condition (Et = 0) is applied on the z-direction. The phase variation in the x-direction is then swept from 0 to 180 degrees, based on the Brillouin zone definition of a 2D-periodic structure. The output of the CST simulation gives the relation between frequency and phase, which is converted to an f-k dispersion diagram. The asymptotic behavior of the dispersion diagram proofs the support of the surface wave in the proposed metallic structure. Following this, the transmission curves are obtained from the response of the structure to an illuminated electromagnetic plane wave while the excitation wave is considered as Floquet port mode with two essential propagation modes. As is depicted, the transmitted THz wave must be measured for any shift in its resonance frequencies. In Figure 1C, it is presented that the structure can support surface waves in different and tunable frequencies according to the size of the structure. The most important parameter of the unit cell, which can affect the resonance frequency of the surface plasmon, is dy, the length of the metal stripe. The value of dy is equal to 26 μm through this work, but, for different values, there are different resonance frequencies. In Figure 1C, it can be clearly seen that for dy= 20 μm, the resonance frequency is just above 3.5 THz, for dy= 26 μm, it is about 3 THz, and when dy= 30 μm, the resonance frequency is almost 2.2 THz. Actually, the frequency should be designed with respect to the application and the target analyte. Besides, the parameter dx has a value of 10 μm as the best value for the width of the metal structure, which will be discussed later. Additional physical parameters are listed in Table 1. Parameters such as Px, Py, and Pz are the dimensions of the substrate of the unit cell and have been defined as equal to the periodicity of the unit cells in such a way that no gap exists between the unit cells. It should be added that the parameters of Px and Py are optimized for the best characteristics of the metamaterial structure. In this paper, gold is considered as the material for the metal stripe because of its high conductivity in this range of frequency.
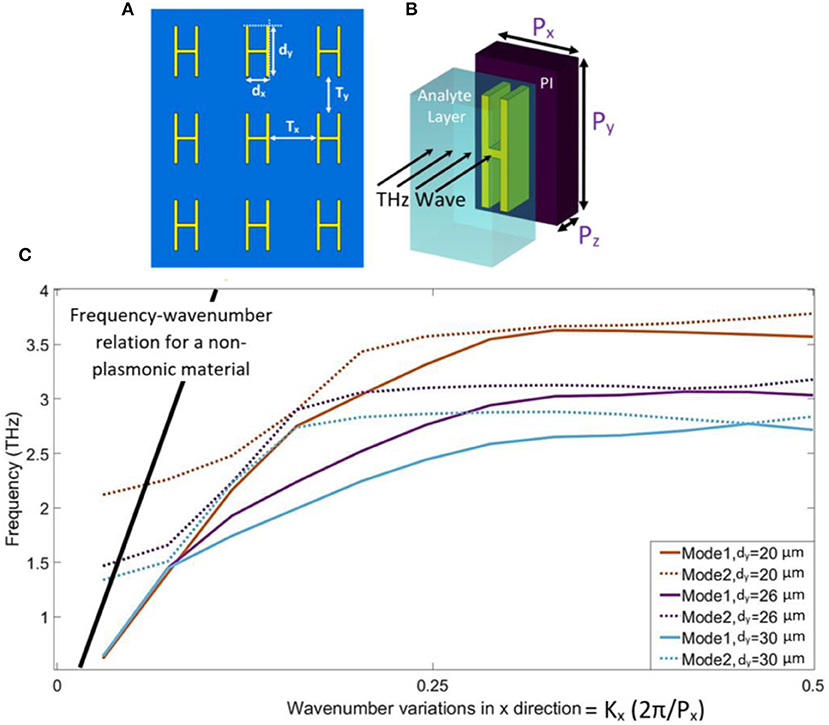
Figure 1. The structure of the proposed THz sensor. A THz wave must be illuminated directly and transmits through the analyte and sensor structure. (A) Structure and the configuration of metal elements in the terahertz metamaterial structure. (B) Unit cell of the metamaterial periodic structure. A layer of polyimide is laid under the metal stripe. (C) Dispersion diagram of the structure. According to the dispersion relation between frequency and wave number, the graph illustrates that the surface plasmon is supported by the structure. There are two main propagation modes in this structure with different plasmon frequencies. The variation in the length of the metal (dy) can tune the resonance frequency for the desired value. It can be clearly seen that for dy= 20 μm, the resonance frequency is just above 3.5 THz, for dy = 26 μm, it is about 3 THz, and when dy = 30 μm, the resonance frequency is almost 2.2 THz.
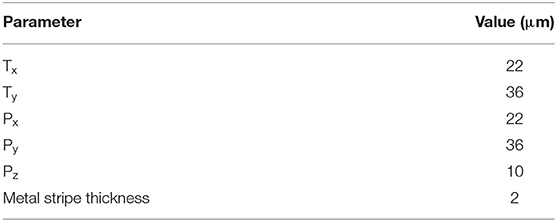
Table 1. The optimized physical dimensions of the proposed structure and the periodicity of the periodic elements.
Results and Discussion
The structure, as described in the previous section, can support spoof surface plasmon oscillations, which can produce strong confinement for the local electric field on the boundary of the metal-dielectric intersection. In this way, SSP modes can oscillate in a subwavelength scale in the THz frequency range, similar to what occurs at visible light frequencies. Based on these oscillations, multiple resonance frequencies are activated, which are very sensitive to any change in the permittivity of the analyte above the metal structure. It should be noted that, in this paper, only the redshifts due to change in the dielectric constant of the analyte are considered, but there may be other alterations such as the amplitude, phase, etc. of the resonance frequencies.
The main resonance frequencies can be determined using the simulation of the unit cell. As depicted in Figure 2, multiple resonances are activated for different propagation modes of the structure. In Figure 2, one of the resonance frequencies corresponds to mode TM00 and the other denotes TE00. As can be clearly seen, the resonances for mode TM00 show smaller Q-factors than the activated resonances for mode TE00. The diagram illustrates that mode TE00 is more reliable for sensing purposes because of its higher Q-factor and sharper dip. Both of the resonances of TE00 mode have a perfect Fabry-Perot resonance form, which is very applicable for practical spectroscopy. Looking at mode TE00, there are two strongly activated resonances with Q-factors of 110 and 296 at frequencies 5.28 THz and 7.696 THz, respectively. The calculated Q-factors demonstrate very strong local plasmonic oscillations, which bring about strong sensing capabilities. In fact, such characteristics ensure that the structure can be used for spectrometry and for sensing the variations in the permittivity of an analyte that is laid over the sensor structure. It is worth noting that the resonances could be changed due to different parameter values in the structure. The thickness of the metal stripe is one of the important parameters and can influence the sharpness of the resonance dips. For this purpose, the best thickness for the metal part is calculated and depicted in Figure 3. In the figure, it is obvious that for different thicknesses of the metal stripe, there are multiple resonances with different Q-factors as well as different frequencies. For the proposed structure, the thickness of 2 μm has the highest QF of the thicknesses considered, reaching 296 at 7.696 THz. Interestingly, for a metal stripe thickness of 8 μm, the second resonance of the TE00 mode has a much lower resonance value of transmission spectra, below −50 dB, than the second resonance of the metal stripe thickness of 2 μm. However, this resonance cannot be applied for sensing due to its partially Fabry-Perot form. Comparing the forms of these resonances, it can be seen that the transmission diagram for the thickness of 8 μm does not have a perfect Fabry-Perot resonance shape, and the simulation results proved that there would be no frequency shift for any change in the permittivity of the analyte. Hence, the resonances of the transmission diagram for the metal stripe with a thickness of 2 μm are considered to be the best achievable results.
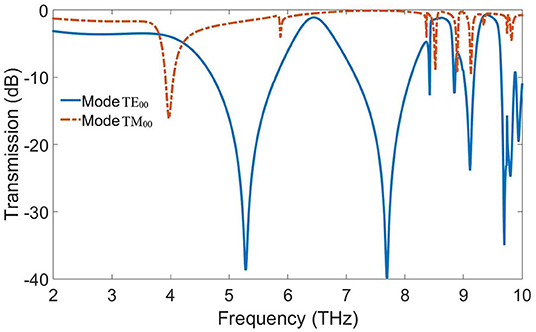
Figure 2. Comparison between two dominant resonances for different propagation modes. Mode 1, which corresponds to the lower propagation mode, shows greater Q-factors than second resonance mode. Multiple resonances are activated for different propagation modes of the structure. One of the resonance frequencies corresponds to mode TM00, and the other one denotes TE00. This diagram depicts that the resonances for mode TE00 are more suitable for the sensing purpose thanks to the higher Q-factor of just above −40 dB.
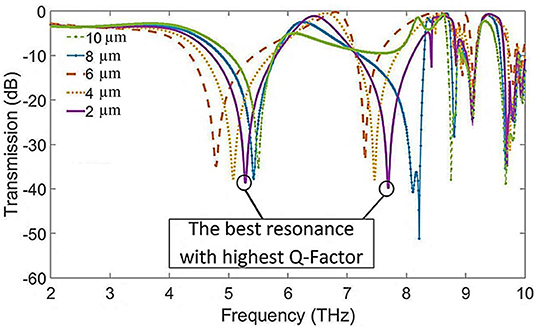
Figure 3. Different resonances calculated by variation in the thickness of the metal structure. The plotted curves reveal the best value of the metal thickness for the highest Q-factor.
The sensing abilities of the proposed THz sensor were investigated by carrying out a simulation study for an analyte with different permittivities with the frequency-domain solver of CST Suite Studio. In this calculation, an analyte layer is superimposed on the sensor structure. Afterward, the dielectric constant (εr = eps) of the analyte is swept between 1 and 2.4. Actually, this range of permittivity includes the permittivities of most biological tissues and is therefore very important for medical sensing applications [27–29]. Figure 4 is plotted based on these calculations and is investigated for frequency shifts due to variations in the dielectric constant of the analyte. The main resonance curve is obtained for εr = 1 as the reference for other values of permittivity. Thus, the solid blue line is used as the reference resonance for the resonance shifts. It should be noted that each resonance curve has two Fabry-Perot form resonances, as previously pointed out, and that the second resonance is chosen for sensing purposes. As Figure 4 shows, the first resonance does not have sensing capability because it does not experience any redshifts when there is a change in the permittivity of the analyte. On the other hand, the second resonance reacts properly by significant redshifts according to any variation in the dielectric constant of the analyte. By increasing the permittivity of the analyte, the redshifts approach a saturation state. Here, the saturation permittivity is defined as a value at which, for higher values, any change in the permittivity of the analyte cannot cause a shift in the resonance frequency. According to the simulation results, these redshifts reach the saturation state with eps = 2.4, which means that this is the maximum sensible permittivity for the dielectric constant of an analyte with this sensor. As can be calculated, the maximum achievable sensitivity for this sensor is 1.705 THz/Permittivity unit, which is obtained based on a 0.8-unit change in the permittivity of the analyte and corresponding 1.364 THz frequency shifts at the resonance frequency. The achieved sensitivity is very comparable with previous works [30, 31]. The results clearly prove that the proposed THz sensor can resonate in specified and tunable THz frequencies that can be applied for medical diagnostic applications. Many malignant biological tissues show variations in their permittivities in the range of frequencies investigated in this paper.
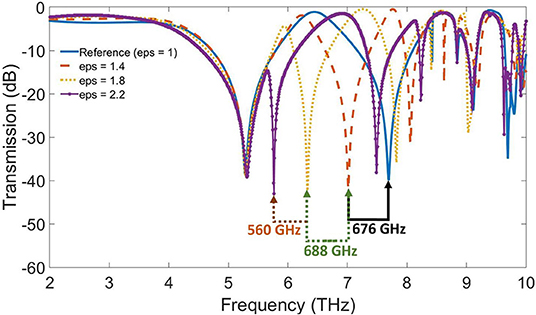
Figure 4. Shifted resonances according to the change in the dielectric constant of the analyte. The range of investigated permittivities is between 1 and 2.2 for the analyte. The permittivity of εr = 1 is considered as the reference resonance curve. For εr = 2.4, the resonances reach their saturation state, and there are no further resonance frequency shifts for higher permittivity.
To take a closer look at the resonance quality of the proposed sensor, the electric field and the surface current of the structure are investigated numerically. As pointed out earlier, the length of the metal structure (dy) can determine the resonance frequency of the sensor, but the results show that parameters such as the width of the metal structure (dx) and metal stripe thickness can strongly affect the strength of the resonances. To make this clearer, numerical analyses of these two parameters have been done. In the first analysis, the maximum electric field of the structure has been calculated for different combinations of the two mentioned parameters. Accordingly, a 2-D contour plot of the maximum electric field has been estimated by a biharmonic interpolation function, as shown in Figure 5. The red stars in the figure are obtained from several simulations for the electric field of the structure and are used as inputs for the biharmonic surface fitting function. As the figure shows, it is possible to pinpoint the best values for the two physical parameters of dx and metal stripe thickness. Based on the generated plot, a stripe thickness of 2 μm and dx= 8, 10 μm are the best choices for the proposed structure. For these values, the maximum electric field can have the best state, and therefore the structure can experience the maximum field confinement.
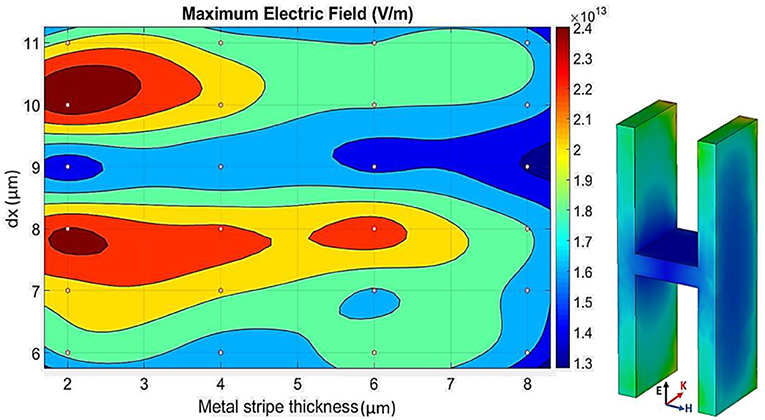
Figure 5. Maximum electric field of the structure. This parameter is an indicator of the field confinement in the metal stripe. A fitting tool is applied to estimate the best physical dimensions for the highest possible electric field. Therefore, for 24 different combinations of metal thickness and dx (red stars), the electric field is calculated, and then, using a biharmonic fitting function, a 2-D contour plot is generated. According to the plot, the highest electric field confinement can be achieved at metal stripe thickness= 2 μm and dx= 8, 10 μm.
In a similar way, another contour plot is produced for the maximum surface current on the metal stripe. The surface current distribution on the structure is shown in Figure 6. The red arrows on the structure demonstrate that the surface currents on each side of the structure have opposite directions. Due to this, the resonances form sharper dips and have stronger sensing capabilities thanks to the dipole-dipole resonance mode. The contour plot in Figure 6 can be easily used for better prediction of the best dimensional values of the structure. Very similar to the previous contour plot, the surface current contour plot also proves that a metal stripe with a thickness of 2 μm and dx= 8, 10 μm can have approximately the best electromagnetic field confinement and consequently better sensing strength. To summarize, the proposed terahertz sensor works as a resonance-based structure and, in this paper, is analyzed numerically in terms of physical dimensions and electric parameters. The designed structure benefits from a very simple designation, which reduces the complexity of fabrication in this range of wavelengths. Moreover, this sensor can be applied for medical sensing purposes for different biological tissues.
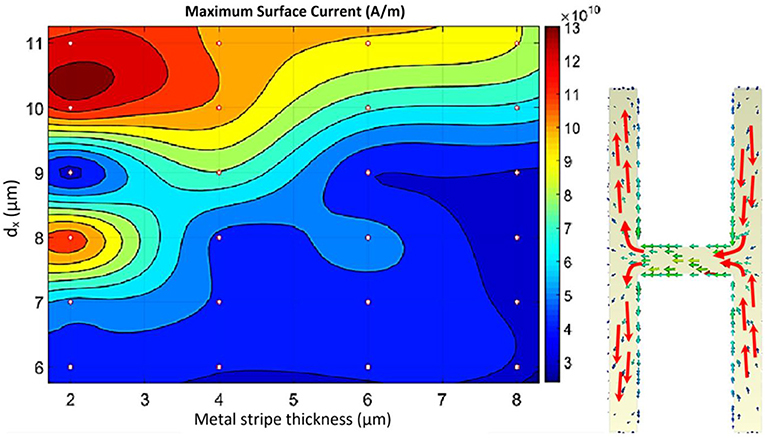
Figure 6. Maximum surface current of the structure. In a similar way, a higher surface current can cause a sharper resonance dip. Consequently, investigating the best possible physical dimensions can increase the sensing capabilities. Similar to what has been done for the maximum electric field, 24 simulated data points are used for the estimation of all possible combinations. Thus, a biharmonic function is considered as a fitting tool to estimate the surface current for all combinations. As can be predicted, the same dimension values are obtained for the maximum surface current as have been calculated for the electric field.
Data Availability Statement
All datasets generated for this study are included in the article/supplementary material.
Author Contributions
SN contributed to the concept of the work, analysis of results and simulations, and the draft of the manuscript. MY contributed to the concept of the work, supervising the analysis, and revising and finalizing the manuscript. SB contributed to the concept of the work, simulations and analysis of results, and revising the manuscript. MK contributed to the concept of the work and scientifically revising the manuscript.
Conflict of Interest
The authors declare that the research was conducted in the absence of any commercial or financial relationships that could be construed as a potential conflict of interest.
References
1. Amlashi SB, Araghi A, Dadashzadeh G. Design of a photoconductive antenna for pulsed-terahertz spectroscopy with polarization diversity. In: 2018 International Symposium on Networks, Computers and Communications (ISNCC). Rome: IEEE (2018), p. 1–5. doi: 10.1109/ISNCC.2018.8530985
2. Choudhury B, Menon A, Jha RM. Active terahertz metamaterial for biomedical applications. Singapore: Springer (2016), p. 1–41. doi: 10.1007/978-981-287-793-2_1
3. Niknam S, Yazdi M, Amlashi SB. Design of a pulsed-terahertz photoconductive antenna for spectroscopy applications. In: 2018 Fifth International Conference on Millimeter-Wave and Terahertz Technologies (MMWaTT). Tehran: IEEE (2018), p. 16–19. doi: 10.1109/MMWaTT.2018.8661244
4. Wang B-X, Zhai X, Wang G-Z, Huang W-Q, Wang L-L. A novel dual-band terahertz metamaterial absorber for a sensor application. J Appl Phys. (2015) 117:014504. doi: 10.1063/1.4905261
5. Yang X, Zhao X, Yang K, Liu Y, Liu Y, Fu W, et al. Biomedical applications of terahertz spectroscopy and imaging. Trends Biotechnol. (2016) 34:810–24. doi: 10.1016/J.TIBTECH.2016.04.008.
6. Zhou R, Wang C, Xu W, Xie L. Biological applications of terahertz technology based on nanomaterials and nanostructures. Nanoscale. (2019) 11:3445–57. doi: 10.1039/C8NR08676A
7. Nagai N, Imai T, Fukasawa R, Kato K, Yamauchi K. Analysis of the intermolecular interaction of nanocomposites by THz spectroscopy. Appl Phys Lett. (2004) 85:4010–2. doi: 10.1063/1.1811795
8. Zalden P, Song L, Wu X, Huang H, Ahr F, Mücke OD, et al. Molecular polarizability anisotropy of liquid water revealed by terahertz-induced transient orientation. Nat Commun. (2018) 9:2142. doi: 10.1038/s41467-018-04481-5
9. Zhao Y, Li Z, Liu J, Hu C, Zhang H, Qin B, et al. Intermolecular vibrational modes and H-bond interactions in crystalline urea investigated by terahertz spectroscopy and theoretical calculation. Spectrochim Acta Part A Mol Biomol Spectrosc. (2018) 189:528–34. doi: 10.1016/J.SAA.2017.08.041
10. Aytekin YS, Köktürk M, Esenturk O. Analysis of active pharmaceutical ingredients by terahertz spectroscopy. Dordrecht: Springer. (2017),. p. 69–73. doi: 10.1007/978-94-024-1093-8_10
11. Choi G, Hong SJ, Bahk Y-M. Graphene-assisted biosensing based on terahertz nanoslot antennas. Sci Rep. (2019) 9:9749. doi: 10.1038/s41598-019-46095-x
12. Choi WJ, Cheng G, Huang Z, Zhang S, Norris TB, Kotov NA. Terahertz circular dichroism spectroscopy of biomaterials enabled by kirigami polarization modulators. Nat Mater. (2019) 18:1. doi: 10.1038/s41563-019-0404-6
13. Ma Y, Huang H, Hao S, Qiu K, Gao H, Gao L, et al. Insights into the water status in hydrous minerals using terahertz time-domain spectroscopy. Sci Rep. (2019) 9:9265. doi: 10.1038/s41598-019-45739-2
14. Ray S, Pesala B, Dash J, Devi N, Sasmal S. Understanding the effect of nanosilica incorporation on dicalcium silicate hydration using terahertz spectroscopy. In: Sadwick LP and Yang T, editors. Terahertz, RF, Millimeter, and Submillimeter-Wave Technology and Applications XI. San Francisco, CA: SPIE (2018), p. 53. doi: 10.1117/12.2289672
15. Zhang XC, Shkurinov A, Zhang Y. Extreme terahertz science. Nat Photonics. (2017) 11:16–8. doi: 10.1038/nphoton.2016.249
16. Danciu M, Alexa-Stratulat T, Stefanescu C, Dodi G, Tamba BI, Mihai CT, et al. Terahertz spectroscopy and imaging: a cutting-edge method for diagnosing digestive cancers. Materials. (2019) 12:1519. doi: 10.3390/ma12091519
17. Schmuttenmaer CA. Two decades of terahertz transient photoconductivity spectroscopy: where do we stand and where are we going? In: 2018 43rd International Conference on Infrared, Millimeter, and Terahertz Waves (IRMMW-THz). Nagoya: IEEE (2018), p. 1. doi: 10.1109/IRMMW-THz.2018.8510028
18. Peiponen K-E, Zeitler A, Kuwata-Gonokami M. Terahertz Spectroscopy and Imaging. Berlin; Heidelberg: Springer Berlin Heidelberg (2013). doi: 10.1007/978-3-642-29564-5
19. Al-Naib I. Thin-film sensing via fano resonance excitation in symmetric terahertz metamaterials. J Infrared Millimeter Terahertz Waves. (2018) 39:1–5. doi: 10.1007/s10762-017-0448-0
20. Niknam S, Yazdi M, Behboudi Amlashi S. Enhanced ultra-sensitive metamaterial resonance sensor based on double corrugated metal stripe for terahertz sensing. Sci Rep. (2019) 9:7516. doi: 10.1038/s41598-019-44026-4
21. Pal BP, Chowdhury DR, Rao SJM, Islam M, Kumar G. Single split gap resonator based terahertz metamaterials for refractive index sensing. In Sadwick LP and Yang T, editors. Terahertz, RF, Millimeter, and Submillimeter-Wave Technology and Applications XI, SPIE (2018), p. 58. doi: 10.1117/12.2287320.
22. Cheng D, Zhang B, Liu G, Wang J, Luo Y. Terahertz ultrasensitive biosensing metamaterial and metasurface based on spoof surface plasmon polaritons. Int J Numer Model Electron Netw Devices Fields. (2018) e2529. doi: 10.1002/jnm.2529
23. Huang T-J, Liu J-Y, Yin L-Z, Han F-Y, Liu P-K. Superfocusing of terahertz wave through spoof surface plasmons. Opt Express. (2018) 26:22722. doi: 10.1364/OE.26.022722
24. Unutmaz MA, Unlu M. Terahertz spoof surface plasmon polariton waveguides: a comprehensive model with experimental verification. Sci Rep. (2019) 9:7616. doi: 10.1038/s41598-019-44029-1
25. Zhang Y, Xu Y, Tian C, Xu Q, Zhang X, Li Y, et al. Terahertz spoof surface-plasmon-polariton subwavelength waveguide. Photonics Res. (2018) 6:18. doi: 10.1364/PRJ.6.000018
26. Davidson DB. Computational Electromagnetics for RF and Microwave Engineering. Cambridge: Cambridge University Press (2005). doi: 10.1017/CBO9780511611575
27. Labrou NE, Walker JM, Chen P, Levy DL, Good MC, Heald R, et al. Cell refractive index for cell biology and disease diagnosis: past, present and future. Lab Chip. (2018) 16:634–44. doi: 10.1039/C5LC01445J
28. Matcher SJ, Cope M, Delpy DT. Use of the water absorption spectrum to quantify tissue chromophore concentration changes in near-infrared spectroscopy. Phys Med Biol. (1994) 39:177–96. doi: 10.1088/0031-9155/39/1/011
29. Pogue BW, Patterson MS. Review of tissue simulating phantoms for optical spectroscopy, imaging and dosimetry. J Biomed Opt. (2006) 11:041102. doi: 10.1117/1.2335429
30. Chen X, Fan W. Ultrasensitive terahertz metamaterial sensor based on spoof surface plasmon. Sci Rep. (2017) 7:2092. doi: 10.1038/s41598-017-01781-6
Keywords: terahertz spectroscopy, terahertz sensing, Terahertz resonance sensor, metamaterial, spoof surface plasmon, surface wave
Citation: Niknam S, Yazdi M, Behboudi Amlashi S and Khalily M (2020) Numerical Performance Analysis of Terahertz Spectroscopy Using an Ultra-Sensitive Resonance-Based Sensor. Front. Phys. 8:19. doi: 10.3389/fphy.2020.00019
Received: 27 July 2019; Accepted: 23 January 2020;
Published: 19 February 2020.
Edited by:
Stephen Watts, University of Manchester, United KingdomReviewed by:
Sally Seidel, University of New Mexico, United StatesPeter R. Hobson, Queen Mary University of London, United Kingdom
Copyright © 2020 Niknam, Yazdi, Behboudi Amlashi and Khalily. This is an open-access article distributed under the terms of the Creative Commons Attribution License (CC BY). The use, distribution or reproduction in other forums is permitted, provided the original author(s) and the copyright owner(s) are credited and that the original publication in this journal is cited, in accordance with accepted academic practice. No use, distribution or reproduction is permitted which does not comply with these terms.
*Correspondence: Mehran Yazdi, eWF6ZGlAc2hpcmF6dS5hYy5pcg==; Salman Behboudi Amlashi, cy5iZWhib3VkaWFtbGFzaGlAc3VycmV5LmFjLnVr
†These authors share senior authorship
 Sajad Niknam
 Mehran Yazdi
 Salman Behboudi Amlashi3*†