- Department of Mathematics, Faculty of Engineering, Kuwait College of Science and Technology, Kuwait, Kuwait
This paper sheds light on the performance of the three-stage sequential estimation of the population inverse coefficient of variation of the normal distribution under a moderate sample size. We estimate the final sample size generated by the three-stage procedure, and the population mean, the population variance, the population inverse coefficient of variation, the asymptotic coverage probability, and the asymptotic regret incurred by estimating the population inverse coefficient of variation by its sample statistics under squared-error loss function plus linear sampling cost. Besides, we address the sensitivity of the constructed confidence interval to detect a potential shift that may occur in the population inverse coefficient of variation under uncontrolled and controlled optimal sample size against type II error probability. We do so by computing the characteristic operating function. Besides, we address the sensitivity of the three-stage procedure as the underlying distribution departs away from normality. We consider two classes of distributions: Student's t distribution and beta distribution. We use Monte Carlo simulations for this study. We write FORTRAN codes and use Microsoft developer studio software. The simulation results revealed that the controlled confidence intervals provide coverage probabilities that exceed the prescribed nominal value even for small optimal sample size contrary to the uncontrolled case that attains the nominal value only asymptotically. Moreover, under the controlled case, the sensitivity of the procedure to depict a potential shift in the parameter of concern becomes more sensitive than the uncontrolled case. Finally, the three-stage procedure is non-sensitive to departure from normality for normal likewise distributions.
Introduction
Let X1, X2, … be a sequence of independent and identically distributed random variables from a normal distribution N(μ, σ2) with mean μ ∈ ℝ and variance σ2 ∈ ℝ+, both parameters are finite but unknown. Pearson [1] introduced the concept of coefficient of variation in the statistical literature. The population coefficient of variation is simply the ratio of the population standard deviation to the population mean, provided the mean is not zero. The higher the coefficient of variation, the greater the level of dispersion around the mean. It is a unit-free measure that allows for comparison between distributions of values whose scales of measurement are not comparable.
The measure has a wide range of applications across many fields of science; see Nairy and Rao [2] for a brief survey of recent applications in business, climatology, engineering, and other fields. Recently, Hima Bindu et al. [3] published a book, which provides necessary exposure of computational strategies, properties of the coefficient of variation, and extracting the metadata leading to efficient knowledge representation. It also compiles representational and classification strategies based on the measure through illustrative explanations. The disadvantage of the measure lies when the population mean equal zero, or when the mean approaches zero. For that reason, we recommend to work with the reciprocal of the measure, inverse coefficient of variation, that is , η ∈ ℝ.
Having observed a random sample X1, X2, …, Xn of size (n ≥ 2) from the normal distribution, we recommend using the customary measures and as initial point estimates for the population mean μ and the population standard deviation σ, respectively. Note are complete sufficient statistics for (μ, σ2). Consequently, the customary sample inverse coefficient of variation is .
Lehman [4] obtained an exact form for the distribution function of the sample coefficient of variation, which depends on the non-central t − distribution, while Jayakumar and Sulthan [5] derived a density function for the sample coefficient of variation in terms of the confluent hypergeometric distribution. Moreover, they obtained the first two moments of the distribution and proved that the sample coefficient of variation is a biased estimator for the population coefficient of variation. Sharma and Krishna [6] found the asymptotic distribution for the sample inverse coefficient of variation without assuming normality. They derived an asymptotic confidence interval for the population inverse coefficient of variation mathematically and then invested the result in making inferences regarding Gamma and Weibull distributions. Albatineh et al. [7] examined the performance of the asymptotic confidence interval for a wide class of underlying distributions: normal, lognormal, χ2 (Chi-squared-distribution), Gamma, and Weibull via Monte Carlo simulation. Gulha et al. [8] considered several confidence intervals for estimating the population coefficient of variation using parametric, non-parametric, and modified methods using Simulation. Their objective was to compare the performance of the existing and newly proposed methods. Banik and Kibria [9] also considered various confidence intervals for estimating the population coefficient of variation under several classes of distributions: symmetric and skewed distributions using simulation. They also include some bootstrap proposed interval estimators for estimating the coefficient of variation. Therefore, the inference for the coefficient of variation is limited to parametric methods or standard bootstrap. Wang et al. [10] used non-parametric methods based on empirical likelihood and modified jackknife empirical likelihood method for constructing confidence intervals for the coefficient of variation. They also propose bootstrap procedures for calibrating the test statistics.
In this paper, we propose sequential estimation for estimating the population inverse coefficient of variation of the normal distribution and prove that sequential estimation provides better results than the classical methods.
Problem Setting
Suppose we desire to construct a confidence interval for η such that
where d(> 0) and 0 < α <1 are predetermined constants. That is the half-width of the interval is d, and the coverage probability is at least 100(1 − α)%.
It was shown from Yousef and Hamdy [11] Corollary 2 parts (i) and (ii), that as n → ∞ , “D” denotes convergence in distribution. It follows that
where Φ(·) is the cumulative distribution function of and the upper cut off point of . Solving Equation (2) for n provides
If η is known, then (3) is the optimal fixed sample size required to solve (1) uniformly for all μ ∈ ℝ and σ > 0. However, since η is unknown, then it has been shown by Dantzig [12] that no fixed sample size procedure could satisfy (1) except by using multistage sequential sampling procedures. In this paper, we use Hall's three-stage sequential sampling procedure.
Before we review Hall's three-stage procedure [13, 14], we summarize the customary asymptotic measures through which one judges the quality of inference, as presented in the literature. These asymptotic measures help in comparing different methods of multistage sampling.
Let N be the final random sample size generated by a multistage sampling procedure, and let n* be as in (3). Then the multistage procedure is said to be (i) first-order asymptotically efficient if as λ → ∞, while it is (ii) second-order asymptotically efficient if as λ → ∞, E(N − n*) is bounded by a finite number unrelated to n*, in the sense of Ghosh and Mukhopadhyay [15].
Let IN be the fixed-width confidence interval constructed via a multistage procedure. Then the procedure is (iii) consistent or exactly consistent if P(η ∈ IN) ≥ 1 − α, uniformly for all ∀ μ and σ. while it is (iv) asymptotically consistent if as λ → ∞, P(η ∈ IN) → 1 − α in the sense of Stein [16], Mukhopadhyay [17], and Chow and Robbins [18].
Let RN be the multistage risk encountered in estimating η by the corresponding sample measure and be the optimal fixed sample size risk had η been known. Then, the procedure is (v) first-order asymptotically risk efficient if as λ → ∞, → 1 while it is (vi) asymptotically second-order regret if as λ → ∞, is bounded by a finite number in the sense of Ghosh and Mukhopadhyay [15]. For more details about the procedures, see Mukhopadhyay and de Silva ([19], Ch. 6).
In addition to the above asymptotic measures, we address other factors for comparison: the practical implementations in real-life problems, the insensitivity to changes in the underline distribution, and the sensitivity to depict any changes in the parameter under consideration.
Three-Stage Sequential Procedure
Stein [16, 20] and Cox [21] introduced the two-stage procedure for solving (1) regarding the population normal mean. The two-stage procedure attains consistency, but unfortunately, it leads to oversampling, in other words, it is asymptotically inefficient. To overcome such deficiency, Anscombe [22], Ray [23], and Chow and Robbins [18] proposed the purely sequential procedure. The procedure attains efficiency and asymptotic consistency but lacks time consumption. As a compromising procedure, Hall [13] introduced the three-stage procedure to achieve two primary objectives, the operational savings made possible by sampling in batches and the asymptotic efficiency attained by the purely sequential sampling. The procedure based on three stages, as we describe later. The procedure combines the efficiency of Anscombe, and Chow and Robbins one-by-one purely sequential procedure and the operational saving made possible by sampling in bulks by applying Stein's group sampling techniques. It is a nice trade-off between purely sequential procedure and two-stage procedure ease of implementation. The procedure attains all properties except exact consistency.
Mukhopadhyay [24] made further developments to the three-stage sampling by focusing on higher-order moments of the stopping variable. Hamdy [25] extended Hall's results and proposed a three-stage sampling point estimation procedure to estimate the normal mean while Liu [26] extended Hall's results to tackle hypothesis-testing problems for the normal mean.
Yousef [27, 28] tackle the three-stage fixed-width confidence interval for the mean of a continuous distribution where but unknown under two cases; the first when the explicit form of the underlying function is known and the second when the underlying distribution can be approximated by Edgeworth series of order two. Heuristically, he showed that the kurtosis of the underlying distribution mainly influences the performance of the asymptotic coverage probability. He studied the asymptotic characteristics of each confidence interval and discussed the sensitivity of the three-stage procedure as the underlying distribution departs away from normality. Son et al. [29] proposed a triple sampling sequential procedure, which yields both a fixed-width confidence interval and a hypothesis testing for the normal mean while controlling Type II error probability. Yousef [28] extended their results to a wider class of underlying continuous distributions. Both Son et al. [29] and Yousef [28] provided second-order approximations to the characteristic operating function of the inference. See also Hamdy et al. [30].
For a complete list of three-stage estimation, see Ghosh et al. [31].
In this paper, we use the three-stage procedure to generate inference for the population inverse coefficient of variation η based on (3).
The Pilot-Stage: take a pilot sample of size m from the normal distribution and calculate the sample mean, sample variance, and the sample inverse coefficient of variation.
The Main-Study Stage: let [x] be the largest integer function and γ (design factor)0 < γ <1. The stage depends on the stopping rule
The Fine-Tuning Stage: Apply the rule
Once the procedure terminates, we propose , and . The 100 (1 − α) % fixed-width confidence interval of η is .
Review of Sequential Estimation of the Population Inverse Coefficient of Variation
Regarding sequential estimation of the population inverse coefficient of variation of the normal distribution, Chaturvedi and Rani [32] developed a purely sequential procedure to find a fixed-width confidence interval estimation for the inverse coefficient of variation of the normal distribution. They showed mathematically that the proposed procedure attains asymptotic efficiency and consistency in the sense of Chow and Robbins [18] without any numerical or simulation results.
Later, Yousef and Hamdy [33] tackle the same problem using Hall's three-stage sequential procedure. They found a unified optimal sample size in the form, that tackle both point and interval estimation for the population normal mean. As an application, they found the asymptotic coverage probability of the population inverse coefficient of variation and the asymptotic regret under the squared-error loss function with linear sampling cost through Monte Carlo simulation. The results showed that the three-stage procedure attains asymptotic efficiency and consistency in the sense of Chow and Robbins [18]. Recently, Yousef and Hamdy [11] reconsidered the same problem but theoretically using an optimal sample size of the form, , that is, the stopping rule directly depends on the population inverse coefficient of variation. They found a compact form for the asymptotic coverage probability for the population inverse coefficient of variation, as well as the asymptotic regret under a squared-error loss function plus linear sampling cost. Moreover, they found the characteristic operating function for a simple hypothesis against a shift that may occur in the population inverse coefficient of variation. They showed mathematically that the three-stage procedure attains asymptotic efficiency while under some proper choices of γ (the design factor) and α the procedure attains consistency. Collectively, the three-stage procedure attains the nominal value only asymptotically. In both cases, the asymptotic regret provides negative values.
Up to our knowledge, none of the existing papers in the literature of sequential estimation use Monte Carlo simulations to examine the performance of the three-stage procedure to tackle inference of the normal inverse coefficient of variation using the optimal size defined in (3).
In this paper, we continue the research of estimating the population inverse coefficient of variation of the normal distribution by examining the performance of the procedure under (3) and verify the theoretical results found by Yousef and Hamdy [11] under moderate sample sizes. We estimate all the parameters in concern; the final sample size N, the population, mean μ, the population variance σ2, and the population inverse coefficient of variation η. We tackle two estimation problems; first, the point estimation problem under the squared-error loss function plus linear sampling cost, and second, the fixed-width confidence estimation problem under controlled optimal sample size against type II error probability. Besides, we discuss the sensitivity of the procedure to depict any potential shift in the population inverse coefficient of variation under both uncontrolled and controlled optimal sample size. Finally, we study the sensitivity of the procedure as the underlying distribution departs away from normality considering t − distribtuion with different degrees of freedom (Leptokurtic) and Beta distribution with different parameters (Platykurtic). We use Monte Carlo simulations for this study using Microsoft Developer Studio software.
Sequential Inference for the Population Inverse Coefficient of Variation
Point Estimation Problem
Consider the loss incurred by estimation the population inverse coefficient of variation η by its customary estimate, the sample inverse coefficient of variation given by
where A is a known constant, and c is the cost per unit sample. The risk associated with (6) is
By minimizing (7) concerning n yields
where n0 is the optimal fixed sample size required for estimating η.
Now, if we set Equation (3) equal Equation (8), we find the optimal sample size needed to perform both point and confidence interval estimation for η with fixed-width 2d and coverage probability at least 100(1 − α)%. That is, the constant A should be chosen such that
As d → 0, A → ∞. For more details regarding A, see [33].
The optimal risk is . While the three-stage sequential risk is
The asymptotic regret, which is the difference between the risks of using the three-stage procedure minus the optimal risk, would be
While the asymptotic relative risk (efficiency ratio) is the sequential risk relative to the optimal risk, that is
Now, if , then Equation (11) provides a negative regret see Martinsek [34] while Equation (12) yields ν(d) < 1. This implies that the three-stage procedure provides a better estimation than the optimal had η been known.
The Asymptotic Coverage Probability of the Population Inverse Coefficient of Variation
Recall the three-stage sampling confidence interval of the inverse coefficient variation, the asymptotic coverage probability of η is
The results of Anscombe [35] provide that as λ → ∞ independent of the random variable N = m, m + 1, m + 2, …. Thus,
Constructing a Fixed-Width Confidence Interval With Controlled Type II Error Probability for the Population Inverse Coefficient of Variation
There is a close relationship between statistical testing hypotheses and confidence intervals in the sense that they can perform similar inference objectives. Confidence intervals, however, provide more information compared to the hypotheses testing counterpart see, Tukey [36]. They signify by their length, the precision of estimation, and the direction of error. Moreover, confidence intervals show which parameter value should not be rejected if they were hypothesized as null values. Therefore, the sensitivity of confidence intervals to depict shifts in the real parameter value η0 becomes a crucial issue to ensure the quality of inference.
Son et al. [29], Costanza et al. [37] were the first who brought up the idea for the normal mean, while Hamdy [38] considered the idea for estimating the location parameter of the exponential distribution.
From a practical standpoint, this issue is essential when constructing quality control charts to monitor the mean quality of service or production. We formulate the following hypotheses:
Both hypotheses make statements about the population value of the test statistic and are mutually exclusive. The null hypothesis H0 asserts that no shift in the actual population inverse coefficient of variation occurred against the alternative hypothesis Ha which emphasized that the actual inverse coefficient of variation has shifted by a distance k Measured in unites of d.
The probability of not depicting a shift given that the shift has already occurred can be assessed by the type II error probability βkc.
Since the process has an equal probability of committing a type II error probability above the centerline or below the centerline, we, therefore, consider only the probability of committing a positive shift from the actual parameter value η0.
Let τ be the probability of committing a type II error probability. Our objective is to control the probability of committing a type II error probability. We do so by finding the characteristic operating curve that gives the probability of acceptance of various possible values of η1. The minimum sample size required to control both α and τ is
where is the upper point of N(0, 1). For more details, see Nelson [39, 40].
The second-order approximation of the controlled characteristic operating function under Equations (14) and (16) as λ → ∞
The uncontrolled case occurs by setting b = 0 in (16) to give βk.
Monte Carlo Simulation
Since the sequential results are asymptotic, it is worth mentioning to estimate the above equations through Monte Carlo simulations. We do so by writing FORTRAN codes and run them using Microsoft Developer Studio software.
Simulation Methodology
The simulation process performs as follows: Fix the values of m, γ, α andñ*.
A. Generate an i-th sample of size m ≥ 8 from the normal distribution, and compute , and as initial point estimates of μ, σ2 and η, respectively.
B. Apply Equation (4), . Furthermore, compute the numerical value of T.
• If T ≤ m, then we have enough observations, and thus the experiment terminates. In this case , and .
• If T > m then sample extra observations of size T − m, say Xm+1, Xm+2, Xm+3, …, XT, then augment the new sample with the previous sample in (A) to have a sample of size T. Then compute the statistics and for the parameters μ, σ, and η, respectively.
C. Apply Equation (5), and compute N.
• If N ≤ T, sampling is terminated with , and .
• If N > T, further observations needed. Sample the difference N − T say XT+1,XT+2,…, …,XN Furthermore, augmented with the previous T observations. The updated sample is of size N, and the new estimates are , and .
Upon termination, record the resultant sample size , the simulated mean , the simulated standard deviation and the simulated inverse coefficient of variation for i = 1, 2, …, L.
D. As a result, record the observations ,, , and .
E. Calculate the estimated means for N, μ, σ and η respectively as follows
• is the estimated mean sample size,
• is the estimated mean of the sample mean,
• is the estimated mean of the sample variance and
• is the estimated mean of the sample inverse coefficient of variation across replicates.
F. The simulated standard errors are
• , ,
• and .
G. The simulated regret is .
H. The simulated relative risk
I. The simulated coverage probability is
•
J. The simulated controlled operating characteristic function ; k = 0(0.1)1,1.5 and 2
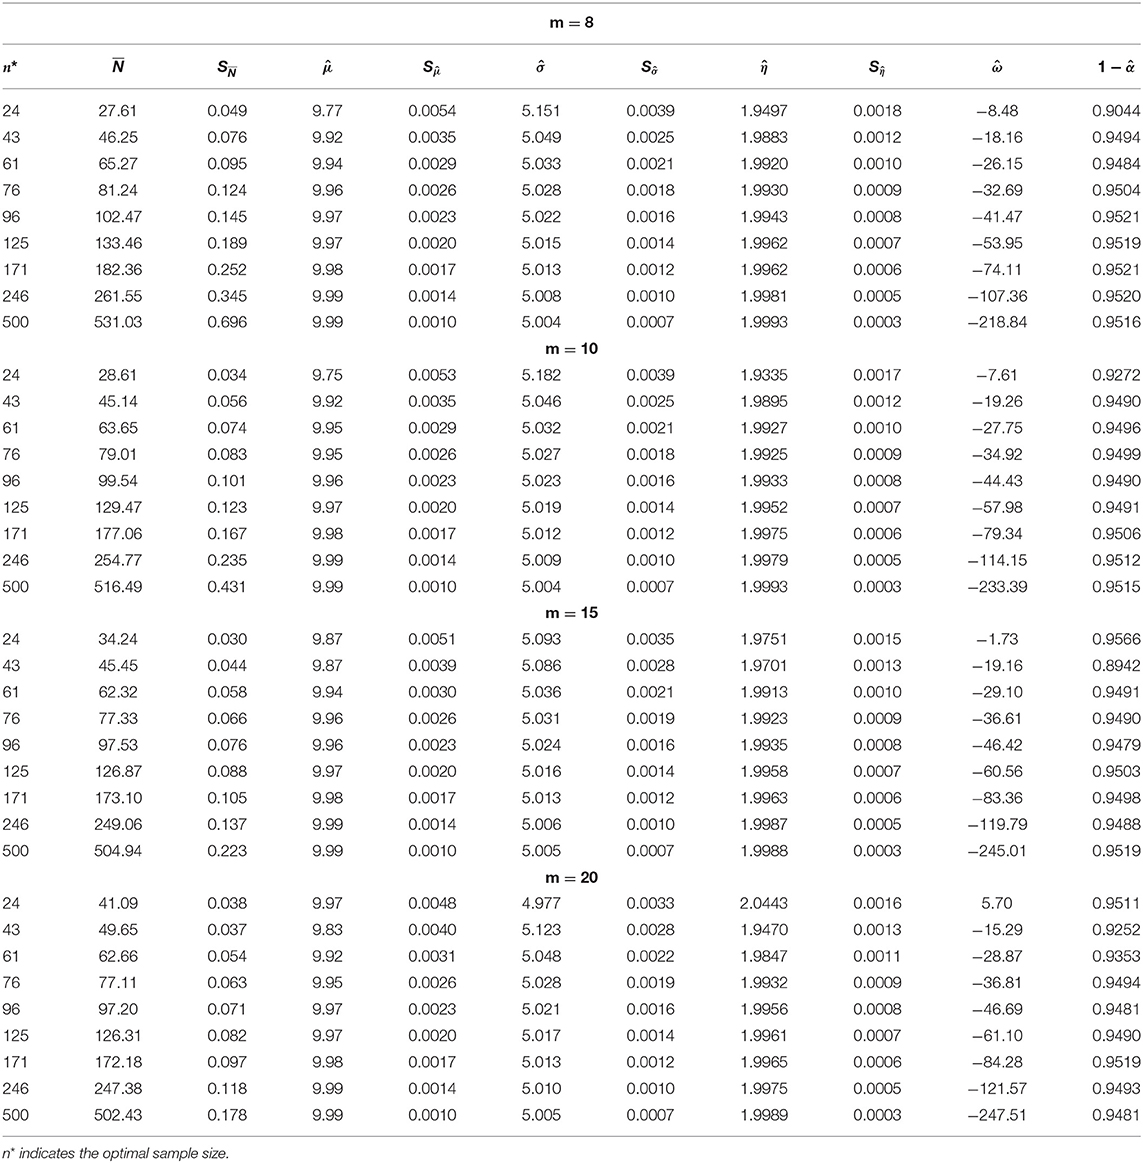
The study covers two points; the performance of the procedure at fixed m and the performance of the procedure as m changes from m = 8, 10, 15, and 20.
Simulation Experiment and Results
To conduct the simulation study, a series of L = 50, 000 replications were generated from N(μ, σ), with and 10 provided η = 20, 10, 5, 3, 2, 1.5, 1 and 0.5.
The optimal sample sizes are chosen to represent small, medium to large performance, that is
n* = 24, 43, 61, 76, 96, 125, 171, 246, and 500.
While the design factor is chosen to be γ = 0.5, and the pilot samples are taken m = 8, 10, 15, and 20. As small to moderate pilot samples. For brevity, we consider α = 5%, which gives a = 1.96.
Table 1 demonstrates the simulation results at m = 15 as the optimal sample size increases. We noticed the following
1. Regarding the final sample size N; for all values of n* and the absolute difference between and n* reduces as the optimal sample size increases. The simulated standard errors increase as n* increases.
2. Regarding the population mean, the simulated mean converges asymptotically to the population mean. That is is asymptotically unbiased estimator to μ. The standard errors decrease as n* increases.
3. Regarding the population standard variance, the estimates converge to the population standard deviation asymptotically. is asymptotically unbiased to σ. The standard errors decrease as n* increases.
4. The simulated regret has negative values, which indicates that the three-stage procedure provides estimates for the population inverse coefficient of variation better than the optimal had n* been known.
5. Regarding the relative risk, the simulation results reveal that
- For fixed n* as η decreases the estimated values decreases slightly.
- For fixed η as n* increases the simulated values decreases.
a. At n* = 500, converges asymptotically to 0.759 at η = 20 and 10 and approaches 0.752 at η = 1. Even for η < 1, will converge asymptotically to 0.752.
6. Regarding the relative risk, the simulated converges asymptotically to nearly 0.75. This implies that the sequential risk is 25% less than the optimal risk.
7. Regarding the simulated coverage probability, the three-stage procedure attains the desired nominal value asymptotically (asymptotic consistency). The coverage improves as n* increases. Figure 1 shows the performance of the coverage probability as the optimal sample size increases at μ = 10 while and 20. In other words, as η decreases.
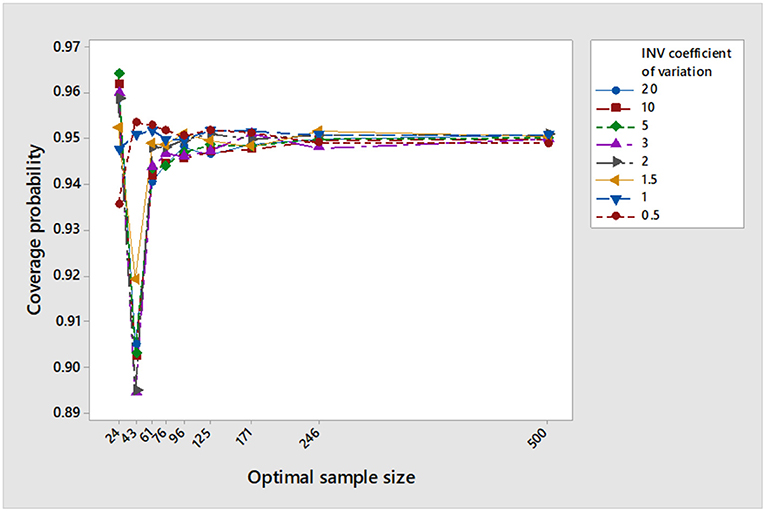
Figure 1. Performance of the simulated coverage probability at μ = 10, , γ = 0.5, m = 15, and 1 − α = 0.95.
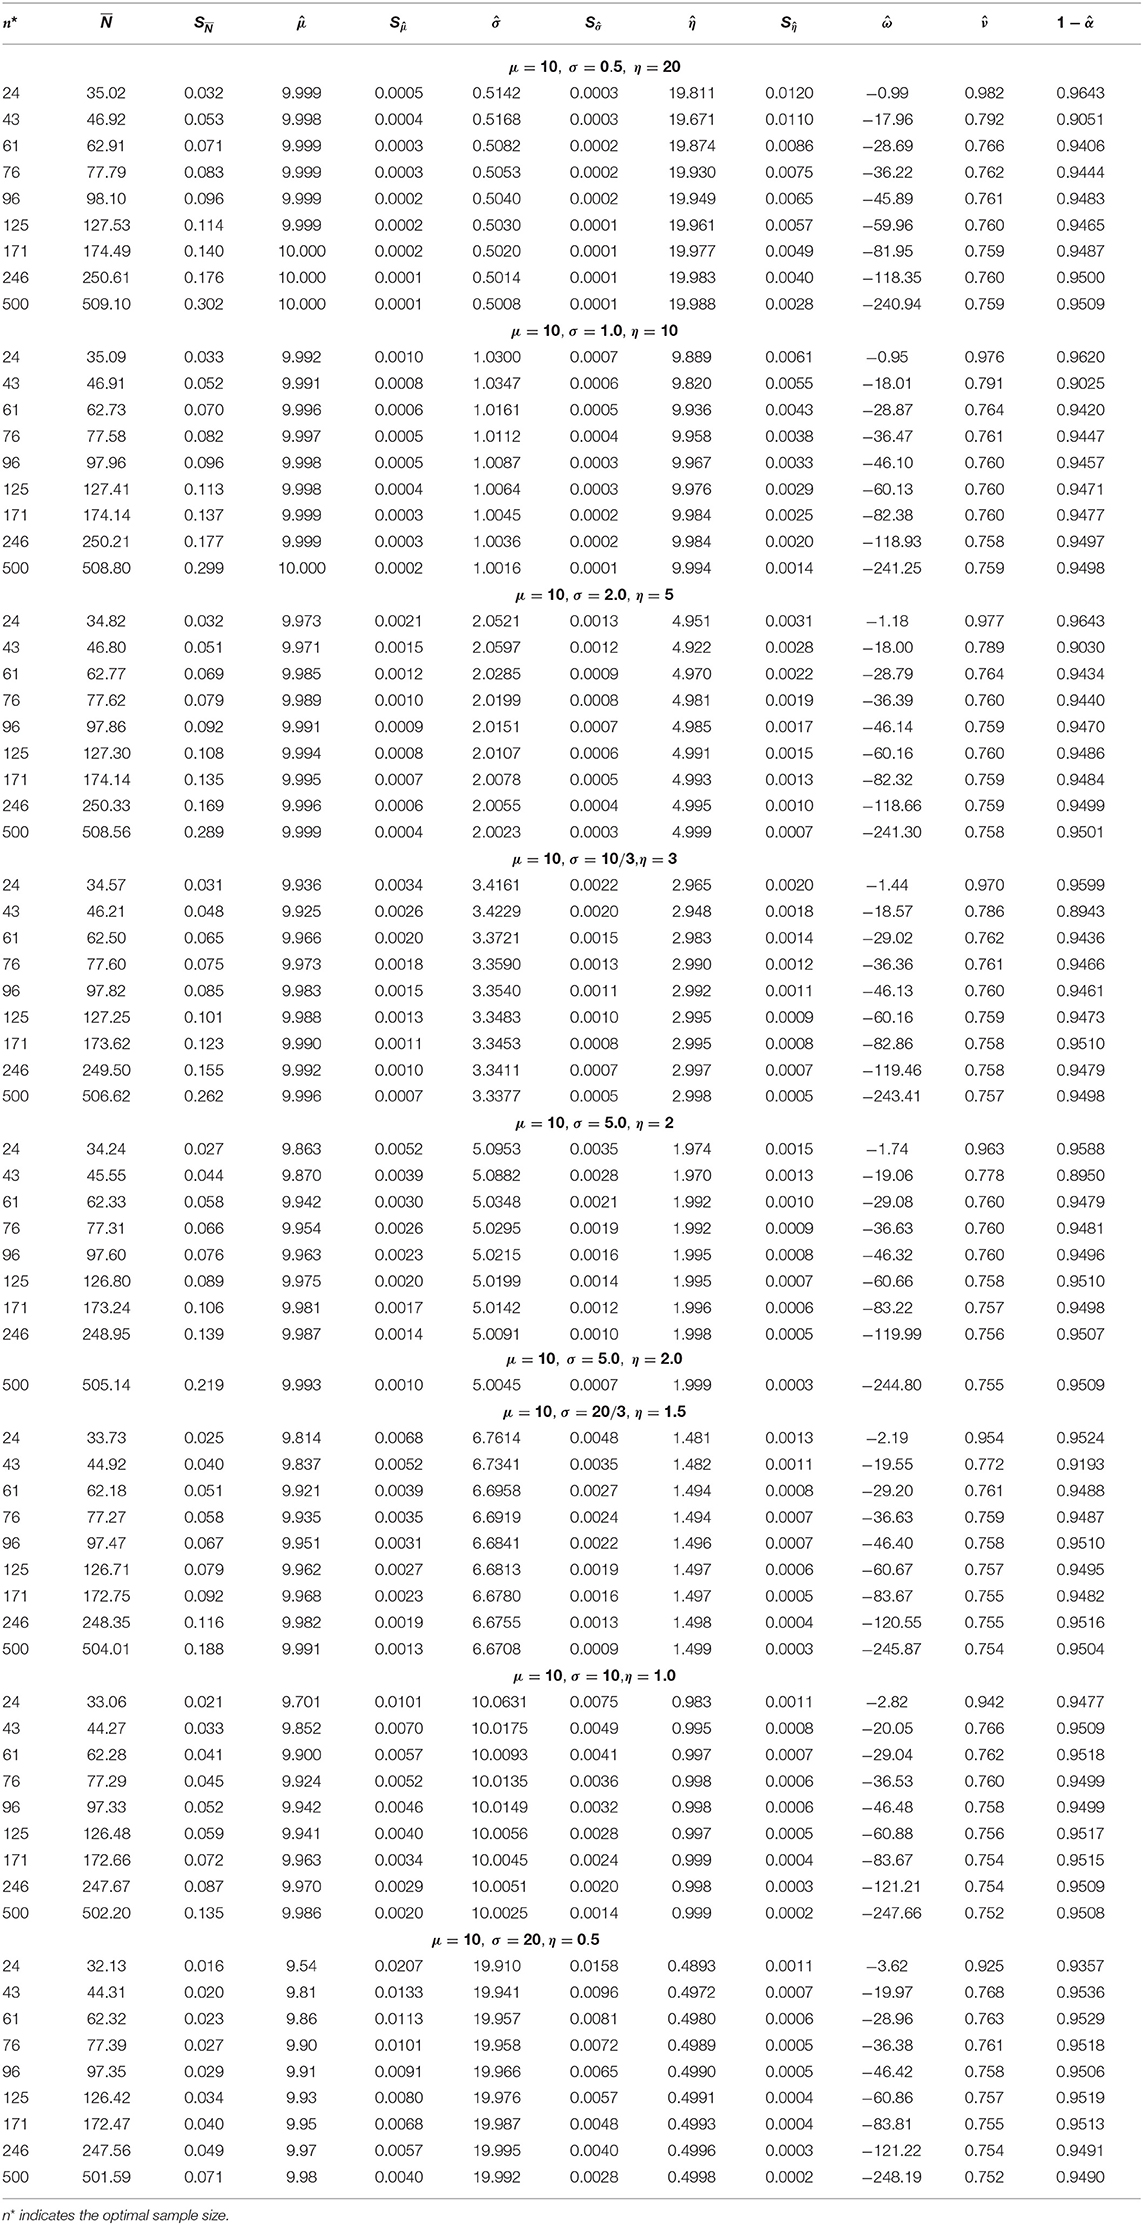
Table 1. Three-stage sequential estimation of the population inverse coefficient of variation under (3) at m = 15, γ = 0.5, α = 5%, η = 20, 10, 5, 3, 2, 1.5, 1.0, and 0.5.
Now let us record the impact of increasing m on the performance of the procedure. To do so, we present Table 2. We noticed the following
1. At n* = 24 and 43: As the pilot sample increases the absolute difference between the optimal sample size and the simulated final sample size increases, while at n*= 61, 76, 96, and 125, the absolute difference decreases slightly. At n*= 171, 246, and 500, the absolute difference decreases significantly to approach the desired optimal sample size. The corresponding standard deviations decreases.
2. For fixed n*, as the pilot sample increases, the simulated mean is nearly approaching the population mean. While the estimations become better as the optimal sample size increases with decreased standard deviation.
3. The simulated standard deviation approaches the population standard deviation as the optimal sample size increases. The biased decreases as the optimal sample size increases.
4. In general, the simulated regret decreases as the pilot sample increases except at n*=24.
5. Figure 2 demonstrates the performance of the simulated coverage probability as m increases.
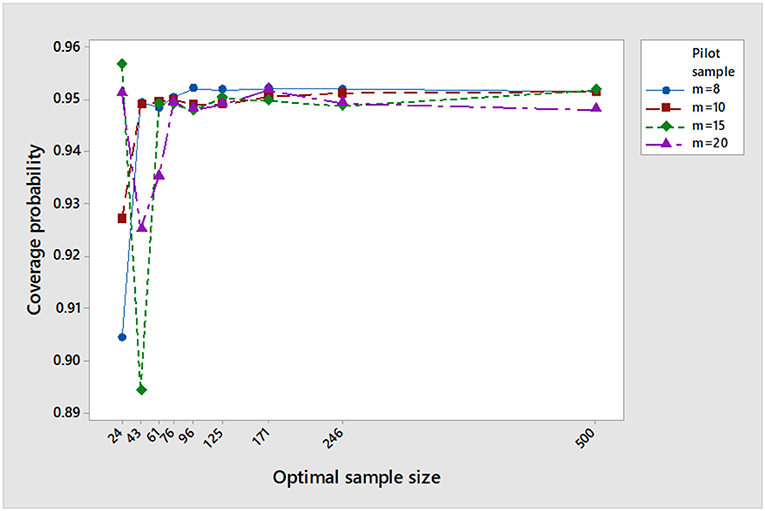
Figure 2. The impact of increasing m on the coverage probability at μ = 10, σ = 5, η = 2, γ = 0.5, and 1− α = 0.95.
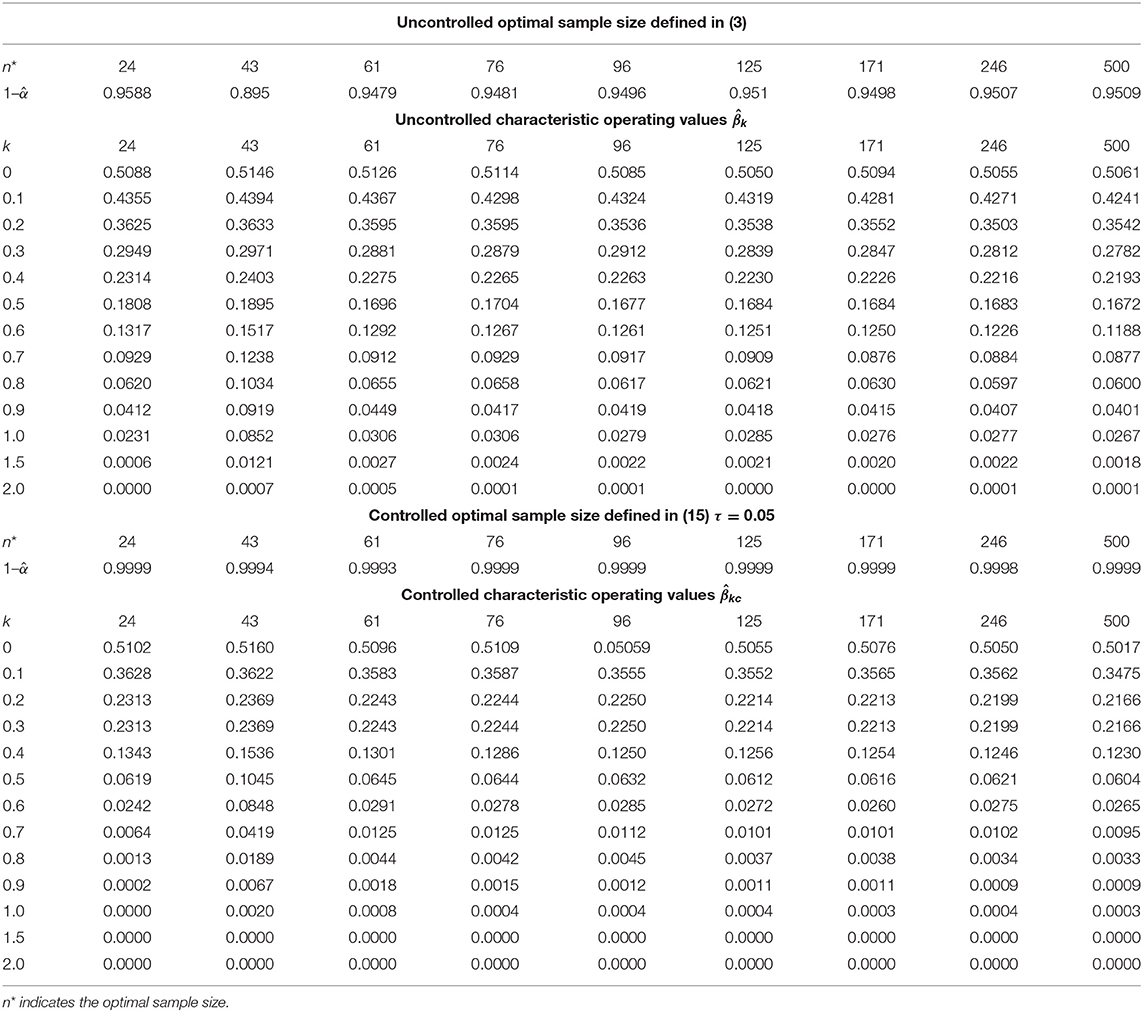
Table 3 shows the asymptotic coverage probability and the asymptotic characteristic operating function under the uncontrolled optimal sample size given in (3). The procedure attains the desired nominal value, only asymptotically. As k increases the simulated decreases and approaches zero at k = 2. The other part of Table 3 shows the results under the controlled optimal sample size given in (16) against type II error probability. The procedure exceeds the desired nominal value, even for small optimal sample sizes. The simulated decreases significantly to zero and . This indicates that by controlling the confidence interval against type II error probability, the procedure becomes more sensitive toward a remarkable shift. Figures 3, 4 reflect the previous comments.
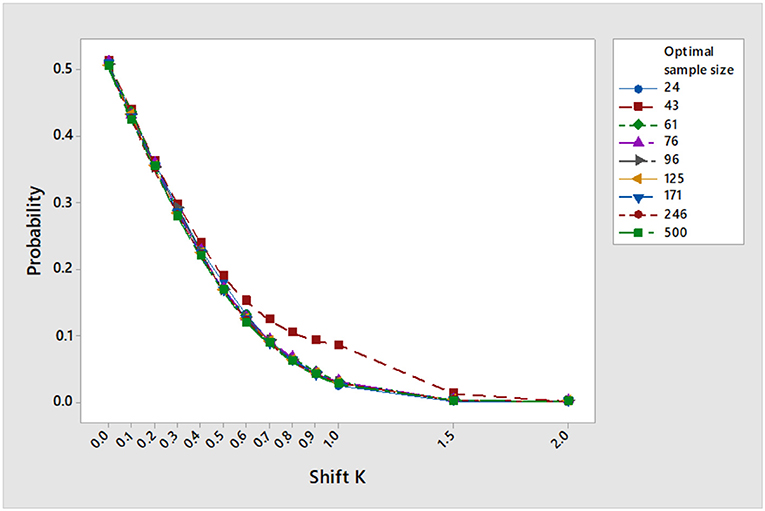
Figure 3. Operating characteristic values under uncontrolled optimal sample size as the shift increases at μ = 10, σ = 5, η = 2, γ = 0.5, and α = 0.05.
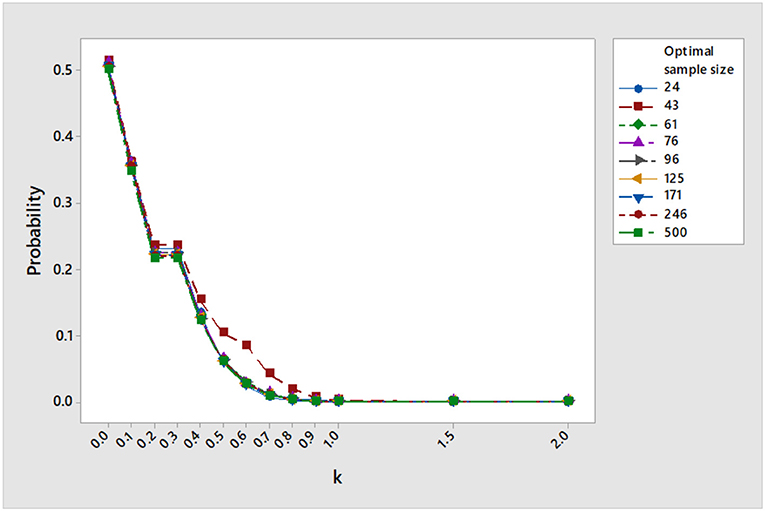
Figure 4. Operating characteristic values under controlled optimal sample size as the shift increases at μ = 10, σ = 5, η = 2, γ = 0.5, and α = 0.05 and β = 0.05.
The Sensitivity of the Normal-Based Three-Stage Procedure for Underlying Distribution
Assume we need to estimate the population inverse coefficient of variation for a class of non-normal distributions using the normal-based optimal sample size in (3). How sensitive is the three-stage procedure toward estimation? To examine this and without loss of generality, we consider two families of underlying distributions; the student's t(r), r = 5, 10 and 20, r indicates the degrees of freedom and the family of beta distribution; Beta(0.5, 0.5) and Beta(1, 1). Table 4 shows the asymptotic results for the t-distribution with the selected degrees of freedom. We obtain better estimation for all parameters, and the procedure satisfies all asymptotic measures except consistency. The simulated relative risk converges asymptotically to 0.752. Table 5 shows the results for the beta distribution. Here the three-stage procedure provides coverage probabilities that exceed the prescribed nominal value. This may resort to the structural behavior of the beta distribution since it belongs to uniform power series functions. Again approaches nearly to 0.752.
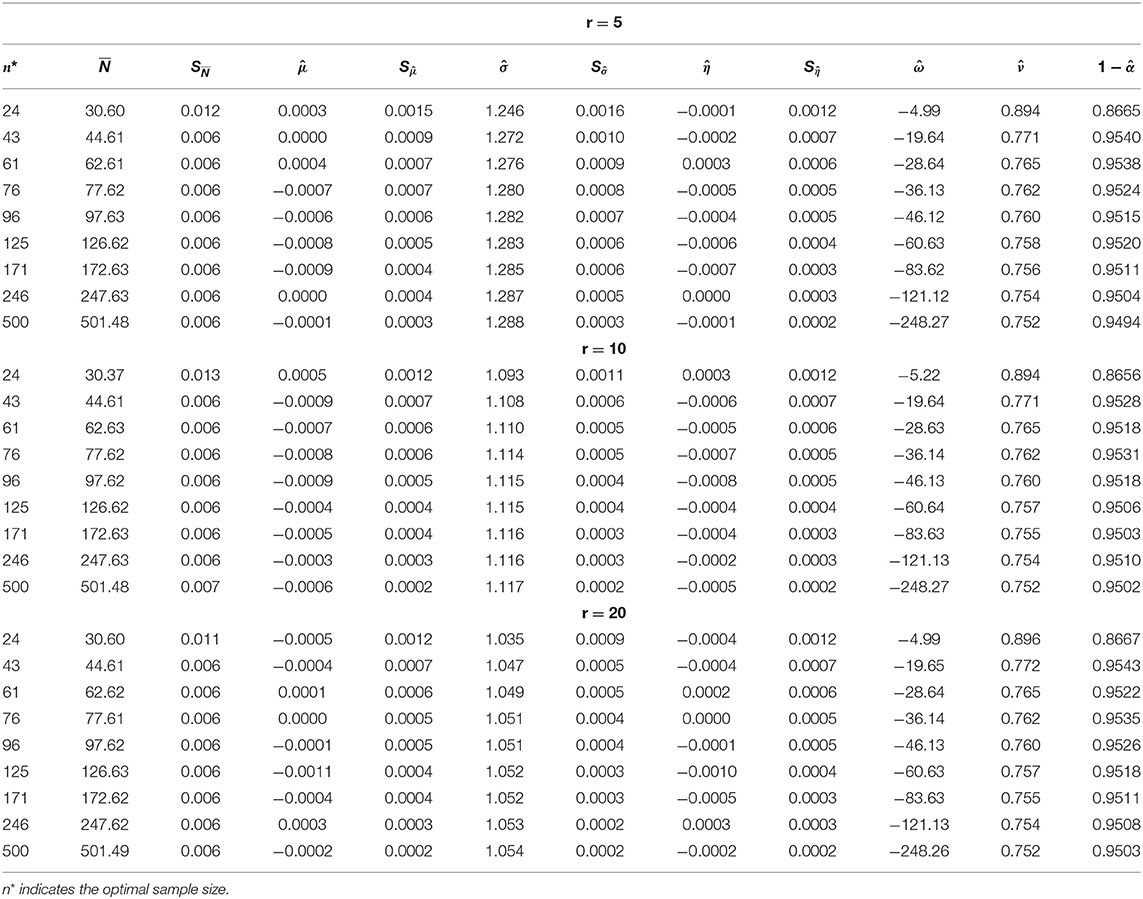
Table 4. Three–stage estimation of the inverse coefficient of variation for underlying T(r), r = 5, 10, 20 m = 15, γ = 0.5, α = 5%.
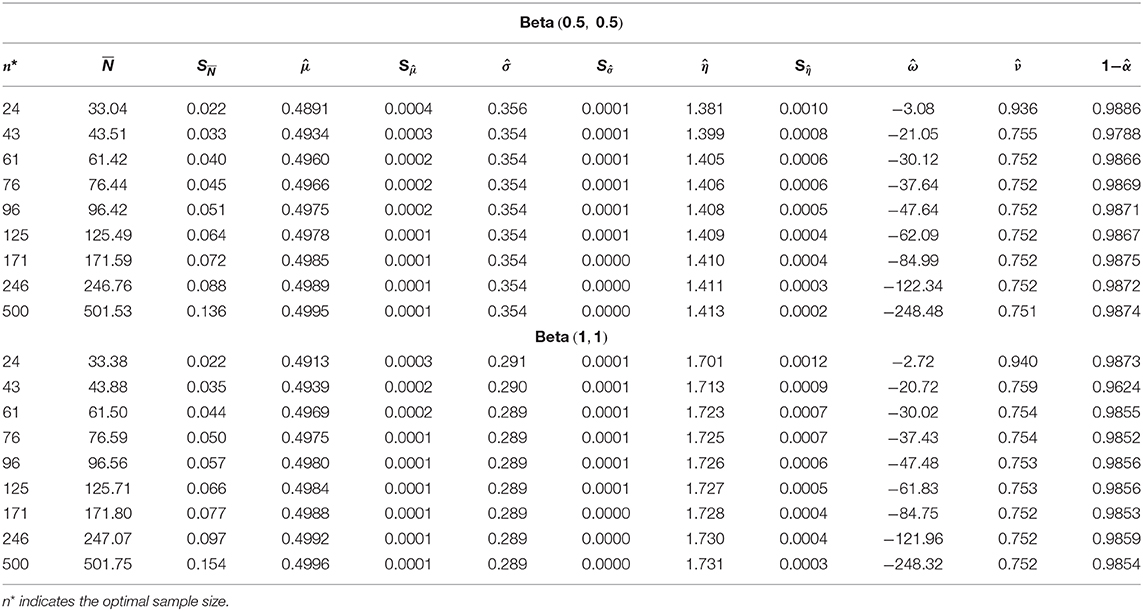
Table 5. Three–stage estimation of the inverse coefficient of variation for underlying Beta(0.5, 0.5) and (1, 1) m = 15, γ = 0.5, α = 5%.
Conclusion
We examine the performance of the three-stage procedure for estimating the population inverse coefficient of variation of the normal distribution. We estimated all parameters in concern and found that the three-stage procedure attains efficiency and asymptotic consistency as the width of the interval approaches zero. By controlling the confidence intervals against type II error probabilities, the procedure provides coverage probabilities that exceed the prescribed nominal value and becomes more sensitive toward any potential shift that may occur in the population inverse coefficient of variation. Regarding the sensitivity of the procedure as the underlying distribution departs away from normality, we found that the three-stage procedure is robust for likewise normal distributions.
Data Availability Statement
All datasets generated for this study are included in the article/supplementary material.
Author Contributions
AY did all the study, wrote Fortran programs and ran them using Microsoft developer studio software, and wrote the draft and the final form of the paper.
Conflict of Interest
The author declares that the research was conducted in the absence of any commercial or financial relationships that could be construed as a potential conflict of interest.
References
1. Pearson K. Mathematical contributions to the theory of evolutions? III Regression, heredity, and panmixia. Philos Trans R Soc. (1896) 187:253–318. doi: 10.1098/rsta.1896.0007
2. Nairy KS, Rao KA. Tests of coefficients of variation of normal population. Commun Stat Simul Comput. (2003) 32:641–61. doi: 10.1081/SAC-120017854
3. Hima Bindu K, Morusupalli R, Dey N, Rao RC. Coefficients of Variation and Machine Learning Applications, 1st ed. New York, NY: CRC Press (2019) ISBN 9780367273286 - CAT# K425377.
5. Jayakumar GSD, Sulthan A. Exact sampling distribution of sample coefficient of variation. J Reliabil Stat Stud. (2015) 8:39–50.
6. Sharma KK, Krishna H. Asymptotic sampling distribution of inverse coefficient-of variation and its applications. IEEE Transac Reliabil. (1994) 43:630–3. doi: 10.1109/24.370217
7. Albatineh A, Kibria BM, Zogheib B. Asymptotic sampling distribution of inverse coefficient of variation and its applications: revisited. Int J Adv Stat Probabil. (2014) 2:15–20. doi: 10.14419/ijasp.v2i1.1475
8. Gulha M, Kibria BM, Albatineh A, Ahmed N. A comparison of some confidence intervals for estimating the population coefficient of variation: a simulation study. SORT (2012) 36:45–68.
9. Banik S, Kibria BM. Estimating the population coefficient of variation by confidence intervals. Commun Stat Simul Comput. (2011) 40:1236–61. doi: 10.1080/03610918.2011.568151
10. Wang D, Formica MK, Liu S. Nonparametric interval estimators for the coefficient of variation. Int J Biostat. (2018) 14:1557–4679. doi: 10.1515/ijb-2017-0041
11. Yousef A, Hamdy H. Three-stage sequential estimation of the inverse coefficient of variation of the normal distribution. Computation. (2019) 7:69. doi: 10.3390/computation7040069
12. Dantzig GB. On the non-existence of tests of student's hypothesis having power function independent of σ. Ann Mathem Stat. (1940) 11:186–92. doi: 10.1214/aoms/1177731912
13. Hall P. Asymptotic theory of triple sampling of sequential estimation of a mean. Ann Stat. (1981) 9:1229–38. doi: 10.1214/aos/1176345639
14. Hall P. Sequential estimation saving sampling operations. J R Stat Soc. (1983) 45:1229–38. doi: 10.1111/j.2517-6161.1983.tb01243.x
15. Ghosh M, Mukhopadhyay N. Consistency and asymptotic efficiency of two-stage and sequential procedures. Sankhya Indian J Stat Ser A. (1981) 43:220–7.
16. Stein C. A Two-sample test for a linear hypothesis whose power is independent of the variance. Ann Math Stat. (1945) 16:243–58. doi: 10.1214/aoms/1177731088
17. Mukhopadhyay N. Stein's two-stage procedure and exact consistency. Skandinavisk Aktuarietdskr. (1982) 1982:110–22. doi: 10.1080/03461238.1982.10405107
18. Chow YS, Robbins H. On the asymptotic theory of fixed-width sequential confidence intervals for the mean. Ann Math Stat. (1965) 36:457–62. doi: 10.1214/aoms/1177700156
19. Mukhopadhyay N, de Silva BM. Sequential Methods and Their Applications. Boca Raton, FL: Chapman and Hall/CRC (1950).
21. Cox DR. Estimation by double sampling. Biometrika. (1952) 39:217–27. doi: 10.1093/biomet/39.3-4.217
22. Anscombe FJ. Large sample theory of sequential estimation. Mathem Proc Cambridge Philos Soc. (1952) 45:600–7.
23. Ray WD. Sequential confidence intervals for the mean of a normal population with unknown variance. J R Stat Soc Ser B. (1957) 19:133–43. doi: 10.1111/j.2517-6161.1957.tb00248.x
24. Mukhopadhyay N. Some properties of a three-stage procedure with applications in sequential analysis. Indian J Stat Ser A. (1990) 52:218–31.
25. Hamdy HI. Remarks on the asymptotic theory of triple stage estimation of the normal mean. Scand Stat J. (1988) 15:303–10.
26. Liu W. Fixed-width simultaneous confidence intervals for all pairwise comparisons. Comput Stat Data Anal. (1995) 20:35–44. doi: 10.1016/0167-9473(94)00032-E
27. Yousef A. Construction a three-stage asymptotic coverage probability for the mean using edgeworth second-order approximation. In: International Conference on Mathematical Sciences and Statistics. Singapore: Springer. (2014). pp. 53–67.
28. Yousef A. A note on a three-stage sequential confidence interval for the mean when the underlying distribution departs away from normality. Int. J. Appl. Math. Stat. (2018) 57:57–69.
29. Son MS, Haugh LD, Hamdy HI, Costanza MC. Controlling type II error while constructing triple sampling fixed precision confidence intervals for the normal mean. Ann Inst Stat Math. (1997) 49:681–92. doi: 10.1023/A:1003266326065
30. Hamdy HI, Son SM, Yousef SA. Sensitivity analysis of multi-stage sampling to departure of an underlying distribution from normality with computer simulations. J Seq Anal. (2015) 34:532–58. doi: 10.1080/07474946.2015.1099951
31. Ghosh M, Mukhopadhyay N, Sen P. Sequential Estimation. New York, NY: Wiley Series in Probability and Statistics (1997).
32. Chaturvedi A, Rani U. Fixed-width confidence interval estimation of the inverse coefficient of variation in a normal population. Microelectron Reliabil. (1996) 36:1305–8. doi: 10.1016/0026-2714(95)00152-2
33. Yousef A, Hamdy H. Three-stage estimation of the mean and variance of the normal distribution with application to inverse coefficient of variation. Mathematics. (2019) 7:831. doi: 10.3390/math7090831
34. Martinsek AT. Negative regret, optimal stopping, and the elimination of outliers. J Am Stat Assoc. (1988) 10:65–80.
36. Tukey JW. The philosophy of multiple comparisons. Stat Sci. (1991) 6:100–16. doi: 10.1214/ss/1177011945
37. Costanza MC, Hamdy HI, Haugh LD, Son MS. Type II error performance of triple sampling fixed precision confidence intervals for the normal mean. Metron. (1995) LIII:69–82.
38. Hamdy HI. Performance of fixed-width confidence intervals under type II errors: the exponential case. South Afr Stat J. (1997) 31:259–69.
39. Nelson LS. Comments on significant tests and confidence intervals. J Qual Technol. (1990) 22:328–30. doi: 10.1080/00224065.1990.11979266
Keywords: asymptotic consistency, asymptotic efficiency, inverse coefficient of variation, Monte Carlo simulation, normal distribution, squared-error loss function, three-stage procedure
Citation: Yousef A (2020) Performance of Three-Stage Sequential Estimation of the Normal Inverse Coefficient of Variation Under Type II Error Probability: A Monte Carlo Simulation Study. Front. Phys. 8:71. doi: 10.3389/fphy.2020.00071
Received: 06 January 2020; Accepted: 02 March 2020;
Published: 20 March 2020.
Edited by:
Dumitru Baleanu, University of Craiova, RomaniaReviewed by:
Kolade Matthew Owolabi, Federal University of Technology, NigeriaZakia Hammouch, Moulay Ismail University, Morocco
Copyright © 2020 Yousef. This is an open-access article distributed under the terms of the Creative Commons Attribution License (CC BY). The use, distribution or reproduction in other forums is permitted, provided the original author(s) and the copyright owner(s) are credited and that the original publication in this journal is cited, in accordance with accepted academic practice. No use, distribution or reproduction is permitted which does not comply with these terms.
*Correspondence: Ali Yousef, YS55b3VzZWZAa2NzdC5lZHUua3c=
 Ali Yousef