Abstract
Ultrasound imaging is a well-established clinical imaging technique providing real-time, quantitative anatomical and physiological information in humans. The lack of ionizing radiation and relative low purchase and maintenance costs results in it being one of the most frequently used clinical imaging techniques with increasing use for guiding interventional clinical procedures. Until 20 years ago, translation of clinical ultrasound practices to preclinical applications proved a significant technological challenge due to the smaller size (25 g vs. 70 kg) and rapid conscious heart-rate (500–700 bpm vs. 60 bpm) of the mouse requiring an increase in both spatial and temporal resolution of 10–20-fold in order to achieve diagnostic information comparable to that achieved clinically. Since 2000 [1], these technological challenges have been overcome and commercial high frequency ultrasound scanners have enabled longitudinal studies of disease progression in small animal models to be undertaken. Adult, neonatal and embryonic rats, mice and zebrafish can now be scanned with resolutions down to 30 microns and with sufficient temporal resolution to enable cardiac abnormalities in all these species to be identified. In mice and rats, quantification of blood flow in cardiac chambers, renal, liver and uterine vessels, and intra-mural tissue movements can be obtained using the Doppler technique. Ultrasonic contrast microbubbles used routinely for clinical applications are now being further developed to include targeting mechanisms and drug-loading capabilities and the results in animal models bode well for translation for targeted drug delivery in humans.
Introduction
Although ultrasound has been used extensively since its development to study preclinical animal models much of the early work in this field was undertaken using transducers designed for ultrasound scanning of clinical small-parts or intra-operative imaging and operating in the frequency range between 10 and 20 MHz. Such frequencies enable images with spatial resolutions of the order of hundreds of microns to be acquired thus limiting their effectiveness in detecting abnormalities in smaller preclinical models. Additionally, clinical scanners designed to image the human heart with 60–100 beats per minute (bpm) had insufficient temporal resolution to image the rapid heart movement of preclinical models (400–600 bpm). The technological challenges of designing and manufacturing a commercial ultrasound scanner capable of resolving structures smaller than 100 microns and with sufficient temporal resolution to resolve cardiac motion within a mouse heart was overcome with the launch of the first commercially available preclinical ultrasound scanner in year 2000. Since then there has been a meteoric rise in the number of biology research publications using preclinical ultrasound imaging to assess adult, neonatal and embyronic rats, mice, and zebrafish with spatial resolutions approaching 30 micron and with frame-rates of up to 350 Hz achievable when imaging adult murine hearts enabling cardiac abnormalities to be identified. In addition, blood flow within cardiac chambers, renal, liver and uterine vessels can be measured in real-time using the Doppler function on the scanners and elastic properties of tissues can be measured using elastography techniques. New and exciting applications using ultrasonic contrast microbubbles designed to target specific biological markers and with drug-loading capabilities are being developed and tested in animal models. Technological advances in transducer manufacture has resulted in linear array transducers now replacing the first generation of mechanically-driven single-element transducers.
In this manuscript we will review the different imaging modes available on preclinical ultrasound scanners and highlight their utility for imaging of preclinical models. For clarity, the words preclinical animal model are used to describe small non-companion animals for which the genetic footprint can be modified and refers predominantly to mice, rats and zebrafish. All images and experiments described were performed under a UK Home Office Licence following ethical review by the University of Edinburgh.
Techniques of Ultrasound Imaging
Ultrasound waves are emitted from an ultrasound transducer. The choice of frequency of the transducer is important as higher frequencies give increased spatial resolution (i.e., smaller objects can be resolved) but the depth over which useful information can be obtained is reduced. For preclinical imaging, frequencies between 20 and 55 MHz are generally used with 15–20 MHz (image depth 3–4 cm) being used for adult rats, 30–40 MHz (image depth 10–20 mm) for adult mice and higher frequencies (up to 50 MHz, image depth 9 mm) used for neonatal mouse studies and embryonic and adult zebrafish imaging. When the transducer is coupled to the surface of the body using warmed ultrasound coupling gel, ultrasound images can be acquired in real-time. Ultrasound images are essentially two-dimensional (2D) cross-sectional slices through the body with the portion of anatomy closest to the transducer (generally the skin) displayed at the top of the screen and organs more distal displayed at depth. The depth at which organs are displayed on the screen is determined by the length of time the emitted ultrasound beam takes to return to the surface of transducer assuming a standard speed of sound in soft tissue of 1,540 ms−1 and assuming no multiple scattering has taken place. Unlike clinical ultrasound imaging in which scans are undertaken with the sonographer moving the transducer in real-time over the skin surface, for preclinical ultrasound scanning, the transducer is mounted in a probe-holder with 3D versatile movement enabling the probe to be oriented to any desired angle whilst avoiding small, but at high resolution, significant human movement compromising the quality of image acquisition. For almost all ultrasound imaging of preclinical models, the models are anesthetized prior to ultrasound scanning. With rats and mice, prior to ultrasound scanning, thick animal hair can be removed using electric hair clippers followed by the application of a depilatory cream to the scanning area. The use of the cream ensures that air bubbles are not trapped under any remaining hair stubble. Once the hair is removed, warmed coupling gel is placed on the body of the animal. Meanwhile, the temperature of the animal is recorded continuously especially in experiments where large amounts of the mouse hair has been removed. The probe is then lowered into the coupling gel. Due to the small size of preclinical models and their physical fragility, when scanning most organs, the ultrasound transducer does not touch the animal but scans through a thin layer of gel between the transducer head and the animal skin.
2D B-Mode Imaging
B-mode imaging or brightness-mode is the most commonly used mode in ultrasound imaging. In B-mode imaging 2D cross-sectional images of the animal are displayed in real-time on the screen. Images are acquired in transmit-receive mode where the transducer emits an ultrasound pulse, then pauses to receive signals back at the transducer which have been reflected and scattered from organ boundaries and parenchyma. This received signal is rapidly processed to form the gray-scale image displayed on the screen with highly reflective structures such as organ boundaries giving brighter (whiter) echoes and structures which scatter less ultrasound (e.g., blood) being darker. The focal position (highlighted as a yellow arrow in Figure 1) is the depth of optimal spatial resolution within the image. Using array probes, multiple focal zones can be selected but this will have a detrimental effect on the maximum frame-rate obtained. This may not be important for the more static abdominal organs but for cardiac imaging generally only one focal zone is used.
Figure 1
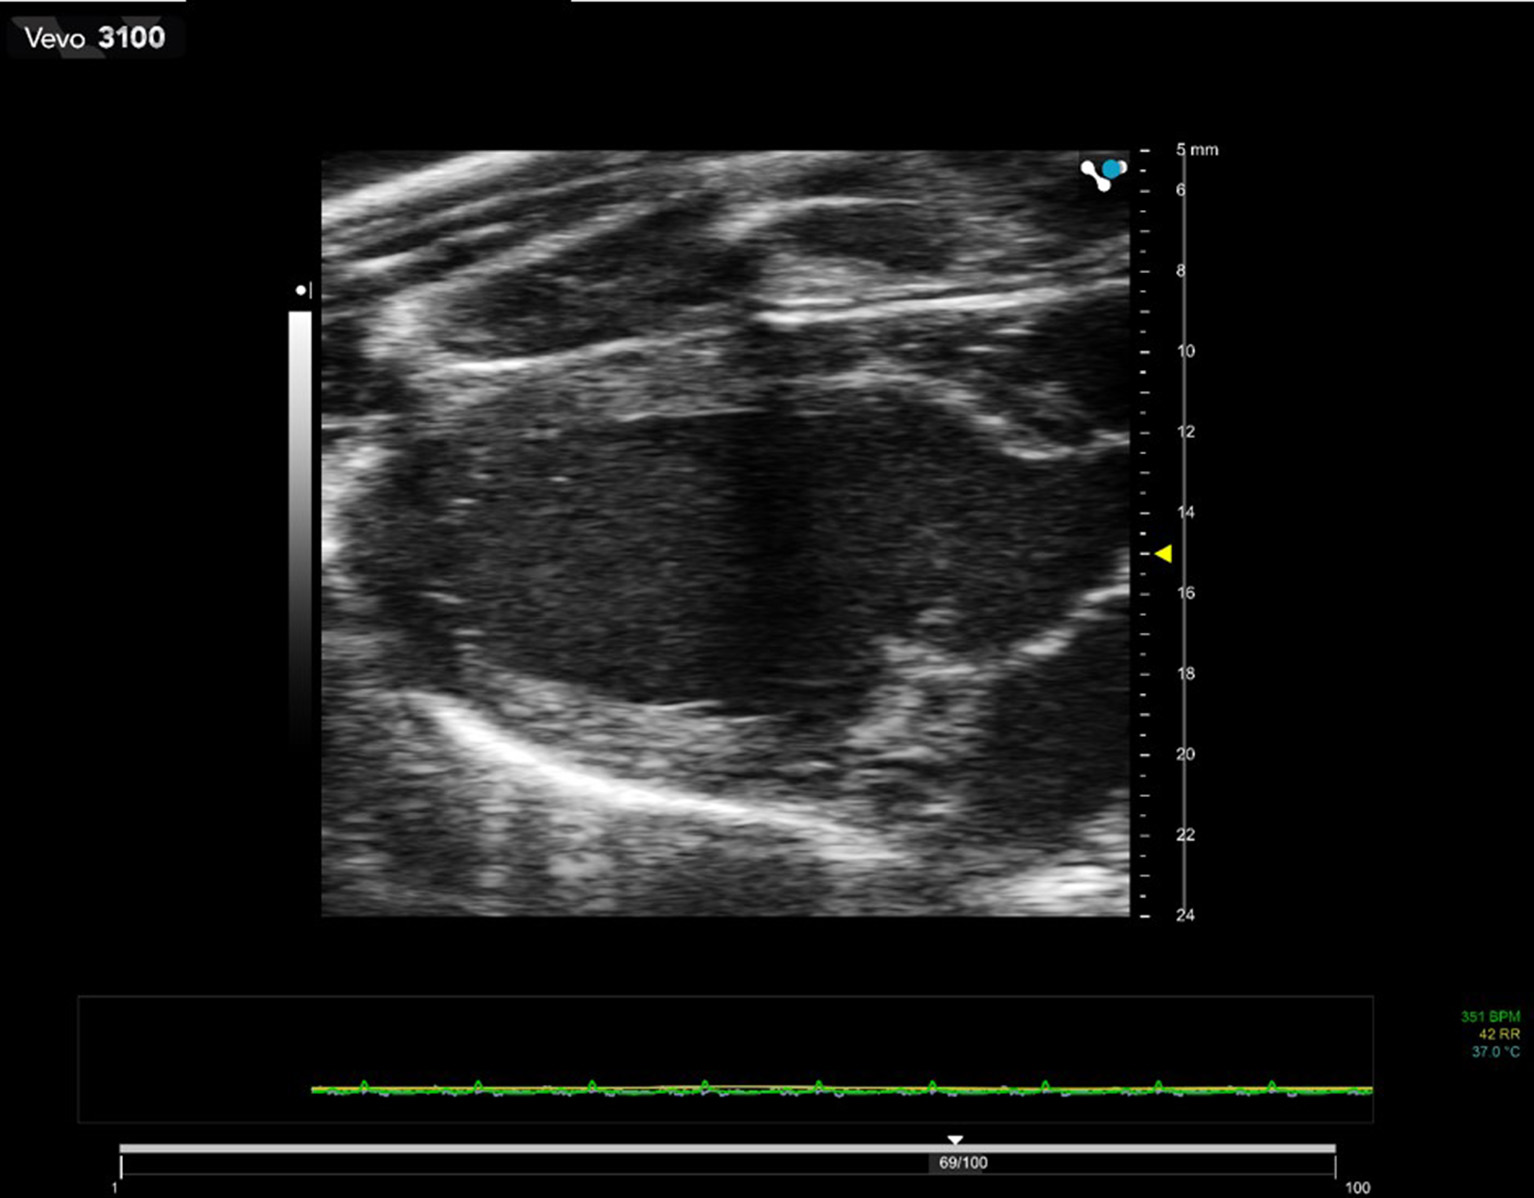
2D B-mode image of a rat heart in diastole. Transducer used is 21 MHz center-frequency and focus of the beam is set at 15 mm depth. The dark zone running through the center of the image is caused by shadowing from the ribs.
Due to the rapid generation of ultrasound images, all scanners have the capability to freeze image acquisition and scroll (cine) through a pre-defined number of images in order to review the most recent acquisitions. Single images and short video clips can be saved on the scanner—the length of video clip is usually pre-set and tends to be longer for video clips acquired during echocardiographic studies and contrast imaging studies than for abdominal scans (see below).
M-Mode Imaging
M-mode imaging or motion-imaging is used principally to study fast moving structures such as heart-wall movement or valvular movement. A single line is selected in the B-mode image intersecting the chamber walls or valves of interest and ultrasound data is acquired only along the pre-selected M-mode line. Consequently data is acquired with high temporal resolution, as only one line of data is acquired rather than 128 lines of data in a full B-mode image. The M-mode data is displayed as a continuous function of time scrolling across the screen with depth on the y-axis and time on the x-axis (Figure 2).
Figure 2
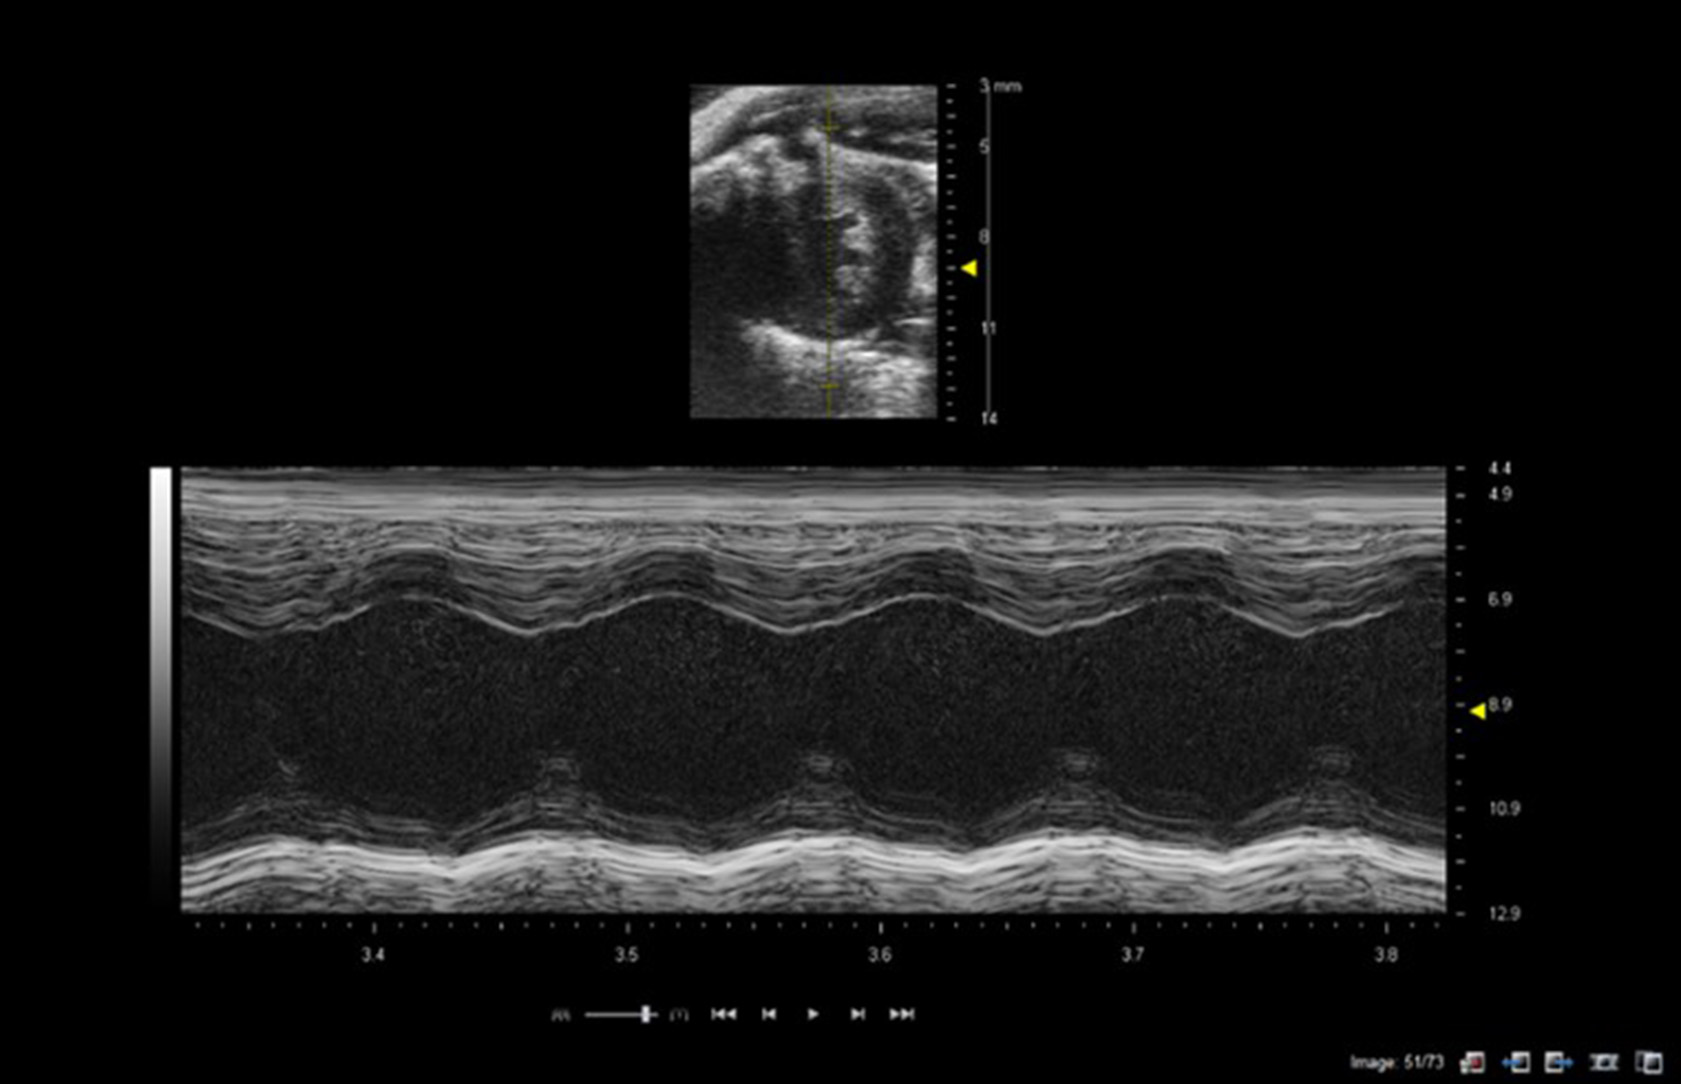
M-mode of mouse heart showing short-axis B-mode image in top half of image with M-mode line selected (yellow line in image). Lower image shows M-mode trace through the left ventricle at level of papillary muscles. Images acquired using a 40 MHz probe focussed at 9 mm depth.
Three-Dimensional (3D) and 4-Dimensional (4D) Imaging
Currently, three-dimensional preclinical ultrasound images are generated by the acquisition of consecutive B-mode ultrasound images acquired at discrete step sizes along a pre-determined path. Commercial software then reconstructs the 3D volume with elevational resolution dependent on the step size between consecutive B-mode image acquisitions (Figure 3). For cardiac applications, images tend to be ECG and respiration-gated enabling accurate volumes of left ventricles to be determined which are not dependent on assumptions of the shape of the organs. In newer preclinical ultrasound scanners, complete 3D acquisitions are possible over a cardiac cycle (4D) enabling the dynamic movement of the heart to be viewed from any orientation. Acquisition times can be several minutes, dependent on the step-size between acquisition slices and relies upon good ECG and respiratory gating and high frame-rates. 3D imaging is also used to good effect in acquiring tumor volume data-sets, avoiding the need to make assumptions about the shape of tumor from a 2D image or the use of measurement calipers for superficial tumor volume assessment.
Figure 3
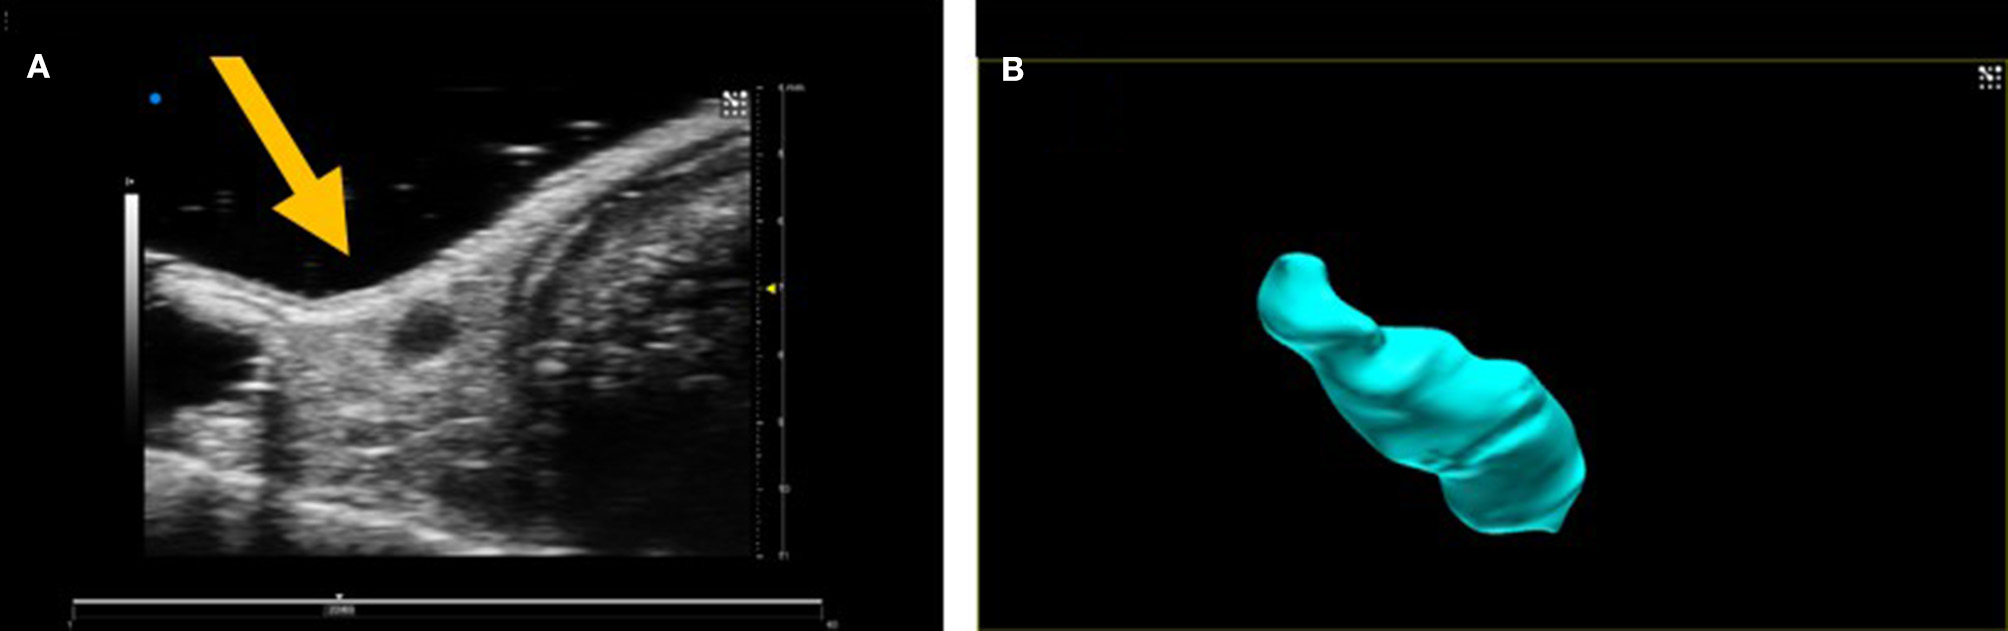
(A) 2D B-mode image of an inguinal lymph node and (B) 3D volume of lymph node after 3D acquisition.
Doppler Techniques
Measurement of blood flow relies upon the use of the Doppler principle such that the measured change in frequency between a transmitted and received ultrasound beam is related to the velocity of the scatterers (red blood cells) from which the ultrasound beam is reflected.
Spectral Doppler
Spectral Doppler enables the Doppler frequency shift within a pre-selected region-of-interest (Doppler sample volume) to be displayed as a function of time. Most accurate measurements are made when the Doppler scatterers (red blood cells) are moving in the direction of the transmitted ultrasound beam. If the ultrasound beam cannot be aligned with the direction of blood flow, an angle correction can be made which attempts to compensate for this lack of alignment (Figure 4).
Figure 4
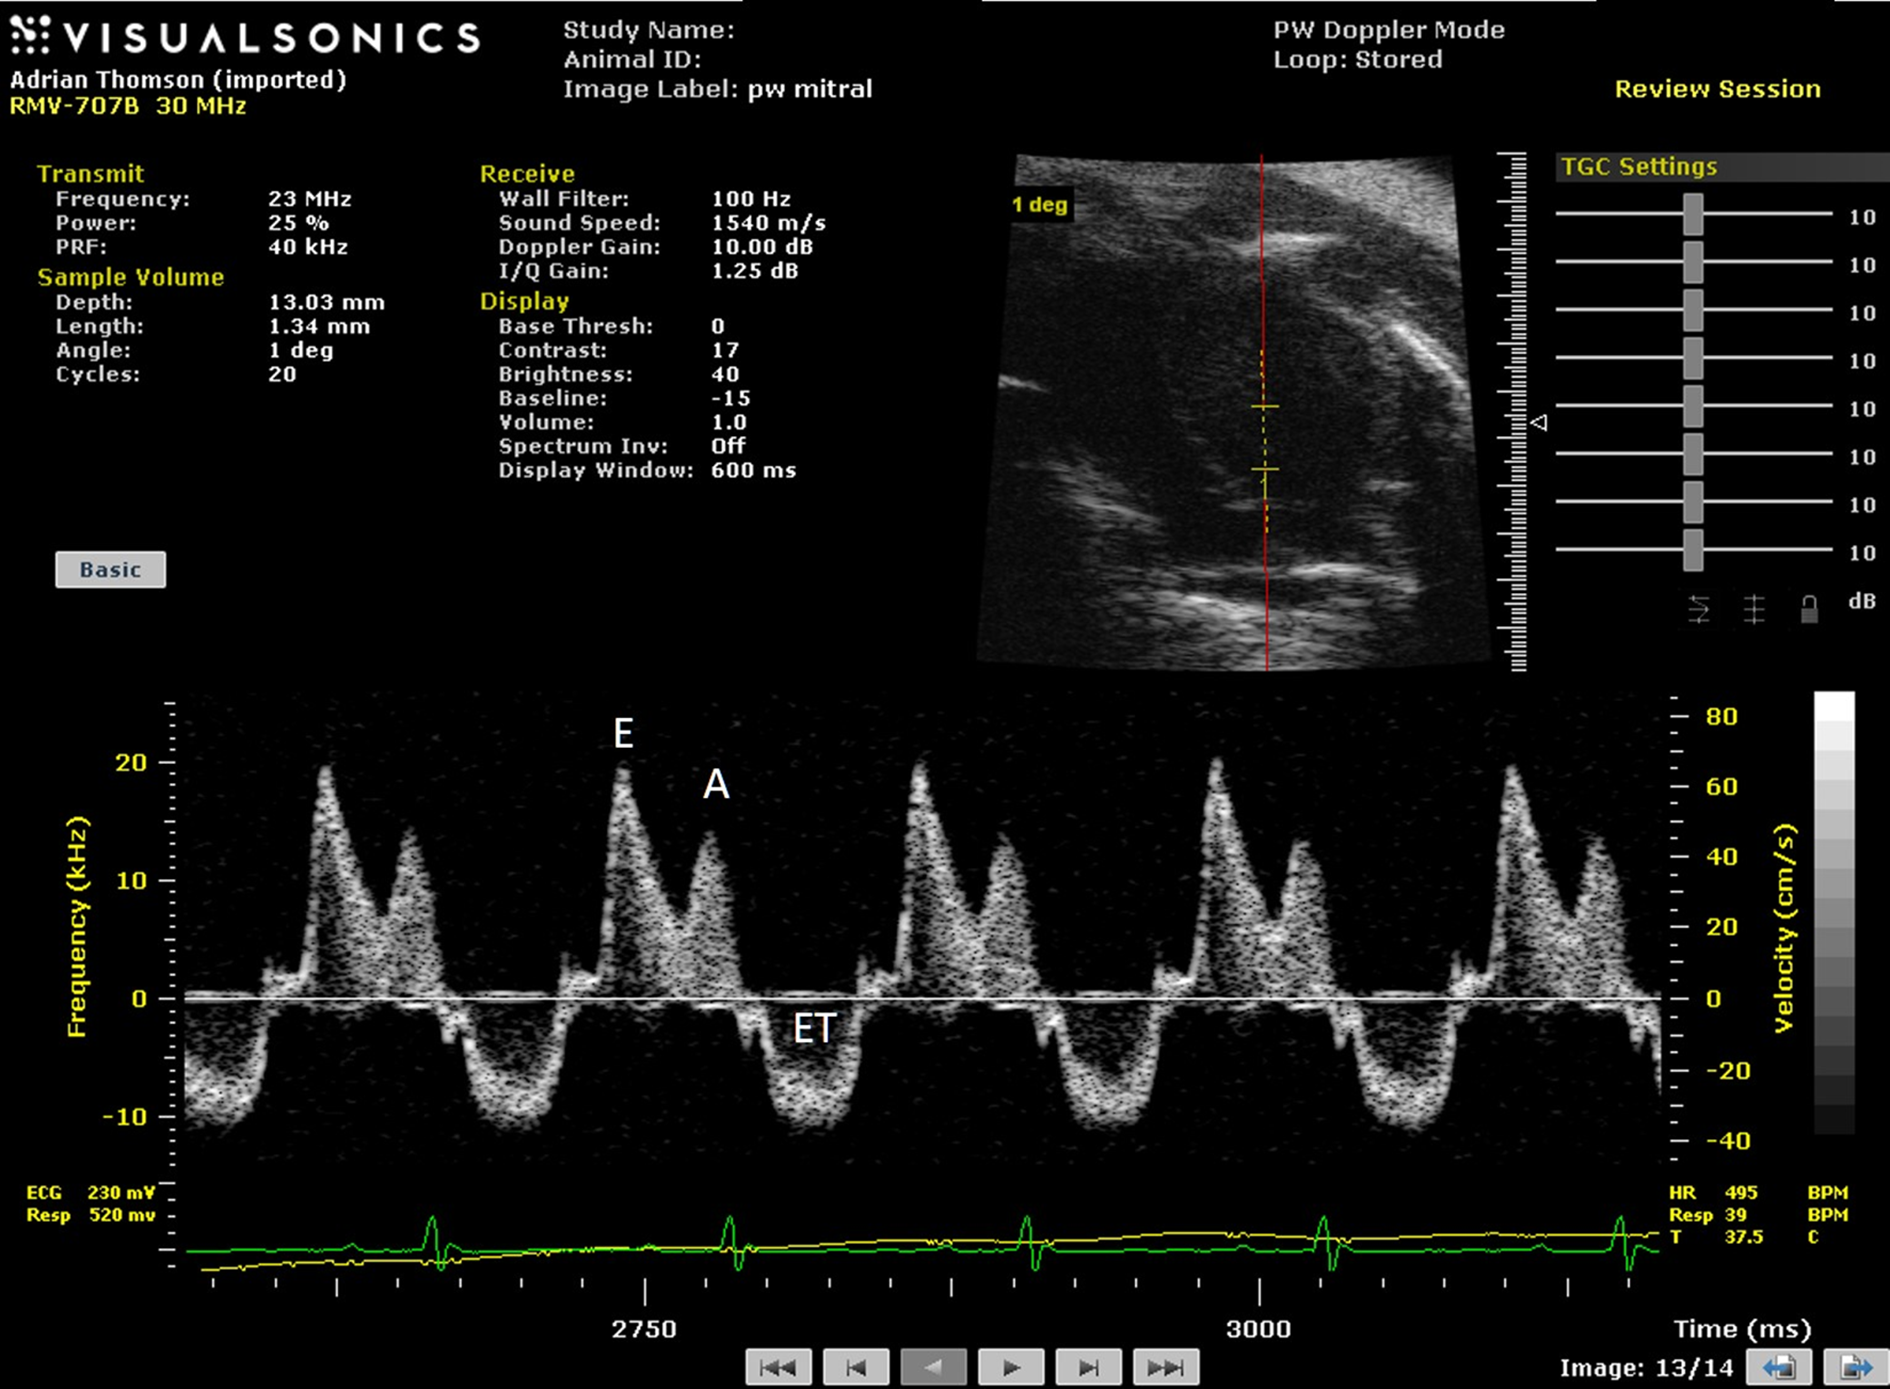
Spectral Doppler trace with Doppler sample volume situated in center of left ventricle enables both inflow and outflow from the left ventricle to be measured with early (E) and late (atrial—A) waves and ejection time (ET) highlighted in the spectral Doppler trace. In addition isovolumic relaxation time (IVRT) and isovolumic contraction time (IVCT) may be measured where IVRT is equal to the time from the closure of the aortic valve to opening of mitral value and IVCT is the time of closure of mitral valve to opening of aortic valve.
Color Doppler
In Color Doppler mode, the mean velocity of scatterers (red blood cells) within a pre-selected region-of-interest are color-encoded and superimposed on the gray-scale B-mode image. In clinical applications blood moving away from the transducer tends to be encoded in shades of blue and blood moving toward the transducer in shades of red. For preclinical applications, color Doppler is especially useful for the rapid location of vessels (Figure 5).
Figure 5
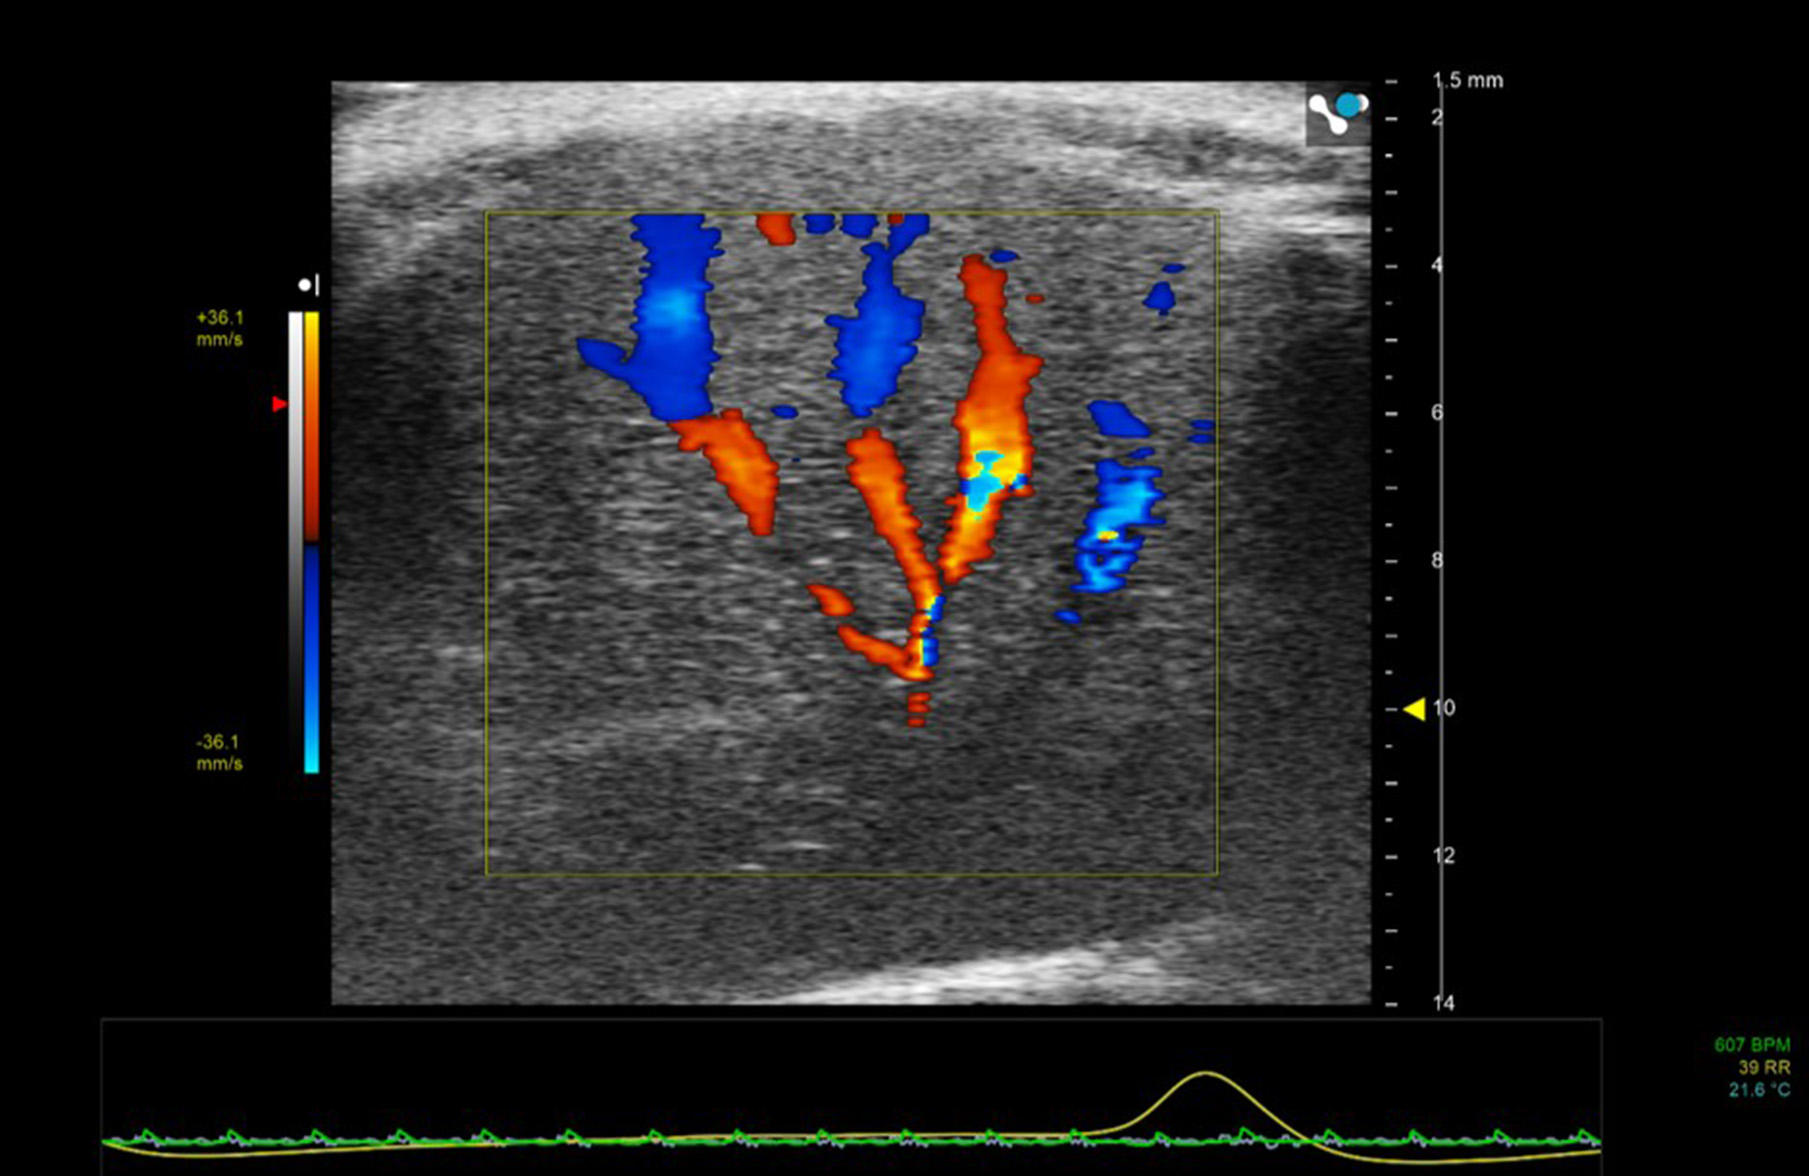
Color Doppler region of interest superimposed on 2D B-mode image of mouse liver. Color Doppler shows the vessel network—blue indicating movement of blood away from the transducer and red toward the transducer.
Power Doppler
In Power Doppler mode the power of the Doppler signal backscattered from red blood cells is displayed as a function of time within a pre-selected region of interest. The color is superimposed onto the gray-scale B-mode image. However, no directional information on blood flow is obtained but power Doppler is a more sensitive indicator of vascularity and thus useful in the detection of small vessels containing slower blood flow (Figure 6).
Figure 6
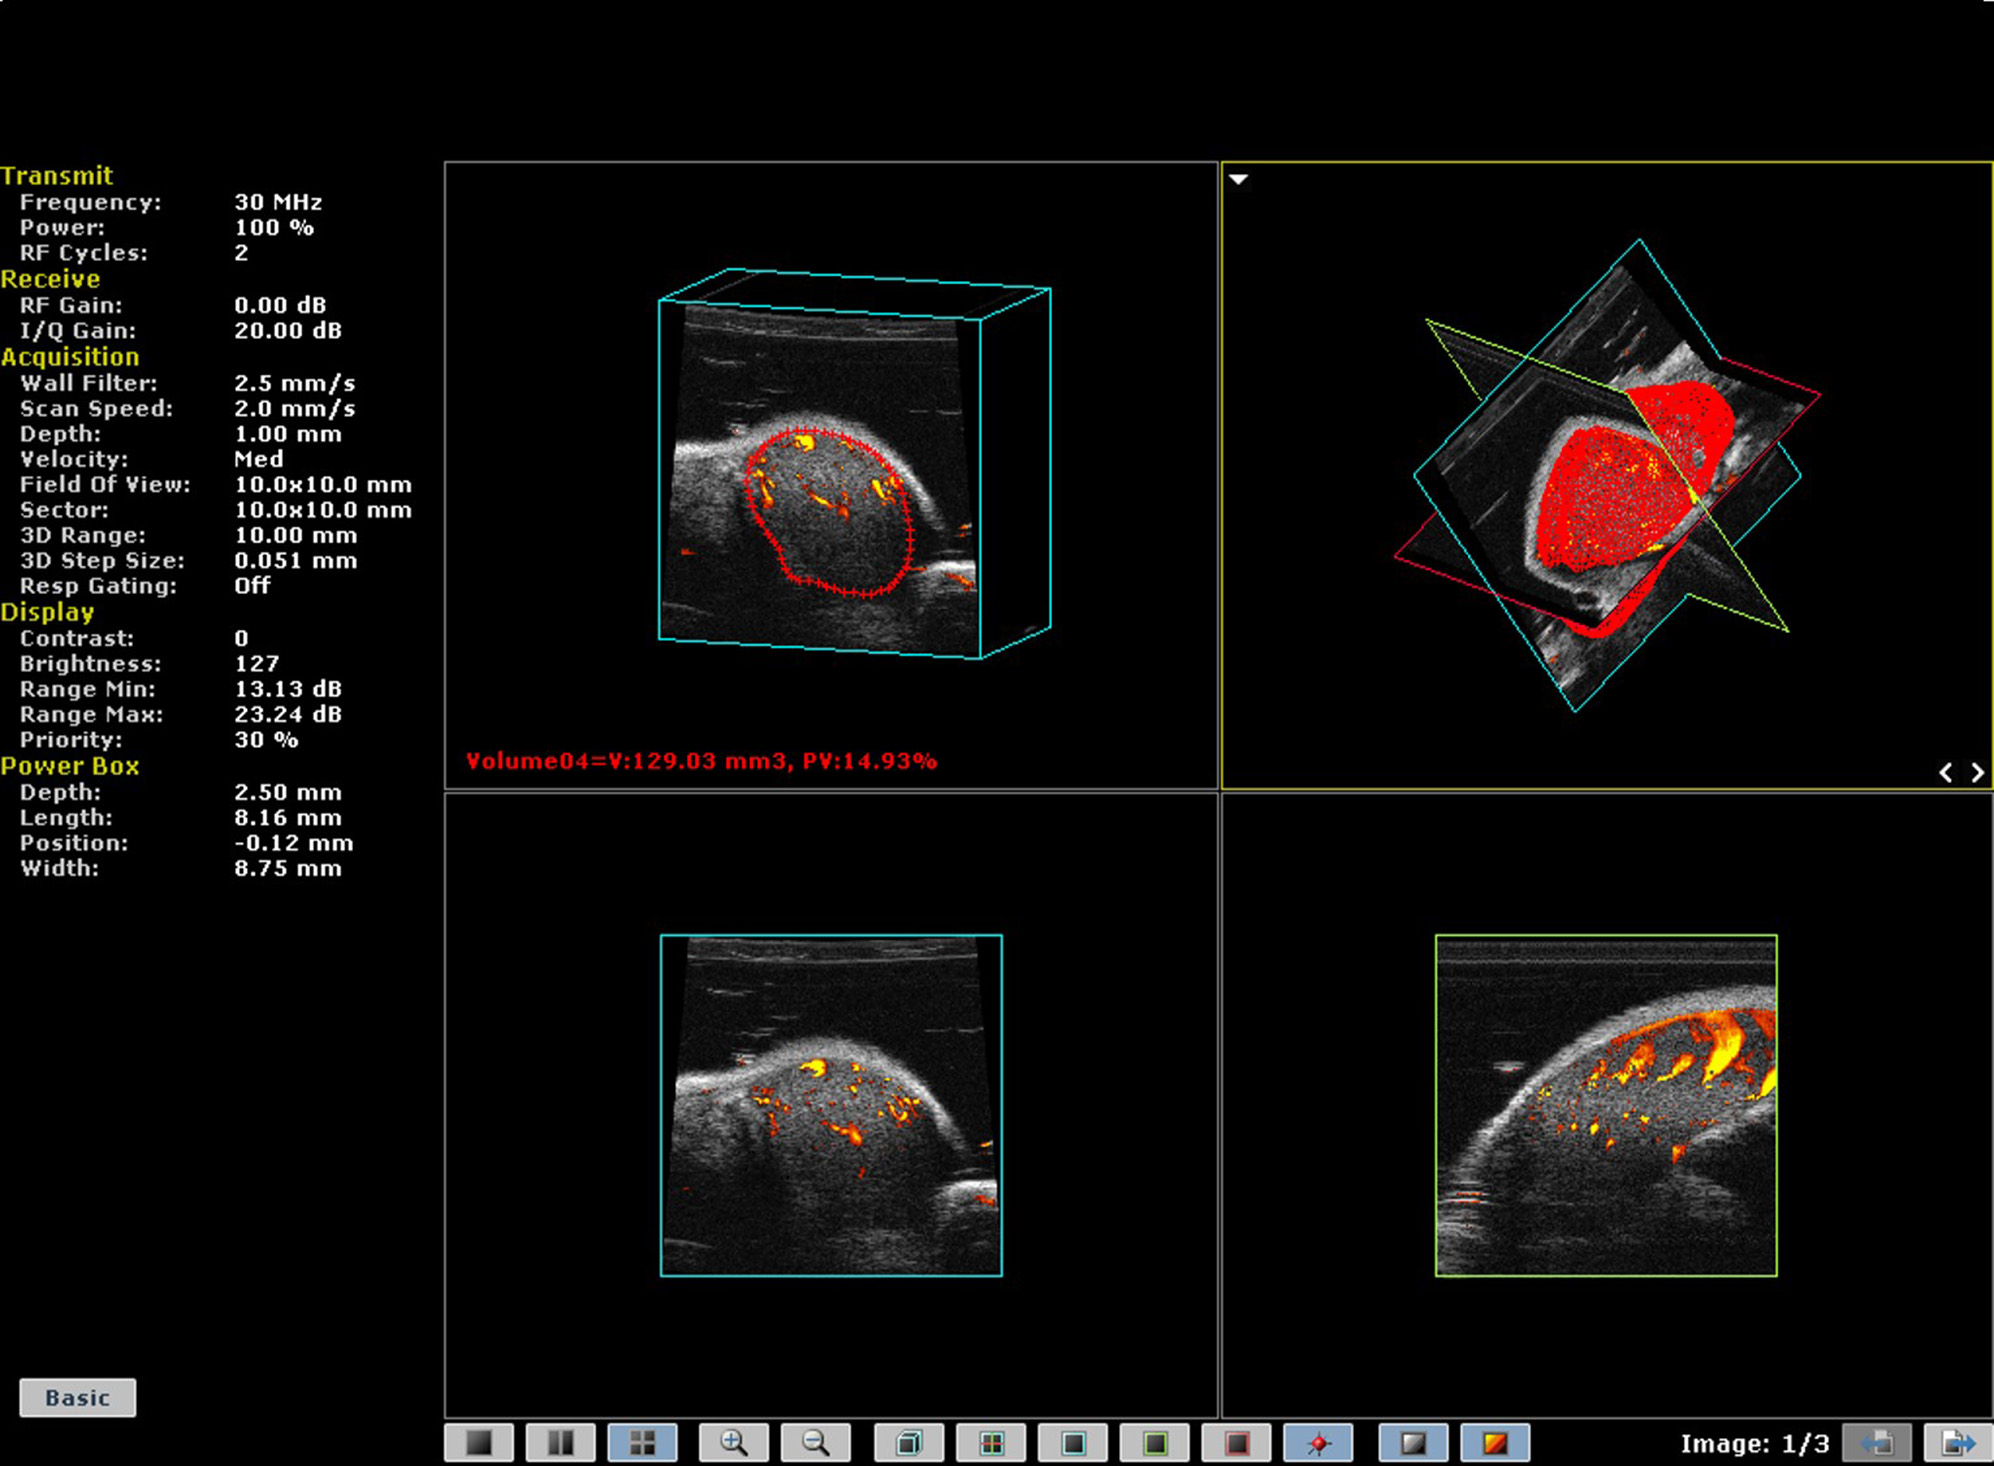
3D Power Doppler image of mouse testes. Imaged using 40 MHz probe.
Doppler Tissue Tracking
The Doppler principle can also be applied to quantify both inter-and intra- regional soft tissue movement in a technique known as tissue Doppler imaging. In this technique, the sample volume is placed within the moving tissue of interest, and the amplitude of the high-pass filter is reduced to enable slow, high-amplitude signals corresponding to tissue to be tracked [2]. By measuring the velocities between tissues regions, velocity gradients (rate of change of velocity with distance) and strain rate information can be calculated. However, tissue Doppler is only useful when the tissue motion is aligned with the direction of the ultrasound beam which has limitations in the assessment of cardiac radial function but has been used to good effect in studying mitral valve annulus movement.
Newer Imaging Techniques
Speckle Tracking
Alternative non-Doppler techniques such as speckle tracking can also be used to track tissue motion and as such are not reliant on alignment between beam and direction of movement. Speckle is effectively the fine background noise on ultrasound images. It is formed by the interference between echoes from structures which are smaller than the resolution of the ultrasound system. This interference pattern (speckle) is random and unique for any volume of tissue and although it may change with movement of the tissue, image processing techniques can be used to recognize and track the movement in 2D and 3D [3]. In order to use speckle tracking techniques, high frame-rates are required (>250 frames/s) with faster heart rates requiring higher frame-rates to ensure points of maximal and minimum strain and rate are captured. Using speckle tracking a range of parameters can be measured including displacement, velocity and strain and strain-rate.
Elastography Techniques
Ultrasound Elastography techniques are used to obtain information on the stiffness of tissue and can essentially be divided into those techniques which measure strain and those which measure shear wave velocity and from that directly measure Young's modulus (stress/strain). Strain elastography involves deformation of the tissue by application of a force (stress) and measuring the resulting degree of compression or extension of the tissue (strain) and comparing this to a reference soft tissue yielding a parameter known as the strain ratio. Since the magnitude of the stress applied is difficult to measure, strain elastography is not an intrinsic measure of tissue stiffness per se but the strain ratio can be used to infer tissue stiffness. Strain-rate is the change of tissue deformation with time. Both strain and strain-rate are routinely used in cardiac applications, where strain and strain-rate values from different regions of the myocardium can be compared. Strain analysis using ultrasound is generally performed using speckle tracking techniques whereby the speckle within different pre-selected ROIs (kernals) is tracked and the relative displacement between the two kernals can be measured. The distance between the two kernals, enables strain to be calculated and the variation of strain over time is strain-rate (s−1) [4] (Figure 7).
Figure 7
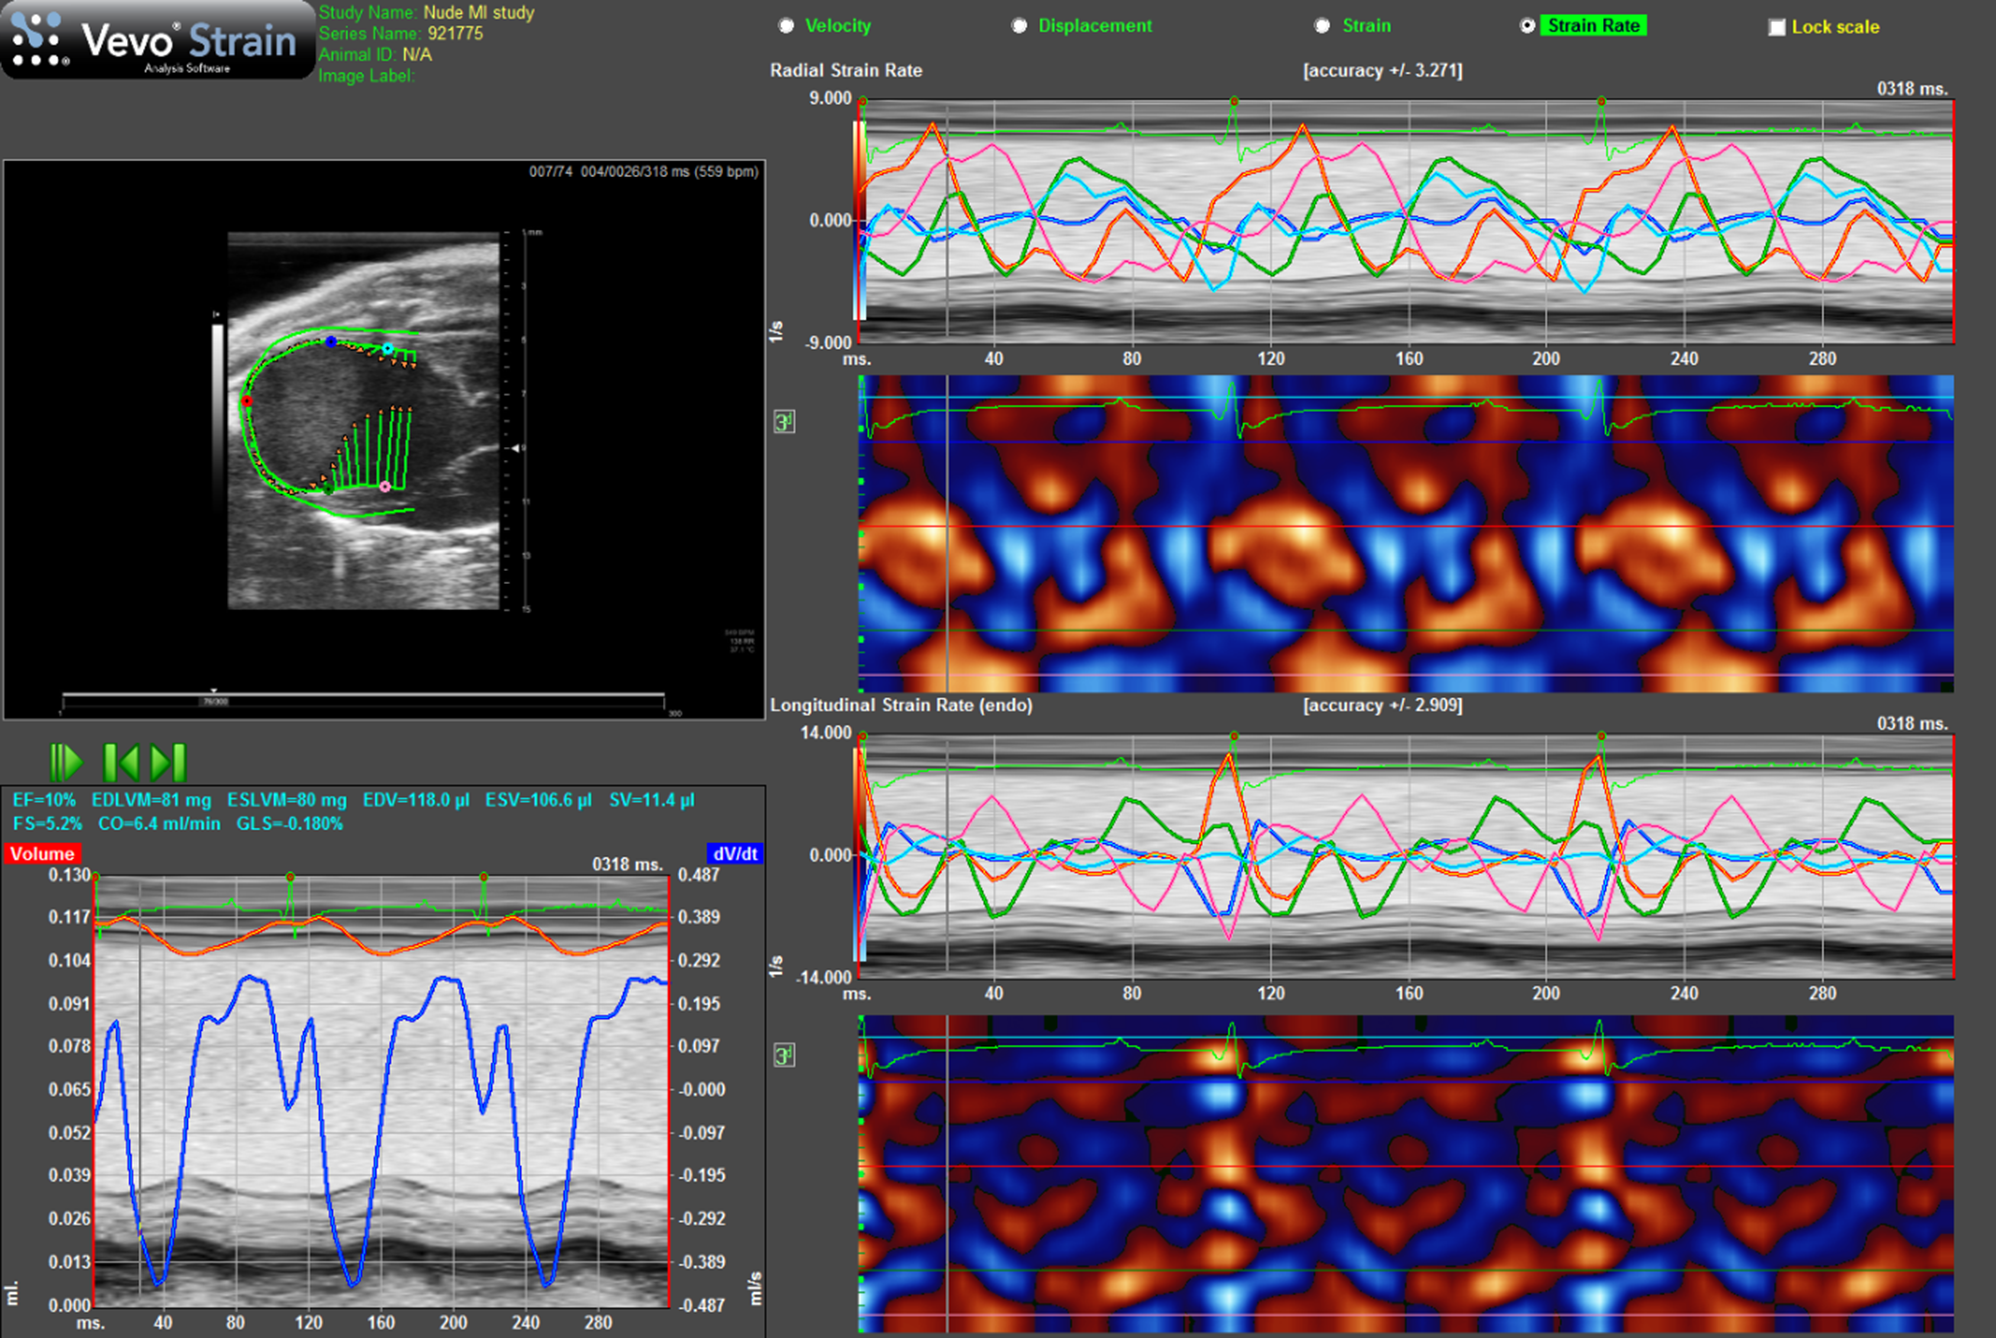
Strain rate imaging of a nude mouse with MI as the result of ligation of left coronary artery. Top lhs is long-axis view of heart with arrows indicating direction and magnitude of movement of endocardial border. Bottom lhs shows change in volume of cavity over consecutive cardiac cycles alongside ECG and respiration. Top rhs shows radial strain-rate curves from five points selected on endocardial border while lower rhs shows longitudinal strain-rate curves from the same five points.
Alternatively, the measurement of shear wave velocity enables a quantitative measurement of Young's modulus of elasticity, E, provided that the tissue can be assumed to be incompressible (no change in density) and uniformly elastic (Figure 8). The shear modulus G is related to the Young's modulus of elasticity E, by the following equation. E = 3G. Shear wave velocity, cs, generated as a result of a shearing force is given by, cs = √(G/ρ). By measuring the shear speed (usually between 1 and 10 m.s−1) and knowing the density, ρ, of the soft tissue (estimated at 1,000 kg.m−3), Young's modulus of elasticity can be calculated from the equation E = 3ρc. Hence measuring the shear speed can provide quantitative information on the elastic modulus. More detailed information on elastography techniques can be found in Hoskins [5] and Bamber et al. [6].
Figure 8
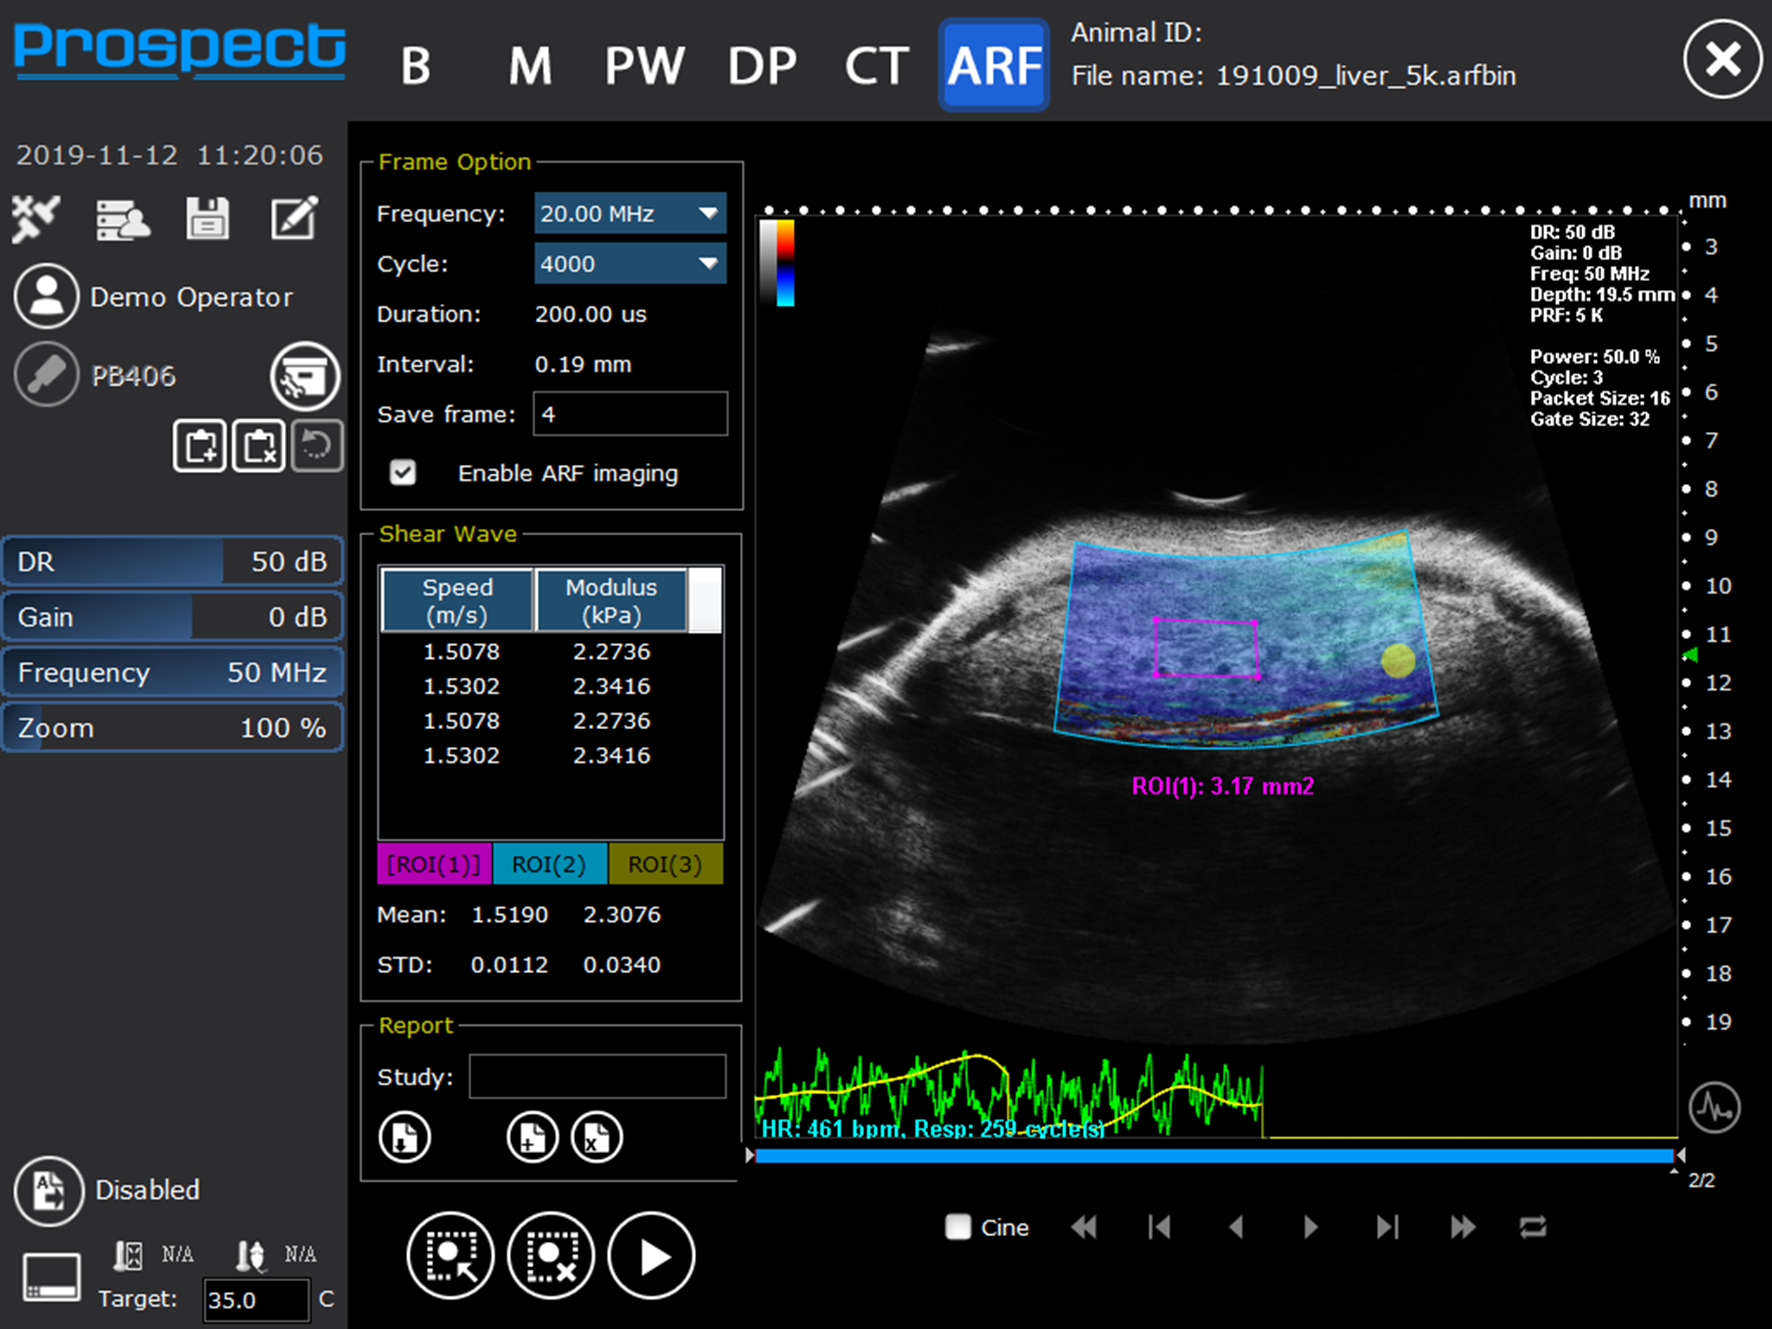
Shear wave elastography image of liver showing mean shear wave velocities and Young's modulus from a mouse liver (Reproduced with permission from S-Sharp Corporation).
Non-linear Imaging Techniques
Non-linear imaging techniques are utilized principally in the detection of ultrasonic contrast microbubbles (encapsulated gas bubbles). Contrast microbubbles when insonated with an ultrasound beam will begin to oscillate, expanding during the negative phase of the cycle and contracting during the positive phase. Dependent on the frequency and amplitude of the transmitted ultrasound the microbubbles can produce a significant non-linear backscattered signal without being destroyed. Since soft tissues predominantly scatter ultrasound in a linear manner by removing or canceling the linear component of the backscattered signal the kinetics and dynamic enhancement of organs can be visualized and quantified by measuring the increase in non-linear signal as a function of time. This can then be displayed in a variety of ways such as a maximum intensity projection sequence which will enable the dynamic filling patterns to be established within a region or as a graph illustrating the backscattered intensity kinetics within a region-of-interest (Figure 9).
Figure 9
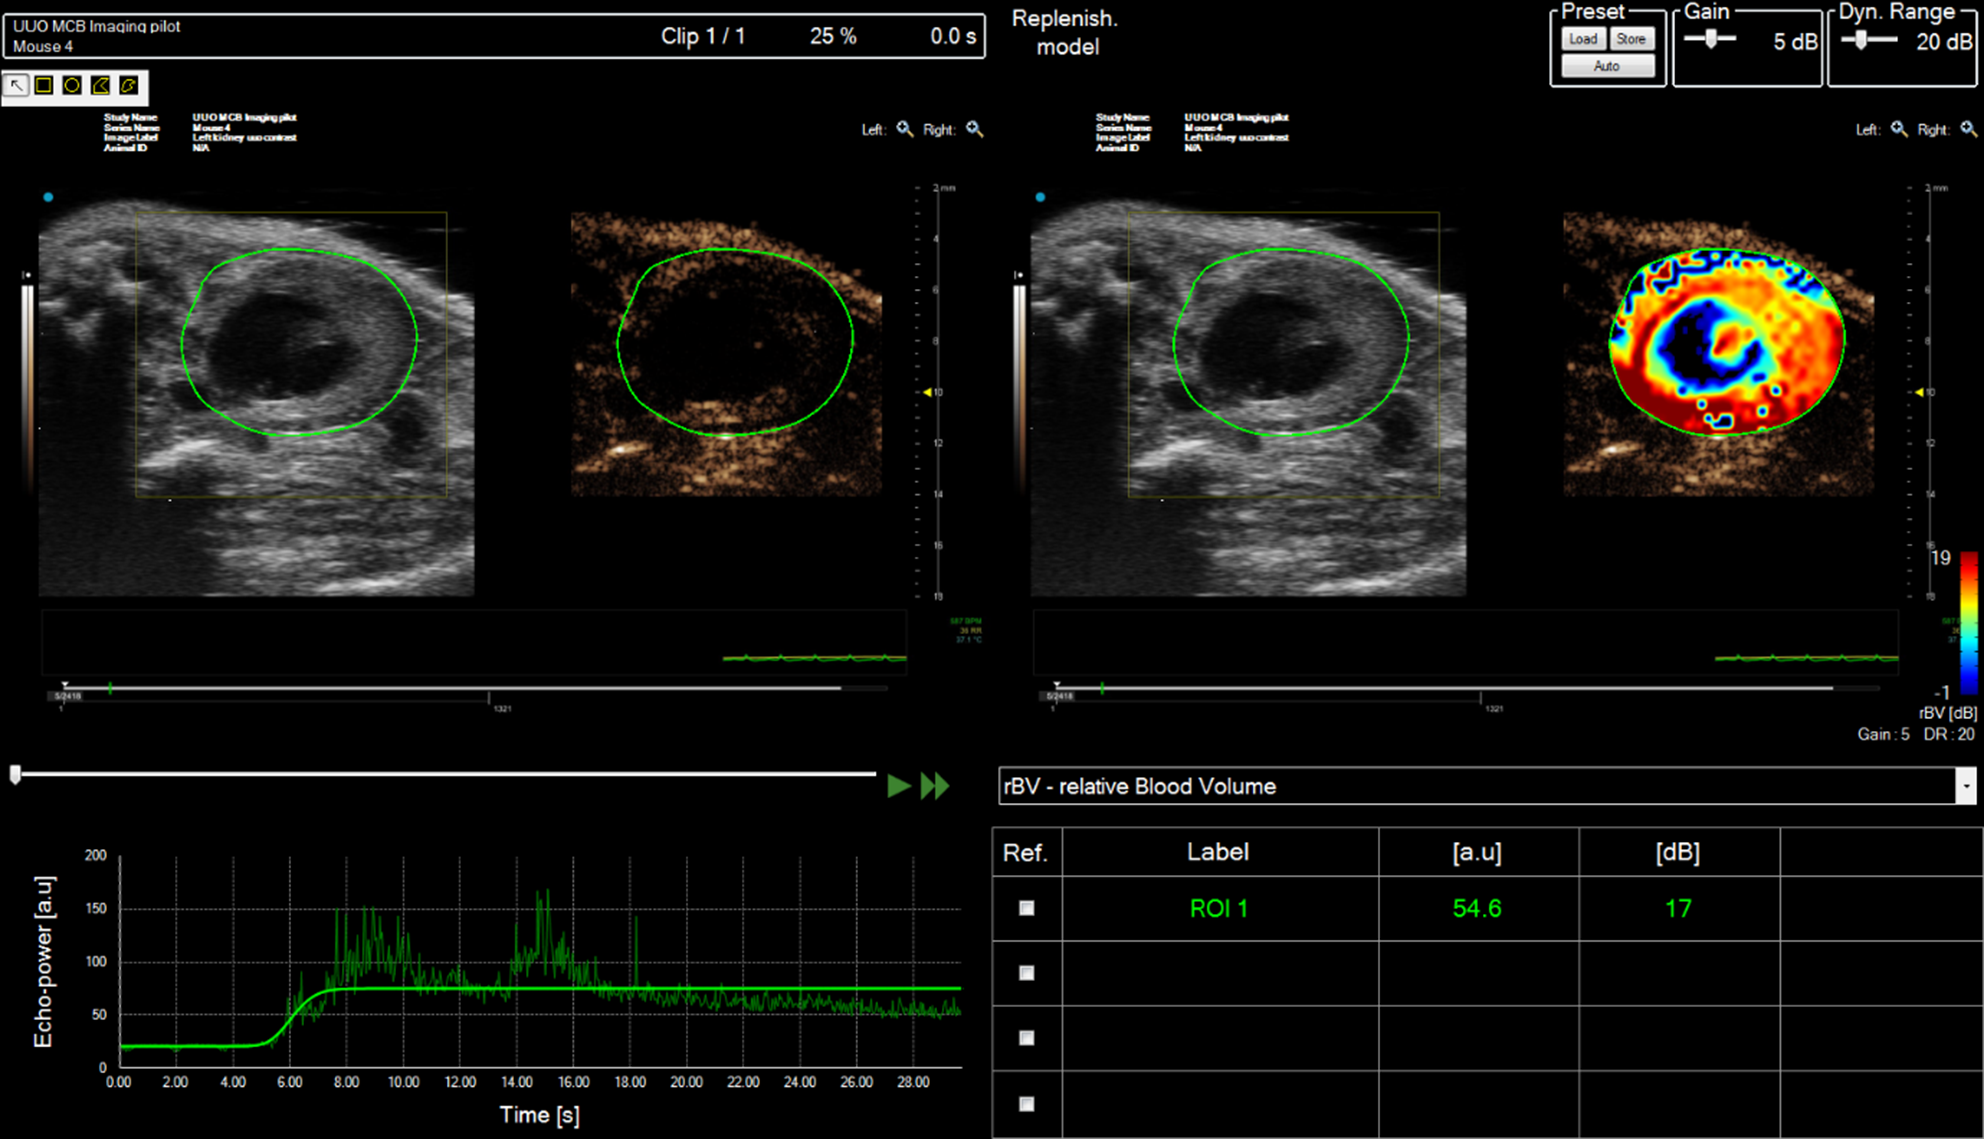
Contrast analysis of data-set acquired from right mouse kidney post ischemia-reperfusion (IRI) injury after tail-vein bolus injection of SonoVue. Mouse scanned in prone position. Multiple regions of interest (ROIs) can be drawn onto the image and the enhancement can be tracked as a function of time (bottom LHS). The relative enhancement of each ROI relative to pre-contrast image can be calculated and color-encoded (Top RHS).
Ultrafast Doppler
Novel imaging techniques such as ultrafast imaging and ultrafast Doppler techniques enable exquisitely detailed images and volumes of tumor vascularity to be built up even from vessels with very slow flow which are difficult to locate with standard Doppler techniques [7].
Preclinical Ultrasound—Cardiac Applications
The heart is probably the most challenging organ to image within the rodent due to its small size and rapid and complex motion. However, rodent models of cardiac diseases and myocardial infarction (MI) give valuable insights into anatomic and physiologic changes which are often directly aligned with changes observed in human cardiac disease and thus provide opportunities to assess novel therapeutic approaches and interventions.
Adult and neonatal cardiac scanning in mice, is routinely undertaken with the mouse in the supine position, hence the standard views obtained from mouse models are not exactly comparable to images acquired from clinical subjects who are scanned while lying in the left decubitus position. The ECG, respiration and temperature of the mouse are continuously recorded and monitored to ensure minimal variation throughout the scan-time. However, due to the range of mouse strains, anesthetic choice and depth there is a wide variation in accepted normal ranges of rodent cardiac indices. A recent review recommended standardized methods of measuring and reporting cardiac physiology in the adult murine model [8] and forms a useful step toward the introduction of standardized scanning procedures similar to those introduced by the American Society of Echocardiography and the European Association of Cardiovascular Imaging for clinical practice [9].
Similarly to clinical studies, all of the ultrasound imaging modalities: B-mode, M-mode, Doppler ultrasound and strain imaging can be used to assess cardiac function in mice.
Measurement of Cardiac Function in Adult Rodents
For adult mice scanning, transducer frequencies of 30–40 MHz are used, while for rats, ultrasound transducers operating between 10 and 25 MHz may be used—the higher frequencies for applications in smaller rats. To achieve high temporal resolution, only one focal position should be selected and placed at a depth commensurate with the region-of-interest.
There are two standard views used for initial assessment of the heart using parasternal 2D B-mode imaging—long-axis and short-axis views. Using these views initially provides a gross overview of the movement of left ventricular myocardial walls and mitral and aortic valve movements enabling areas of hyper-, hypo- or dyskinetic regions to be identified for further investigation. Due to the rapid heart-rate, cine-loops are generally acquired and can be reviewed at a much slower rate enabling key-points in the cardiac cycle such as systole and diastole to be identified. Alternatively a technique known as electrocardiogram-gated kilohertz visualization (EKV) can be used to investigate motion over one cardiac cycle with very high temporal resolution (1,000 frames/s). EKV scanning acquisition times are of the order of 30–60 s with the acquisition gated on the ECG and respiration cycles. Effectively sequential M-modes are acquired across the heart and temporally interleaved into a high temporal resolution 2D B-mode image data set of a cardiac cycle. Using this technique enables easier tracking of myocardial borders. Parameters that can be measured from B-mode or EKV images include stroke volume, ejection fraction, cardiac output, endocardial area, epicardial area, and percentage fractional myocardial area change. The formula and techniques used to measure these are beyond the scope of this review but can be found in Lang et al. [10].
M-mode is especially useful for the measurement of the maximum and minimum dimensions of the ventricles for calculation of cardiac indices such as fractional shortening and for the assessment of myocardial wall abnormalities (Figure 2). However, M-mode measurements of chamber size should not be used for measurement of cardiac indices derived from volume measurements (e.g., ejection fraction) as these make assumptions re the shape of ventricles which are prone to error especially for animal models which have suffered myocardial infarctions and for which the shape of the ventricle can undergo deformation and remodeling. M-mode imaging can also provide information about valve movements with the M-mode line aligned with the tip of the mitral valve leaflets to study the thickness of the leaflets and valvular dynamics. Likewise for the aortic valve M-mode can be used to assess aortic valve cusp separation.
Four–dimensional imaging of the rodent heart is undertaken by acquiring multiple 2D EKV cineloops over a cardiac cycle. Gating on the ECG and respiration can be done either during acquisition or reconstruction of the 3D data-set. These cineloops are acquired at discrete, user-determined distances in either long- or short- axis views yielding a full 4D dataset. The cineloops are then temporally interleaved and reconstructed to allow the heart to be dynamically visualized over one cardiac cycle. 4D imaging enables the volume of cardiac chambers to be established with fewer inherent assumptions re the shape and dynamics of the chambers compared to calculations using 2D images (Figure 10). As such calculation of indices requiring volume calculations, e.g., ejection fraction are more accurate and precise than measurements undertaken using 2D acquisitions [11].
Figure 10
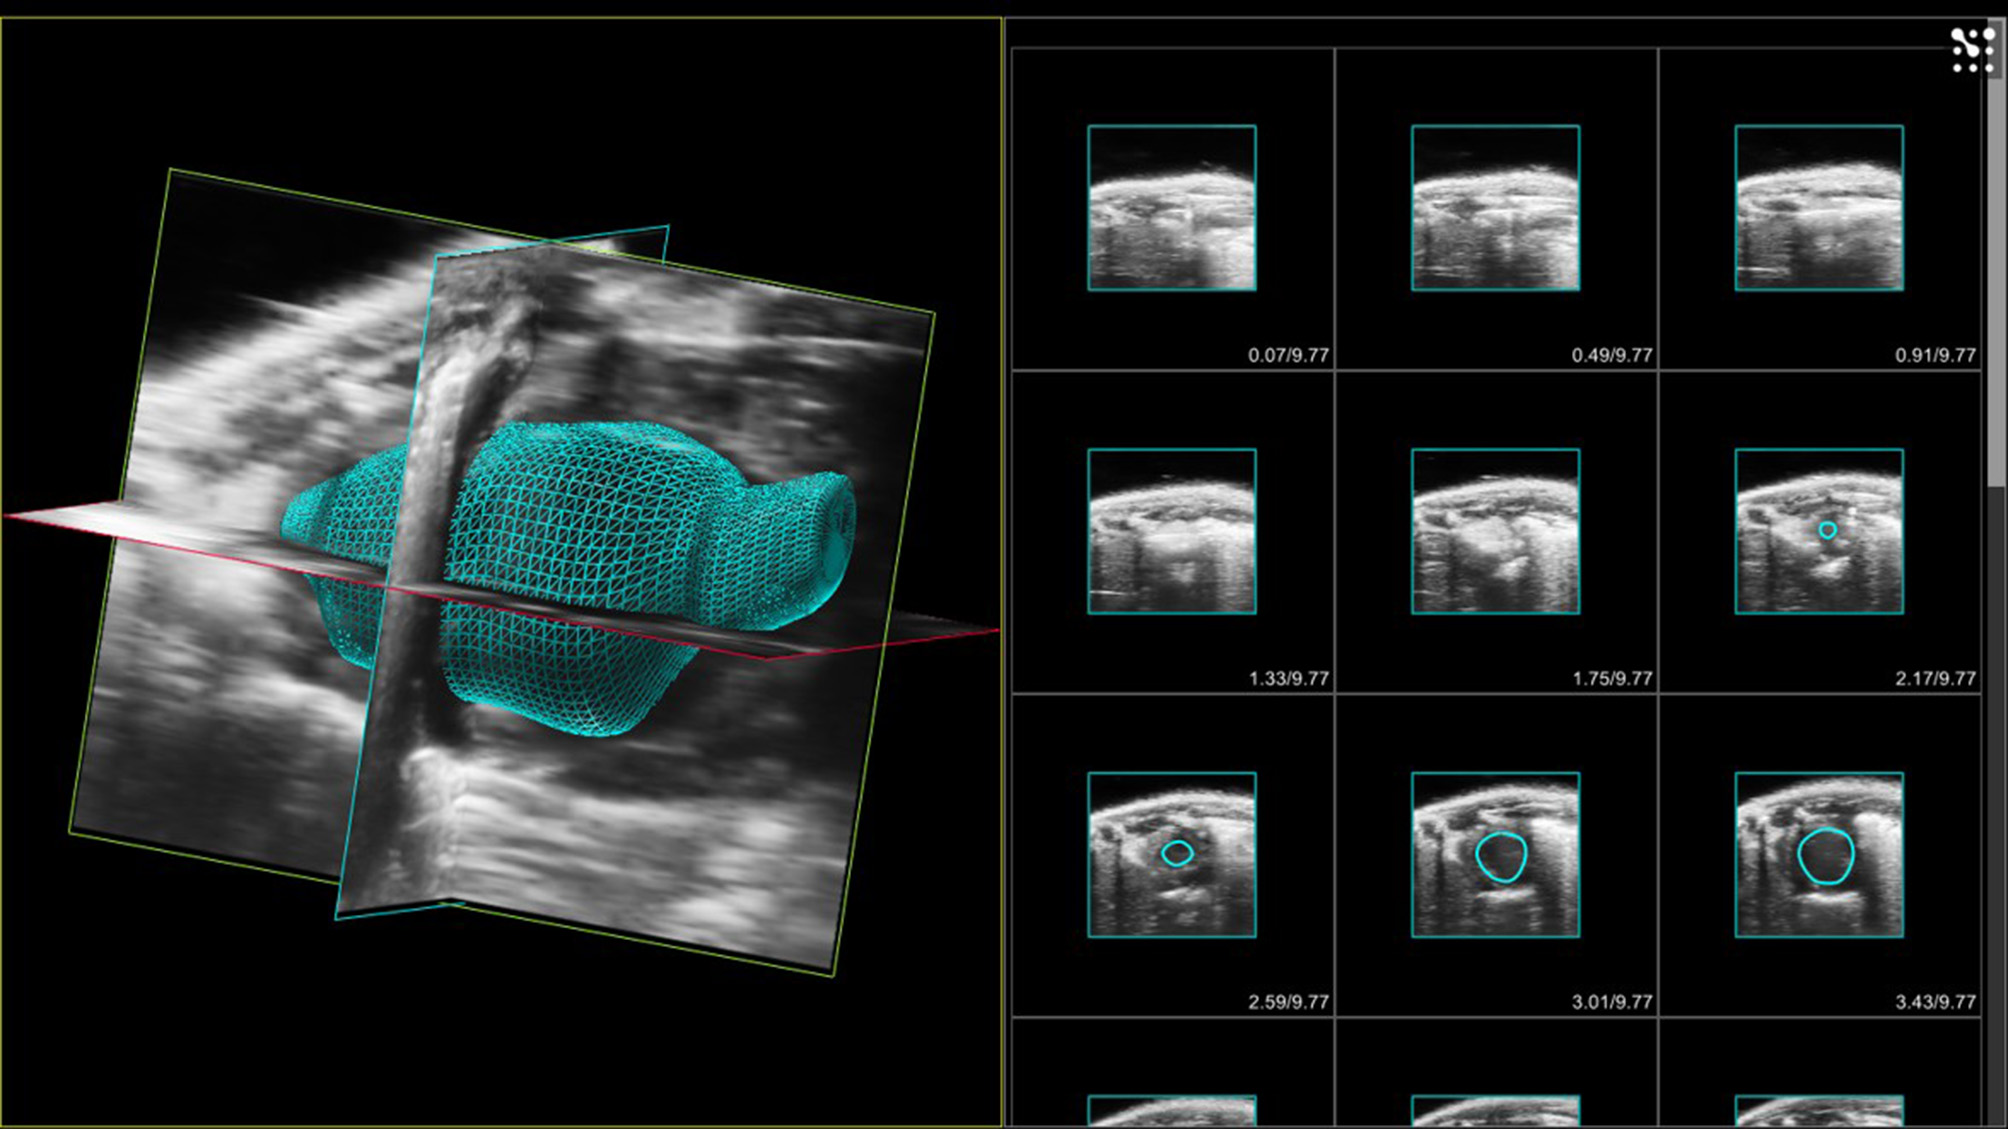
LHS - 3D volume of murine left ventricle with aortic root. Images acquired at end-diastole. RHS 2D acquired images with endocardial borders of left ventricle highlighted in each slice.
Doppler measurements are used in echocardiography to measure blood flow across the mitral and aortic valves within the heart. With the Doppler sample volume sited at mid-ventricular level, in the apical 4-chamber view, mitral valve early (E) and late [atrial (A)] inflow velocities can be seen in the mitral spectral Doppler trace—the ratio of E/A and the deceleration time of the E-wave are indicators used in the assessment of diastolic function (Figure 4). For some animals, separation of the E and A waves can be difficult to achieve due to the high heart-rates displayed by adult mice. However, isovolumic relaxation time can be measured along with systolic parameters such as ejection time and isovolumic contraction time enabling the calculation of myocardial performance index, an indicator of cardiac performance (see section on embryonic imaging).
Color Doppler is used in adult rodent echocardiography for the rapid assessment of blood flow within the chambers and specifically across valves. Constriction of valves can result in jetting which can be visualized as rapid flashes of color across the valves during contraction of chambers. This enables easier localization of the spectral Doppler sample volume within the jet to measure maximal velocities for assessment of constriction of valves. Color Doppler can also be used to localize small vessels. Figure 11 shows a duplex image (color and spectral Doppler) where color Doppler has being used to localize and identify the left anterior coronary artery and spectral Doppler enabling measurement of the velocities within the artery.
Figure 11
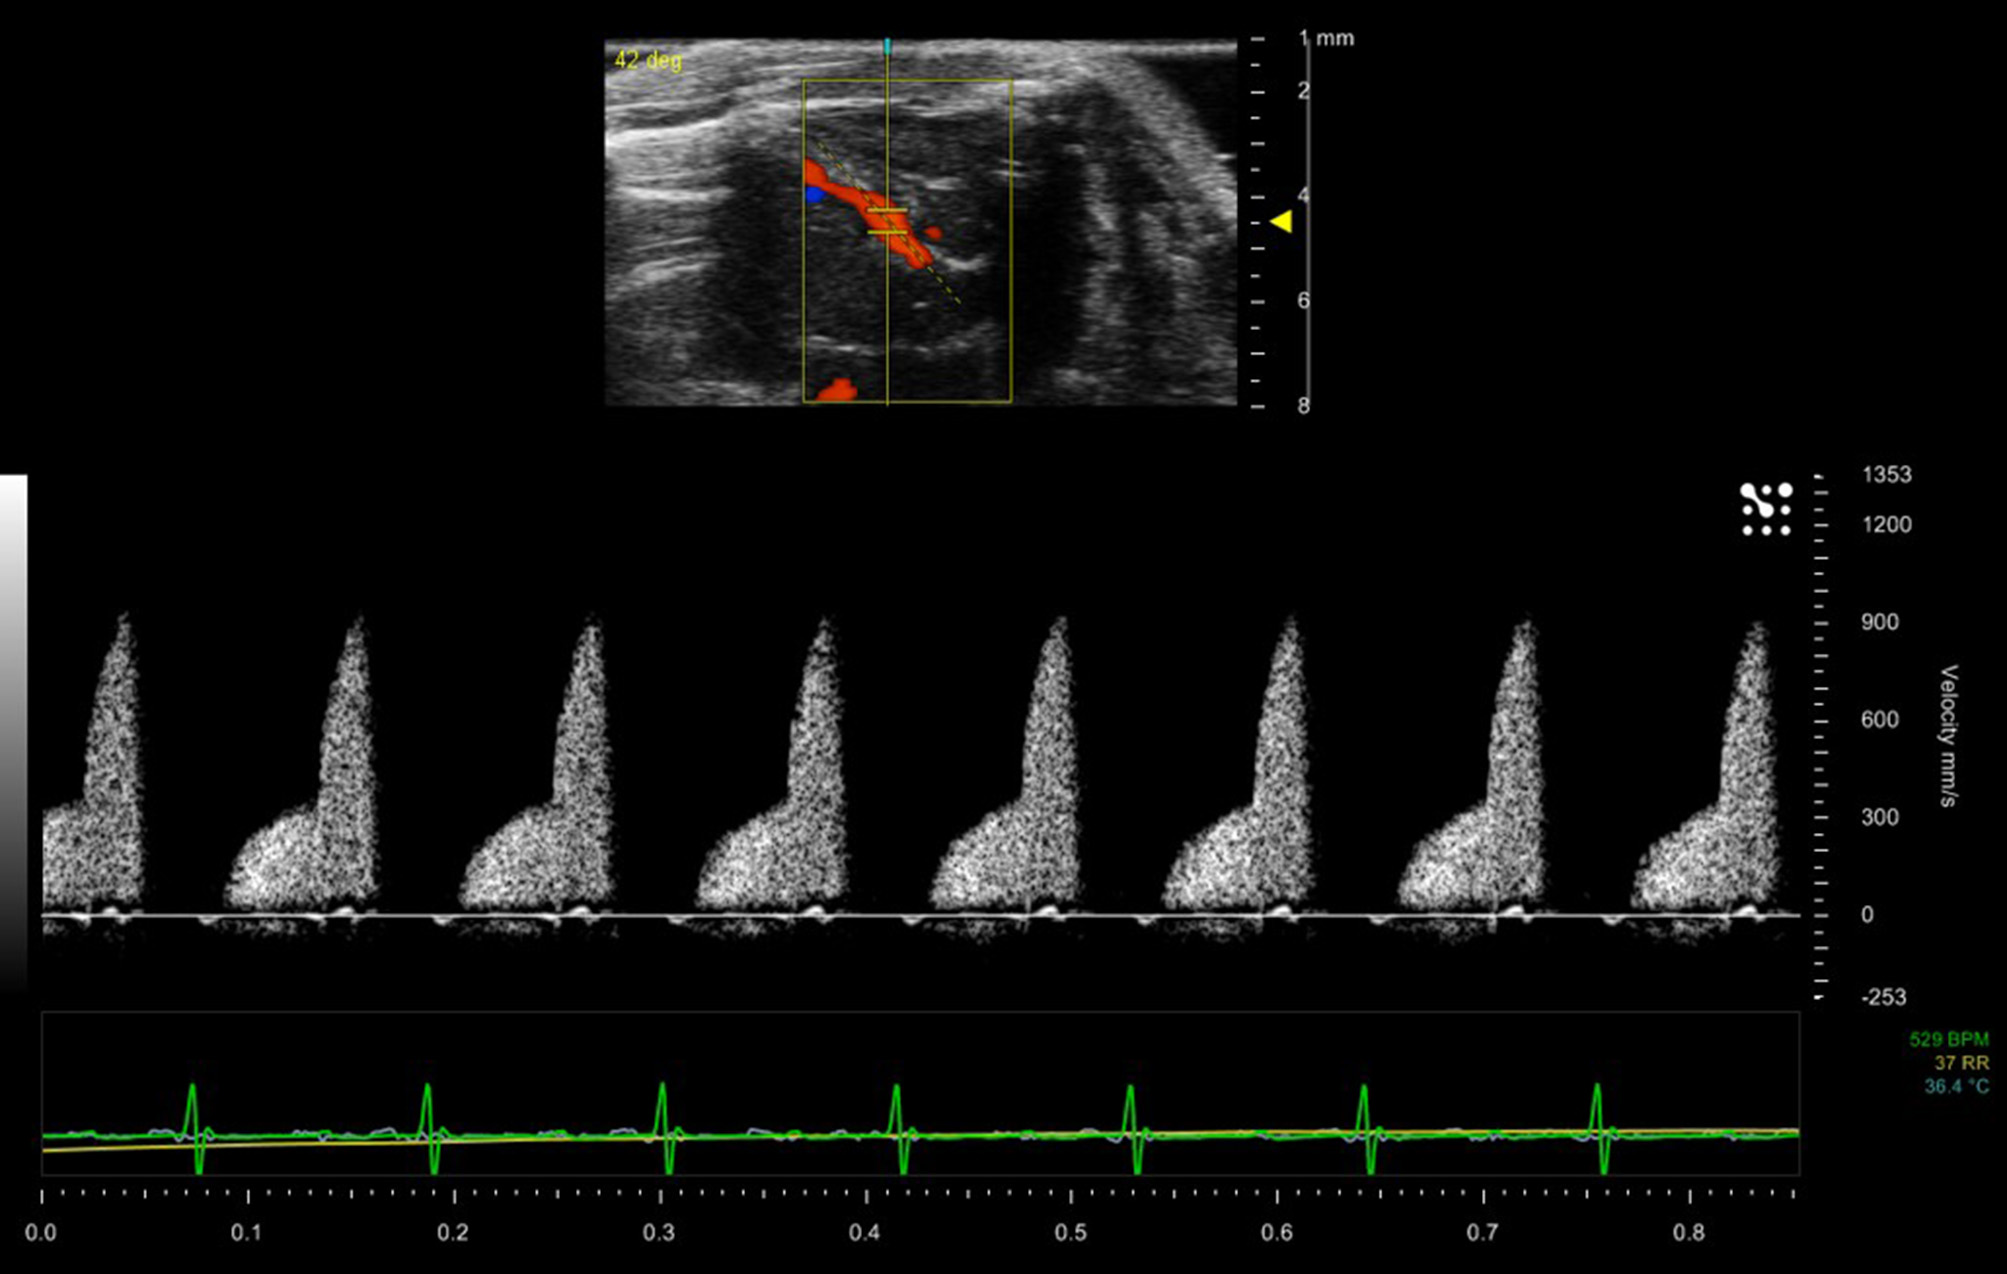
Blood flow within the left anterior descending coronary artery of a mouse model. Maximum velocity within the artery is 900 mm/sec.
Strain and Strain-Rate Imaging
Strain and strain-rate imaging are of specific value in rodent cardiac imaging providing information on regional myocardial deformation. Most commercial scanners use speckle tracking to determine strain (deformation)—by measuring the relative displacement of two kernals to determine strain and its variation over time to give strain-rate. In addition to a global strain parameter, radial, circumferential and longitudinal strain can be obtained providing information on regional segmental myocardial motion and systolic function. The timing of maximum and minimum strain and strain-rate values relative to systole and diastole can provide data on desynchronises between different myocardial regions especially relevant in infarct models (Figure 7) [12–14].
Contrast Agents
Ultrasonic contrast agents used in preclinical studies for ultrasonic enhancement are composed of lipid-encapsulated gas-filled microbubbles which are injected via the tail-vein into the rodent. The agents are purely vascular agents, mixing freely with the blood. Limited enhancement is achieved using B-mode imaging, but in many instances this is sufficient to give enhancement of endocardial borders even at these high frequencies far removed from the resonant frequency of the microbubbles. Such enhancement enables better visualization and delineation of chamber volumes. The maximum recommended volume of contrast is 5 μl/g IV for rats but for mice a bolus injection of 50 μl is sufficient to see enhancement within the heart.
Measurement of Cardiac Function in Embryonic Mice
In embryonic mice and rats, the ultrasound backscattered signal from the circulating red blood cells is much greater than in adults. This is due to the nucleation of the red blood cells within the embryos and this enhancement can persist up to 3 to 4 days post-birth. This enhancement of the cardiac chambers, along with the complexities of determining the direction of blood flow within embryonic hearts and subsequent alignment of the Doppler beam along the direction of blood flow can make measurement of cardiac performance of embryos a challenging technique. In addition, since it is not possible to obtain an ECG from the embryos, the timing of diastole and systole is determined either by measurement of the movement of the myocardial walls or from the spectral Doppler waveform. Finally, the user needs to be mindful of the duration of anesthesia and its effect on both dam and embryos.
Since determination of the orientation of the heart can be challenging, even in older embryos, measurement of ratios calculated from the Doppler spectral trace will negate the angle dependence associated with aligning the Doppler beam with the direction of flow. Hence E/A ratios discussed above are useful indices to obtain although in embryos the A wave tends to be larger than the E wave. Likewise a parameter known as the myocardial performance (Tei) index which is a ratio of timing intervals determined from the spectral Doppler trace [summation of the isovolumic relaxation time (IVRT) and isovolumic contraction time (IVCT) divided by the ejection time (ET)] is useful and is largely unaffected by the angle of insonation. The myocardial performance is an indicator of overall cardiac performance with higher index values corresponding to an increasing dysfunctional heart. Strain rate imaging in embryonic mice is challenging and this may be due to the increased echogenicity of the blood pool, making speckle tracking more difficult.
Measurement of Cardiac Function in Neonatal Mice
Cardiac scanning of neonatal mice from day 1 post-partum (P1) is also possible. However, due to their small size and reduced hair-cover, care needs to be taken to ensure that they maintain body temperature (monitored using a neonatal rectal probe) throughout the scan. In addition, neonates can present anesthesia challenges and use of an adaptor and nose cone to ensure sufficient depth of anesthesia is recommended. In addition, dependent on the scanning table utilized, it is often necessary to use copper-tape to extend the electrodes to ensure a good ECG signal is obtained [15]. Ultrasound probes operating up to 50 MHz can be used to image early post-partum neonates and EKV scanning can be used to acquire high temporal and spatial resolution images.
Measurement of Cardiac Function in Zebrafish
The zebrafish (Danio rerio) has increasingly become an important tool in medical research [16], with significant application to the investigation of an extensive range of cardiovascular human diseases [17]. Its small size and corresponding small space requirements, relatively rapid sexual maturity (~3 months), generation of hundreds of embryos every week and external fertilization makes it increasingly one of the accessible animals for study.
The cardiac function of zebrafish can be imaged using preclinical ultrasound. The zebrafish heart is composed of 4 chambers—sinus venosus, atrium, ventricle and bulbus arteriosus. Light anesthesia can be induced for adult fish by injection of MS222 in the tank water. The fish can then be manipulated and placed on their dorsal side and gently restrained using plasticine that is lightly hand-molded around their bodies. Transducers up to 55 MHz can be used to image the hearts in both long and short axis views. Obtaining an ECG signal from adult zebrafish is challenging so the timing of systole and diastole is determined from cardiac chamber size and spectral Doppler traces with adult heart rates ranging from 120 to 180 beats/min. Additionally, the echogenicity of blood within adult zebrafish is similar to the surrounding tissue structures (Figure 12) making the differentiation of chamber volumes challenging.
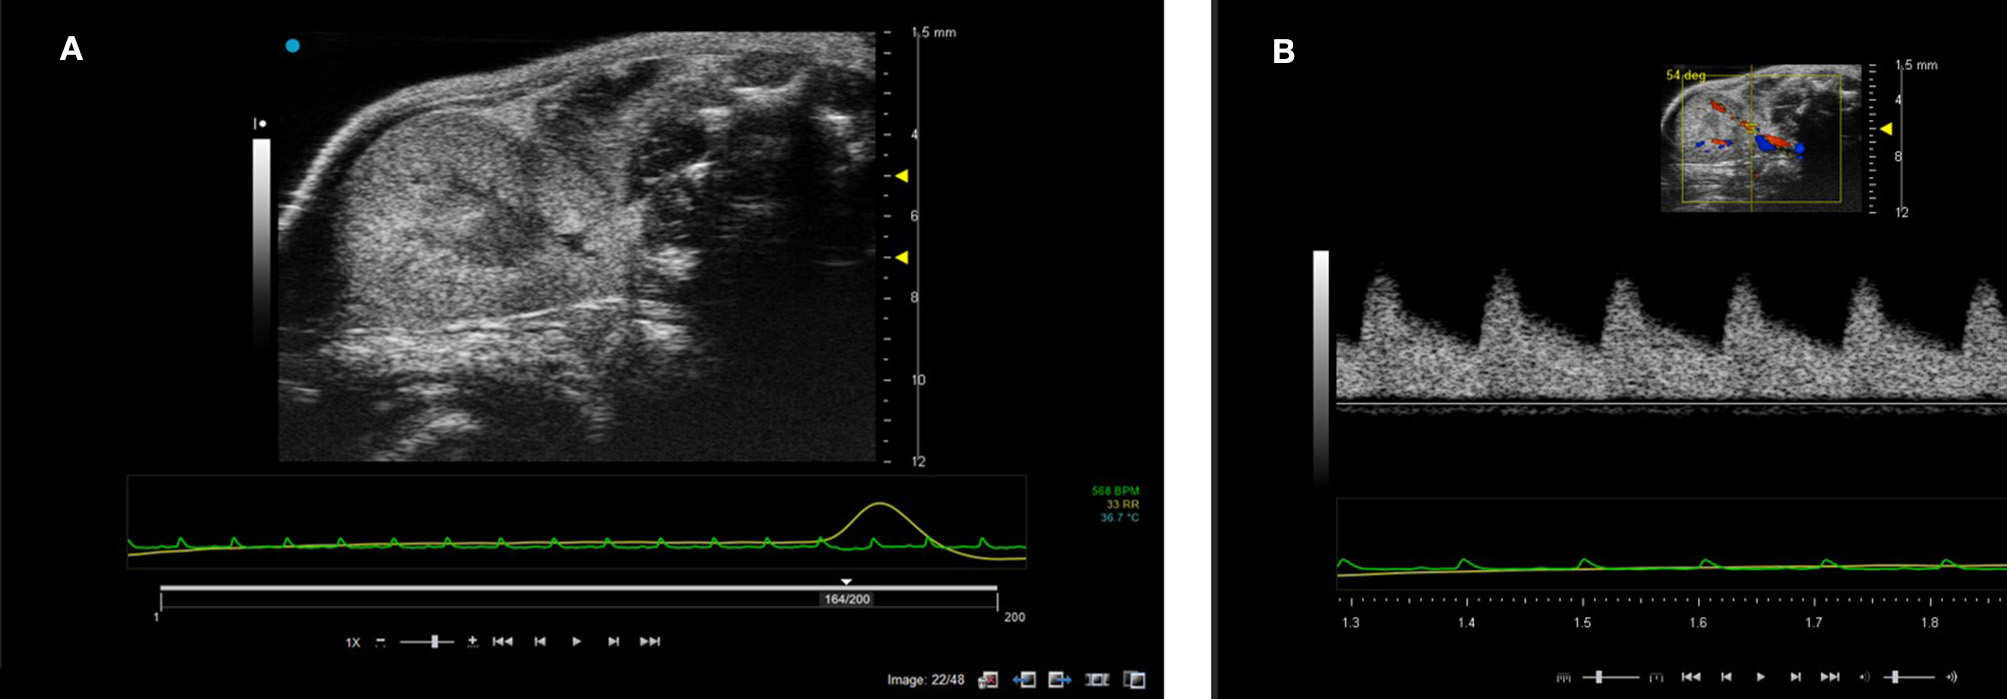
Figure 12
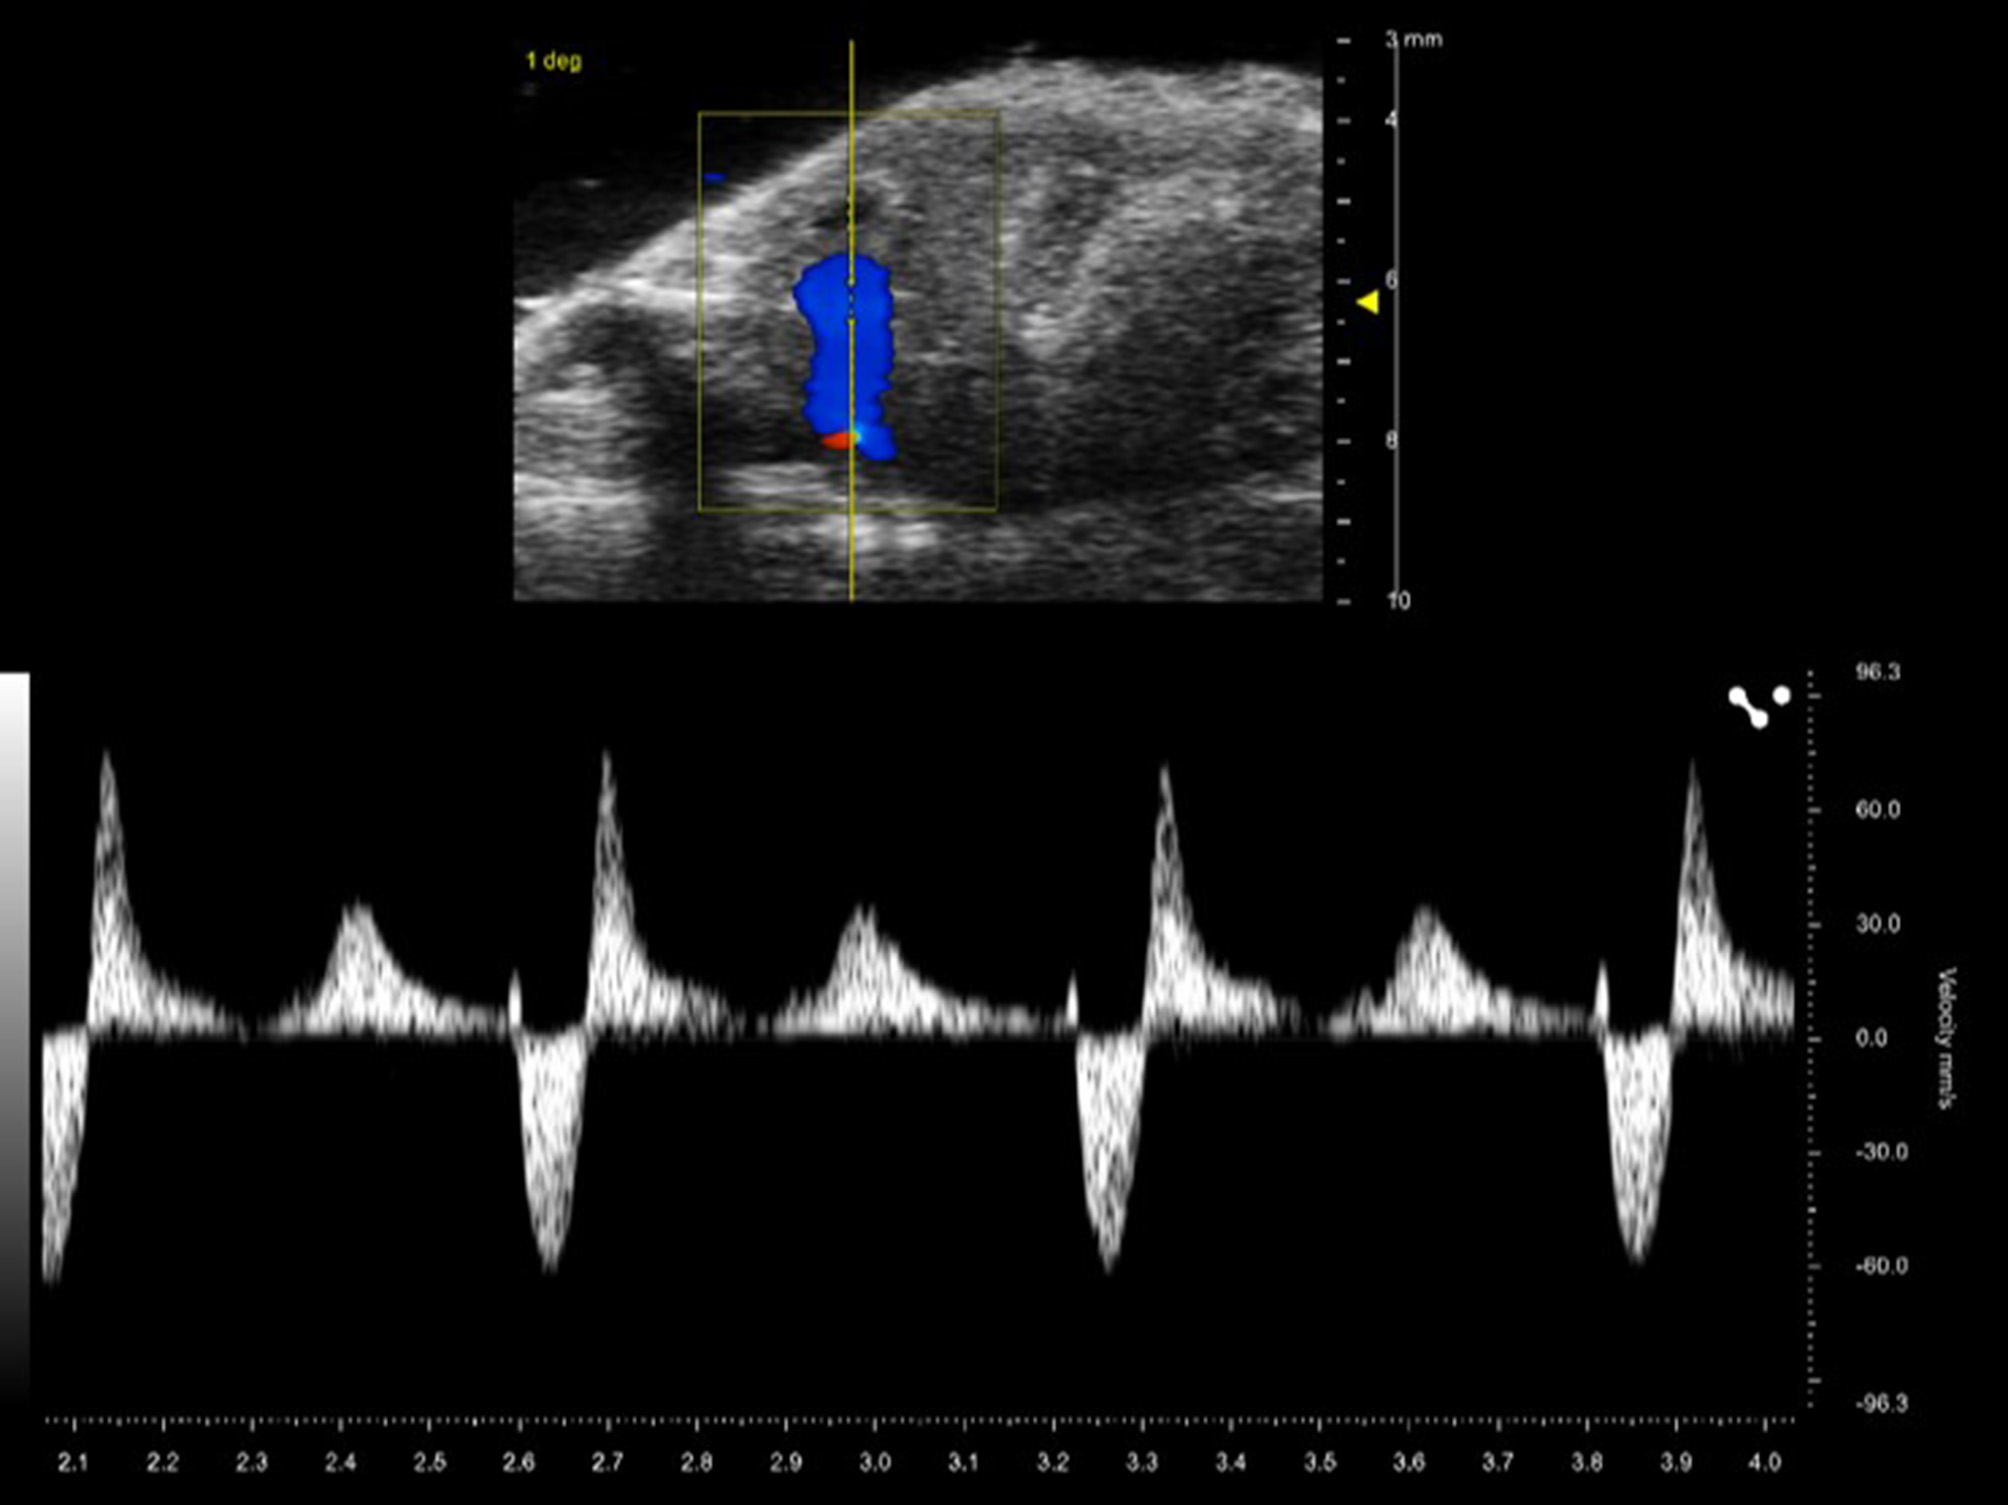
Spectral and color Doppler (Duplex) image of adult zebrafish heart.
Measurement of Cardiac Function in Embryonic Zebrafish
Assessment of cardiac function in embryonic zebrafish using ultrasound is also possible although the optical transparency of embryos means that cardiac function can also be studied using light microscopy techniques including video edge-detection techniques. Using Doppler ultrasound techniques, a rapid assessment of cardiac function can be undertaken with heart-rates in zebrafish embryos dependent on the temperature but at 28°C are around 200 bpm [18]. Before scanning, embryos are anesthetized in a petri-dish using MS222 and then embedded in agarose. Once the agar has set, fresh aquarium water is added to the dish to limit the effects of anesthesia. Individual embryonic fish can be then identified, and the orientation of their hearts noted using a stereomicroscope. The dish is then placed on top of a heated plate and temperature maintained at 28.5°C whilst scanning is being undertaken with a thermocouple placed adjacent to the embryo to monitor temperature. The ultrasound transducer is then lowered into the water and individual embryos may then be scanned (Figure 13).
Figure 13
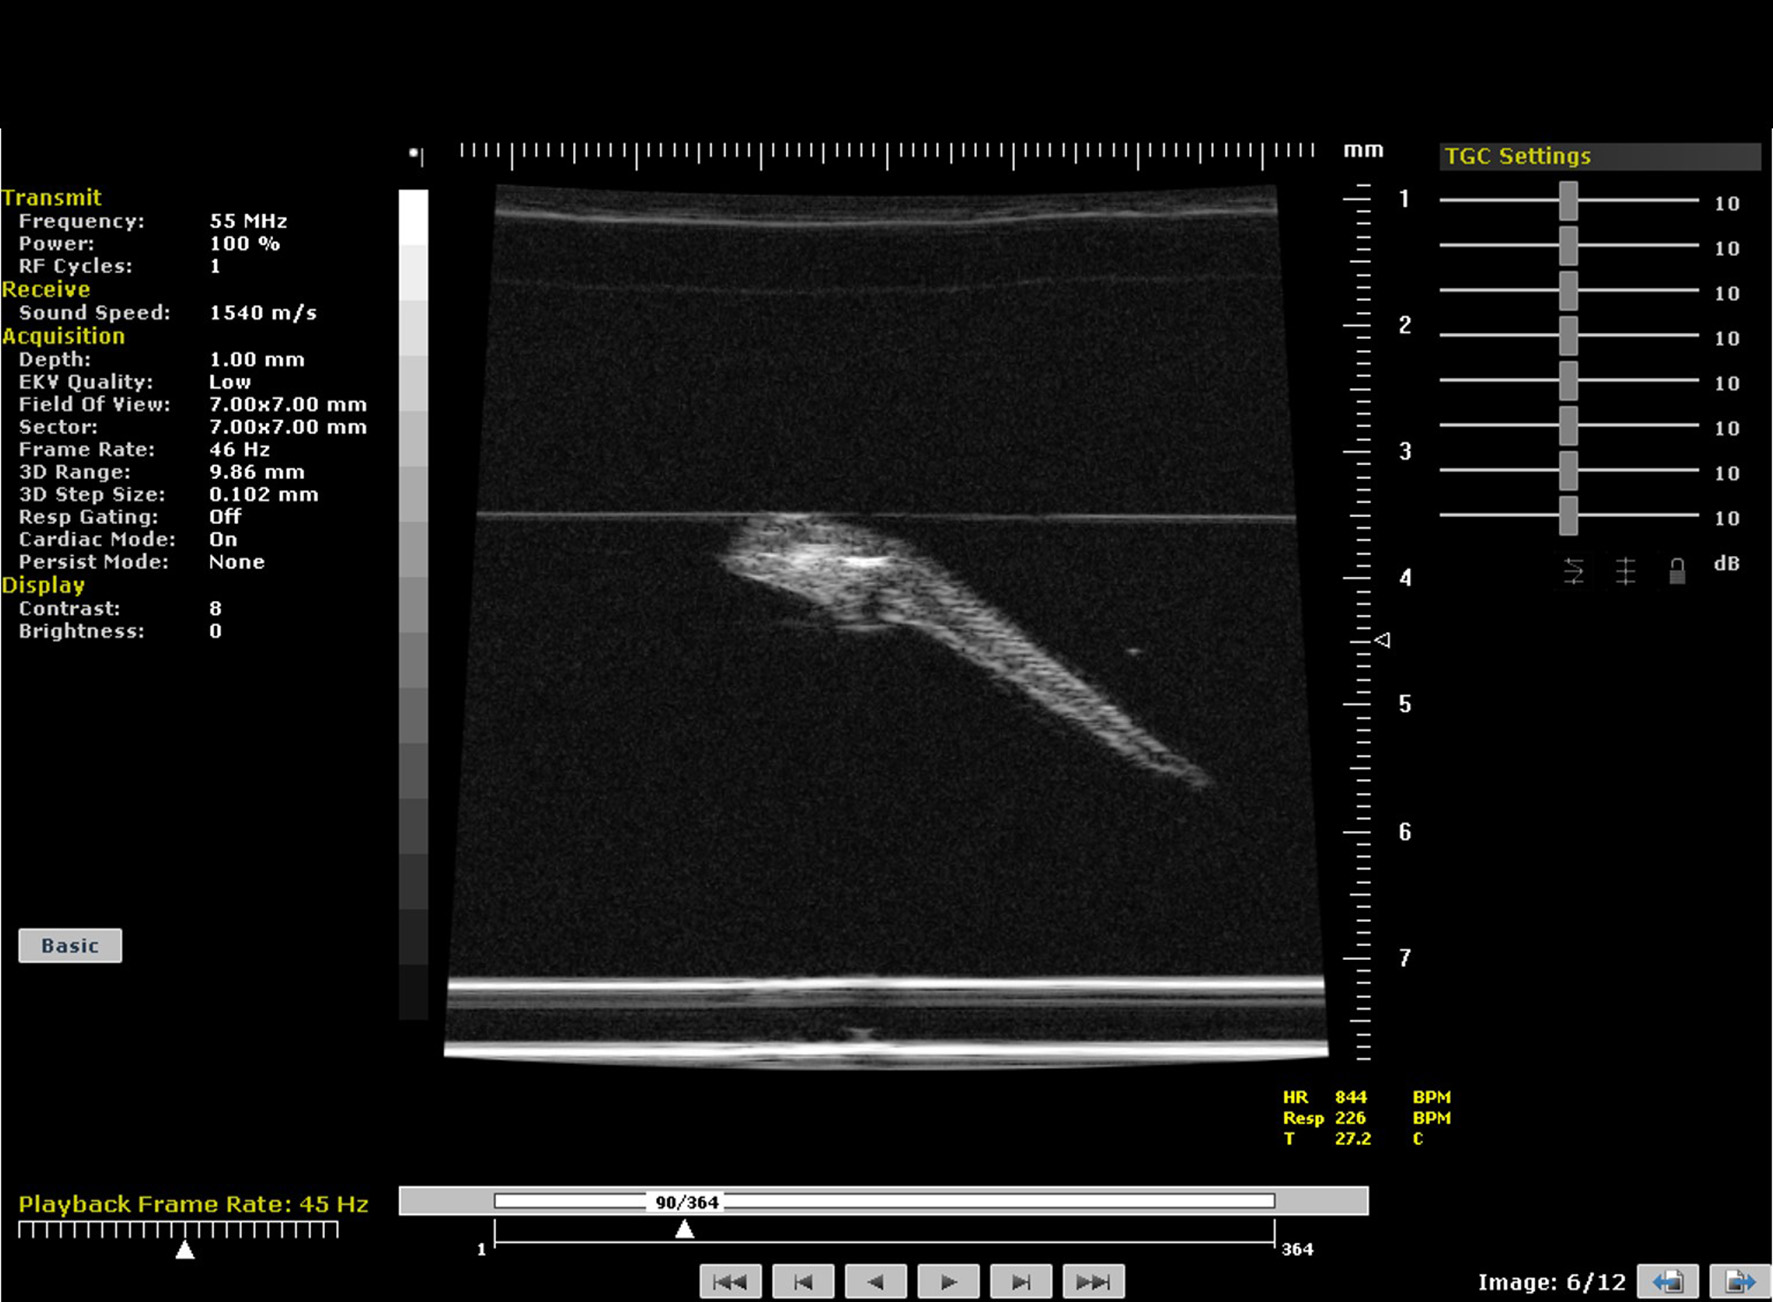
B-mode image of a 5 day-post-fertilization zebrafish embryo suspended in agar. Embryo imaged at 55 MHz.
Preclinical Ultrasound—Kidney Applications
The kidneys in a mouse can either be scanned with the mouse in supine or prone position. The hair can be removed firstly with electric hair clippers and then with depilatory cream. Unless contrast agents are being used, high temporal resolution is not required for imaging the kidneys so multiple focal positions can be selected across the depth of the kidney. Frequencies used tend be between 30 and 40 MHz dependent on the size of the animal. B-mode imaging is used to locate the kidney with the cortex of the kidney tending to have increased backscatter (brighter) compared to the central medulla. Both kidneys can be scanned in the adult rodent. Figure 14 shows an image of a mouse kidney and a duplex image using color Doppler to locate the vessel and direction of flow before placing the spectral Doppler sample volume within the vessel. Renal blood flow can be measured and the renal arterial resistive index calculated (peak systolic velocity—the end diastolic velocity) /peak systolic velocity) and its value indicative of the resistance to blood flow in the vascular bed [19].
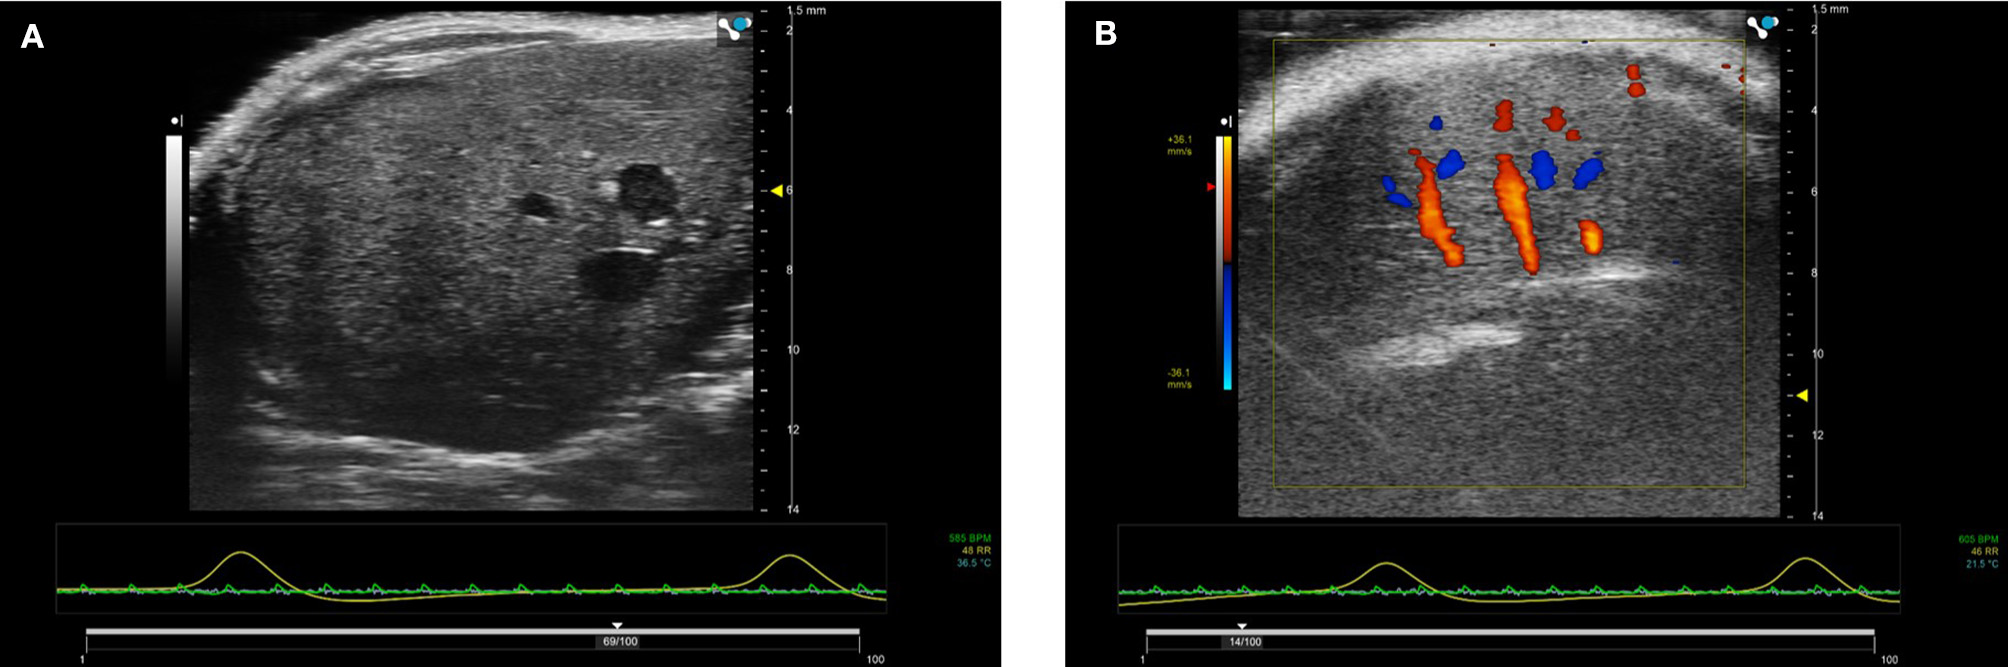
Figure 14
(A) B-mode image of kidney. Note the two focal positions on the image. (B) Duplex image of mouse kidney. In the Duplex image, the sample volume is localized using the color Doppler box as an indicator to show where the vessel lies and direction of blood flow.
Vascularity of the kidney can also be studied using ultrasonic contrast agents. When contrast is being used, the mouse is scanned in the prone position avoiding the potential of imaging artifacts caused by intestinal shadowing which can occur when the kidneys are scanned with the mouse in the supine position. Contrast agents are bolus-injected or infused using a syringe pump via the tail-vein. An injection of 50 μl Micromarker (Bracco Research SpA, Geneva, Switzerland) over a 5 second period of a 1:5 dilution is a typical dosing regimen. For acquisition, baseline images are acquired in contrast-specific imaging mode immediately prior to injection of the contrast agent and are saved either as a separate data-set or a temporal stamp is placed on the contrast image sequence indicating when contrast is injected and images taken prior to this time-stamp are considered baseline images. An alternative approach is to inject the contrast agent, then destroy the contrast agent within the 2D plane using a short, low-frequency high pressure acoustic pulse. The low-pressure contrast-specific imaging sequence is then reinstated, with the initial frames immediately after these high pressure pulses regarded as baseline images with subsequent frames displaying contrast enhancement. After contrast injection a long sequence of 2D images are obtained, the length of sequence can be pre-set by the user. Once the sequence has been saved, either in-house software or contrast-specific software developed by the manufacturers can be used to map the intensity of the backscattered signal within the regions-of-interest (eg medulla, cortex) to study the perfusion-dynamics. Metrics of interest include area-under-the curve, time-to-peak enhancement, wash-in rate and these can be used as indicators of blood volume and vessel density [20]. In many instances if an ischemic-reperfusion-injury (IRI) mouse model is being studied, one kidney can act as a control and both B-mode and contrast-enhancement data can then be acquired from both kidneys.
Preclinical Ultrasound—Liver Applications
The liver is a large organ within the mouse and consists of four lobes. To image the mouse liver, the mouse is again scanned in the supine position using insonating frequencies between 30 and 40 MHz (Figure 15). B-mode ultrasound can be used to image all 4 lobes of the liver while ultrasound enables the portal vein and hepatic artery to be identified and blood velocities measured. Identification and sizing of tumors; staging of non-alcoholic fatty liver disease [21] and determination of fibrosis in the liver can also be achieved at preclinical frequencies. For the assessment of fibrosis in the liver, shear wave imaging techniques can also be used to measure the viscoelastic properties of mouse liver (Figure 8) [22]. For preclinical imaging applications, shear waves are generally generated by a lower frequency 20 MHz radiation pulse and a 40 MHz probe used to measure the shear wave propagation within the liver tissue.
Figure 15
(A) B-mode image of right lobe of normal mouse liver. Imaged using 40 MHz probe. (B) Color Doppler image of liver showing hepatic blood flow within the liver.
Preclinical—Ultrasound: Guided Injections
High-frequency ultrasound can also be used to guide injections into specific areas within the mouse anatomy. For injections into joints, this has recently been shown to have a higher success rate than using traditional anatomic landmarks [23]. Moreover, the less invasive approach of inducing infection within the uterus of a mouse using ultrasound-guided injections of lipopolysaccharide rather than through a mini-laparotomy clearly aligns with the principles of reduction, replacement and refinement which are central considerations for animal research [24]. Injections into fetal brains on externalized embryos, into adult kidneys and pancreas for orthotopic tumor cell injections and into the myocardium can all be undertaken.
Preclinical Ultrasound: Lymph Nodes
Due to their size and location, identification of lymph nodes using high frequency ultrasound can be difficult within the mouse model with many lying deep within the body, encapsulated in fat pads and some, such as the mesenteric lymph node, surrounded by the intestines. However, for cancer models it is important to locate the sentinel lymph node i.e., the node to which the primary tumor drains to first. To this end, both novel contrast agents [25] and novel ultrasound imaging techniques are under development to aid the detection of the location of this node [26].
Preclinical Ultrasound: Cranial
The use of ultrasound to study the development of the embryonic mouse brain in utero is well-established [27, 28] with development of individual embryos tracked throughout gestation. However, the effects of attenuation and resultant aberrations in the ultrasound field caused by the skull in post-natal mice and rats tend to yield poor quality images resulting in the need for either a craniotomy or thinning of the skull to remove or reduce these effects. However in recent years, the use of high frequency transcranial ultrasound to study brain vasculature and cortex activation in non-anaethetised mice enabling longitudinal studies on post-natal brain development has been demonstrated [29]. The techniques utilized ultrafast (>500 Hz) compound Doppler techniques where the backscatter from multiple plane-wave emissions acquired at a range of angles are compounded. These early studies show in exquisite detail the future potential of using ultrasound for neuroscience applications.
Discussion
The real-time nature of ultrasound, its small footprint in the preclinical laboratory and the inexpensive nature of ultrasound imaging compared to MRI and PET/CT, have made it a vital element within the preclinical imaging laboratory. However, the ease of image acquisition using ultrasound by non-specialist researchers has also resulted in a lack of rigor in the reporting of the scanning planes utilized to acquire measurements. This lack of rigor has resulted in a lack of consensus on the “normal” range of physiological values. The effect of heart-rate, temperature, type and depth of anesthesia also influence cardiac measurements and are essential to report in any study [30, 31].
The vast increase in computing power has resulted in reductions in acquisition time of 3D volumes of organs and tumors and 4D acquisitions of the moving heart. Although these extra imaging dimensions will undoubtedly result in more accurate volume measurements it is not yet clear of their potential to provide additional diagnostic information. However, for the non-specialist user of ultrasound acquiring data in 3D enables visualization of structures more easily than from a single 2D imaging plane.
Although widely used within the clinical community, techniques such as strain, strain-rate and shear wave imaging are still gaining traction within the preclinical community. Strain and strain-rate values and the timing of their maximum values within the cardiac cycle may well prove useful as early indicators of myocardial dysfunction similar to that found in clinical studies. The use of shear wave imaging to measure fibrosis in the liver has been developed on one commercial preclinical platform. Certainly, the evidence is encouraging that these techniques can provide useful diagnostic information but more studies are required to validate this for preclinical rodent models and similarly to clinical studies there must be an understanding of the limitations of the technique [4].
Contrast agent development has been ongoing for the last 30 years with initial emphasis on the development of agents to highlight the ultrasound signal from vascular structures. Since contrast-specific imaging techniques rely on generating images based on the non-linear signal scattered from the microbubbles, a transducer of sufficient frequency bandwidth and sensitivity to these signals is required. At the frequencies used in clinical applications this is easily achieved (for a 4 MHz center frequency transducer, second harmonic is at 8 MHz) and transducers used for contrast imaging are usually sensitive up to at least the second harmonic i.e., twice the fundamental transmitted frequency. However, at preclinical frequencies, this is more challenging—in order to capture signals generated at the second harmonic, a much broader bandwidth transducer is required (20 MHz center frequency with second harmonics generated at 40 MHz and sub-harmonics at 10 MHz). Consequently, it tends to be the lower frequency preclinical transducers which have been optimized for contrast-specific imaging and thus, especially in mouse and zebrafish studies, there is an immediate reduction in spatial resolution when undertaking contrast studies. The development of capacitive micromachined ultrasound transducers (CMUTs) may provide a solution for higher resolution contrast microbubble work. CMUTS rely on a change in capacitance for generation of ultrasound rather than piezoelectricity and because they can be micromachined, lightweight 2D arrays are easily manufactured. In addition, they can be operated over a broad bandwidth and hence may be useful in the generation and detection of non-linear signals from contrast agents at higher frequencies necessary for optimal spatial resolution in preclinical animal models.
Super-resolution imaging can be used to generate very high resolution images. Using a sparse distribution of contrast microbubbles whereby single microbubbles are considered as point sources and over multiple ultrafast frame acquisitions composite images can be built up with resolution beyond the diffraction limit of the transmitted ultrasound [32]. Although the images require considerable post-processing, these images are exquisite in the detail. Improved computing power will improve the speed at which these images can be generated.
Although there is only one commercially available contrast agent manufactured for preclinical applications, lipid-encapsulated microbubbles can be made within the lab environment [33]. These microbubbles can be formulated to be used not only as contrast-enhancing agents but also as theranostic agents since targeting ligands can be relatively easily attached to the lipid shells and a drug payload incorporated within or loaded onto the microbubble shells. Although it is known that the drug payload can be released by insonation of the contrast microbubble by a high pressure acoustic pulse the translation of results obtained under highly controlled conditions in vitro have not yet been effectively translated to preclinical and clinical studies [34]. However, the development of mono-disperse microbubbles coupled with increasing access to the drive electronics within commercial preclinical scanners is likely to prompt new imaging sequences specifically tailored to these unique microbubble formulations and provide new and exciting theranostic applications.
Finally the use of artificial intelligence (AI) is an exciting area of research undergoing evaluation in the clinical ultrasound workload pipeline. Within clinical ultrasound imaging, AI is currently being evaluated for automatic feature detection, image optimization and quantification. Within the preclinical ultrasound imaging community, AI is now incorporated in one preclinical ultrasound platform to automatically define boundaries and complete left ventricular functional measurements [35]. Although the results suggested that the quality of ultrasound images acquired was a limiting factor for AI quantification, for the non-specialist preclinical ultrasound user AI is likely to make scanners simpler to use, make image analysis easier and more rapid to implement.
Conclusion
In this review article, a range of applications utilizing preclinical ultrasound imaging techniques have been discussed. However, this list is not exhaustive. The range of preclinical applications for which ultrasound imaging is capable of providing meaningful diagnostic information is likely to rapidly increase over the next decade as these scanners become embedded technology within biology laboratories. The increasing use of AI and the use of contrast microbubble formulations allied with unique driving and detection mechanisms will ensure that preclinical ultrasound remains a versatile and cost-effective tool.
Statements
Author contributions
CM wrote the original manuscript. AT reviewed the manuscript and acquired almost all the images.
Funding
This work was supported by The Wellcome Trust - Grant Number 212923/Z/18/Z.
Conflict of interest
The authors declare that the research was conducted in the absence of any commercial or financial relationships that could be construed as a potential conflict of interest.
References
1.
Foster FS Pavlin CJ Harasiewicz KA Christopher DA Turnbull DH . Advances in ultrasound biomicroscopy. Ultrasound Med Biol. (2000) 26:1–27. 10.1016/S0301-5629(99)00096-4
2.
Polito MV Stoebe S Galasso G De Rosa R Citro R Piscione F et al . Analysis of regional right ventricular function by tissue Doppler imaging in patients with aortic stenosis. J Cardiovasc Echogr. (2019) 29:111–8. 10.4103/jcecho.jcecho_27_19
3.
McDicken WN Thomson A White A Toor I Gray G Moran CM et al . 3D angle-independent Doppler and speckle tracking for the myocardium and blood flow. Echo Res Pract. (2019) 6:105–14. 10.1530/ERP-19-0040
4.
Amzulescu MS de Craene M Langet H Pasquet A Vancraeynest D Pouleur AC et al . Myocardial strain imaging: review of general principles, validation, and sources of discrepancies. European Heart Journal – Cardiovasc Imag. (2019) 20:605–19. 10.1093/ehjci/jez041
5.
Hoskins PR . Principles of ultrasound elastography. Ultrasound. (2012) 20:8–15. 10.1258/ult.2011.011005
6.
Bamber J Cosgrove D Dietrich CF Fromageau J Bojunga J Calliada F et al . EFSUMB guidelines and recommendations on the clinical use of ultrasound elastography. Part 1: Basic principles and technology. Ultraschall Med. (2013) 34:169–84. 10.1055/s-0033-1335205
7.
Demene C Payen T Dizeux A Barrois G Gennisson J-L Bridal L et al . 3-D longitudinal imaging of tumor angiogenesis in mice in vivo using ultrafast Doppler tomography. Ultrasound Med Biol. (2019) 45:1284–96. 10.1016/j.ultrasmedbio.2018.12.010
8.
Lindsey ML Kassiri Z Virag JAI de Castro Bras LE Shcerrer-Crosbie M . Guidelines for measuring cardiac physiology in mice. Am J Physiol Heart Circ Physiol. (2018) 314:H733–52. 10.1152/ajpheart.00339.2017
9.
Nagueh SF Smiseth OA Appleton CP Byrd IIIBF Dokainish H Edvardsen T et al . Recommendations for the evaluation of left ventricular diastolic function by echocardiography: an update from the American Society of Echocardiography and the European Association of Cardiovascular Imaging. J Am Soc Echo. (2016) 29:277–314. 10.1016/j.echo.2016.01.011
10.
Lang RM Badano LP Mor-Avi V Afilalo J Armstrong A Ernande L et al . Recommendations for cardiac chamber quantification by echocardiography in adults: an update from the American Society of Echocardiography and the European Association of Cardiovascular Imaging. J Am Soc Echocardiogr. (2015) 28:1–39. 10.1016/j.echo.2014.10.003
11.
Damen FW Berman AG Soepriatna AH Ellis JM Buttars SD Aasa KL et al . High-frequency 4-Dimensional ultrasound (4DUS): a reliable method for assessing murine cardiac function. Tomography. (2017) 3:180–7. 10.18383/j.tom.2017.00016
12.
Bhan A Sirker A Zhang J Protti A Catibog N Driver W et al . High-frequency speckle tracking echocardiography in the assessment of left ventricular function and remodelling after murine myocardial infarction. Am J Physiol Heart Circ Physiol. (2014) 306:H1371–83. 10.1152/ajpheart.00553.2013
13.
Boyle JJ Soepriatna A Damen F Rowe RA Pless RB Kovacs AGoergen CJ et al . Regularization-free strain mapping in three dimensions, with applications to cardiac ultrasound. J Biomed Eng. (2019) 141:011010–11. 10.1115/1.4041576
14.
Schnelle M Caitbog N Zhang M Nabeebaccus AA Anderson G Richards DA et al . Echocardiographic evaluation of diastolic function in mouse models of heart disease. J Mol Cell Cardiol. (2018) 114:20–8. 10.1016/j.yjmcc.2017.10.006
15.
Castellan RFP Thomson A Moran CM Gray GA . Longitudinal assessment of cardiac structural and functional maturation and regeneration following injury in the neonatal mouse using electrocardiogram-gated high-resolution ultrasound. Ultrasound Med Biol. (2020) 46:167–79. 10.1016/j.ultrasmedbio.2019.09.012
16.
Lieschke GJ Currie PD . Animal models of human disease: zebrafish swim into view. Nat Rev Genet. (2007) 8:353–67. 10.1038/nrg2091
17.
Wang LW Hutter IG Santiago CF Kesteven SH Yi Z-Y Feneley MP et al . Standardized echocardiographic assessment of cardiac function in normal adult zebrafish and heart disease models. Dis Model Mech. (2017) 10:63–76. 10.1242/dmm.026989
18.
Gierten J Pylatiuk C Hammouda O Schock C Stegmaier J Wittbrodt J et al . Automated high-throughput heartbeat quantification in medaka and zebrafish embryos under physiological conditions. Sci Rep. (2020) 10:2046. 10.1038/s41598-020-58563-w
19.
Abe M Akaishi T Miki T Miki M Funamizu Y Araya K et al . Influence of renal function and demographic data on intrarenal Doppler ultrasonography. PLoS ONE. (2019) 14:e0221244. 10.1371/journal.pone.0221244
20.
Liang S Gao Y Liu Y Qiu C Chen Y Zhu S . Contrast-enhanced ultrasound in evaluating of angiogenesis and tumour staging of nasophyryngeal carcinoma in nude mice. PLoS ONE. (2019) 14:e0221638. 10.1371/journal.pone.0221638
21.
Fernandez-Dominguez I Echevarria-Uraga JJ Gomez N Luka Z Wager C Lu SC et al . High-frequency ultrasound imaging for longitudinal evaluation of non-alcoholic fatty liver progression in mice. Ultrasound Med Biol. (2011) 37:1161–9. 10.1016/j.ultrasmedbio.2011.04.012
22.
Yeh C-Y Chen B-R Kuo P-L Li P-C . In vivo measurement of liver elasticity on mice using a single element preclinical ultrasound system. IEEE Trans Ultrason Ferroelectr Freq Control. (2015) 62:1295–307. 10.1109/TUFFC.2014.006953
23.
Ruiz A Bravo D Duarte A Adler RS Raya JG . Accuracy of ultrasound-guided versus landmark-guided intra-articular injection for rat knee joints. Ultrasound Med Biol. (2019) 45:2787–96. 10.1016/j.ultrasmedbio.2019.06.403
24.
Rinaldi SF Makieva S Frew L Wade J Thomson A Moran CM et al . Ultrasound-guided intrauterine injection of lipopolysaccharide as a novel model of preterm birth in the mouse. AM J Pathol. (2015) 185:1201–6. 10.1016/j.ajpath.2015.01.009
25.
Yoon H Yarmoska SK Hannah AS Yoon C Hallam KA Emelianov SY . Contrast-enhanced ultrasound imaging in vivo with laser-activated nanodroplets. Med Phys. (2017) 44:3444–9. 10.1002/mp.12269
26.
Evertsson M Kjellmann P Cinthio M Andersson R Tran TA Zandt R et al . Combined magnetomotive ultrasound, PET/CT, and MR imaging of 68Ga-labelled superparamagnetic iron oxide nanoparticles in rat sentinel lymph nodes. Sci Rep. (2017) 7:4824. 10.1038/s41598-017-04396-z
27.
Aristizabal O Mamou J Ketterling JA Turnbull DH . High-throughput, high-frequency 3-D ultrasound for in utero analysis of embryonic mouse brain development. Ultrasound Med Biol. (2013) 39:2321–32. 10.1016/j.ultrasmedbio.2013.06.015
28.
Autuori MC Pai YJ Stuckey DJ Savery D Marconi AM Massa V et al . Use of high-frequency ultrasound to study the prenatal development of cranial neural tube defects and hydrocephalus in Gldc-deficient mice. Prenat Diagno. (2017) 37:273–81. 10.1002/pd.5004
29.
Tiran E Ferrier J Deffieux T Gennisson JL Pezet S Lenkei Z et al . Transcranial functional ultrasound imaging in freely moving awake mice and anesthetized young rats without contrast agent. Ultrasound Med Biol. (2017) 43:1679–89. 10.1016/j.ultrasmedbio.2017.03.011
30.
Stout D Berr SS LeBlanc A Kalen JD Osbourne D Price J et al . Guidance for methods descriptions used in preclinical imaging papers. Mol Imag. (2013) 12:1–15. 10.2310/7290.2013.00055
31.
Pachon RE Scharf BA Vatner DE Vatner SF . Best anesthetics for assessing left ventricular systolic function by echocardiography in mice. Am J Physiol. (2015) 308:H1525–9. 10.1152/ajpheart.00890.2014
32.
Errico C Pierre J Pezet S Desailly Y Lenkei Z Couture O et al . Ultrafast ultrasound localization microscopy for deep super-resolution vascular imaging. Nature. (2015) 527:499–502. 10.1038/nature16066
33.
Owen J Kamila S Shrivastava S Carugo D de la Serna JB Mannaris C et al . The role of PEG-40-sterate in the production, morphology and stability of microbubbles. Langmuir. (2019) 35:10014–24. 10.1021/acs.langmuir.8b02516
34.
Roovers S Segers T Lajoinie G Deprez J Versluis M de Smedt SC et al . The role of ultrasound-driven microbubble dynamics in drug delivery: from microbubble fundaments to clinical translation. Langmuir. (2019) 35:10173–91. 10.1021/acs.langmuir.8b03779
35.
Grune J Ritter D Kraker K Pappritz K Beyhoff N Schutte T et al . Accurate assessment of LV function using the first automated 2D-border detection algorithm for small animals -evaluation and application to models of LV dysfunction. Cardiovasc Ultrasound. (2019) 17:7. 10.1186/s12947-019-0156-0
Summary
Keywords
ultrasound, preclinical, mouse model, rat model, zebrafish
Citation
Moran CM and Thomson AJW (2020) Preclinical Ultrasound Imaging—A Review of Techniques and Imaging Applications. Front. Phys. 8:124. doi: 10.3389/fphy.2020.00124
Received
29 November 2019
Accepted
30 March 2020
Published
05 May 2020
Volume
8 - 2020
Edited by
Andreas Hess, University of Erlangen Nuremberg, Germany
Reviewed by
David B. Stout, Independent Researcher, Culver City, United States; Boran Han, Harvard University, United States
Updates
Copyright
© 2020 Moran and Thomson.
This is an open-access article distributed under the terms of the Creative Commons Attribution License (CC BY). The use, distribution or reproduction in other forums is permitted, provided the original author(s) and the copyright owner(s) are credited and that the original publication in this journal is cited, in accordance with accepted academic practice. No use, distribution or reproduction is permitted which does not comply with these terms.
*Correspondence: Carmel M. Moran carmel.moran@ed.ac.uk
This article was submitted to Medical Physics and Imaging, a section of the journal Frontiers in Physics
Disclaimer
All claims expressed in this article are solely those of the authors and do not necessarily represent those of their affiliated organizations, or those of the publisher, the editors and the reviewers. Any product that may be evaluated in this article or claim that may be made by its manufacturer is not guaranteed or endorsed by the publisher.